
Abstract
The consequences of climate change and land subsidence are often related to sea level rise/fall. Mangrove extinction and migration were assessed through palynological studies in two sedimentary cores in order to address climate, Relative Sea level (RSL) and its relation to geomorphology since 8420 cal. yr BP from Kanuru (500 cm deep) and since 5850 cal. yr BP from Machilipatnam (118 cm deep), Krishna delta, India. Four units/nine phases of sediment depositional environment were identified on the basis of marine/terrestrial palynomorphs. In Unit 1, the marine palynomorphs indicate palaeoshoreline in Kanuru from 8420 to 8300 cal. yr BP which is now ~4–5 km from the present-day shoreline, but after a short span a retreat in sea level took place between 8300 and 7040 cal. yr BP. About three to four short-term intermittent rise/fall in RSL were recorded in Unit 2 between 7040 and 3980 cal. yr BP in Kanuru and between 5225 and 3240 cal. yr BP in Machilipatnam. During this period, the diversity of mangroves was more in Machilipatnam and only salt-tolerant mangroves were present in Kanuru. Unit 3 is characterized by non-estuarine sediment deposition since 3920–240 cal. yr BP in Kanuru and since 3240–950 cal. yr BP in Machilipatnam. Unit 4 shows a rise in RSL in both the studied sites which began much earlier in Machilipatnam than in Kanuru. Loss of mangrove diversity and dominance of salt-tolerant mangroves were recorded in Unit 4. Results indicate climate-induced RSL fluctuations highlighting the cooling event of 8.2 ka BP from Kanuru site and duration of intermittent rise/fall of RSL during middle Holocene transgression. The rate of sea level rise during the period was not continuous but interrupted by three to four retreats. At present, the evidence of these are at different depths in both the sites and in other contemporary sites along the east coast of India, suggesting neo-tectonics in the vertical stack of Holocene sediment. The geomorphology of the studied sector is tectonically controlled which may increase deltaic instability in future.
Introduction
A complex interplay of riverine and marine processes has shaped the Krishna River delta in space and time. In India, the coastal wetlands sustain millions of people and are more vulnerable to the effects of rise in Relative Sea level (RSL) and changes in marine ecosystems. The sediment depositional environments in Krishna River delta vary from fluvial, fluvio-marine to purely marine depending upon the geomorphology and distance from the shoreline. The deltaic dynamism is largely influenced by monsoon-driven active channels, tectonic nature of the basin, sea level changes, relief of the drainage basin and climate. The temporal or spatial change in these deltaic variables brings about profound alterations in the geomorphology either through erosion or accretion processes.
The analysis of delta building process through time and the dynamics of the coastal wetlands are essential to predict the future changes especially in the context of sea level rise and coastal erosion. Land subsidence in modern coastal or deltaic plains is a common process. Areas prone to subsidence activity are quite susceptible to sea invasion (Mazzotti et al., 2009), particularly in the event of RSL rise due to global warming. Sea water invasion and loss of deltaic land have been reported in Krishna–Godavari (K-G) delta (Nageswara Rao et al., 2013), Ganges–Brahmaputra delta and in Bangladesh (Allison et al., 2003) and elsewhere out of India from Po delta Italy (Cencini, 1998), the Nile delta (Stanley and Warne, 1998), Mississippi delta in the United States, the Yangtze delta, China (Chen and Stanley, 1993; Stanley and Chen, 1993) and the Rhine–Meuse delta in Netherlands (Cohen et al., 2002). Sporadic studies from the east coast of India are inadequate to infer Holocene sea level changes. Previous records of sea level during middle Holocene are estimated to be +5 m around 6 ka (Nageswara Rao and Sadakata, 1993) and +3.0 m around 7.3 ka (Banerjee, 2000), +4 m in Sulurpet around 6 ka (North-west of Pulicat lagoon) in Andhra Pradesh (Farooqui and Vaz, 2000) and −2 m around 5.6 ka in Annamalainagar (west of Pichavaram estuary) in Tamil Nadu (Farooqui, 2008). In other words, the record of intertidal/estuarine deposition on land that took place ~5–7 ka is now present at different depths suggesting upliftment/subsidence in the vertical stack of sediment deposited during Holocene. The presence/absence of mangroves and its associate pollen plays an important role in the identification of coastal ecosystem induced by even the slightest rise in sea water ingression due to changes in the climate or tectonics in the area. Therefore, more data are required to understand the Holocene sea level changes and the sectors of subsidence along the east coast of India in order to highlight the vulnerable areas that may be severely affected by the predicted climate change.
Climate and geomorphology of study site
The climate is tropical with hot summers and moderate winters marked by pre-monsoon (February–May), monsoon (June to September) and post-monsoon (October–January). The average annual rainfall is ~100 cm and temperature is 28°C. All along the east coast of India, wave activity is generally prominent during the north-east monsoon. It forms a lobate-shaped delta in the mesotidal setting (Davis, 1928) with its apex in Vijaywada. The deltaic area has three main distributaries and covers an area of ~4600 km2 (Figure 1). Extensive back-mangrove forest, mainly Avicennia and Suaeda spp., was observed in the studied area along the several broad and narrow back water channels (Figure 2). The marshy landward side is recharged during rainy season and dries out completely between April and June. The dug wells, bore wells and hand pumps are the major drinking water source in the entire Krishna delta (Mondal et al., 2008). The shallow watershed and topography, coupled with history of rainfall and evaporation, determine runoff and groundwater discharge in the area. The coastal strip covering Machilipatnam and Kanuru in the north-east part of Krishna River delta and Ongole in the south-east part is most vulnerable to high surges of about 5 m high. Low reliability of the monsoon rainfall, unscientific agricultural practices and intrusion of saline sea water in coastal strips have adversely affected the Indian coastline (Planning Commission Report, 1981). The wetlands here experience seasonal shifts: for example, mixed to a stratified during the summer months when wave action decreases, or winter storms mix a stratified coastal wetland with increased wave action.
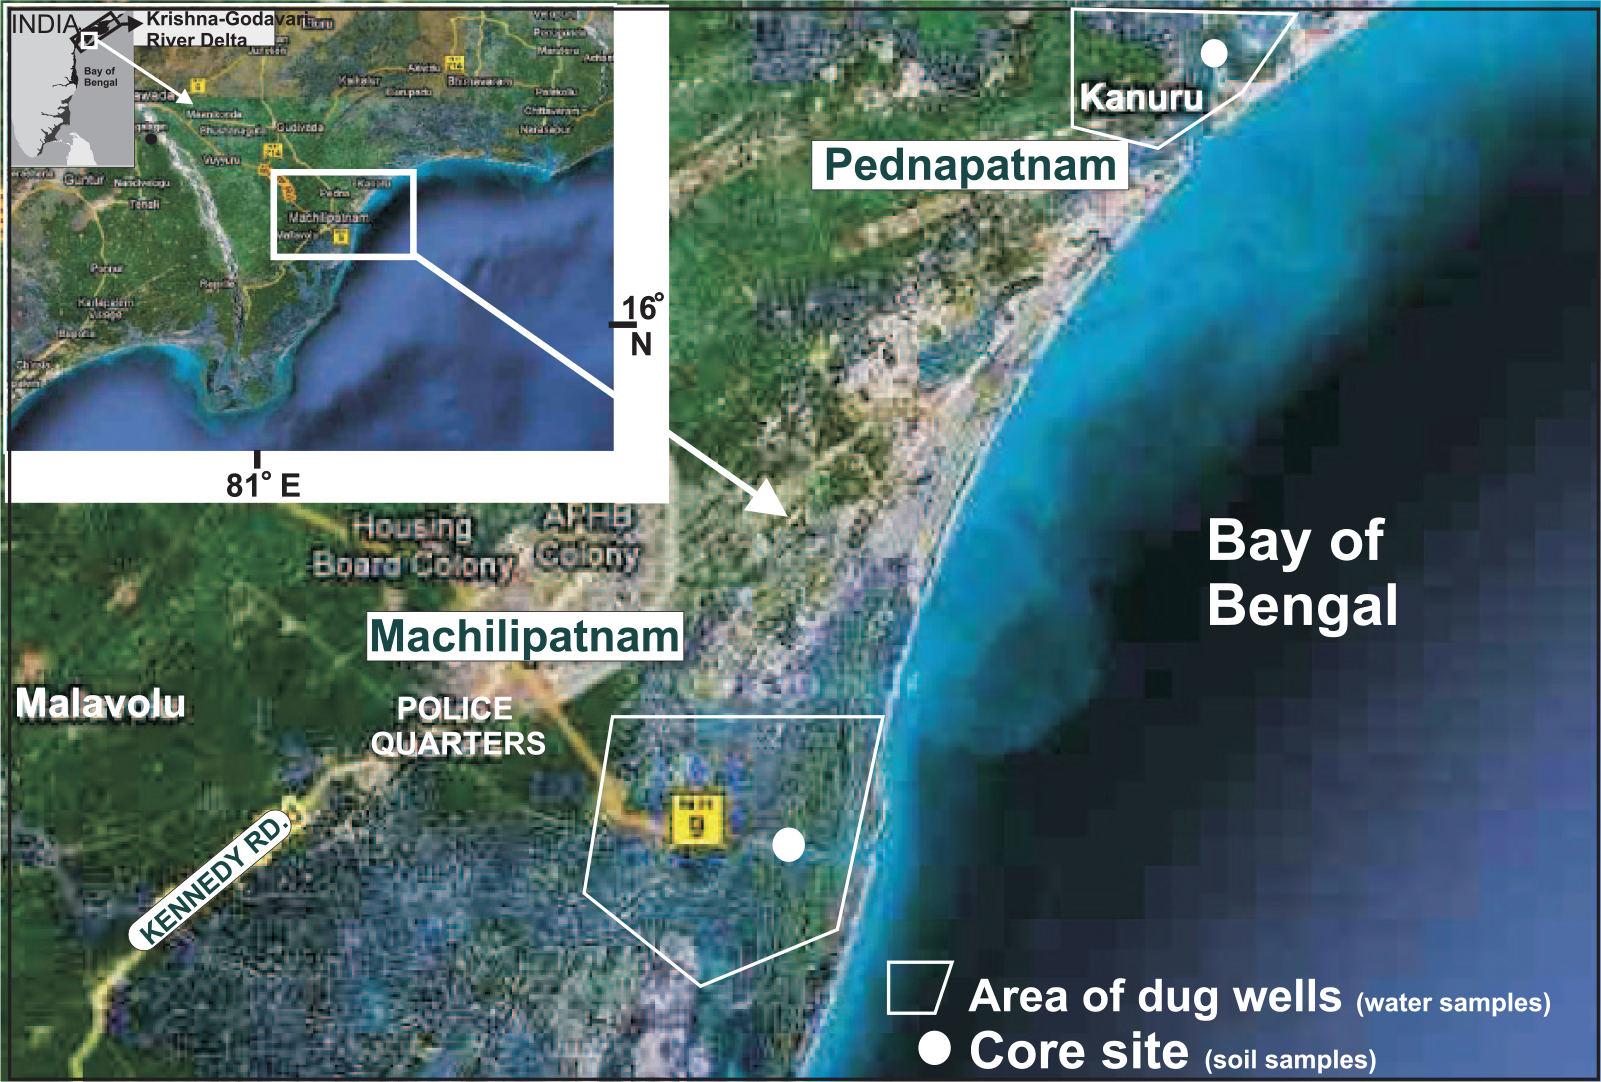
Location map showing sediment core sites (Kanuru and Machilipatnam) and the area for freshwater dug wells.
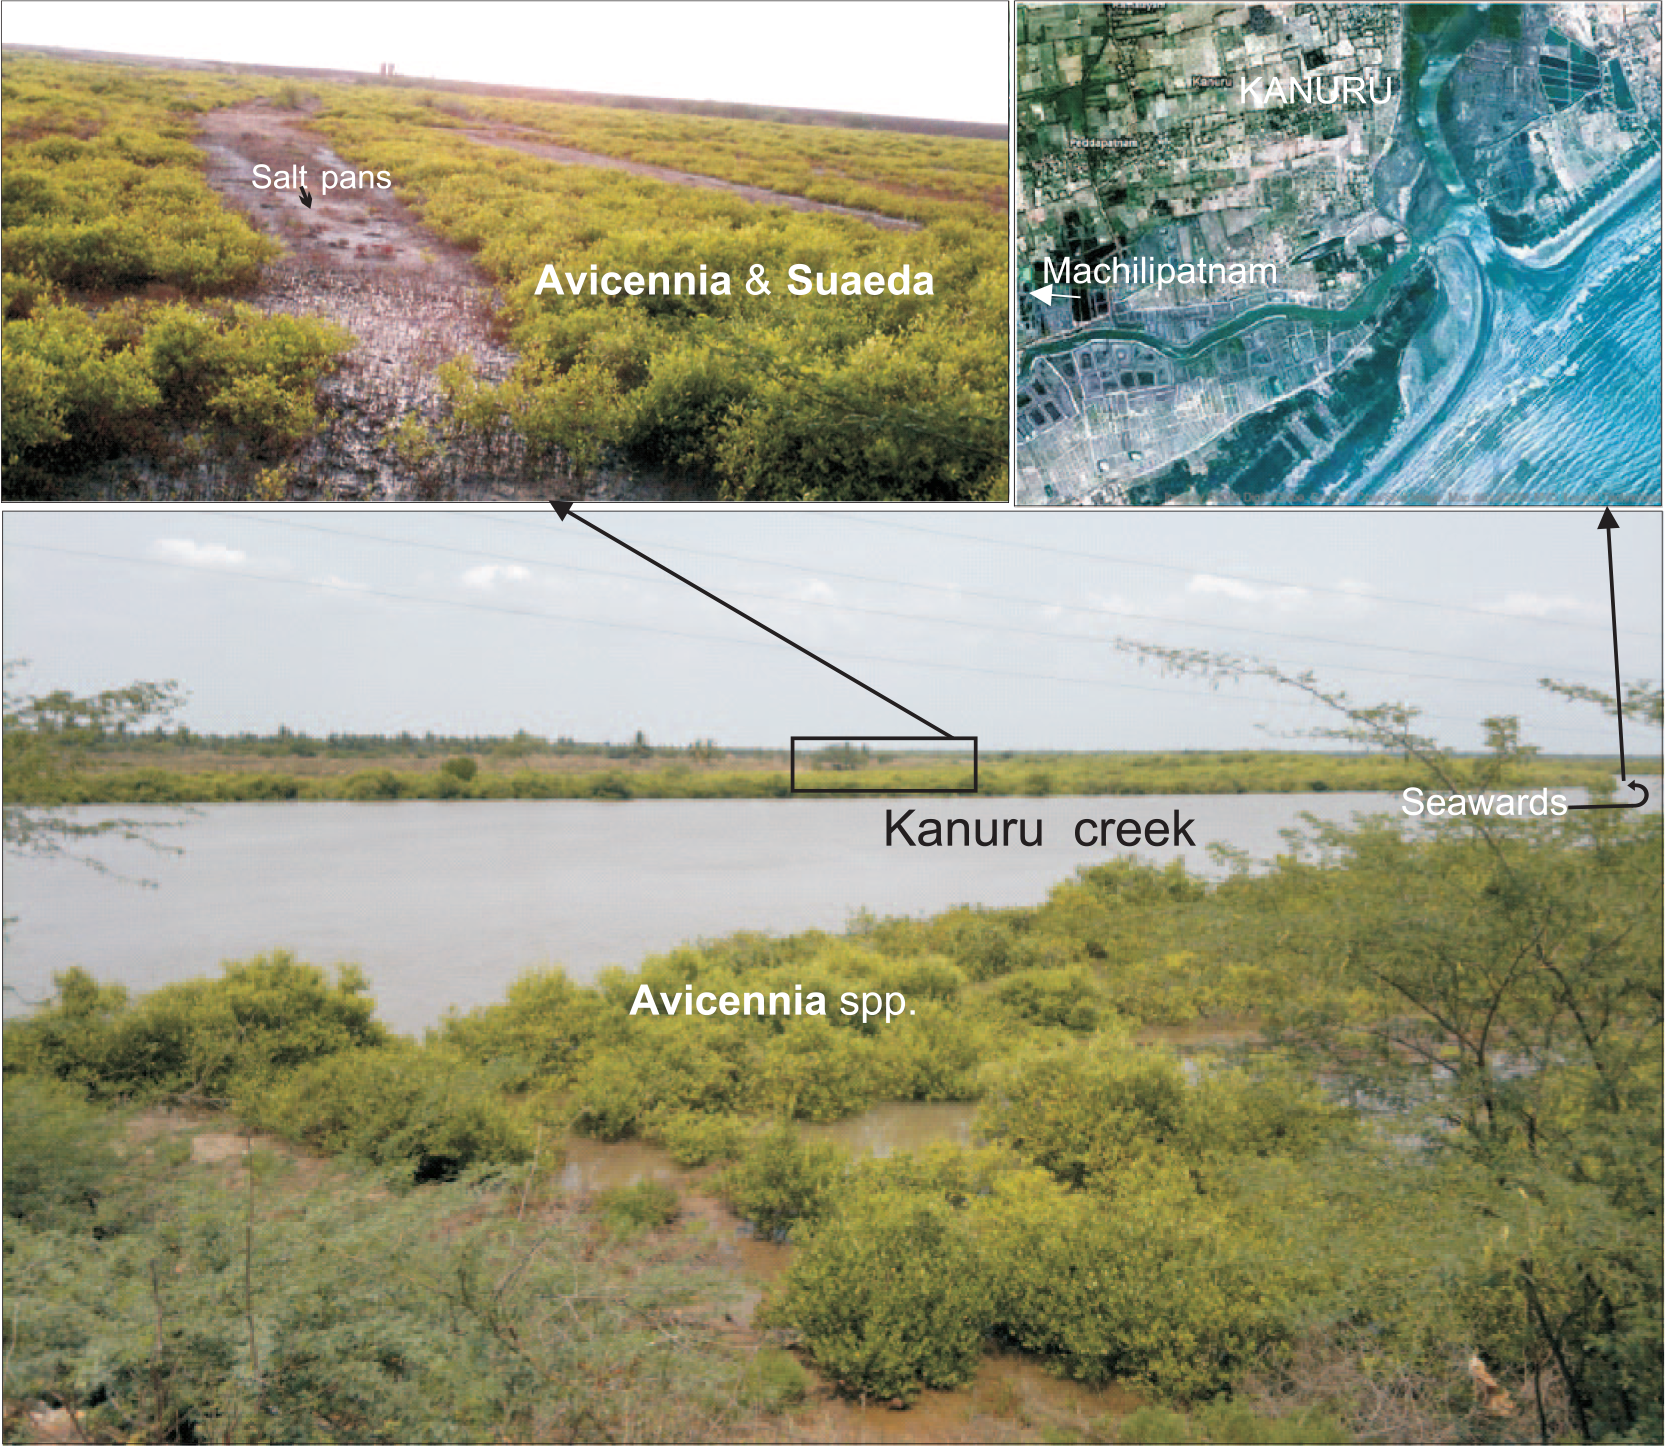
Present-day mangrove cover (Avicennia and Suaeda species of the same height) in Kanuru and Machilipatnam.
Apparently, progradation of K-G delta is mainly by the growth of elongated spits and barriers and infilling of the lagoons. Mangroves colonize the emerging lagoon floors and in turn promote further deposition. The evidence of Holocene palaeoshorelines recorded around the margin of the continents is highly variable because of tectonic movement of land and isostatic adjustments (Singh and Swamy, 2006). Therefore, the sea level changes recorded in any studied area along the coastal margin on land reveal the sea level rise and fall relative to morphology of the land and fluvial configurations and hence termed here as ‘Relative Sea level’. Both the studied sites Machilipatnam and Kanuru are located in the extreme northern lateral extension of Krishna delta merging into inter-deltaic (K-G) land. Kaikaluru sand ridges and swales are present in between the two deltas (K-G) where the Kolleru lake (Ramsar site) is situated beyond this towards land. The present-day active estuary/lagoon is Goguleru creek (Figure 3) which fringes the present-day shoreline in the inter-delta zone. Towards the south is another mangrove zone in Kanuru (near Pednapatnam) fringing the back water channels from the present shoreline, from where the core sediment was retrieved.
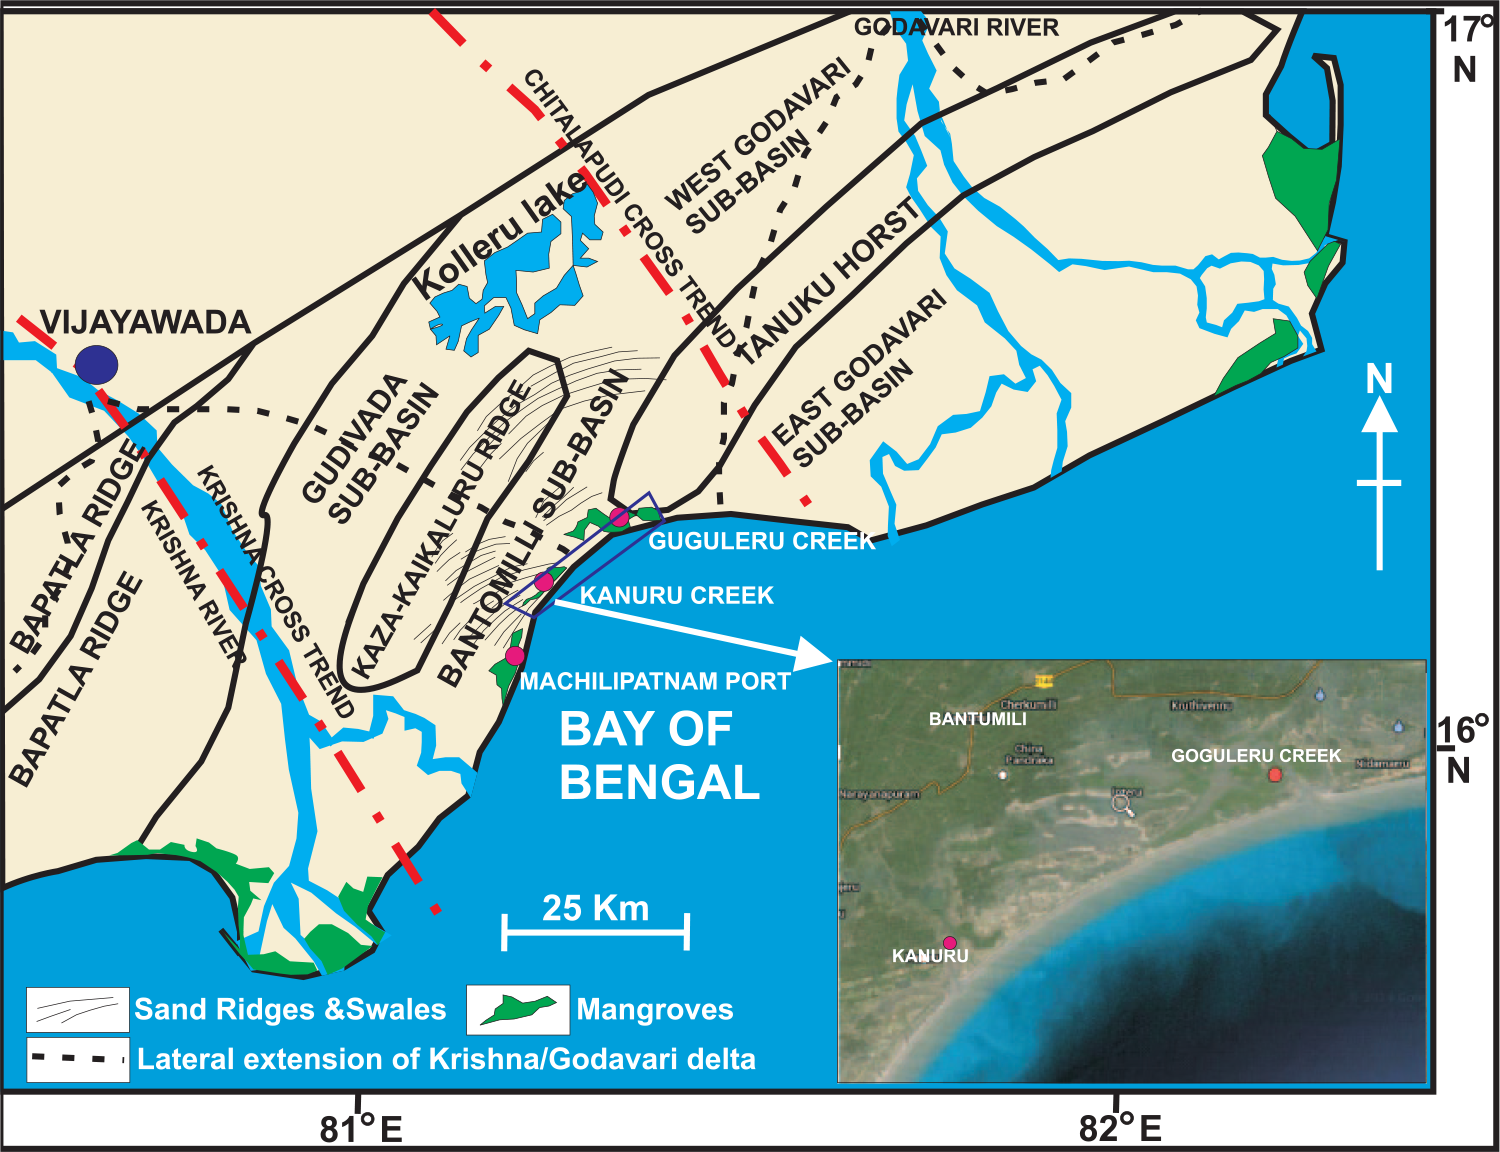
Geomorphology of Krishna–Godavari River delta and the study area.
A number of attempts were made earlier in order to understand the growth pattern of the twin delta (K-G) in the past (Banerjee, 2000; Nageswara Rao et al., 2005; Sambasiva Rao and Vaidyanadhan, 1979). The entire K-G delta appears to be a single depositional unit. However, the twin delta system is separated by inter-delta plain which is characterized mainly by Kolleru lake, Goguleru estuary and Kanuru creek partially. The inter-delta plain exhibits features like beach ridges, mudflats, mangroves, lagoon and sand spits indicating marine influence. Thus, at present the lower part of the delta is mostly built by marine processes. The Holocene strandlines have been marked on the basis of sediment characteristics, but records of biotic forms are scanty. Subsequent fluvial deposits overlapping the strand plain indicate that the rivers shifted their distributary courses in the past before merging into the sea as the delta prograded. At number of places the beach ridges are oriented oblique to the present shoreline (Nageswara Rao et al., 2005). These features appear on the north-east of Nizamapatnam in the western part of Krishna delta and to the south of Vilasa in the central part of Godavari delta. The orientation of sandy beach ridges (Figure 3) shows a major configurational change in the past coastline because of either changes in the direction of distributaries or sea level changes that commonly associate with the growth of delta. The inferences drawn by the study of bathymetry and magnetic anomalies (Subrahmanyam et al., 2010) show two parallel faults in the continental margin off the K-G delta and suggest that the concavity of the inter-delta shoreline is due to tectonic control. These two faults are the extensions of Chintalapudi and Krishna Cross trend faults of the basement rock. The present-day Goguleru lagoon shows ‘back waters’ in the low-lying swales between the sandy beach ridges (Nageswara Rao et al., 2010). Similar situation is now observed in Kanuru creek. The low-lying swales are inundated by back waters that show luxuriant growth of salt-tolerant Avicennia and Suaeda in the entire area of same height (Figure 2).
Materials and methods
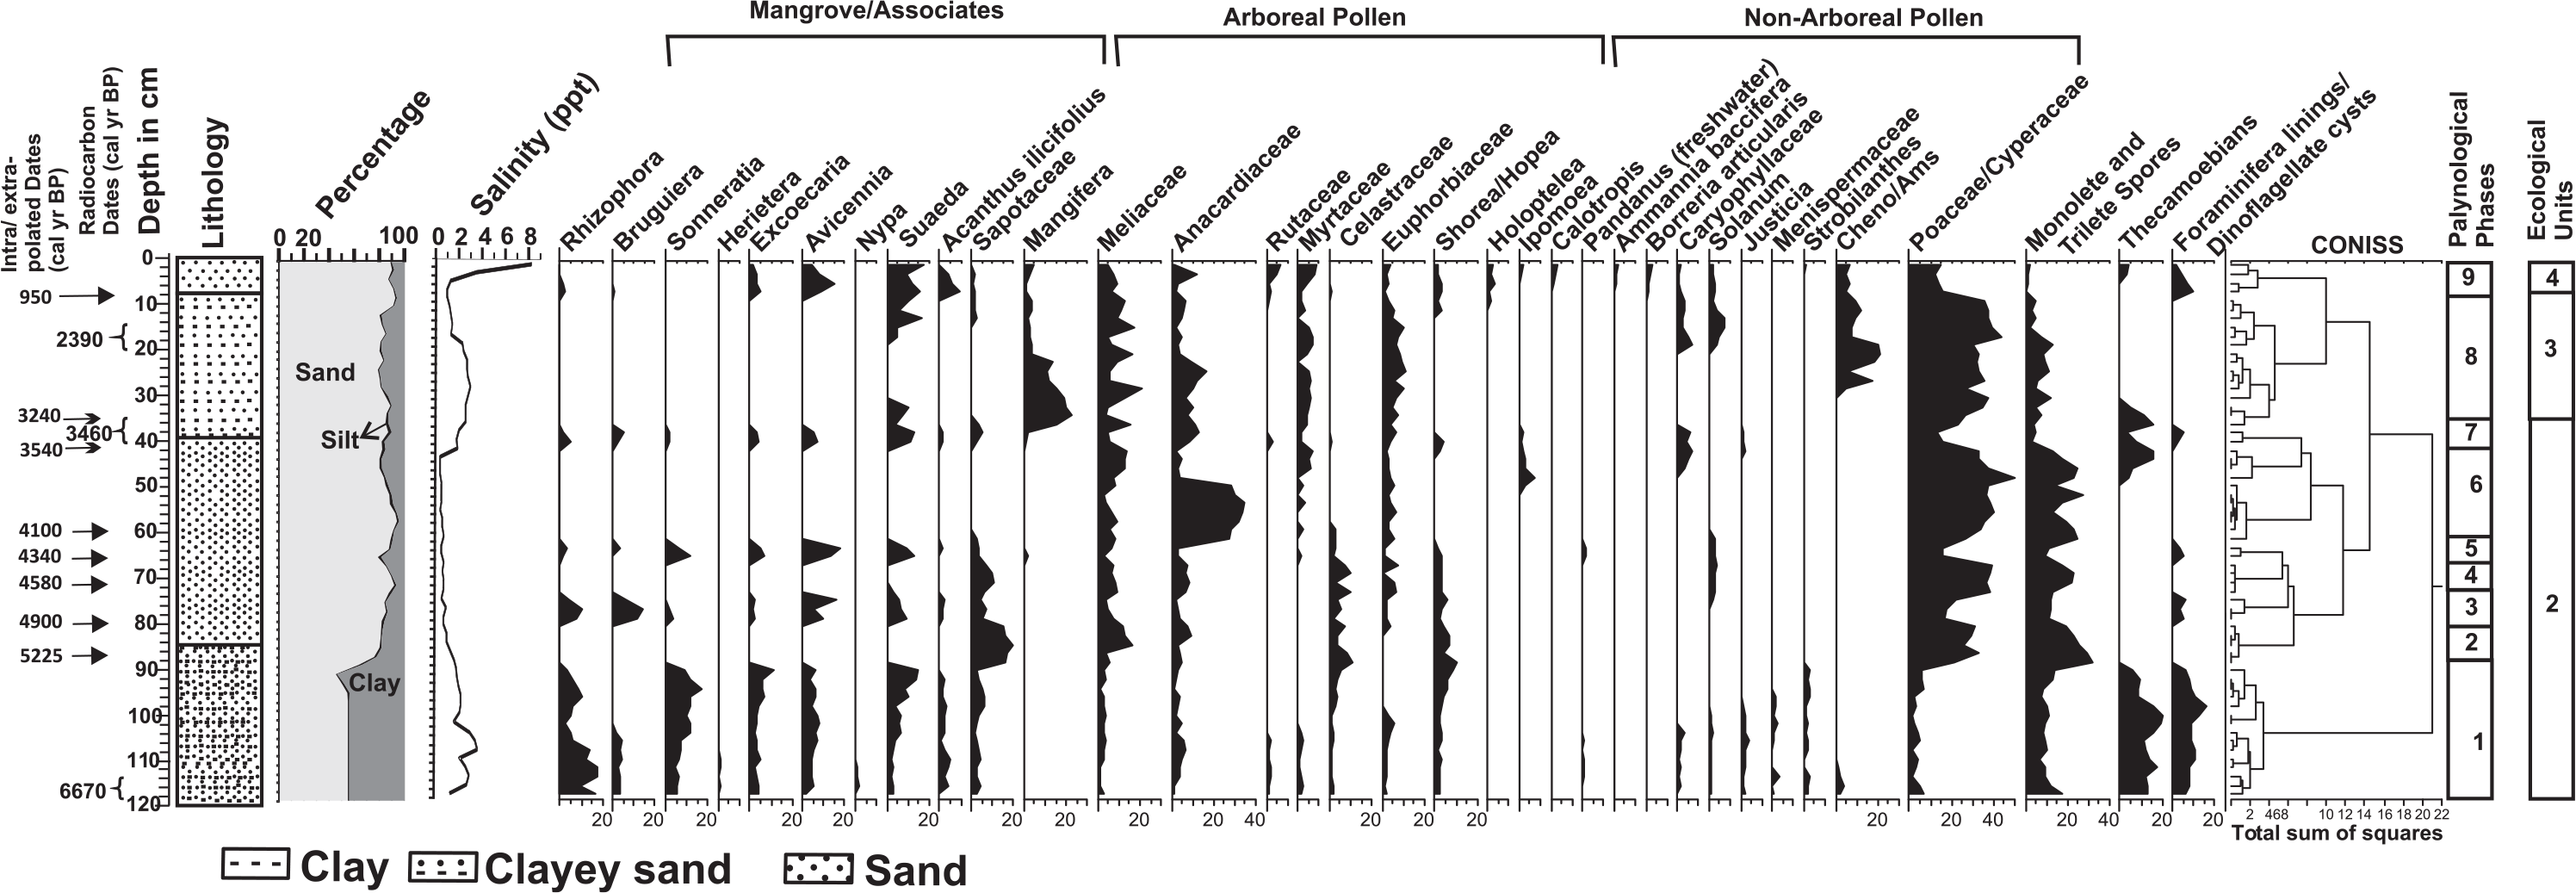
Random collection of water samples from dug wells in the near vicinity of core site in Kanuru (eight samples) and Machilipatnam (six samples) (Figure 1) was analysed for salinity, pH, conductivity and total dissolved solids (TDS) to assess the degree of groundwater contamination influenced by sea water ingression. The salinity, conductivity and TDS were also measured in aqueous soil solution of core sediment from both the sites. For this, 10 g of air dried soil sample was dissolved in 100 mL of deionized water and kept overnight after rigorous shaking for 1 h. Samples were homogenized for 30 min prior to salinity measurement using ‘Orion-5 Star’ (Thermo-Orion, Scientific Equipment, US) at standardized 20°C. Using Piston corer (Eijkelkamp, The Netherlands), 118-cm-deep (61 sub-samples at 2-cm interval) and 500-cm-deep (77 sub-samples at 6.5-cm interval) sedimentary soil profiles were collected from Machilipatnam (latitude: 16.1612285; longitude: 81.1457256) and Kanuru (latitude: 16.286206; longitude: 81.254394), respectively, from the north-eastern part of Krishna River delta. The core retrieval carried out from both the sites was from the mangrove zone where the sea water ingressed during high tides. The area was infested by Avicennia and Suaeda. The sediment samples were processed for retrieving palynomorphs (250–300 counts were done) following standard method (Erdtman, 1943). The quantitative analysis of freshwater thecamoebians, marine foraminifera linings and dinoflagellate cysts was also recorded in palynological slides in order to assess the relative magnitude of freshwater and marine input in the studied sediment core. Sediment texture was analysed on the basis of percentage of sand, silt and clay following soil density method (US Department of Agriculture (USDA), 1992). The chronology (radiocarbon age; 14C) allowed us to assess the magnitude and duration of RSL changes. The radiocarbon age in years Before Present (BP) of the organic carbon in the sediment was carried out at radiocarbon laboratory of Birbal Sahni Institute of Palaeobotany (BSIP), Lucknow. The sediment was manually cleaned, sieved and subjected to hydrochloric acid to remove carbonate component if any. After repeated rinsing for pH stabilization, the sediment dried at 95°C was combusted in the continuous flow of oxygen. The resulting carbon dioxide was collected and converted to acetylene and then benzene using standard catalyst and procedures. The counting was carried out in a Liquid Scintillation Counter (Quantulus 1220). Only five sediment samples from Kanuru and three samples from Machilipatnam that were rich in organic carbon have been radiocarbon (14C) dated. Calibrated ages (cal. yr BP) are weighted average of 2σ ranges using IntCal13.14c data set (Reimer et al., 2013; Stuiver et al., 1998) and have been given in results. The intra/extrapolated ages (Figures 4 and 5) have been calculated using sediment depth versus radiocarbon calibrated ages. The net rate of sedimentation was calculated with depth versus calibrated ages as the lithology varied generally between clay and sandy clay (Figure 6). The quantitative and qualitative analysis of marine versus terrestrial palynomorphs was focused upon assessing its equilibrium with the climate/sea level changes along the coast in the past. The ratio of marine palynomorphs (mangrove/associate pollen, dinoflagellate cysts, foraminifera lining) versus terrestrial palynomorphs (TP) (Arboreal pollen (AP), Non-Arboreal pollen (NAP), Pteridophytic spores, freshwater algae, freshwater thecamoebians) provides an indication of RSL fluctuations. The total count (250–300) includes both marine and terrestrial palynomorphs. The data were analysed in Tilia software Program (Grimm, 1987) and cluster analysis was done which allowed us to infer the palynological phases (Figures 4 and 5). About eight ecological groups such as Mangroves and Associates, AP, NAP, all herbs/shrubs, Ubiquitous taxa (Poaceae/Cyperaceae), Freshwater algae, Pteridophytic monolete and trilete spores, thecamoebians and foraminifera linings/dinoflagellate cysts were made and the percentages given in results have been calculated against the TP.
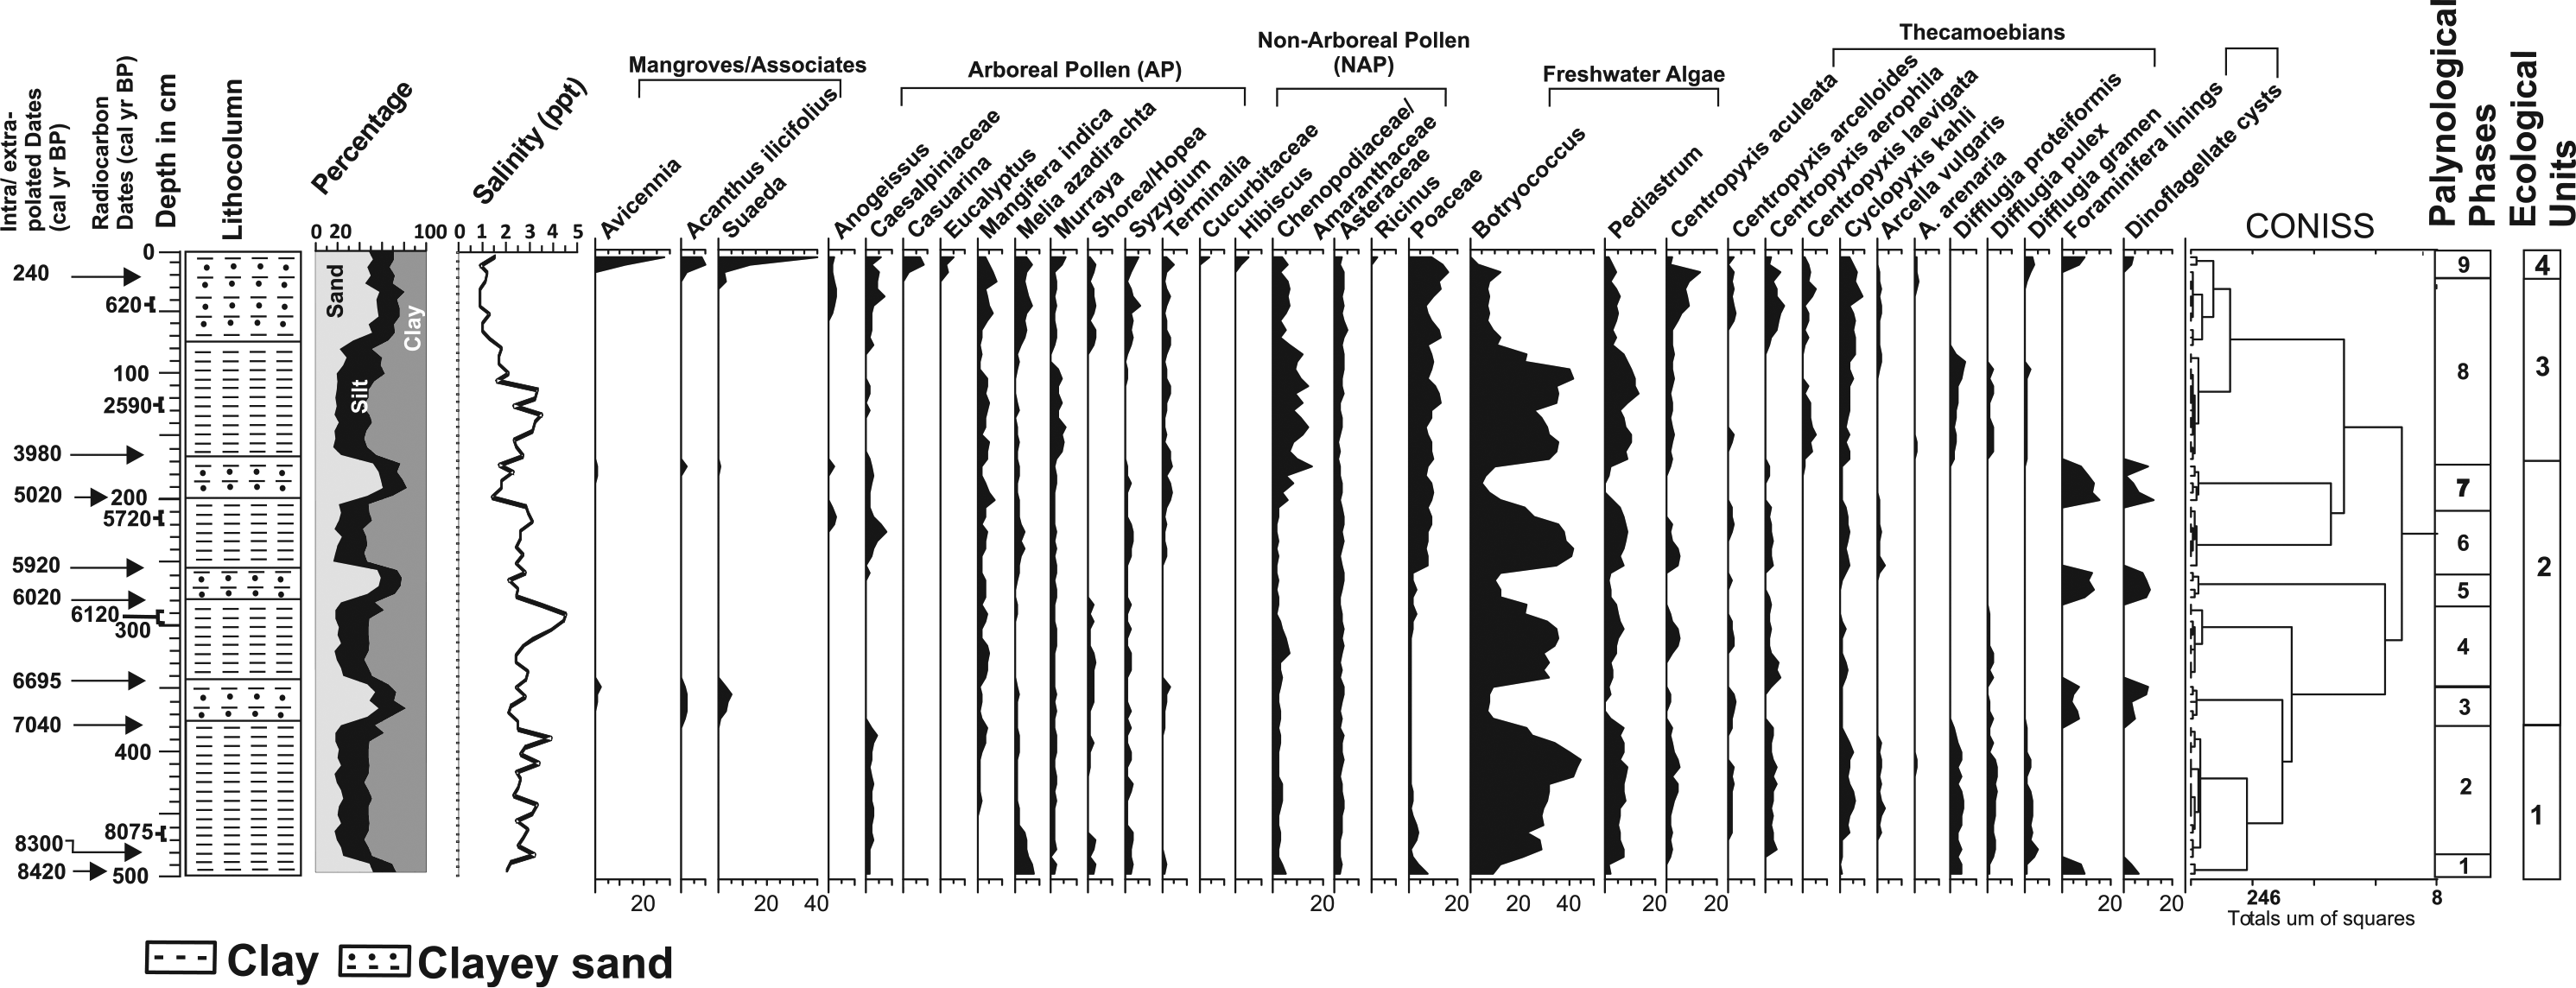
The spectrum of palynomorphs, lithology, salinity and chronology in sediment core from Kanuru.
The spectrum of palynomorphs, lithology, salinity and chronology in sediment core from Machilipatnam.
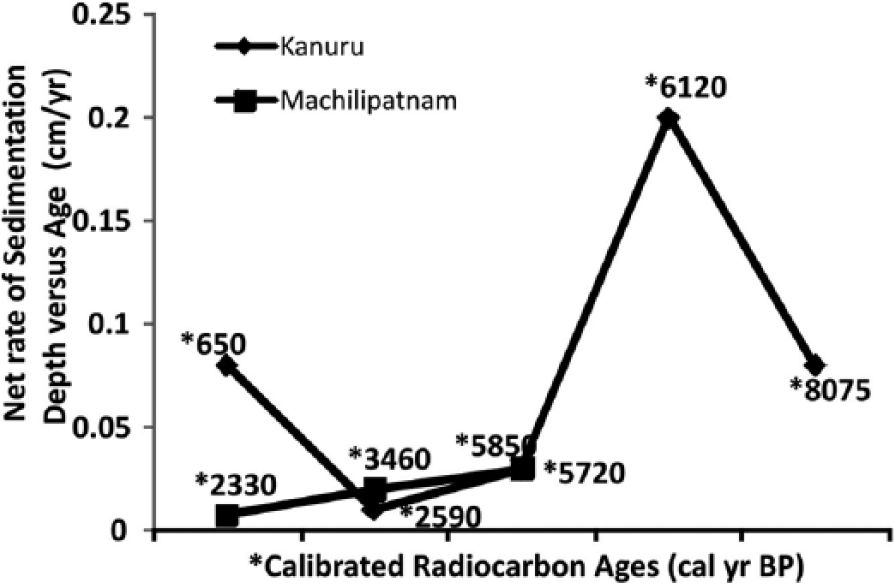
The net rate of sedimentation and chronology in Kanuru and Machilipatnam.
Results
Salinity in freshwater aquifers
The freshwater samples from the dug wells (3 to 6 m deep) in and around Kanuru and nearby Chilkalapudi reveal that pH ranged from 7.5 to 9.5, salinity ranged from 1.4 to 2.1 ppt, conductivity ranged from 0.38 to 2.4 mS/cm and TDS ranged from 895 to 1925 ppm. Six freshwater samples collected from dug wells in outskirts of Machilipatnam city and near the core site towards the eastern coastal strip show pH ranging from 8.5 to 9.0. The salinity ranged from 0.9 to 1.8 ppt, conductivity ranged from 0.16 to 2.0 mS/cm and TDS ranged from 595 to 1247 ppm. There was no significant correlation with the increase/decrease in depth of the wells with the values of the above parameters. All the freshwater aquifers here show high pH and salinity which are much above the guidelines of 7.0 and 0.1 ppt, respectively, recommended for drinking water.
Sedimentology, salinity and chronology (Kanuru)
In a 500-cm sediment core, the upper 60–70 cm is brownish fine sandy clay and the salinity in aqueous soil solution ranges from 1.0 to 1.5 ppt (Figure 4). The salinity increased to maximum in clayey sediment (4.5 ppt) in the bottom sediments. The thin brownish sandy layers observed in between the core show comparatively low salinity. The five radiocarbon (14C) dates obtained are 7250 ± 90 yr BP (8075 cal. yr BP; BS2913a) at 475.5–481 cm. At 292.5–299 cm, it is 5370 ± 130 yr BP (6120 cal, yr BP; BS2911), at 214.5–221 cm it is 5030 ± 100 yr BP (5720 cal. yr BP; BS2966), at 123.5–130 cm it is 2520 ± 120 yr BP (2590 cal. yr BP; BS2929) and at 39–52 cm it is 659 ± 90 yr BP (620 cal. yr BP; BS2930). Intra/extrapolated ages given in Figure 4 were calculated between two radiocarbon ages versus depth assuming that the rate of sedimentation was the same between the time periods in order to assess the duration of palynological phases. These are at 487.5–500 cm (~8420 cal. yr BP), 377–487.5 cm (~8300 cal. yr BP), 377–344.5 (~7040 cal. yr BP), 279.5–344.5 cm (~6095 cal. yr BP), 279.5–253.5 cm (~6020 cal. yr BP), 253.5–208 cm (~5920 cal. yr BP), 169–208 cm (~5020 cal. yr BP), 169–13 cm (~3980 cal. yr BP) and 0–13 cm (~240 cal. yr BP). The net rate of sedimentation between 299 and 474.5 cm is 0.08 cm/yr. At 221–299, 130–221, 52–1130 and 0–52 cm, the net rate of sedimentation is 0.2, 0.03, 0.01 and 0.08 cm/yr, respectively. The rate of sedimentation was quite high between 221 and 299 cm.
Palynology (Kanuru)
Broadly, four units (1–4) were distinguished in ecological perspective on the basis of the sediment depositional environment correlating with palynological evidence. Units 1 and 3 were deposited during Retreated Estuarine Ecosystem, whereas Unit 2 was deposited in Fluctuating Estuarine Ecosystem and Unit 4 in Estuarine Ecosystem. Nine phases (estuarine/non-estuarine sediment deposition) have been demarcated into four units on the basis of relative percentage of marine and land palynomorphs. The details of these are as follows.
Unit 1; Phase 1, 500–487.5 cm (8420–8300 cal. yr BP, estuarine sediment deposition)
This phase is of short duration where the AP constitutes an average relative percentage of 27.2 and NAP 21.2 (Figure 4). No mangrove pollen was recorded. The ubiquitous Poaceae pollen among NAP comprise 9.7%, freshwater algae 19.7%, thecamoebians 10.6% and foraminifera linings and dinoflagellate cysts 21.2%. The relative percentage of each taxa recorded (both marine and terrestrial palynomorphs) against TP is given in Figure 4. The ratio of marine versus terrestrial palynomorphs is 0.26.
Unit 1; Phase 2, 377–487.5 cm (8300–7040 cal. yr BP, non-estuarine sediment deposition)
This phase is of longer duration where average total AP constitutes 13.5% and NAP 7.6%. The Poaceae pollen constitute 2.3% and freshwater algae comprising mainly Pediastrum and Botryococcus constitute 51.6% of TP. No marine palynomorphs were recorded, but freshwater thecamoebians constitute 25% of the TP in this phase.
Unit 2; Phase 3, 377–344.5 (7040–6695 cal. yr BP, estuarine sediment deposition)
This phase comprises average total mangroves of 11.9%. The AP constitutes 18.9%. About 14.7% of NAP including Poaceae were recorded. The freshwater algal percentage accounts to 19.8%. Thecamoeba constitutes 9.3%. The foraminifera linings and dinoflagellate cysts constitute 25.4% of the marine palynomorphs (Figure 4). The ratio of marine versus terrestrial forms is 0.59.
Unit 2; Phase 4, 2795–344.5 cm (6695–6020 cal. yr BP, non-estuarine sediment deposition)
This phase does not show any marine palynomorphs and comprises average values of AP of 14.1% and NAP of 14.0%. Out of the total NAP, the Poaceae comprise average 2.7%, freshwater algae 59.7% and thecamoebians 12.2%. The terrestrial arboreal comprised Mangifera, Melia azadirachta, Murraya, Shorea/Hopea and Syzygium. The non-arboreals include Cheno/Ams, Hygrophila and Asteraceae. The relative percentages of these have been given in Figure 4.
Unit 2; Phase 5, 279.5–253.5 cm (6020–5920 cal. yr BP, estuarine sediment deposition)
In this phase, average values of AP constitute 13.3% and NAP 14.4%. Out of this, Poaceae comprise 4.6%. The average value of freshwater algae Pediastrum and Botryococcus is 27.2% and thecamoebians 3.1%, and marine palynomorphs like foraminifera lining and dinoflagellate cysts show the highest average percentage of 42.0. The ratio between marine and terrestrial palynomorphs is 0.72.
Unit 2; Phase 6, 253.5–208 cm (5920–5020 cal. yr BP, non-estuarine sediment deposition)
In this phase, the AP accounts to average value of 18.0% followed by 15.9% of NAP. Out of these, Poaceae constitute 10.5%. The freshwater algae show average of 53.9% and thecamoebians 12.1%. The relative percentage of each taxa against TP is given in Figure 4. Mainly, the non-arboreals which are common are Cheno/Ams and Asteraceae. No marine forms were recorded.
Unit 2; Phase 7, 169–208 cm (5020–3980 cal. yr BP, estuarine sediment deposition)
The mangroves/associates constitute an average value of 1.2%. These comprise Avicennia, Acanthus ilicifolius and Suaeda. The average AP constitutes 21.3% and NAP 28.8%. Out of these, Poaceae constitute 14.2%, freshwater algae 20.2% and thecamoebians 4.3%. Foraminifera linings and dinoflagellate cysts constitute 24.2%. The ratio of marine versus terrestrial palynomorphs is 0.34. The relative percentages of all the taxa recorded are given in Figure 4.
Unit 3; Phase 8, 169–13 cm (3980–240 cal. yr BP, non-estuarine sediment deposition)
Scarce record of salt-tolerant (0.3%) and no other mangrove pollen was observed in this phase, and hence, a non-estuarine deposition was inferred. The AP constitutes an average value of 18.3% and NAP 26.1%. Out of NAP, the Poaceae constitute 12.3%, freshwater algae 34.7% and thecamoebians 20.7%. The relative percentage of all the taxa is given in Figure 4.
Unit 4; Phase 9, 0–13 cm (240 cal. yr BP–present, estuarine sediment deposition)
This phase is modern and the shortest. The mangroves mainly comprise salt-tolerant Avicennia and Suaeda (average 35.3%). The average value of AP is 27.8% and NAP 17%. Out of these, Poaceae constitute 12.0% of total NAP. Freshwater algae of 2.6% and thecamoeba 9.7% were recorded against TP. Foraminifera linings and dinoflagellate cysts constitute average values of 7.6%. The ratio between marine and terrestrial forms is 0.75.
Machilipatnam
Sediment texture, salinity and chronology
The entire core is almost homogeneous in texture. However, the bottom 84–118 cm of the sediment core and top 0–8 cm are sandy clay and the rest part of the core is relatively sandy (Figure 5). The average salinity in the aqueous soil solution of the sediment is ~3.5 ppt. However, the salinity increased to about 8 ppt in the top surface sample perhaps because of exposure of land to evaporation resulting in the accumulation of salts on the ground surface. Three radiocarbon (14C) dates were obtained. At 114–118 cm, it is 5640 ± 100 yr BP (6670 cal. yr BP; BS3078); at 34–40 cm, it is 3250 ± 200 yr BP (3460 cal. yr BP; BS3083); and from 14 to 20 cm, it is 2330 ± 90 yr BP (2390 cal. yr BP; BS3067). The intrapolated age at 6–8 cm is 950 cal. yr BP, at 34–36 cm is 3240 cal. yr BP, at 56–60 cm is 4100 cal. yr BP, at 64–66 cm is 4340 cal. yr BP, at 70–72 cm is 4580 cal. yr BP, at 78–80 cm is 4900 cal. yr BP and at 86–88 cm is 5225 cal. yr BP; intrapolated ages given in Figure 5 were calculated between two radiocarbon ages versus depth assuming that the rate of sedimentation was the same between the time period. The net rate of sedimentation between 40 and 118 cm is 0.03 cm/yr. Later between 20–40 and 0–20 cm, the rate of sedimentation slowed down to 0.02 and 0.01 cm/yr, respectively. A 118-cm-deep core from Machilipatnam mangrove zone is represented by only Units 2, 3 and 4. Nine phases (1–9) were demarcated on the basis of marine/terrestrial palynomorphs.
Palynology
The sediment depositional Unit 2 comprises seven phases exhibiting intermittent evidence of marine palynomorphs (Figure 5). Units 3 and 4 do not show any changes in palynological assemblage and hence are denoted as Phases 8 and 9, respectively. Unit 2 shows fluctuating estuarine and non-estuarine sediment deposition. While Unit 3 shows retreating estuarine deposition, Unit 4 shows estuarine depositional environment. No freshwater algae were recorded as compared with Kanuru site.
Unit 2; Phase 1: 92–118 cm (6670–6050 cal. yr BP, estuarine sediment deposition)
This phase reveals estuarine ecosystem constituting 25.5% of mangroves and associates (Figure 5). These comprise true mangroves such as Rhizophora, Bruguiera, Sonneratia, Heretiera and other back-mangrove species like Excoecaria, Avicennia and Nypa. The percentage of AP is 46.1%. The NAP constitutes 5.8%. Out of these, Poaceae/Cyperaceae constitute 2.5%. Pteridophytic monolete/trilete spores comprise 7.1%, thecamoebians 9.0% and foraminifera linings and dinoflagellate cysts 6.3%. The ratio of marine/terrestrial palynomorphs is 0.46.
Unit 2; Phase 2: 82–92 cm (6050–5580 cal. yr BP, non-estuarine sediment deposition)
No mangroves or any other marine palynomorphs were recorded. The percentage of AP is 80.6%. Poaceae/Cyperaceae included 10.2% and monolete trilete spores 9.1%.
Unit 2; Phase 3: 74–82 cm (5580–5185 cal. yr BP, estuarine sediment deposition)
Although this phase is of short duration, mangroves comprise 16.9%. The AP is 62.9% and NAP is 17.5%. Out of these, Poaceae/Cyperaceae show 11.5% of NAP. Monolete/trilete spores comprise 6.1%. However, the foraminifera linings/dinoflagellate cysts constitute very low percentage (2%). The ratio of marine versus terrestrial palynomorphs is 0.21.
Unit 2; Phase 4: 74–68 cm (5185–4870 cal. yr BP, non-estuarine sediment deposition)
Marine palynomorphs including mangroves were absent. AP percentage is high (74.7%) and NAP shows 16.7% which includes 15.4% of Poaceae/Cyperaceae. Pteridophytic monolete/trilete spores show 8.5%.
Unit 2; Phase 5: 64–68 cm (4870–4635 cal. yr BP, estuarine sediment deposition)
This phase is again of very short duration comprising 26.3% of mangroves and associates. The AP comprises 53.5% and NAP 12%. Out of the total NAP, the Poaceae and Cyperaceae constitute 9.2%. The pteridophytic spores account to 6%. The foraminifera linings show 2.3%. The ratio of marine/terrestrial palynomorphs is 0.4.
Unit 2; Phase 6: 64–42 cm (4635–3695 cal. yr BP, non-estuarine sediment deposition)
No marine palynomorphs including mangroves were recorded. The AP comprises 73.2% and NAP shows 16.8%. The Poaceae/Cyperaceae include 15.3% of NAP. Pteridophytic spores show 8.3% and thecamoebian shows meagre value of 1.7%.
Unit 2; Phase 7: 42–38 cm (3695–3530 cal. yr BP, estuarine sediment deposition)
This phase again shows estuarine depositional environment where mangroves/associates constitute 14.2%. The AP shows 64.9% and NAP shows 12.7%. Out of total NAP, Poaceae/Cyperaceae shows 9.2%. Monolete/trilete spores and thecamoebians constitute about 2.1% and 4.4%, respectively. The foraminifera linings show meagre account of 1.6%. The ratio of marine versus terrestrial palynomorphs is 0.18.
Unit 3; Phase 8: 36–08 (3530–950 cal. yr BP, non-estuarine sediment deposition)
This phase does not show mangroves, but stray presence of Suaeda pollen was recorded (2%). No other marine palynomorphs were observed. The AP constitutes 76.5% and NAP 18.9% where Poaceae/Cyperaceae constitute the major percentage of 13.4. The monolete/trilete spores and thecamoebians constitute 2.6% and 0.4%, respectively.
Unit 4; Phase 9: 08 cm–present (950 cal. yr BP–Present, estuarine sediment deposition)
The mangroves constitute about 25.1%, and AP and NAP constitute 44.9% and 23.3%, respectively. Poaceae/Cyperaceae constitute 11.3% of NAP. Among the mangrove associates, Suaeda and Acanthus ilicifolius were present. The relative percentage of each palynomorphs is given in Figure 5. Thecamoebians show 1.4% and foraminifera linings account to only 4.5% of TP. The ratio of marine/terrestrial palynomorphs is 0.42.
Discussion
Increased salinity in freshwater from dug wells used for drinking water in the vicinity of both the studied sites is much above the recommended value of 0.1 ppt (World Health Organization (WHO), 2013). The main sources of saline-water intrusion in freshwater aquifers are (1) changes of land use from agriculture to residential and (2) increase in the number of bore wells/dug wells and hand pumps. Pumping of excessive groundwater may be one of the causes for subsidence and the possible intrusion of sea water along the Indian coastal belt (Sahu and Sikdar, 2011). The details of salt-water intrusion due to rise in RSL and human activities in the Krishna and Godavari delta are reported earlier (Mondal et al., 2008). Precipitation of salts on the ground surface due to capillary action forms salt pans which do not tend to support any vegetation (Figure 2). The high salinity in the aqueous soil solution in both the sediment cores from Kanuru and Machilipatnam shows a considerable amount of dissolved salt in aqueous soil solution which is accessed up and down through capillary force in the sediment and is the only available water for intake by the mangroves. High salinity in the sediments affected by the rise/fall in RSL becomes vulnerable to mangroves. This leads to changes in Mangrove zonation and species extinction or migration (Mandal and Naskar, 2008; Tomlinson, 1986). The clay lattices hold more salts than sandy sediment (Farooqui, 2010), and therefore, sediments with relatively high percentage of sand show low salinity and those with relatively high silt and clay show increased salinity.
The rate of sediment deposition and texture in the coastal wetlands largely varies from time to time and depends on the direction and energy of the rivers/streams which feed them, coupled with the magnitude of wave action. Both the studied cores in general show clay and clayey sand sediment. The net rate of sediment deposition ranges from 0.02 to 0.08 cm/yr in Kanuru, except between 6120 and 5720 cal. yr BP it is high (0.2 cm/yr). The result shows that the high rate of sediment deposition was more towards Kanuru rather than in Machilipatnam (0.008–0.02 cm/yr) during mid–late Holocene. More freshwater algae and salt-tolerant mangroves were recorded in Kanuru, indicating fluctuating stressed conditions. In Machilipatnam, no freshwater algae were recorded although a high diversity of true mangrove species (Figure 5) and low salt-tolerant mangroves were observed. It is inferred that slow rate of sedimentation and low magnitude of RSL influence on the ecosystem were possible for mangrove stabilization in Machilipatnam.
Mangroves play an important role in understanding the extent, magnitude and duration of sea level changes either induced by climate or geomorphology of the area. In Kanuru, between 8420 and 8300 cal. yr BP the rise in RSL is recorded by the evidence of foraminifera linings and dinoflagellate cysts, but it was of short duration and therefore mangroves could not stabilize and proliferate. A retreat in RSL was recorded between 8300 and 7040 cal. yr BP. The climate during this period was perhaps drier as both AP and NAP reduced along with Poaceae. The primary productivity increased in stagnated water, which is evidenced by high percentage of Botryococcus bloom. The lipid-rich Botryococcus colony is predominant in freshwater as well as in brackish water (Metzger and Largeau, 2005). Such an ecosystem favoured the growth of freshwater heterotrophs such as thecamoebians. The 8.2-ka BP event has been widely reported from different areas globally during which the weakening of Indian and Asian monsoon took place and is largely linked with cooling of North Atlantic (Dixit et al., 2014). Therefore, the weakening of monsoon is directly/indirectly related to RSL rise/fall that may vary from place to place. Intermittent fall in RSL during middle Holocene transgression may therefore be somewhat linked to the weakened monsoon and the rise in RSL with the strengthened monsoon. Thus, at least three events of weakened monsoon occurred between ~7.0 and 3.0 ka BP as is evidenced from studied sites.
Between 7040 and 6695 cal. yr BP, a good percentage of mangroves and other AP and NAP suggests warm and humid climate triggering rise in RSL and stability in coastal wetland (estuary). However, only salt-tolerant mangrove species such as Avicennia and its associates like Acanthus ilicifolius and Suaeda spp. indicate occasional tidal ingression due to which the coastal land was exposed to evaporation during most of the time that increased salinity in soil. A fall in RSL is observed between 6695 and 6020 cal. yr BP supporting low diversity of AP and NAP, but freshwater algae and heterotrophs such as thecamoebians were recorded in high percentage suggesting freshwater sediment depositional environment but weakened summer monsoon. The period between 6020 and 5920 cal. yr BP again witnessed a rise in RSL but was of short duration and unstabilized, not allowing the growth of mangroves or its associates, but due to tidal incursion high percentages of foraminifera linings and dinoflagellate cysts were recorded. The tidal incursion reduced the freshwater forms like algae and thecamoebians because of increased salinity. This has been reported by Farooqui and Naidu (2010) from Godavari coastal wetlands.
Between 5920 and 5020 cal. yr BP, a fall in RSL was recorded again. Freshwater algal bloom was recorded along with the increased percentage of thecamoebians. Between 5020 and 3980 cal. yr BP, a slight rise in RSL was evidenced. True mangroves could not stabilize because of instability in the ecosystem. A fall in RSL was recorded again from 3980 to 240 cal. yr BP. Freshwater algae and thecamoebians again increased in percentage. The present-day mangrove cover shown in Figure 2 reveals pure forms of Avicennia and Suaeda interspersed by barren low-relief highlands with salt cover that does not allow the growth of any vegetation. Since around 240 cal. yr BP to present, the area shows the ingression of sea water. This rise may not be uniform in other parts of the Indian coastline in the present day. Therefore, the climate-induced RSL rise/fall is largely controlled by the changes in the geomorphology of the area which may be triggered because of tectonics in the region induced by either natural reasons or aggravated by anthropogenic pressures in coastal areas.
In Machilipatnam, a comparatively good diversity of true mangroves was recorded between 6670 and 6050 cal. yr BP indicating stabilized estuarine ecosystem. Salt-tolerant Avicennia with no Suaeda pollen indicates lowered salinity in the estuary favouring Sonneratia and Heretiera which are now absent in the study area. Heretiera is now present only in Sundarban estuary in the east coast. Sonneratia was also abundant all along the east coast in the beginning of late-Holocene, but now it is either at the verge of local extinction or completely absent (Farooqui, 2008, 2013). From 6050 to 5580 cal. yr BP and 5185 to 4870 cal. yr BP, the fall in RSL is observed and between 5580 and 5185 cal. yr BP a slight rise in RSL is observed although with the reduction in marine/terrestrial ratio from 0.5 to 0.2 during this period. The rise in RSL was from 4870 to 4635 cal. yr BP with an intermittent fall between 4635 and 3695 cal. yr BP, but again a rise in RSL was observed from 3695 to 3530 cal. yr BP. A longer span of RSL fall was recorded from 3530 to 950 cal. yr BP with an ingression in sea water since 950 cal. yr BP to present. Overall results show high ratio (0.2–0.7) of marine versus terrestrial palynomorphs from Kanuru and low (0.2–0.4) from Machilipatnam. However, mangrove species diversity was high in Machilipatnam with comparatively low foraminifera linings and dinoflagellate cysts.
Holocene sea level reconstructions are limited and fragmentary, but RSL drop after 5 ka has been reported (Tija, 1996) which is in conformation with this study. On the basis of fossil mangrove deposits, Geyh and Kudrass (1979) stated that Holocene sea rose from below −12.8 to 1.2 m above present level between 8 and 6 ka and later between 5 and 4 ka. However, their data do not show whether the late-Holocene sea level fall was steady or oscillatory. This study and other records from contemporary east coast of India show that the sea transgressed until 5–6 ka encroaching land (~15–25 km), and since then the delta prograded continuously but with intermittent short periods of rise and fall in RSL during late-Holocene (Banerjee, 2000; Farooqui, 2013; Farooqui and Naidu, 2010; Farooqui and Vaz, 2000; Vaz and Banerjee, 1997). The amelioration of climate from strengthened to weakened monsoon has been observed in palynological studies carried out in different parts of Indian peninsula and the central/western part of India since 6 ka (Farooqui, 2013; Farooqui and Sekhar, 2011; Prasad et al., 2014). Nypa and Hereteira which were recorded around 4–5 ka in Pichavaram (Farooqui, 2008; Srivastava and Farooqui, 2013, 2014) and Sulurpet (Pulicat lagoon) show local extinction from the south-east coast (Farooqui and Vaz, 2000). At present, abundance of scrubby Avicennia and Suaeda species dominates the euryhaline ecology in most of the coastal wetlands which is unable to support true mangroves.
The vertical stack of Holocene sediment shows highly variable net rate of sedimentation and evidence of Holocene transgression between 7 and 3.5 cal. yr BP at different depths in both the studied sites An estimated average rise in sea level during 5–6 ka is ~1.2–1.5 m (Banerjee, 2000) which is based on few records in limited area. The actual rise in sea level is debatable because of vertical displacement of Holocene sediment along the east coast of India. The records of middle Holocene sea level are estimated to be +5 m around 6 ka (Nageswara Rao and Sadakata, 1993) and +3.0 m around 7.3 ka (Banerjee, 2000), +4.2 m in Sulurpet around 6 ka (North-west of Pulicat lagoon) in Andhra Pradesh (Farooqui and Vaz, 2000) and −2 m around 5.6 ka in Annamalainagar (west of Pichavaram estuary) in Tamil Nadu (Farooqui, 2004, 2008). In other words, the record of intertidal/estuarine deposition on land that took place at ~5–7 ka is now present at different depths suggesting upliftment/subsidence in the vertical stack of sediment deposited during Holocene. The present-day mangroves in the Machilipatnam core sight are connected to the back waters flooded from the Kanuru sight in low-lying areas. The adjacent Goguleru creek is also reported to be under subsidence, and therefore, the sea water ingression is observed in most part of inter-deltaic areas of K-G River (Nageswara Rao et al., 2012).
The Krishna River delta is governed by both erosion and accretion (Anand Rao et al., 2006). Subrahmanyam et al. (2010) inferred two parallel faults in the continental margin off the K-G delta and relate a continuous existence of Kolleru lake (35 km from the present shoreline) to its location in the tectonically active Gudivada Sub-Basin. The concavity observed between the twin deltas (K-G) is, therefore, tectonically controlled (Bastia and Nayak, 2006; Subrahmanyam et al., 2010). The Chintalapudi and Krishna Cross Trend faults of the basement extend offshore. The formation of Goguleru creek (north of Kanuru), is the low-lying portions of the palaeo beach swales filled by ingressing sea water and in between islands are the beach ridges (Nageswara Rao et al., 2012). Similar beach ridges and swales are also observed in Kanuru site, and the dominance of mangroves (similar height), here, suggests the tectonically controlled recent ingression of sea water. However, as the input of freshwater in the estuary is restricted because of weakened monsoon and anthropogenic activity, the salt-tolerant plants dominate the studied area. The study of sedimentary cores in Godavari delta reveals evidence of marine shells (Anadara) between 9 and 11.5 m below the surface during 6.4 ka, and the rate of subsidence calculated comes out to be ~2–4 mm per annum. Since the last two millennia, an increased rate of subsidence is estimated and is attributed to anthropogenic activity leading to exposed land and its erosion, thereby triggering high input of sediment at the mouth of the Godavari delta (Nageswara Rao et al., 2010). The increase in marine forms since 0.6 ka in Nilarevu river (Godavari River tributary) has also been reported through biological proxies by Farooqui and Naidu (2010). Similar trend of post-deposition subsidence/upliftment in the middle Holocene sediments is also recorded in the present study sites. The sea water ingression since the last 0.5 ka in both the sites suggests subsidence in the area due to which the sea water has ingressed in the areas of swales in between the sandy ridges.
The geometry of the faults and seismic records of the last two centuries have been mapped earlier (Banerjee et al., 2001). The overall subsidence of ~1.3–2.2 cm/yr is observed in Sundarbans, Bengal Basin (Alam, 1996; Hugh, 2014), and a part of Bangladesh coastline because of which an estimated rise in RSL is 2.3 cm/yr. Global estimates of subsidence rates and a rise in sea level are 3.4 mm/yr (Allison et al., 2003) and 1.7 to 3 mm/yr (Smith, et al., 2012), respectively. A rise in sea level predicted by 21st century due to global warming may get aggravated by high rates of land subsidence (Syvitski et al., 2009) and coastal erosion. The average rate of sea level rise in India is 1.34 mm/yr (Unnikrishnan and Shankar, 2007). It is recorded that about 43% of 1030-km-long Andhra Pradesh coastline is under very high risk if the sea level rises by 0.6 m resulting in an estimated loss of ~1.2 million people residing within an elevation of 2.0 m (Nageswara Rao et al., 2008, 2010). Henceforth, climate-induced global sea level rise is predicted to be 1–3 mm/yr (Pielke et al., 2007). A more recent predictability is ~1.5 m by the end of this century (Strohecker, 2008). All these predictions of sea level rise are related to the geomorphology of coastal zones and may vary accordingly. East coast of India is characterized by gentle slope gradient of ~1–2 m above mean sea level covering more than 4–6 km from the present shoreline. About 2–3 km of coastal zone is shallow, ranging from 0.4 to 1 m a.m.s.l., and is at a very high risk of inundation even if a slight rise in sea level occurs in future either because of climate or geomorphological changes.
The entire east coast of India is characterized by loads of sediment deposition brought by numerous rivers and its tributaries. The compaction is likely to occur in areas of highly unconsolidated sediment which governs the ecological status and the mangrove community. The unconsolidated sediments in the modern deltaic plains undergo a common phenomenon of land subsidence due to compaction under the load of subsequently deposited overlying sediments and groundwater pumping (Dumont and El-Shabrawy, 2007; Meckel et al., 2006; Stanley, 2005). If the subsidence rate in the area is high, the vertical stacking of the sediments occurs and the horizontal spreading of delta is restricted. This study and other records from contemporary deltaic areas suggest that a rise in RSL is not uniform in the entire coastline of India and/or elsewhere in the world, but differs from place to place. Consequently, due to variations in ecological conditions, the magnitude of impact on mangroves varied from place to place depending upon hydrostatic changes. The apparent rise in RSL in several pockets along the east coast of India could be attributed to vertical displacement of the unconsolidated sediments rather than a net increase in global sea level rise. Therefore, planning area-specific measures to counter sea level rise in low-lying areas is important. It is rather wiser to identify the areas of subsidence in deltaic plains for future planning.
Conclusion
Although the RSL fluctuation recorded in this study has been attributed to climatic changes in the past, it has also been facilitated by the neo-tectonic activity or subsidence in the unconsolidated Holocene deltaic sediments. The ratio of marine versus terrestrial palynomorphs provided an evidence of fall/rise in RSL along with the chronological duration and magnitude of the event. The middle Holocene global transgressive event in the present studied site shows three to four events of rise in middle Holocene RSL with intermittent retreats suggesting strengthened and weakened monsoon, respectively. The net rate of sedimentation varied in both the sites, and middle Holocene transgressive evidence is at different depths from the present-day mean sea level. The estimated vertical sediment displacement in the area is more than ~2 m. While a stabilized estuarine ecosystem existed in Machilipatnam, a stressed ecosystem was predominant in Kanuru. The period after 3.9 ka in Kanuru and ~3.4 ka in Machilipatnam shows retreat in shoreline, but the sea water ingression is observed since 0.2 and 0.6 ka, respectively, in both the sites. The deltaic instability is predicted in future in the studied sector along the south-east coast.
Footnotes
Acknowledgements
The authors are thankful to Director, Birbal Sahni Institute of Palaeobotany (BSIP), for providing necessary facilities. One of the authors Ranjana is thankful for the Birbal Sahni Research Scholarship (BSIP, Lucknow). We are grateful to Prof. Francis E. Mayle, University of Reading, Whiteknights, UK for valuable suggestions during the manuscript revision.
Funding
The author(s) except Ranjana are scientists and their research work is funded by the Department of Science and Technology, New Delhi, India.