
Abstract
Analyzing the signatures of landscape changes in the stratigraphic record is crucial to refine our knowledge of tidal landform dynamics and represents a first step toward the development of predictive morphodynamic models. The southern Venice Lagoon (Italy) is particularly suited to analyze modifications in the depositional environment and, consequently, in the sedimentary record because of the remarkable changes that occurred in the last centuries. We collected 25 cores along a NE–SW linear transect about 5 km long cutting through salt marshes, tidal flats, and subtidal platforms. High-resolution sedimentological analyses defined the spatial arrangement of four deposits along the transect (palustrine, salt marsh, lag, and tidal-flat/subtidal-platform deposits), whose cores were dated through radiocarbon, 210Pb, and 137Cs geochronological analyses. The study succession testifies an evolution from a palustrine freshwater environment to a lagoonal environment over the last 2000 years. The palustrine peat progressively evolved into salt marshes in the 14th century. Salt-marsh aggradation is characterized by different accretion rates over time and occurred in parallel with the decrease in the salt-marsh extent and tidal-flat expansion. Where salt-marsh deposits were locally flooded and impacted by wind waves, a lag deposit developed. As a consequence of the progressive water deepening, organic-rich mud accumulated above the lag. The results, as well as providing the first accretion model for the latest Holocene succession in the southern Venice Lagoon, highlight that the disappearance of salt marshes in this area has to be ascribed to the lateral erosion of their margins, rather than to their progressive drowning.
Introduction
Lagoons and estuaries are characterized by an extremely high biodiversity and rates of primary productivity, display typical ecosystems and landforms, and host important socio-economic activities worldwide (e.g. Barbier et al., 2011; Cronk and Fennessy, 2001; Wolanski and Elliott, 2015). Salt marshes, tidal flats, and subtidal platforms represent the three major unchanneled lagoon sub-environments. Salt marshes occupy the highest portions of a lagoonal landscape, with elevation between mean sea level (hereinafter MSL) and the maximum high water level (hereinafter MHWL).They are populated by abundant halophytic vegetation species and are characterized by the development of biogeomorphic zonation patterns (Bockelmann et al., 2002; D’Alpaos and Marani, 2016; Marani et al., 2013). Tidal flats are characterized by elevations between MSL and the minimum low water level (hereinafter MLWL) and are therefore fully exposed only during exceptionally low tides. They are not populated by halophytic vegetation and can host phanerogams and seagrasses (Carr et al., 2010). Subtidal platforms are located below the MLWL and are therefore perennially submerged (e.g. Allen, 2000). The morphological evolution of these three sub-environments is strictly related, both in space and in time. The areal extent of tidal flats and subtidal platforms affects, for example, the wind-wave fields which impact against salt-marsh boundaries promoting their erosion (e.g. Hu et al., 2015; Marani et al., 2011; Mariotti and Fagherazzi, 2013). In turn, the extent of salt marshes controls fetch dimensions, which directly influence the intensity of the wind-induced wave field (Carniello et al., 2011; Mariotti and Carr, 2014). These processes cause continuous exchange of sediments between marshes and the adjacent tidal flats and subtidal platforms (Carniello et al., 2009).
Salt marshes, among numerous valuable services to coastal areas, furnish a buffer zone against storm surges, filter nutrients, and pollutants and represent nursery areas for a large number of coastal biota (Barbier et al., 2011; Gedan et al., 2009, 2011; Mitsch and Gosselink, 2000; Möller et al., 2014; Silliman et al., 2009; Temmerman et al., 2013). Nevertheless, salt marshes are very sensitive to the combined effects of environmental changes and human pressure, which caused extensive losses of global marshlands, especially during the last century (e.g. Day et al., 2000; Gedan et al., 2009; Gedan and Silliman, 2009; Kirwan et al., 2010; Marani et al., 2010; Mudd, 2011; Pendleton et al., 2012).
A similar fate also afflicts salt marshes in the Venice Lagoon (northern Italy), where a general expansion and deepening of tidal flats and subtidal platforms (Carniello et al., 2009; D’Alpaos, 2010a; D’Alpaos et al., 2013; Marani et al., 2007) occur in parallel with a dramatic contraction of salt-marsh areas. The diversion of the main rivers out of the Venice Lagoon, particularly strong from the 15th century, caused remarkable changes in the salt-marsh extent: salt-marsh areas, in fact, decreased from about 180 km2 in 1811 to about 50 km2 in 2002 (Carniello et al., 2009; D’Alpaos, 2010a; Marani et al., 2003, 2007). Moreover, during winter, strong winds (especially from NE – Bora Wind) generate waves impacting against salt-marsh edges and contributing to their erosion (Bendoni et al., 2016; Marani et al., 2011). The Venice Lagoon, one of the most studied lagoons worldwide, therefore represents an outstanding example of interaction between human interventions and natural biophysical processes in coastal environments over centuries, becoming the subject of a large number of studies.
The present-day morphology of the Venice Lagoon is a result of a combination of the Holocene sea-level rise and local forcings (e.g. subsidence and sediment supply), which strongly interacted with intense human pressure over the last millennium.
The Holocene history of the Venice Lagoon has been documented in recent studies based on the employment of very high-resolution seismic data and sedimentary core analyses (Brancolini et al., 2008; Madricardo and Donnici, 2014; Tosi et al., 2009a; Zecchin et al., 2009, 2014). Although the accumulation of the lagoonal deposits started around 7000–6000 yr BP (Fontana et al., 2004), only during the last 2000 years changes in depositional patterns were influenced by human interventions, such as river diversions and channel dredging (e.g. Bondesan and Furlanetto, 2012; Brambati et al., 2003; Carbognin, 1992; D’Alpaos, 2010a, 2010b; Favero, 1983; Gatto and Carbognin, 1981; Ravera, 2000; Tosi et al., 2009a, 2009b). Additionally, during the last century, the exploitation of underground water significantly increased subsidence within the Venice Lagoon area (e.g. Brambati et al., 2003; Carbognin, 1992; Carbognin et al., 2005), and further activities associated with land reclamation and fish-breeding caused a noteworthy decrease in the lagoon surface.
All the main environmental and morphological changes that affected the Venice Lagoon over the past centuries are well documented from historical sources (D’Alpaos, 2010a, 2010b; Dorigo, 1983, 1994; Favero et al., 1988). Nevertheless, relatively scarce attention has been paid to detecting the signatures of these changes in the lagoonal sedimentary record, which appears to be significantly expanded given the remarkable accumulation rate of the area (e.g. 0.25 cm yr−1; Bellucci et al., 2007).
This paper focuses on the last 2000 years old sedimentary succession of the southern Venice Lagoon, where the repeated and remarkable changes in extent of salt marshes and adjacent tidal flats have been documented by historical sources (e.g. D’Alpaos, 2010a, 2010b). This work aims at comparing the historical dataset with the stratigraphic record through a multidisciplinary approach based on geomorphological, sedimentological, and geochronological analyses. Specifically, the goal of the paper is twofold: (1) we provide a first high-resolution sedimentological and stratigraphic documentation of the sedimentary succession accumulated in the southern Venice Lagoon over the past two millennia, and (2) we provide a detailed age model for the salt-marsh succession accumulated during the past millennium through a combination of radiocarbon, 210Pb, and 137Cs measurements.
Geological setting
The Venice Lagoon (Figure 1) is located in a foreland region comprised between the NE-verging northern Apennine and the SSE-verging eastern South-Alpine chains. It is a shallow lagoon (average depth of tidal flats and subtidal platforms of about 1.5 m), with a total extent of about 550 km2, and a semi-diurnal micro-tidal regime with maximum water excursions of ±70 cm around MSL. The Venice Lagoon is connected to the Adriatic Sea through three inlets: from North to South, Lido, Malamocco, and Chioggia (Figure 1a), respectively.
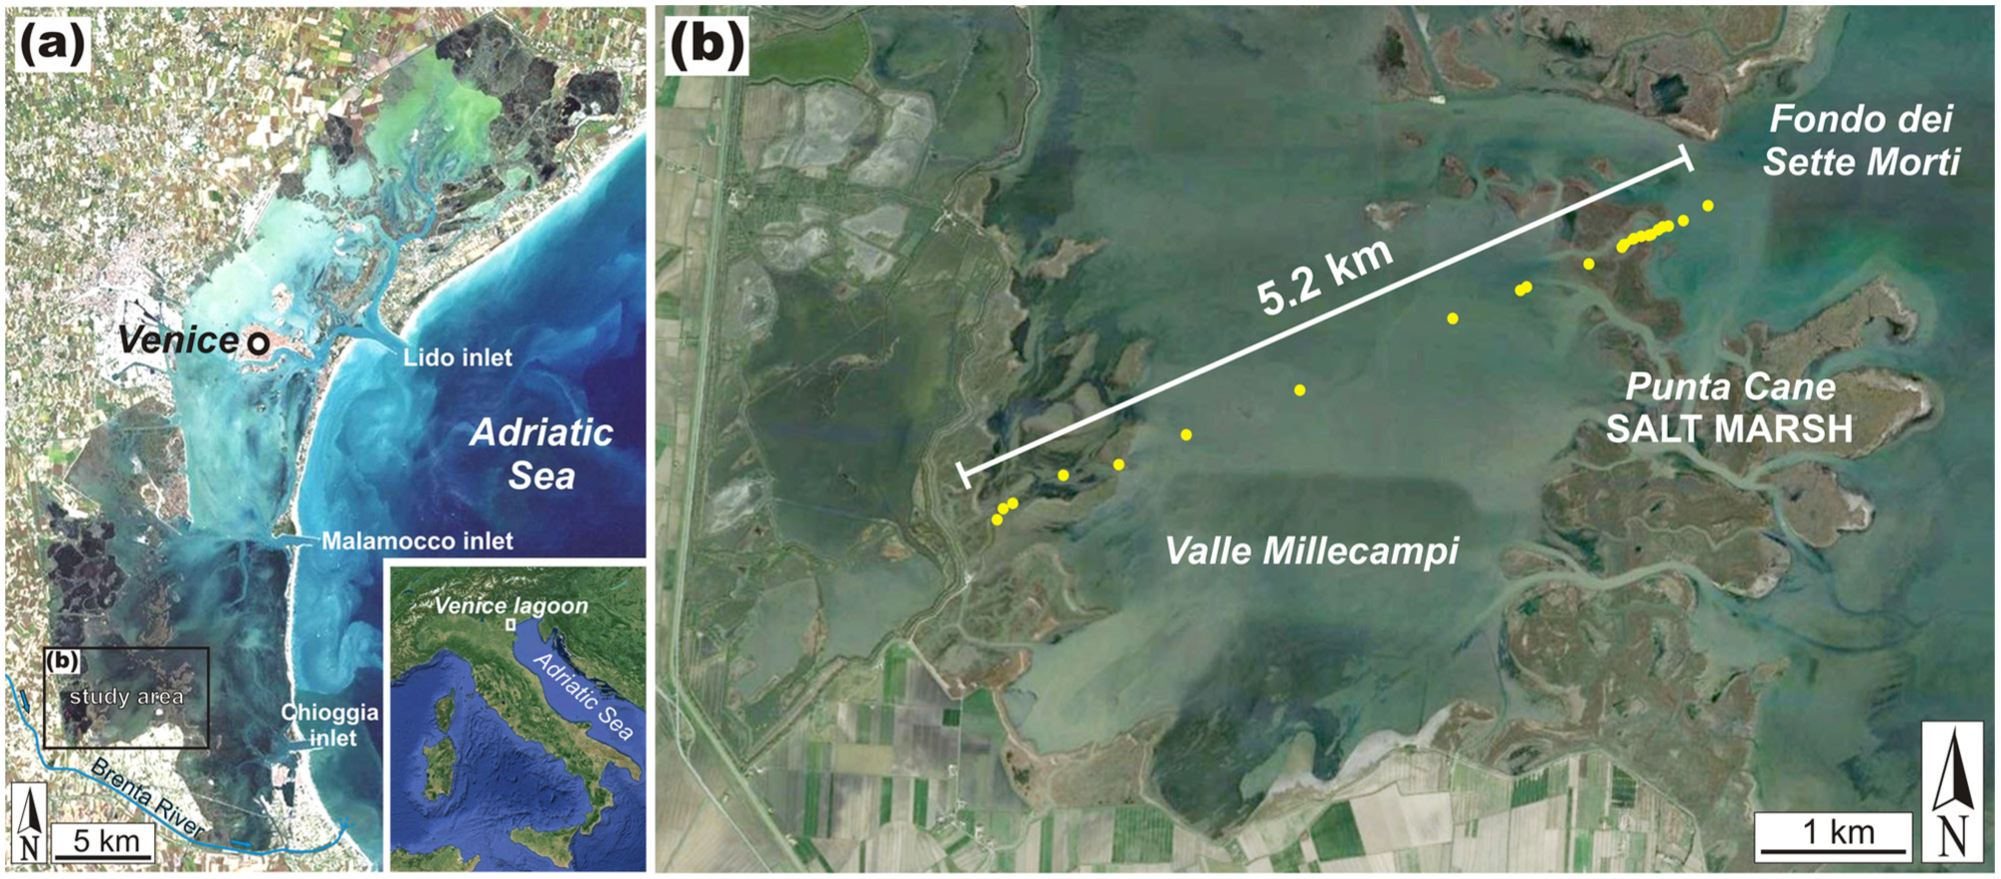
(a) Location of the study area in the southern Venice Lagoon, Italy. (b) Location of the 25 cores in the areas of Valle Millecampi, Punta Cane salt marsh, Fondo dei Sette Morti.
The Venice Lagoon started forming about 7000–6000 yr BP, as a consequence of the Holocene sea-level rise (Fontana et al., 2004), which produced flooding of a late Pleistocene alluvial system accumulated during the Last Glacial. Specifically, between 10 and 6 kyr BP, longshore drift currents triggered the formation of a barrier-island system that delimited the Venice Lagoon (Brancolini et al., 2008). The Holocene sedimentary succession in fact uncomfortably overlays the late Pleistocene alluvial deposits and is composed of three main seismic units separated by major stratal surfaces (Zecchin et al., 2008). The first unit accumulated under transgressive conditions and resulted from the infill of estuarine and/or fluvial channels. The second is composed of a highstand prograding wedge consisting of shoreface–shelf deposits and ebb tidal deltas, passing landward into back-barrier sediments. The third unit also accumulated during the highstand phase and mainly consists of lagoonal deposits associated with the development of complex branching and meandering tidal networks (e.g. D’Alpaos et al., 2005).
The study area is located in the southern portion of the Venice Lagoon (Figure 1a and b), where sedimentation took place from ~10 to 6 kyr BP (Zecchin et al., 2009) accumulating a 20- to 22-m-thick sedimentary succession (Brancolini et al., 2008; Tosi et al., 2007a, 2007b; Zecchin et al., 2008, 2009). During the past millennium, this area received significant amount of clastic sediments from the Brenta River (e.g. Amorosi et al., 2008; Fontana et al., 2004; Tosi et al., 2007b, 2009a), which was repeatedly diverted from and re-introduced into the Lagoon (e.g. Bondesan and Furlanetto, 2012; D’Alpaos, 2010a, 2010b).
Methods
This study focuses on a NE–SW trending, 5.2-km-long transect (Figure 1b) that cuts through salt marshes (Punta Cane), tidal flats, and subtidal platforms (Valle Millecampi and Fondo dei Sette Morti). Specifically, 25 sedimentary cores (from 1.0 to 1.5 m long) were recovered along the transect (Figure 1b). Study cores were recovered from different sub-environments (Figure 2a): 11 cores from salt marshes, 5 cores from tidal flats, and 9 cores from subtidal platforms. Cores were obtained through a prototypical steel corer which allows one to collect samples with a diameter of 10 cm and up to 1.5 m long. The recovery of the cores arises by pushing the corer vertically into the sediment. The mechanical block of the bottom of the corer avoids the loss of the sediment during the recovery of the sample. Cores with a diameter of 10 cm were required to collect a significant volume of sediment for geochronological analyses (e.g. to catch enough charcoal/wood fragments for radiocarbon dating). In order to evaluate sediment compaction because of sampling process, uncompacted cores (3 cm in diameter) were retrieved at each site using an Eijkelkamp hand auger. If not differently specified, de-compacted thicknesses are used in the text. The elevation and the geographic location of each core were determined using two Topcon GR-3 GPS receivers (dual frequency (L1/L2) and dual constellation (NavStar/Glonass) with integrated Tx/Rx UHF radio). Each core was halved lengthwise in laboratory. The first half was kept humid in the PVC liners and used for sedimentological and geochronological analyses, whereas the second was archived.
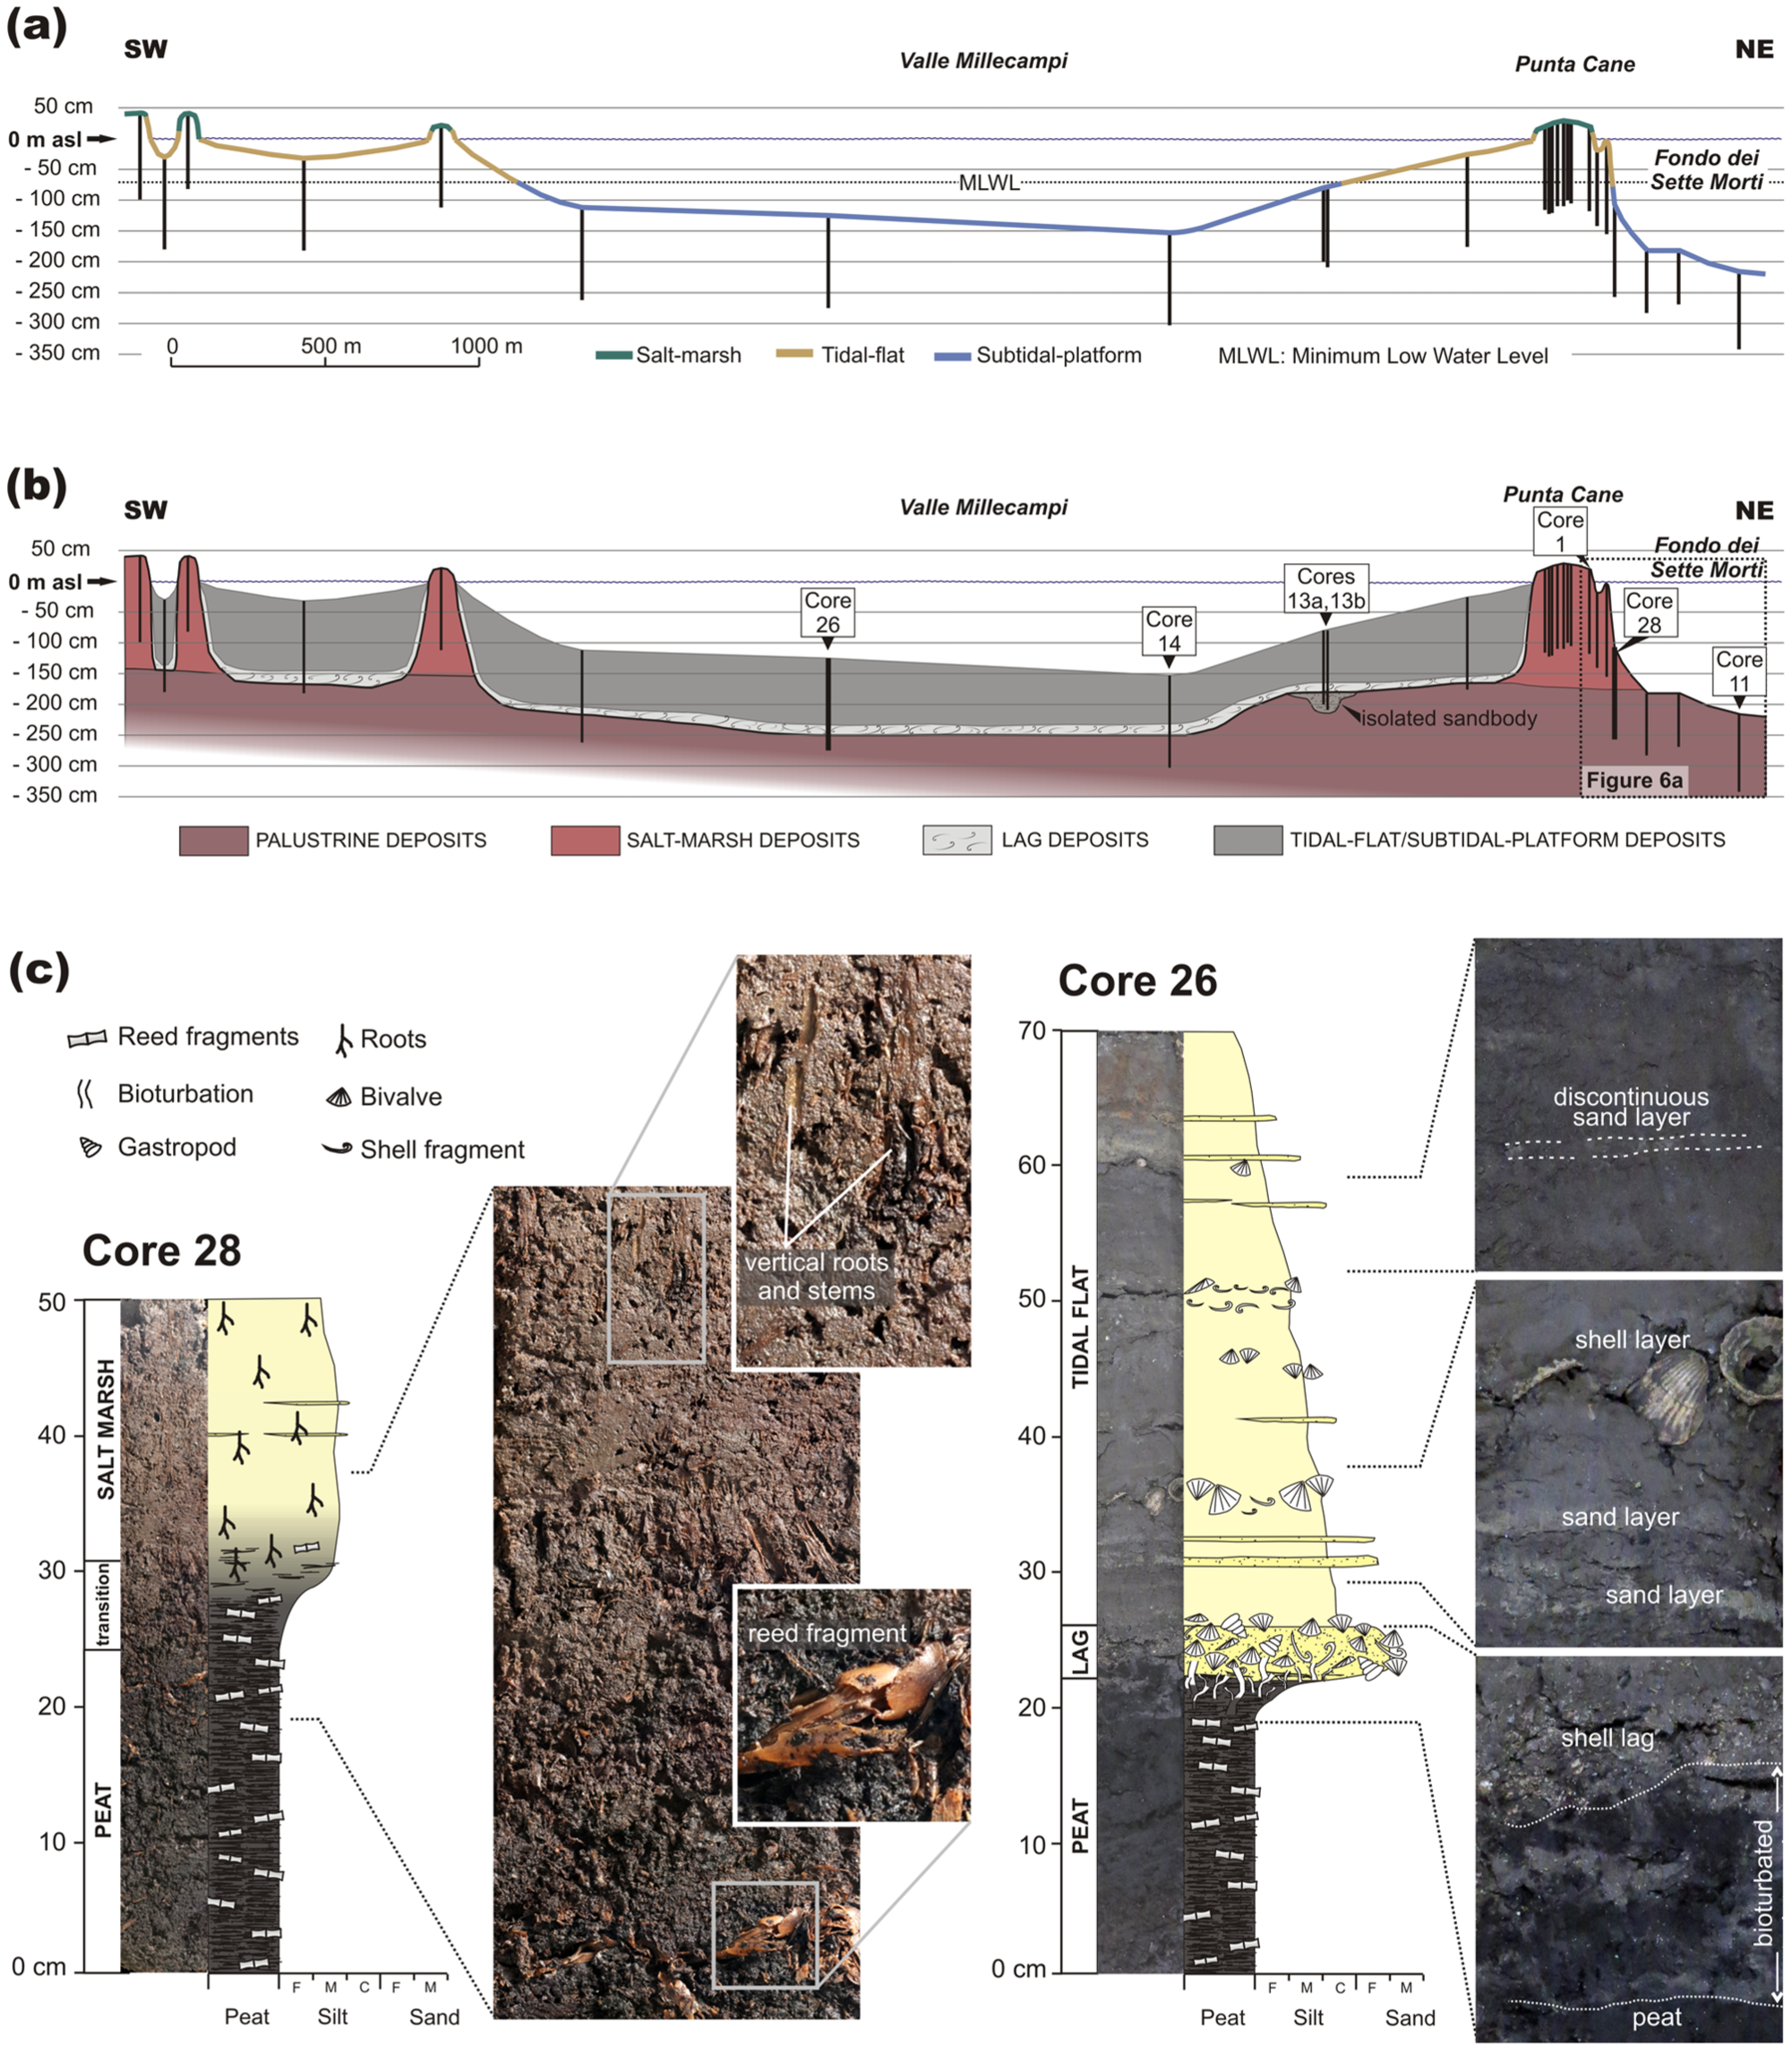
(a) Distribution of the 25 cores along the study transect. The three line colors represent the three different unchanneled lagoon sub-environments from a morphological point of view: green lines represent salt marshes, yellow lines are for tidal flats, and blue lines symbolize subtidal platforms. The length of each black vertical line represents the core length after the de-compaction process which arises from the calibration of the deposits’ depth with uncompacted guide-cores. (b) Interpretation of the study transect built on the basis of the sedimentological features and the spatial distribution of the four different sedimentary deposits. (c) On the left, sedimentological log of core 28: this core exhibits the transition between the basal peat and the salt-marsh deposit, which is characterized by a gradual decrease in the reeds content and a corresponding increase in the mud and halophytic roots content. On the right, sedimentological log of core 26: typical tidal-flat and subtidal-platform core of Valle Millecampi. The presence of widespread bioturbation marks the passage from the basal peat to the shell-rich lag, the latter representing the base of the organic-rich, blackish, massive, or laminated mud.
Sedimentological analyses
High-resolution sedimentological analyses were carried out on the study cores through the principles of modern facies analysis in order to define the distinctive features of different types of deposits and to link them with the corresponding sedimentary processes and depositional environments. Deposits were differentiated on the basis of their color, grain size, texture, sedimentary structures, and macroscopical biogenic content, which mainly consisted of shells, plant debris, and in situ vegetal remains. A high-resolution stratigraphic model was finally obtained correlating different types of deposits and related bounding surfaces along the transect.
Geochronological analyses
Geochronological analyses were carried out in two main areas of the study transect (Valle Millecampi area; Punta Cane and Fondo dei Sette Morti area). The Valle Millecampi zone was selected to date the onset of tidal-flat/subtidal-platform deposition (Figure 2b). Geochronological analyses were performed here through radiocarbon dating on samples from core 14 (Figure 2b).
The Punta Cane–Fondo dei Sette Morti area (Figure 1b) was studied in order to date the establishment of salt-marsh sedimentation and to frame in time the main changes in the depositional dynamics and aggradation rate. This zone was selected for geochronological analyses since the density and depth of cores allow one to investigate, at the highest resolution (Figure 2a and b), the maximum thickness of the deposits (about 3.70 m). Geochronological analyses were performed here through radiocarbon, 137Cs, and 210Pb analyses, which were carried out on three cores (cores 1, 28, and 11; Figure 2b), selected and correlated in order to build up a composite core with an overall thickness of about 3.70 m.
Radiocarbon analysis
Samples, consisting either of charcoals or vegetal remains (e.g. fragments of reeds, wood pieces, fragments of stems from halophytic plants in life position), were measured by 14C-accelerator mass spectrometry (AMS). The datable materials were recovered by directly picking from the cores. The larger and better preserved (i.e. lacking evidence for abrasion/reworking) specimens were selected during this process. Before the AMS measurement, samples were cleaned using the so-called acid–base–acid (ABA) procedure that allows one to remove any natural contaminations possibly because of carbonates and humic traces. Then, carbon was first extracted as gaseous CO2 by combustion and finally converted to solid graphite by reaction with hydrogen, in the presence of iron powder as catalyst. According to our typical laboratory quality check procedure, two graphite pellets were independently prepared from each of the pre-treated samples. AMS measurements were performed exploiting the dedicated beam line at the 3-MV tandem accelerator installed at INFN-Labec, Florence (Fedi et al., 2007). 14C/12C isotopic ratios were measured in unknown, standard, and blank samples, as well as 13C/12C ratios (to correct for isotopic fractionation). After verifying the consistency of these ratios for each sample from a statistical point of view, the best estimate of the radiocarbon concentration, and as a consequence the radiocarbon age, was calculated as the weighted average of the two measured pellets.
210Pb and 137Cs analyses
Geochronological analyses through 210Pb and 137Cs aimed at detecting three geochronological dates corresponding to the depth of (1) equilibrium of the 210Pb activity, (2) maximum 137Cs fallout from nuclear testing, and (3) 137Cs fallout from the Chernobyl accident. The analyses were carried out on the uppermost 70-cm sedimentary interval of core 1. This thickness is referred to the compacted core and corresponds to 85 cm of de-compacted salt-marsh deposits.
Alpha spectrometry of 210Po was used for 210Pb determinations, assuming secular equilibrium between the two isotopes. 210Po was extracted from the sediment with hot HNO3 and H2O2, in the presence of 209Po as a yield monitor, to account for extraction and counting efficiencies. After separation of the leachate from the residue, the solution was evaporated to near dryness and the nitric acid was eliminated using concentrated HCl. The residue was dissolved in 1.5 N HCl, and Po was plated onto a silver disk overnight, at room temperature. Iron was reduced using ascorbic acid (Frignani and Langone, 1991), and alpha decays were counted by a silicon superficial barrier detector connected to a multichannel analyzer. The analyses of the same sample with the two different 209Po internal standards used at ISMAR (Bologna) and MSRC (Stony Brook) gave statistically comparable results, thus suggesting that the analyses were accurate. Nevertheless, the precision of 210Pb analyses was also estimated by repeated measurements of the certified standard sediment IAEA 300 (Baltic Sea sediment), and the results were within the standard uncertainties. In addition, a successful intercalibration in the framework of the Euromarge-NB project was carried out (Sanchez-Cabeza et al., 1994). The precision, calculated from independent analyses of the same sample, was 4.6%.
137Cs was measured by non-destructive gamma spectrometry of dry samples in standard vessels of suitable geometries. The analytical accuracy was periodically checked by counting the international certificate standard IAEA Baltic Sea sediment, and the results were within the standard uncertainties. In addition, two international intercalibrations (IAEA Proficiency Test: Determination of Anthropogenic g-emitting Radionuclides in a Mineral Matrix, 2002; IAEA Proficiency Test: Determination of γ-emitting Radionuclides, 2006) yielded 137Cs activities within 4.1% and 1.6% of the IAEA accepted values, respectively. The precision, estimated by repeated analyses of the same sample, ranged between 2% and 3%. Efficiencies on 10 mL geometries (3.12–3.18%) were calculated through a series of standards obtained by spiking old sediment with a known amount of the Amersham QCY58 multi-peak standard solution. The analytical detection limit for 137Cs was 3 Bq kg−1.
Accretion model
The calibration of the measured radiocarbon ages was performed using the Bayesian approach, which is based on the idea of the conditional probability. When dealing with a set of events, one may a priori know how these events are distributed along time, that is, one may know how they can be arranged in a chronological model. Then, one can use observations, that is, measurements (constituting the so-called likelihood), to evaluate how the original prior information is modified by the measurements themselves. A posteriori distribution of probability for the calibrated ages of each of the samples is finally obtained which describes the set of events to be dated. In this case, a chronological model of the samples of Punta Cane–Fondo dei Sette Morti areas was built a priori by considering the sampling depth (i.e. stratigraphic position) of the dated materials. It may be guessed that the sample collected from the layer at the bottom of the core is the oldest; the sample taken in the layer immediately above should be younger than the previous one but older than the others in the upper layers, and so on. The OxCal 4.2 (Bronk Ramsey, 2009) software was used. Different models can be used in OxCal to describe the deposition process, depending on, for example, any possible variation in the accumulation rate. In the case of our samples from the Venice Lagoon, we can expect that the deposition process was random, so we applied the P_Sequence model (Bronk Ramsey, 2008). In this model, we assume that along the dated succession, the deposition rate may have fluctuations (according to Poisson statistics). We can choose the guessed number of the accumulation events per unit depth (the so-called ‘k parameter’ in OxCal): the higher the k, the more uniform the expected sedimentation rate. We assumed a k parameter of 0.1 cm−1 (corresponding to 1 accumulation event per 10 cm depth). We also allowed the model to estimate the age distributions of probability of events that had not to be directly dated, considering them every 20 cm. The IntCal13 calibration curve (Reimer et al., 2013) was used in OxCal as reference.
To run the P_Sequence model, the likelihood, that is, the set of our observations, was built integrating the radiocarbon data with samples dated by the 137Cs and 210Pb series.
Results
The study transect develops over a topographic relief of about 2.50 m (from +41 cm above MSL to −216 cm below MSL) and investigates up to 3.70 m below the modern salt-marsh surface (Figure 2a). Salt-marsh areas show an elevation ranging between 16 and 41 cm above MSL, with the lower values located in the Punta Cane area. Salt marshes are surrounded by bare tidal flats which extend up to 70 cm below MSL (Figure 2a). A maximum water depth of 1.53 and 2.16 m below the MSL was measured in the subtidal platforms developed in the Valle Millecampi and Fondo dei Sette Morti, respectively (Figure 2a).
The study deposits
Sedimentology
Five different types of deposits were recognized through sedimentological analyses of the recovered cores. The deposits are described and interpreted in the following.
Palustrine deposits
They are at least 2 m thick and consist of peat with abundant fragment of reeds, which can be up to 15 cm long (Figure 3a). They occur in all the cores exceeding the depth of 1.5–2 m below MSL (Figure 2b). Peat consists of comminuted plant debris, is massive, and contains a minimum amount of dispersed mud and very fine sand. Occasional reeds in sub-vertical positions have been recovered from core 11. The peat can either grade upward into salt-marsh mud (core 28 in Figure 2c) or be abruptly overlain by a shell-rich lag (core 26 in Figure 2c). The basal part of the peat was not encountered in any core.
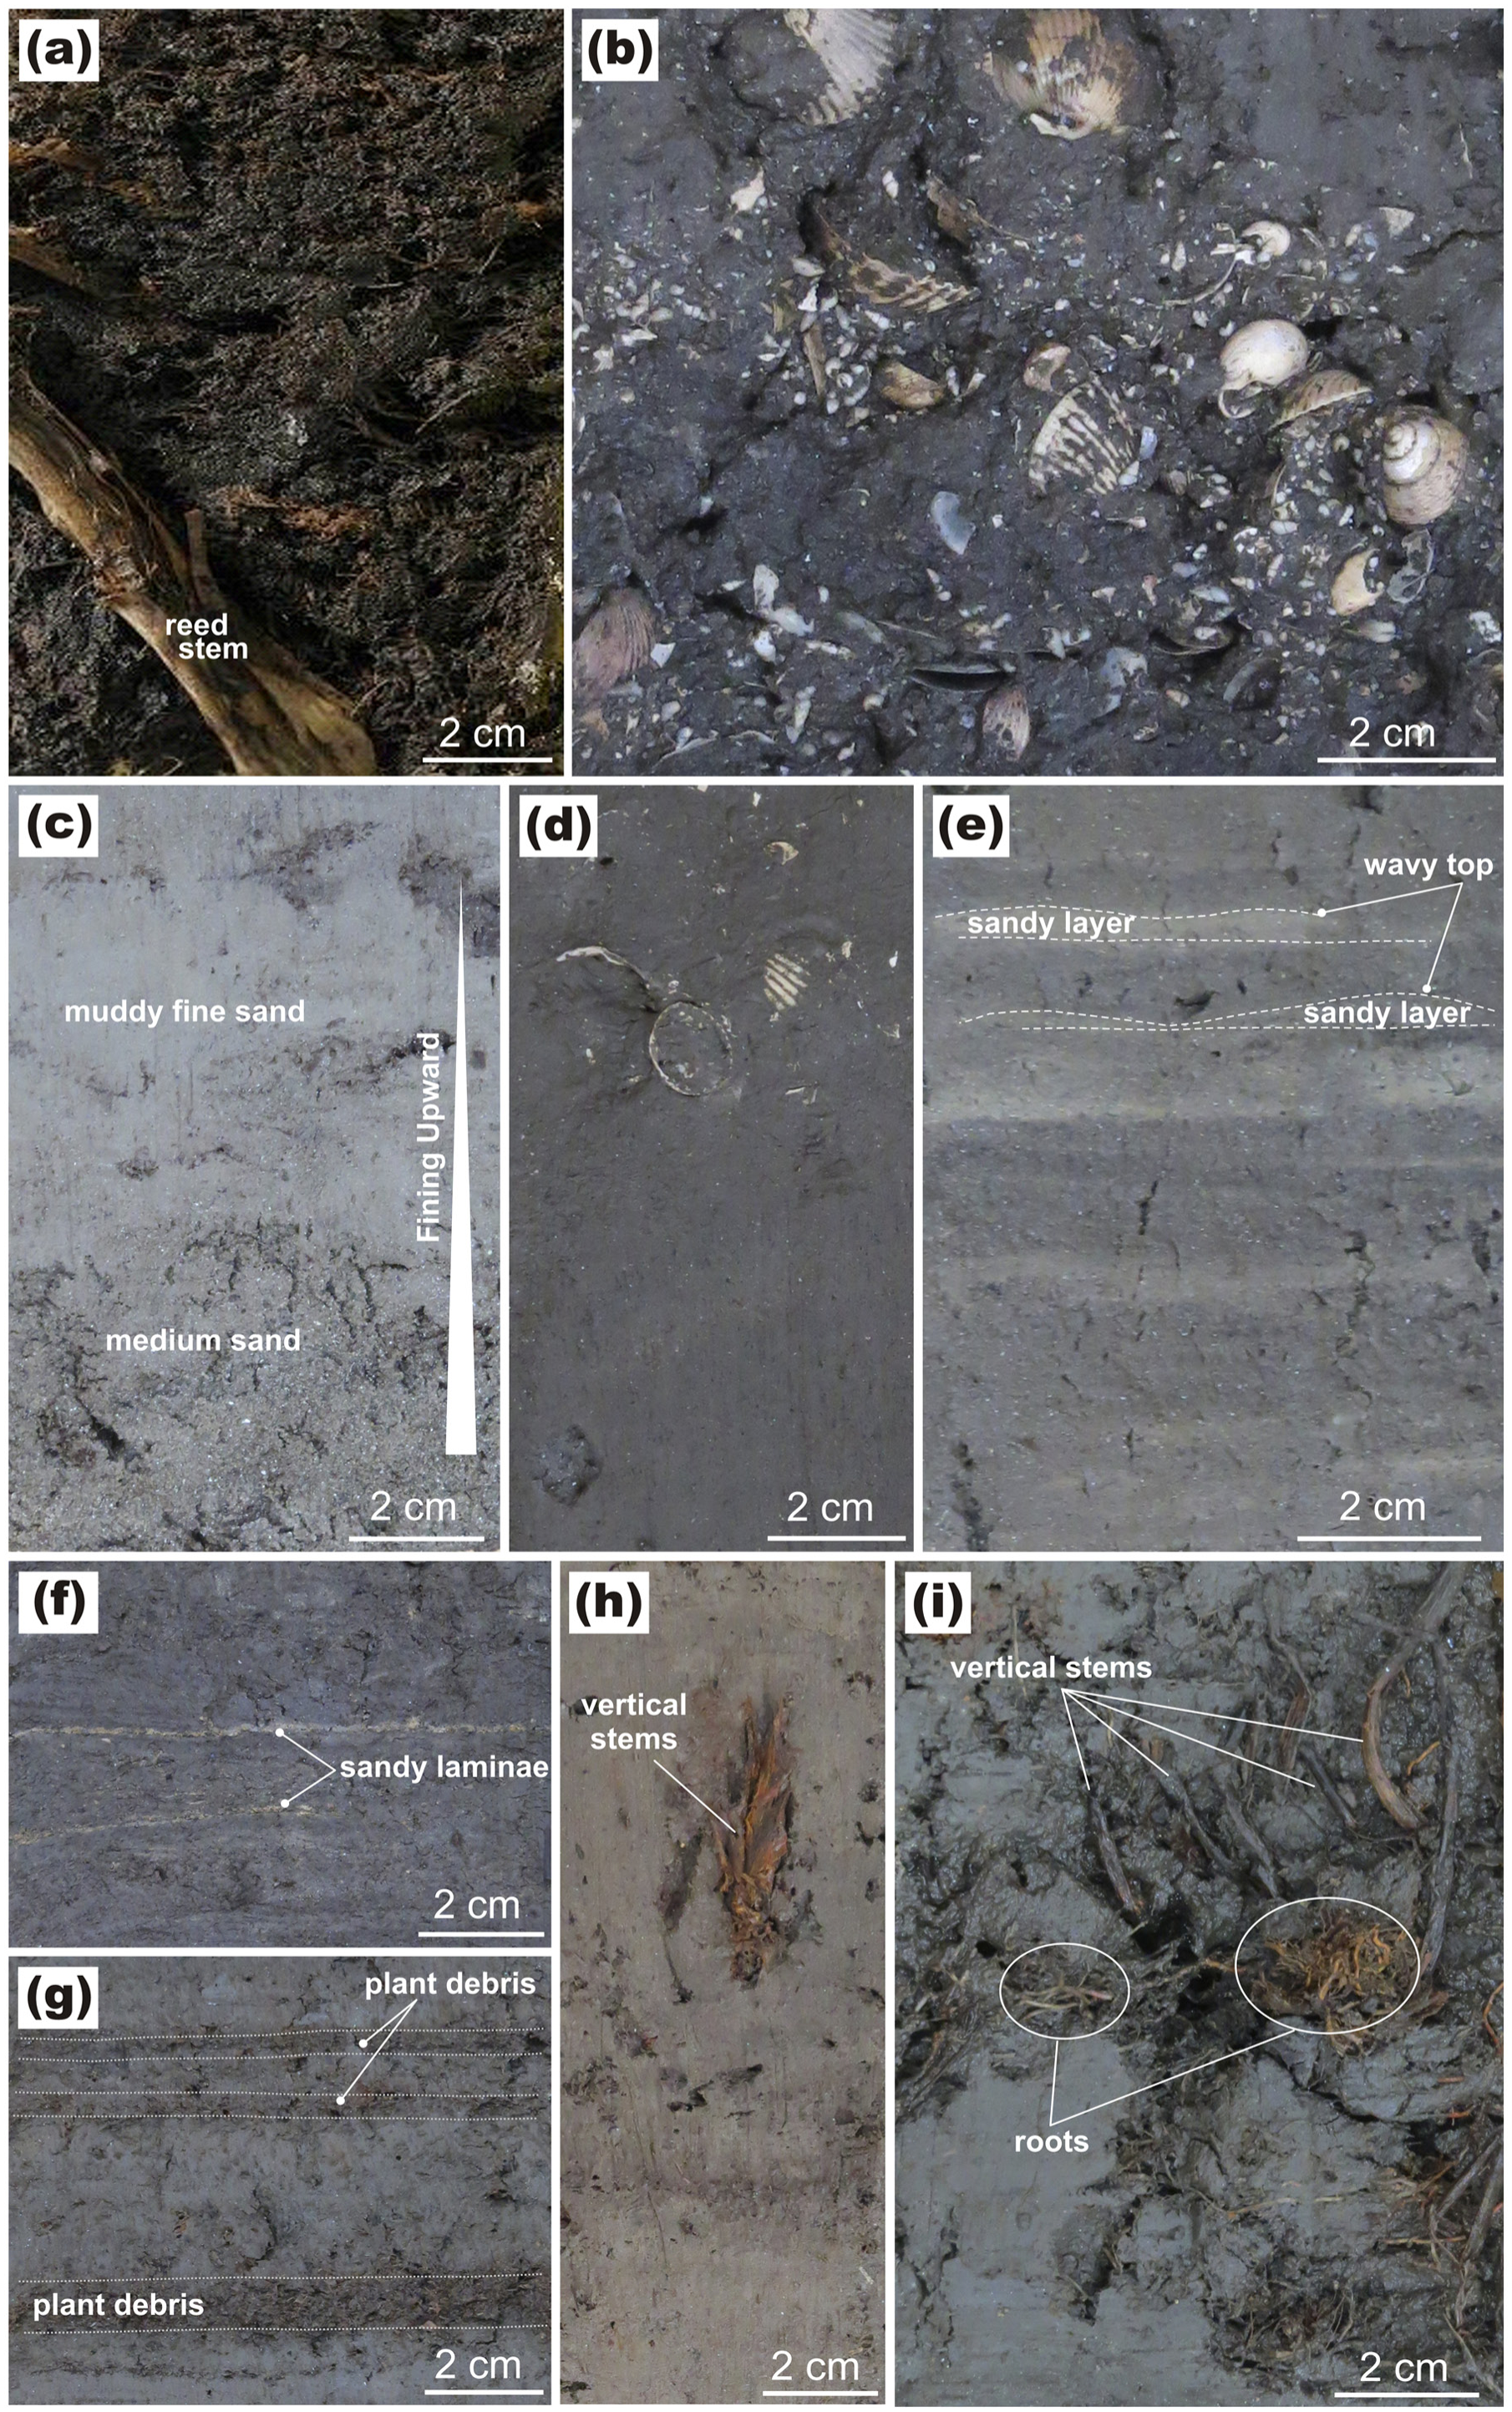
Sedimentary facies of the study deposits. (a) Peat deposit with fragment of reeds from millimetric to decimetric in size. (b) Shell-rich lag deposit. (c) Sandy to muddy-sandy paleo-channel deposit. (d) Massive tidal-flat/subtidal-platform deposit with shells. (e) Laminated tidal-flat/subtidal-platform deposit. (f) Sub-millimetric fine to medium sand layers in salt-marsh brownish silt deposit. (g) Organic material organized into layers in salt-marsh brownish silt deposit. (h and i) Plant debris in life position in the salt-marsh brownish deposit.
In the NE sector of the Valle Millecampi subtidal platform, two adjacent cores show that sandy deposits locally occur laterally to the peat (cores 13a and 13b in Figure 2b). At these sites, the steel corer was not able to penetrate deeper than 15 cm in the sandy deposit. This deposit consists of medium sand grading upward into a very fine sand (Figure 3c). The medium sand is well sorted and contains scarce matrix, whereas fine sand is rich in mud and contains abundant plant debris.
Peat deposits are interpreted to be formed in a palustrine setting, where vegetal remains were transported as debris or produced in situ, as attested by the occurrence of sub-vertical reeds, which probably were buried in life position. In this framework, the sandy deposits occurring in the NE sector of the Valle Millecampi area could represent the infill of a fluvial/distributary channel draining a densely vegetated coastal plain. The presence of a thick sandy interval could explain the scarce penetration depth of the corer. The occurrence of a progressive fining upward of the sandy unit, suggesting the progressive deactivation of the channel, supports this hypothesis.
Lag deposits
These deposits are up to 15 cm thick and occur only in cores located in subtidal platforms and tidal-flat areas. They consist of fine sand fining upward into muddy silt. Sand is very rich in shells and shell fragments (Figure 3b). Bivalves are commonly disarticulated and abraded, although few specimens of Cerastoderma glaucum have been found in life position. Sand is mainly massive, although a subtle horizontal layering can be locally defined by shell concentration (Figure 3b). Wood fragments, up to 1 cm in size, are also common. Bioturbation is intense, although distinct burrows can be rarely distinguished. These shell-rich sands overlay palustrine peat and grade upward into muddy subtidal-platform deposits (core 26 in Figure 2c). They can be followed for several hundred meters along the study transect (Figure 2b).
The dominance of sand and the concentration of shells suggest that these deposits were winnowed and deprived of their muddy fraction. This is consistent with their interpretation as wave-winnowed lags. The occurrence of fragmented and disarticulated shells, along with the considerable lateral extent, the fining-upward grain size trend, and the abrupt basal surface, strongly supports this observation.
Tidal-flat/subtidal-platform deposits
They are up to 1.30 m thick and consist of dark, organic-rich mud with subordinate sandy layers (Figure 3d and e). Mud is massive and contains scattered plant fragments. Shells can be isolated or they can form localized concentrations (Figure 3d). Bivalve Cerastoderma glaucum occurs in life position. Sandy layers are up to 1 cm thick and commonly show a lenticular geometry with a flat base and a wavy top (Figure 3e). They consist of fine to very fine moderately to well-sorted sand and are frequently disturbed by intense bioturbation. These deposits occur only in cores located in subtidal platform/tidal-flat areas and conformably overlie shell-rich lag sand.
Dominance of mud indicates settling from sediment suspension in a low-energy setting, which is consistent with a tidal-flat or subtidal-platform depositional environment. Sandy layers and localized shell concentration developed during storm events, when wind waves suspended the mud causing concentration of coarser deposits (e.g. sand) on the depositional interface. The wavy top of sandy layers indicates local preservation of wave-generated ripple forms and supports this interpretation.
Salt-marsh deposits
These deposits are up to 2.0 m thick and occur only in cores recovered from salt-marsh areas. They consist of a horizontally laminated, bioturbated, brownish mud, with a variable amount of fine to very fine sand (Figure 3f and g). Several mud laminae are dark brown and appear to be very rich in plant debris (Figure 3g) and wood fragments. Sand is mainly concentrated in millimetric, whitish, horizontal laminae (Figure 3f), which are characterized by a sharp base and good grain size sorting. Roots and vertical stems up to 0.5 cm in diameter are common (Figure 3h and i).
These deposits accumulated in a salt-marsh environment, in the highest portion of the intertidal zone that was commonly affected by subaerial exposure allowing the growth of a dense halophytic vegetation canopy. Muddy deposits likely settled during the tidal cycle and in particular around high water slack, at the transition between the flood and ebb phases of the tide. Sandy laminae were generated during storm events when the marsh surface was flooded and when wind-generated waves winnowed the salt-marsh surface, suspending mud and concentrating sand. The presence of a sharp base, good textural sorting, and lack of a muddy matrix in the sandy laminae support the latter observation.
Stratigraphy
Palustrine peat represents the substrate of the study succession along most of the transect (Figure 2b). Above the basal peat, both salt-marsh and tidal-flat deposits occur. In the Valle Millecampi area, the basal peat is abruptly overlaid by the shell-rich lag deposit (see, for example, core 26 in Figure 2c), which shows its maximum thickness in the central, deepest parts of the Valle Millecampi depression and becomes progressively thinner toward its margins (Figure 2b). The lower boundary of the shell-rich lag is commonly disrupted because of intense bioturbation (e.g. core 26 in Figure 2c). Muddy tidal-flat/subtidal-platform deposits overlie the shell-rich lag and are widespread in the Valle Millecampi. These deposits are characterized by an overall fining-upward grain size trend from fine sand to mud (e.g. core 26 in Figure 2c). In the Punta Cane area, where salt marshes are presently well developed, the basal peat grades upward into salt-marsh deposits, which are about 1.80-m-thick in this area. The transition between the basal peat and salt-marsh deposits occurs within about 20 cm and is characterized by a gradual decrease in the content of reed fragments, which occurs in parallel with an increase in root traces and mud content (i.e. core 28 in Figure 2c). Moving from Punta Cane toward the Fondo dei Sette Morti basin, the 1.80-m-thick salt-marsh deposits pinch out about 170 m NE of the modern salt-marsh edge (Figure 2b). In this area and in the western margin of the Fondo dei Sette Morti basin, the shell-rich lag and overlying mud are missing, and the basal peat and salt-marsh deposits are exposed at the depositional interface (Figure 2b).
Age of the study deposits
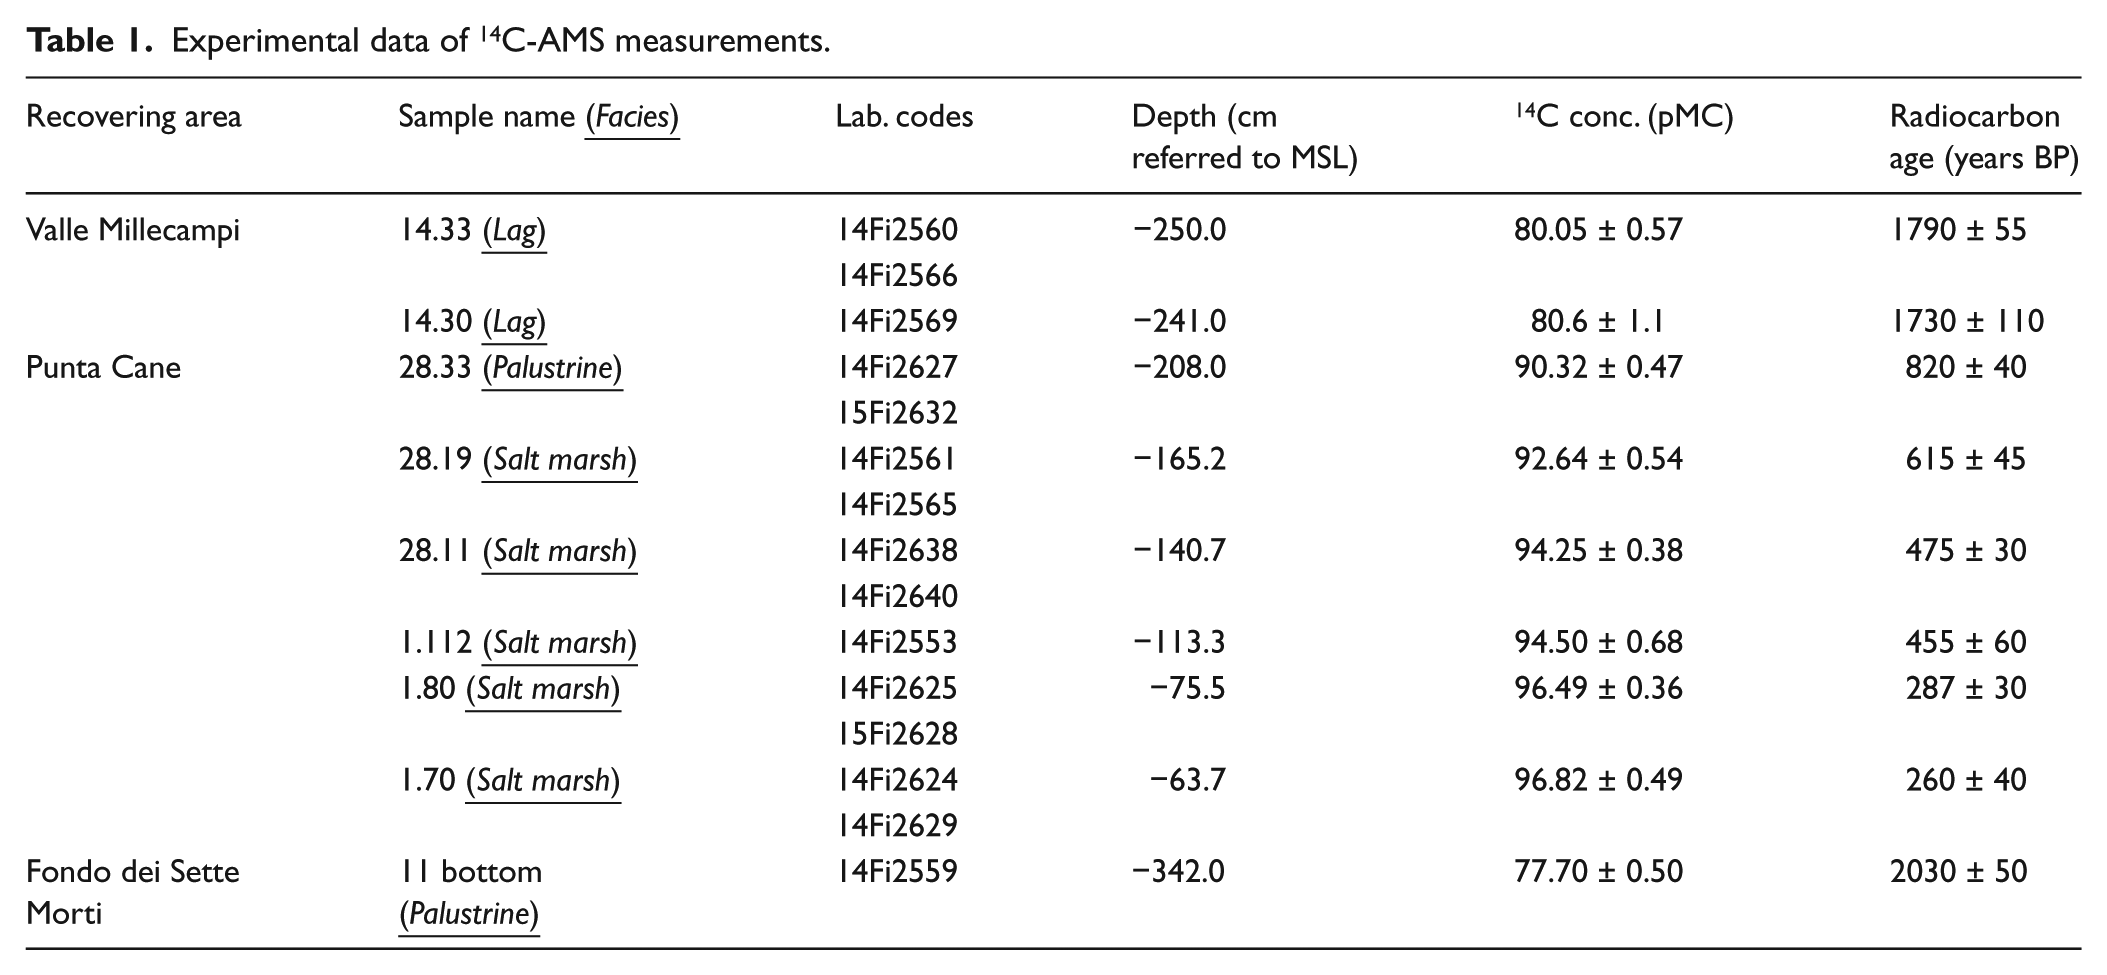
Table 1 shows the experimental results of 14C-AMS measurements performed in Valle Millecampi, Punta Cane, and Fondo dei sette Morti areas. The best estimate of the radiocarbon concentration and the corresponding radiocarbon age were calculated as the weighted average of the two measured graphite pellets (see the ‘Lab. codes’ column in Table 1). Only in the case of samples 14.30 and 1.112, the low amount of the residual mass after the ABA pre-treatment allowed us to prepare just a single graphite pellet. Data are quoted at 1 sigma uncertainty.
Experimental data of 14C-AMS measurements.
The Valle Millecampi area
Samples from Valle Millecampi, which were collected from the shell-rich lag to establish the onset of the deposition in this basin, provided low-quality results. This is likely because of the reworking of charcoal and wood materials during the formation of the wave-winnowed lag. As a whole, despite the significant errors in the calibrated ages, these results suggest that the age of lag deposits spans between the second and fifth centuries.
The Punta Cane–Fondo dei Sette Morti areas
In the Punta Cane and Fondo dei Sette Morti areas, the seven dated samples are distributed along the composite core 1-28-11 at different depths (Table 1), which are referred to current MSL. As a whole, radiocarbon dating shows that the oldest peat deposits are dated at 0 ± 60 cal AD and occur at 3.40 m below MSL. The transition between palustrine peat and salt-marsh deposits is dated at
The 210Pb activity profile of core 1 (Figure 4a) reaches the equilibrium depth at 55 cm (compacted thickness) from the core top and allows us to set AD 1900 at the depth of 50 cm (compacted thickness) from the marsh surface. The 137Cs activities show a clear trend (Figure 4b), and the peaks at 7.5 and 25.5 cm from the core top (compacted thickness) are associated with AD 1986 (fallout from the Chernobyl accident) and AD 1963 (maximum 137Cs fallout from nuclear testing), respectively. These depths were corrected through the comparison with the corresponding uncompacted cores retrieved using the Eijkelkamp hand auger. This process allowed us to locate the 1900, 1963, and 1986 ages at depths of 60, 30.6, and 9 cm from the core top, respectively.
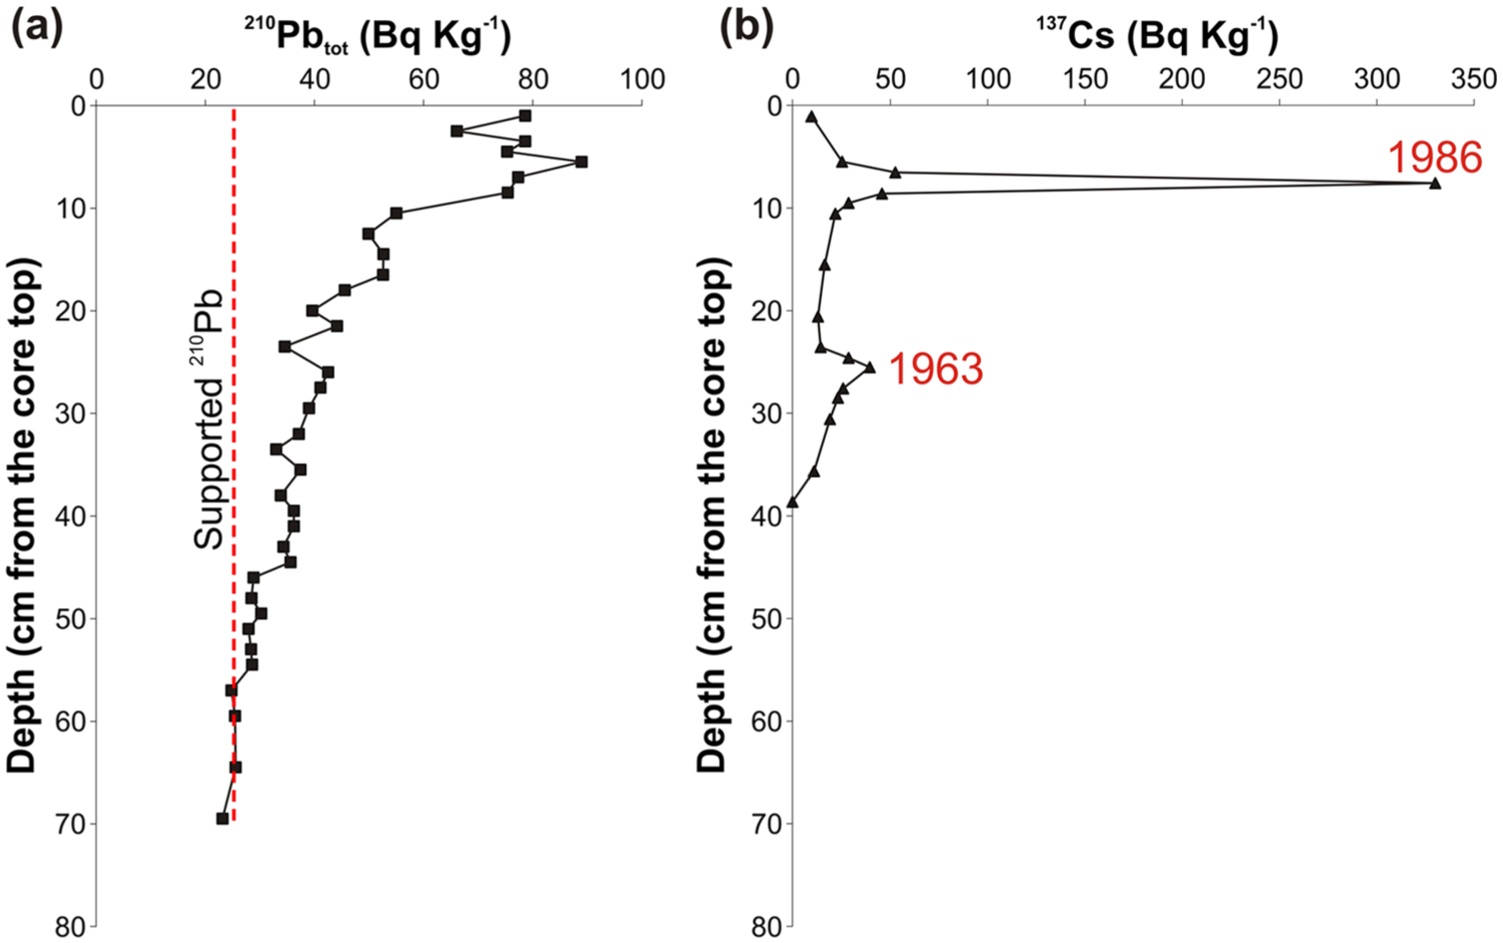
(a) 210Pb and (b) 137Cs activity–depth profiles in core 1. The y-axes represent the depth from the top of core 1 before the de-compaction process.
The accretion model arises from the calibration of the measured radiocarbon ages, performed using the P_Sequence model, and adding the three more recent ages obtained from 210Pb and 137Cs series. Agreement index is indeed 99%, with the individual agreement index of each sample well above the threshold of 60% (i.e. minimum value that should be considered for a good fitting between data and model).
In Figure 5, the calibrated age of each sample is plotted as the mode of the posterior distribution of probability (colored dots). The error bars indicate the extremes of the probability time intervals quoted at both 68% and 95% probability levels (red and blue error bars, respectively) evaluated from the posterior distributions of probability.
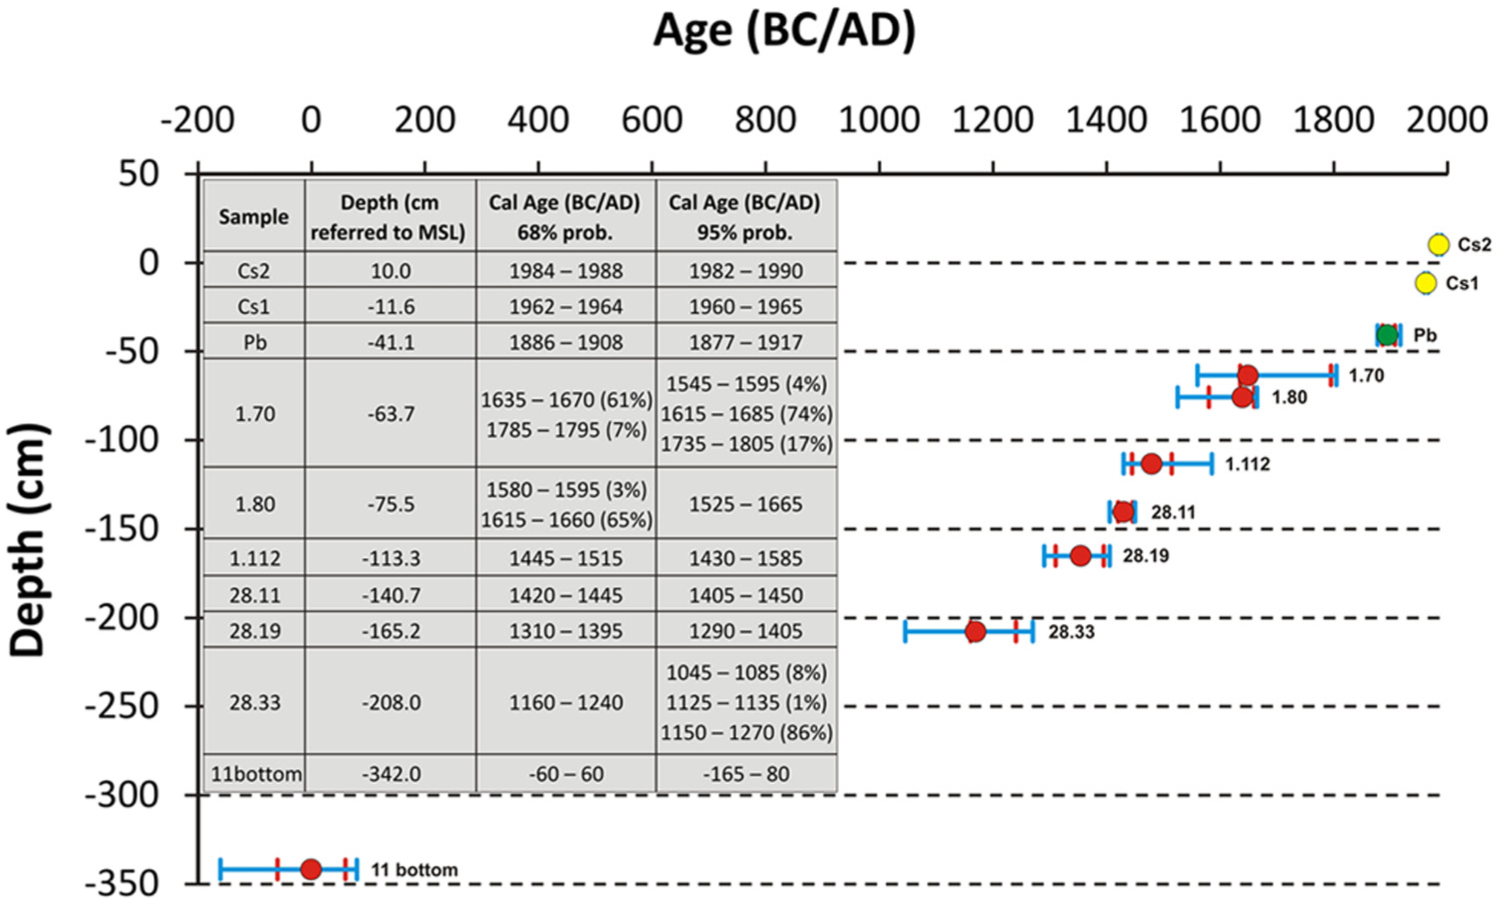
Calibrated ages of the measured samples plotted versus the sampling depth after the de-compaction process. For each sample, the mode of the posterior distribution of probability as determined applying the P_Sequence model is shown: the dots indicate the mode values for each sample; the color of each dot represents the employed geochronological methods in the determination of the age (red, green, and yellow indicate radiocarbon, 210Pb, and 137Cs analyses, respectively); error bars indicate the extremes of the calibrated age interval at both 68% (in red) and 95% (in blue) of probability. The inset shows the results of the P_Sequence model; when more than one interval was calculated for each level of confidence, the probability for each definite interval is also shown in brackets.
Although it is well known that there is no good point estimation of the true calendar age of a radiocarbon dating, the mode of the distribution may be taken as an acceptable approximation (Michczyński, 2007). Figure 6a and b shows distribution of dated samples in the sedimentary succession of the Punta Cane–Fondo dei Sette Morti area. The age of ach sample is represented as the mode value of the calibrated age quoted at 68%. Vertical radionuclide dating distribution (Figure 6b) highlights the changes in aggradation rate over the past two millennia. The inset in Figure 6b shows the aggradation rate trend as a function of time. As a whole, the sedimentation rate along the study succession considering the mode values tends to gradually increase from AD 0 to AD 1480 (i.e. from 340 to 113 cm below the MSL), with values growing from 0.11 up to 0.55 cm yr−1. During the 16th century (i.e. from 113 to 75 cm below MSL), the accumulation rate decreased to 0.24 cm yr−1 and successively abruptly increased to 1.18 cm yr−1. Between AD 1650 and AD 1986 (i.e. from 75 cm below MSL up to 10 cm above MSL), the sedimentation rate increased from 0.09 to 0.94 cm yr−1. Finally, from AD 1986 to nowadays (i.e. from 10 to 19 cm above MSL), the average salt-marsh accretion rate is about 0.33 cm yr−1.
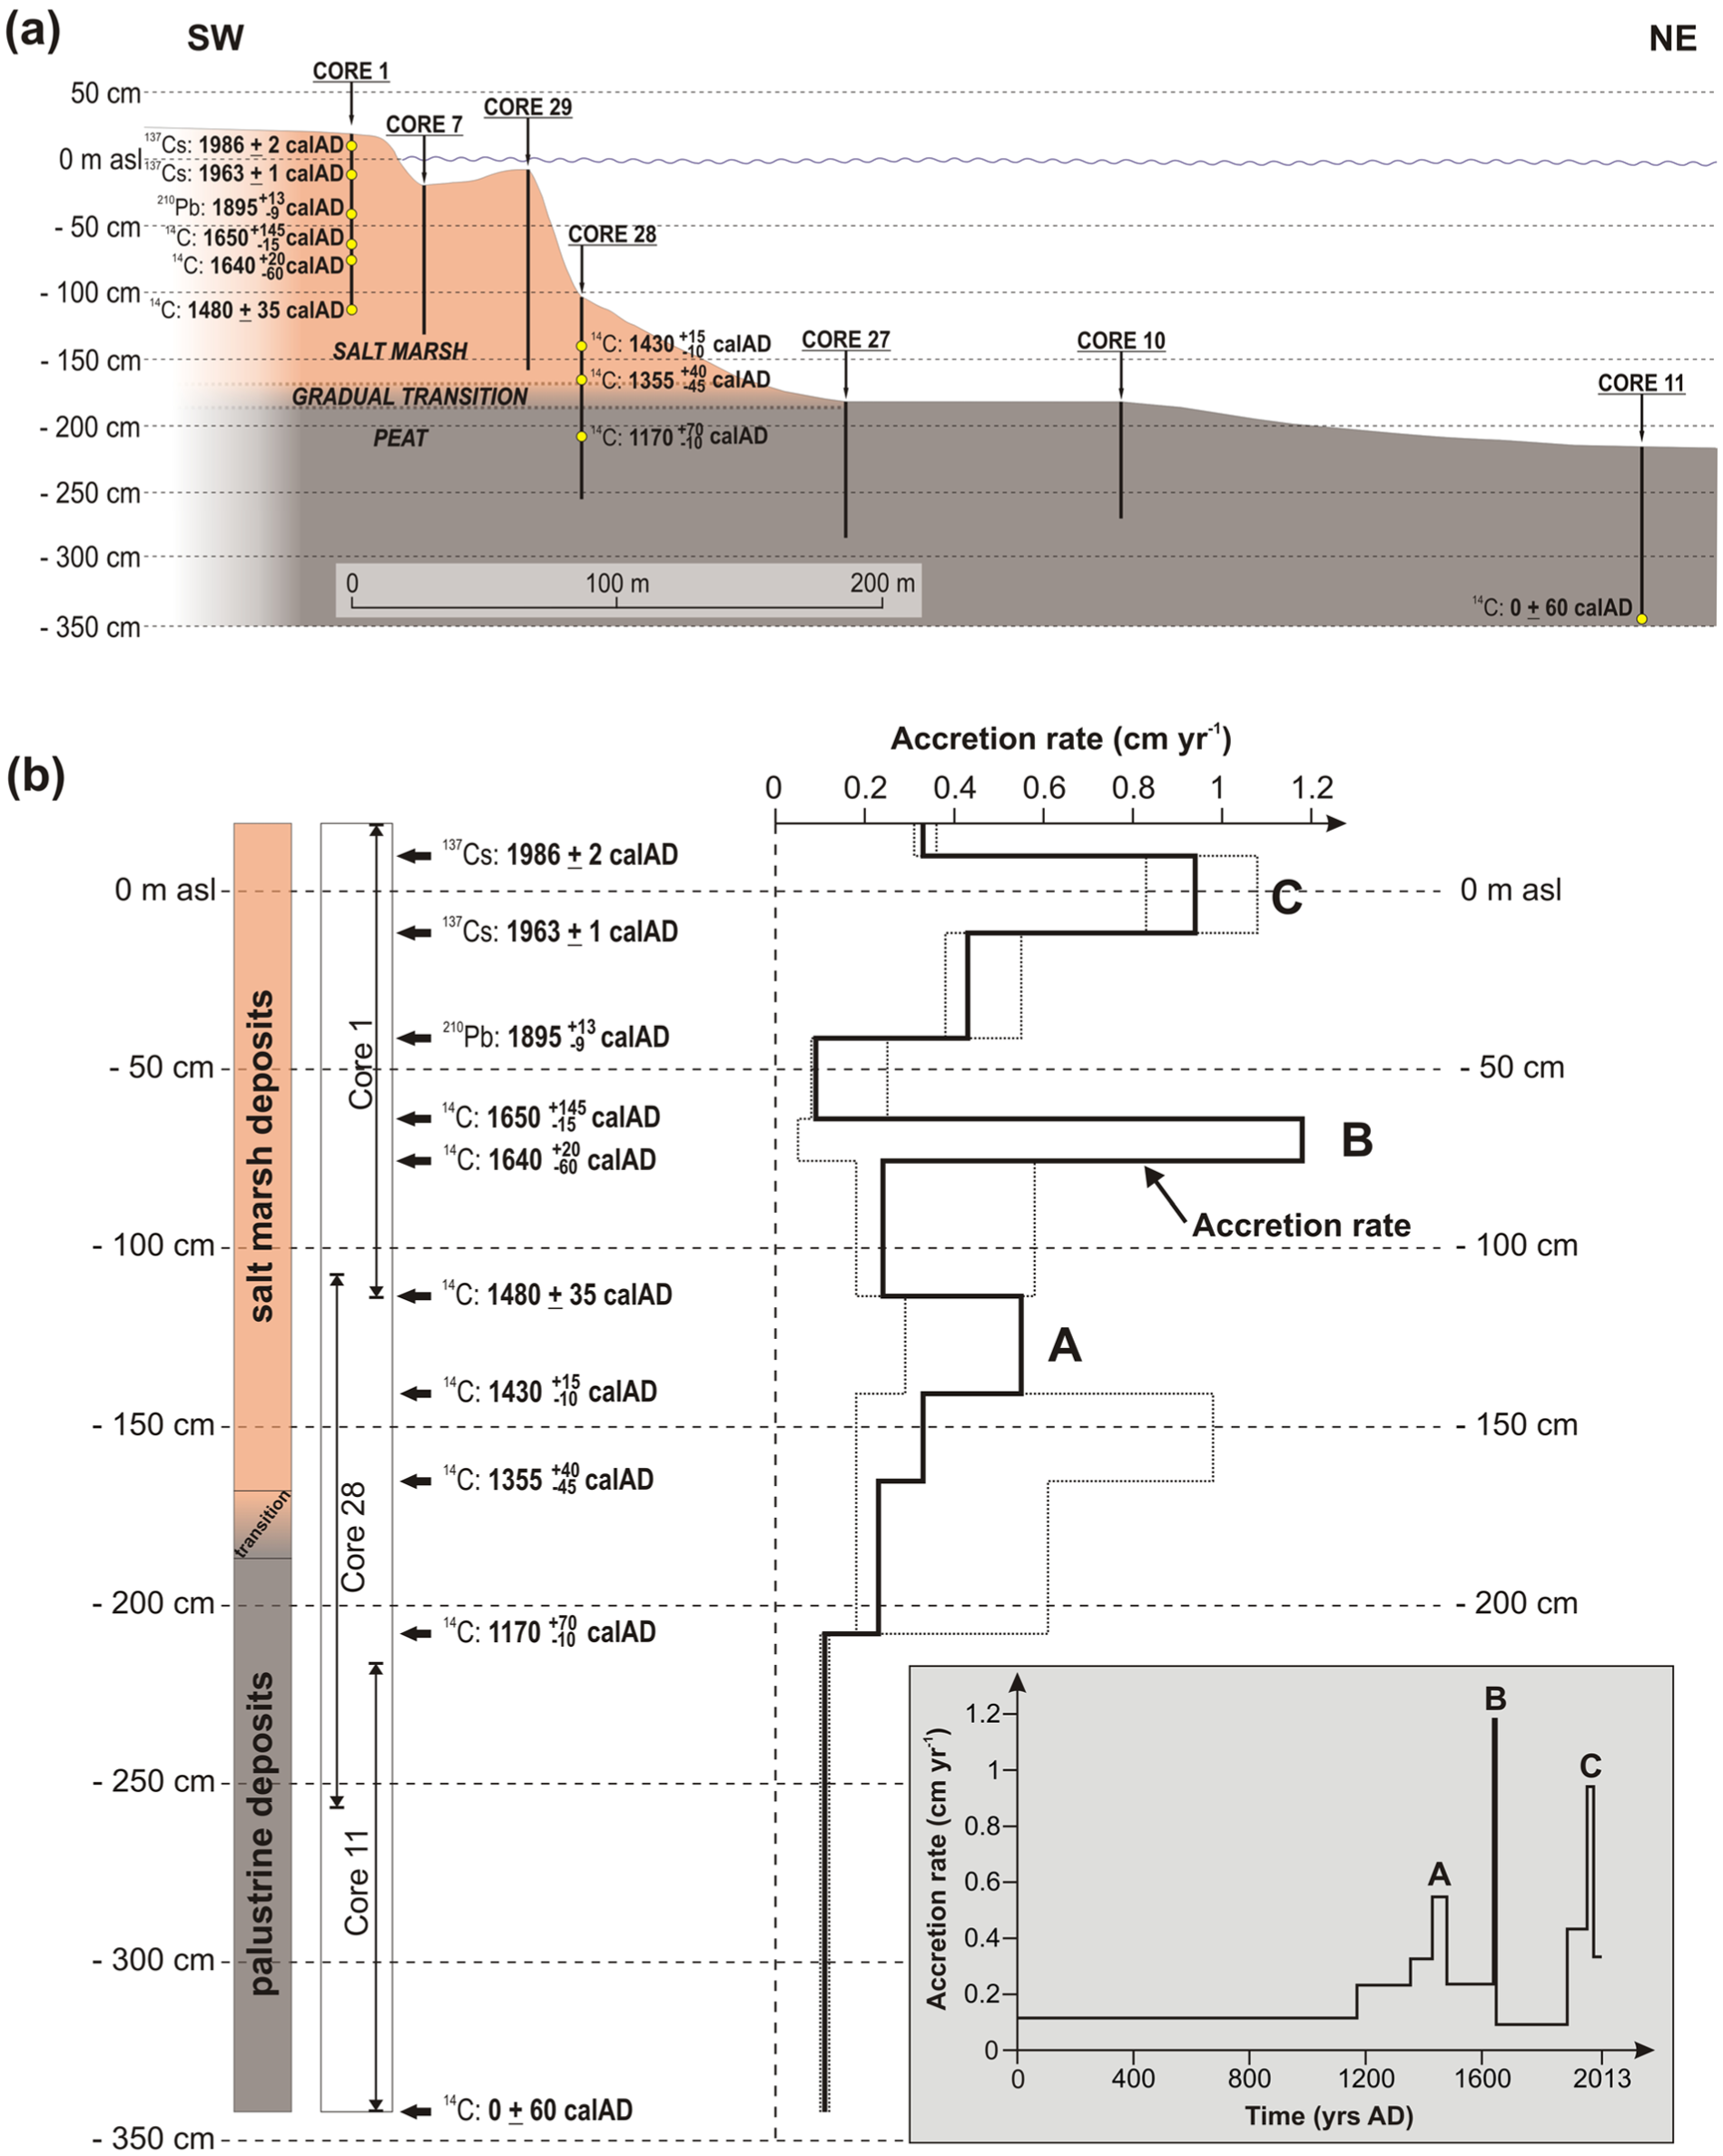
(a) Detailed representation of the seaward part of the study transect. The sedimentary succession involves the peat deposit which gradually passes to the salt-marsh deposit. The yellow dots represent the uncompacted depths of the dated samples. Each age reports the employed geochronological method (14C, 210Pb, 137Cs), the mode value obtained from the age distribution, and the errors of the calibrated age interval at 68% of probability (see Figure 5). (b) The depths of each dated sample are represented in a schematic continuous sedimentary succession built up from cores 1, 28, and 11 after the de-compaction process. Each sample age is expressed as the mode value in the distribution and the errors represent the age interval at 68% of probability. On the right, the accretion rates are plotted versus the depth intervals. The black line represents the accumulation rate trend considering the mode values; the two dashed lines represent the minimum and the maximum accumulation rates considering the result of the calibrated age intervals at 68% of probability. The inset shows the accretion rate as a function of time. A, B, and C represent the three positive peaks in the accumulation rates which are consistent with the introduction of the Brenta River into the Lagoon.
Discussion
Depositional history of the Valle Millecampi area
In the Valle Millecampi area (Figure 2a and b), the basal palustrine peat is overlaid with tidal-flat/subtidal-platform mud which is floored by a shell-rich sandy lag. The age of the lag deposits suggests that the Valle Millecampi swamp was flooded (i.e. turned into a tidal flat/subtidal platform) between the second- and fifth-century AD. The oldest historical map providing qualitative information about the distribution of salt marshes, tidal flats, and tidal/fluvial channels of the Venice Lagoon dates back to the 1556 (Cristoforo Sabbadino map). After proper geo-referencing the above map, the presence of a tidal flat in the area of Valle Millecampi (Figure 7a) is suggested. Therefore, during the 16th century, the Valle Millecampi basin was already well developed and sufficiently extended to allow wind-generated waves to produce bottom shear stresses capable to suspend sediments from the bottom of the Valle Millecampi basin, as documented by the occurrence of the storm-generated sandy layers within the mud overlying the shell-rich lag. The occurrence of these storm-induced layers in the upper part of the muddy succession (e.g. core 26 in Figure 2c) indicates that the basin has never become deep enough to prevent winnowing of the depositional interface during wind storms. This constant wave winnowing of the basin floor, which started between the second- and fifth-century AD (i.e. 1900–1600 years before present), caused suspension and removal of fine sediments (e.g. Carniello et al., 2009; Fagherazzi et al., 2006; Mariotti and Fagherazzi, 2013), accounting for a low sedimentation rate that spanned between 0.07 and 0.08 cm yr−1.
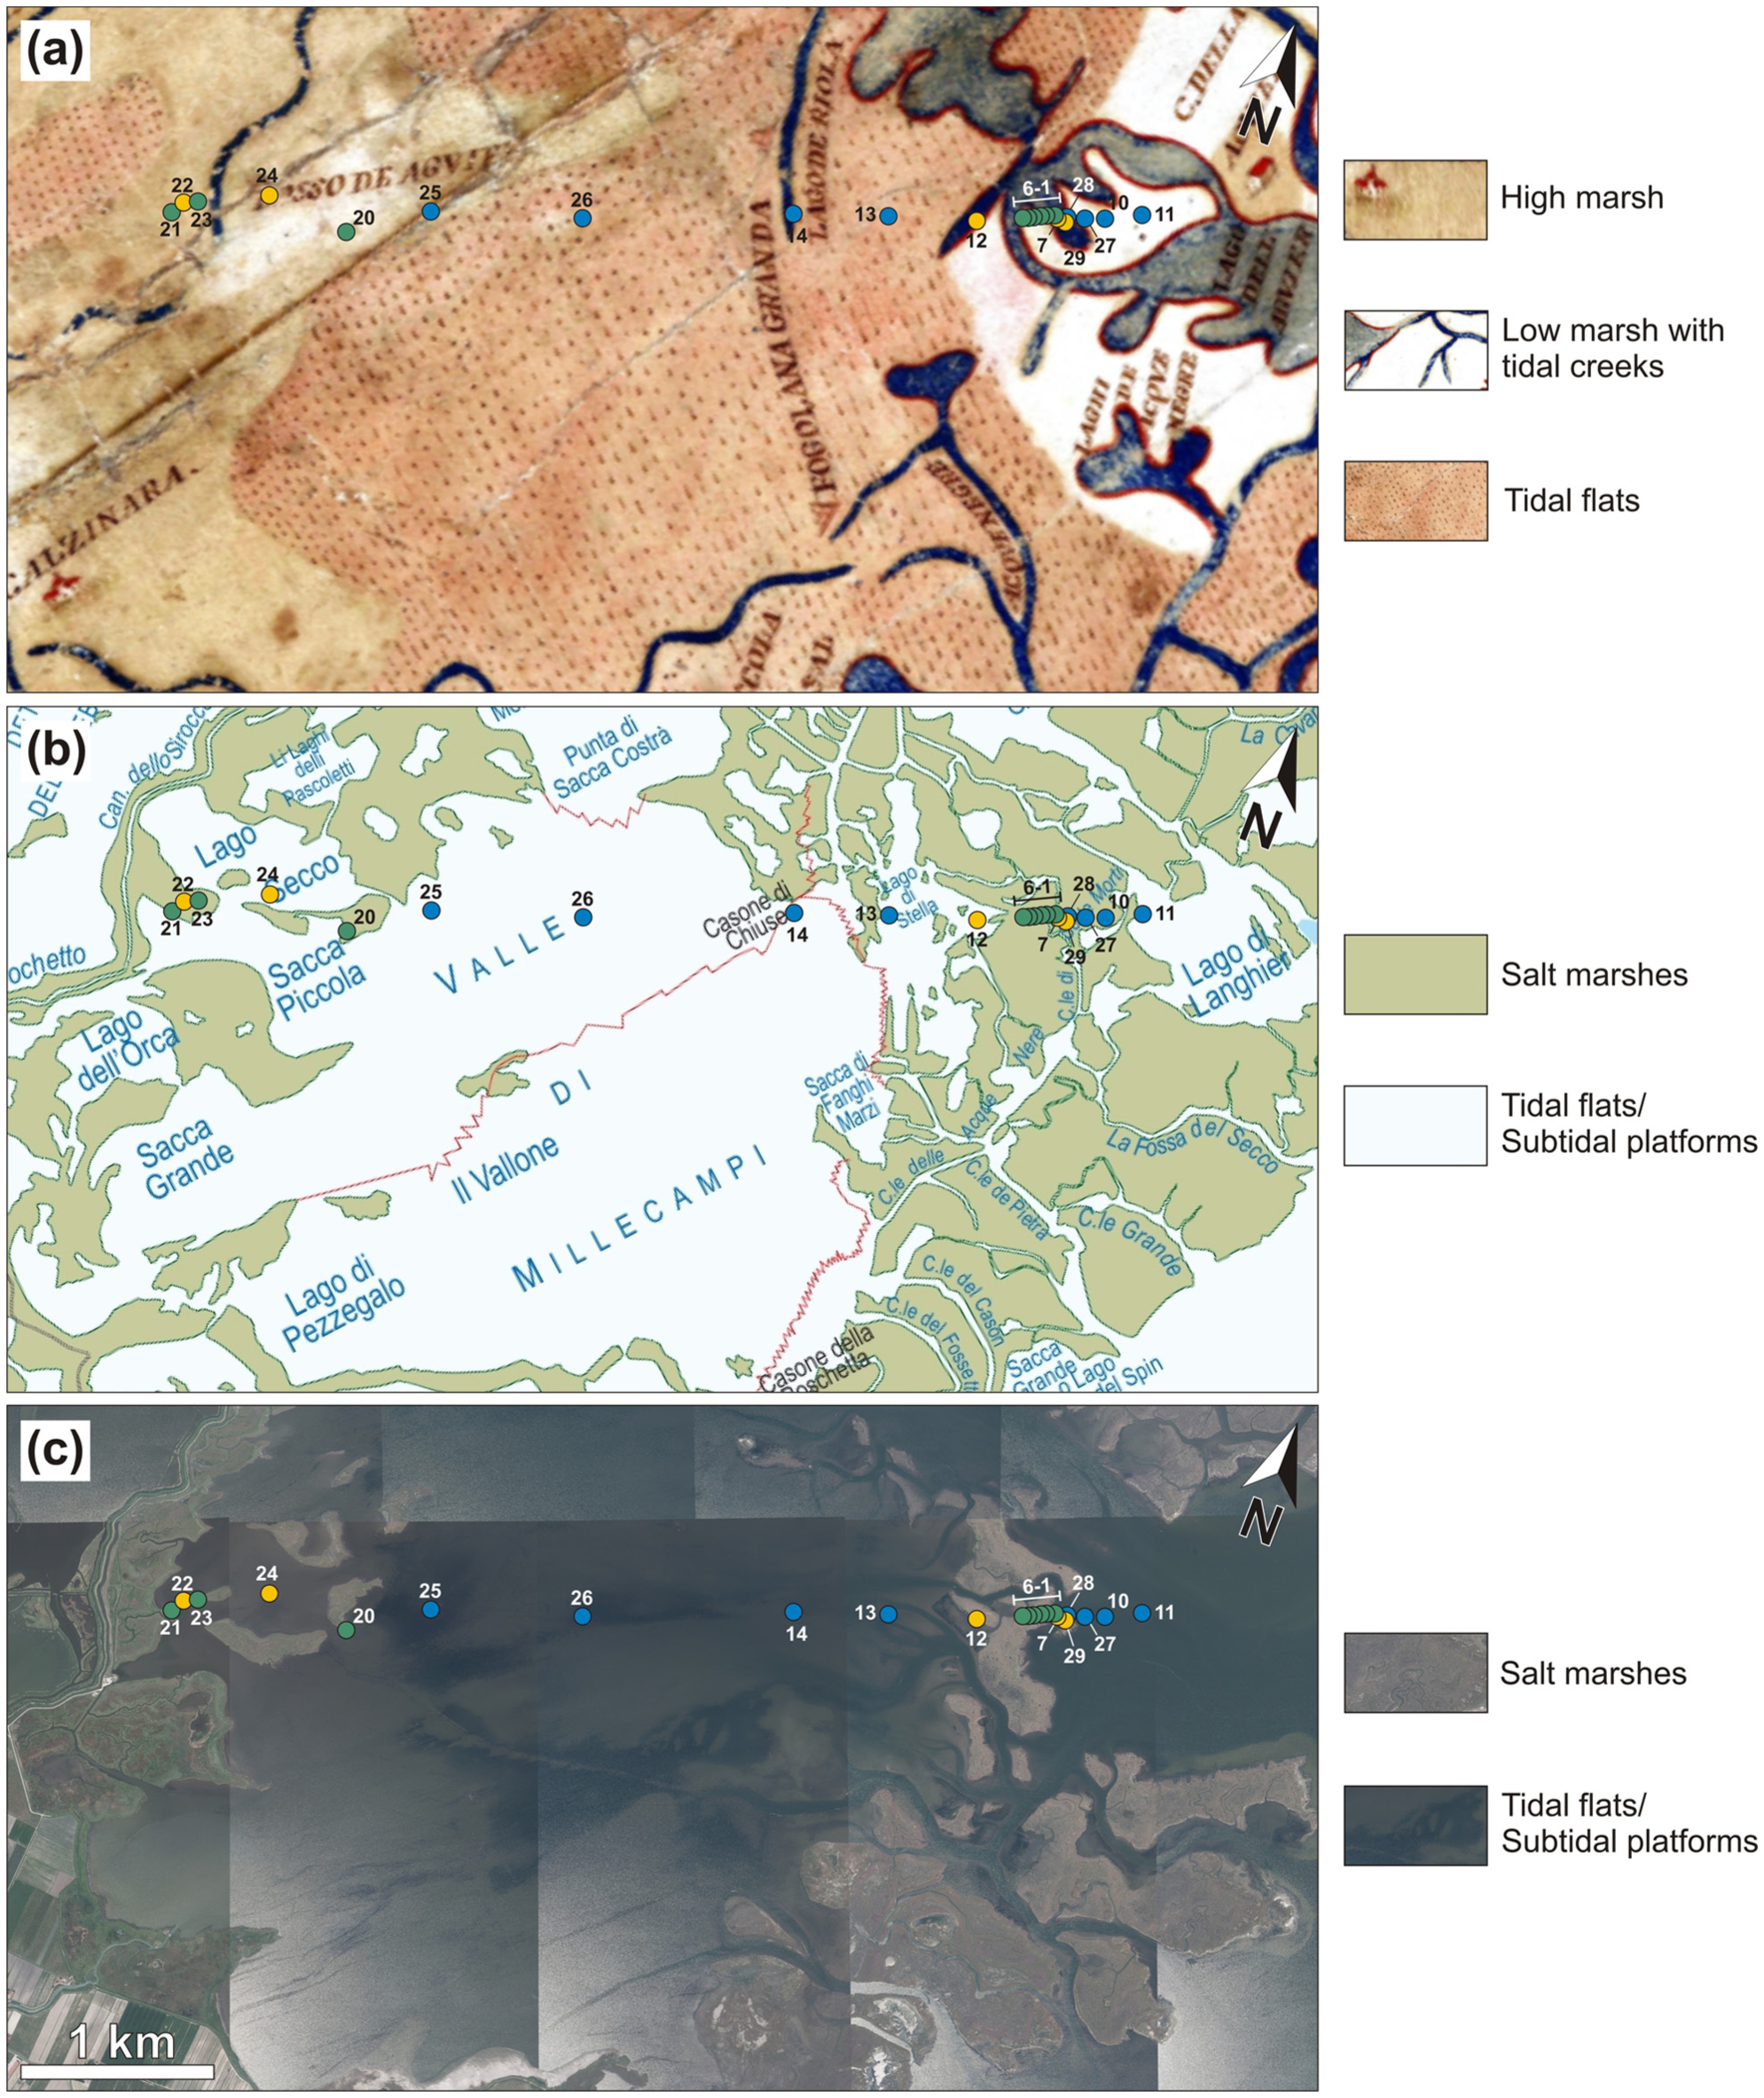
Distribution of the 25 cores of the areas of Valle Millecampi, Punta Cane, and Fondo dei Sette Morti. (a) Map of Cristoforo Sabbadino (1556) – adapted from D’Alpaos (2010b). The geo-referencing process on this qualitative map gave us an idea about the distribution of the cores in the 16th century. (b) Map of Augusto Dénaix (1809–1811) – adapted from D’Alpaos (2010b). This geo-referenced map is the first detailed hydrographic map built up on the base of data arising from fieldworks. (c) Geo-referenced map built up from aerial photographs of 2010 (images from http://idt.regione.veneto.it/app/metacatalog). In the three maps, the color of the 25 dots indicates the origin of the cores from a morphological point of view: green for salt-marsh cores, yellow for cores recovered from tidal flats, and blue for cores from subtidal platforms.
Moving toward more recent and detailed maps, the high-resolution topographic map by Augusto Dénaix (1809–1811) shows that in the Valle Millecampi area, most of the modern tidal flats were colonized by salt marshes almost two centuries ago (Figure 7b) and that the Valle Millecampi basin was much narrower in 1810 than nowadays (Figure 7c).
Although historical maps show that tidal flats replaced salt marshes over the past two centuries, none of the sedimentary cores recovered from these tidal flats contain salt-marsh deposits below the sandy lag formed during the tidal-flat expansion (Figure 2b; core 26 in Figure 2c). This suggests that salt-marsh deposits were entirely removed by wave winnowing during the formation of the sandy lag. Moreover, our results suggest that marshes were not drowned, but their transition to a tidal-flat landscape was triggered by the positive feedback between the increase in wave power and the increase in the basin width and depth (Francalanci et al., 2013; Marani et al., 2011; Mariotti and Fagherazzi, 2013). Larger fetches and increasing water depths lead to increased wave height, wave power, and lateral erosion (e.g. Carniello et al., 2009; Francalanci et al., 2013; Marani et al., 2011; Mariotti and Fagherazzi, 2010), which further promoted tidal-flat deepening and increase in the fetch, thus closing the feedback (Mariotti and Carr, 2014).
Depositional history of the Punta Cane–Fondo dei Sette Morti area
The integration between stratigraphic and geochronological data indicates that during the first-century BC, the Punta Cane area was characterized by peat accumulation in a palustrine environment. Palustrine sedimentation persisted for about 1400 years allowing the accumulation of about 2.0 m of peat. Persistence of a palustrine depositional environment balanced the progressive increase in accommodation space because of a combination of sea-level rise and local subsidence which caused an increase in relative MSL. At this stage, clastic sediments were probably confined within distributary channels (e.g. Horne et al., 1978), as suggested by local occurrence of sandy deposits (e.g. cores 13a and 13b in Figure 2b). The development of a palustrine environment is consistent with historical sources, documenting that several reaches of the Brenta River delivered freshwater at different sites in the central and southern Venice Lagoon during the first-century BC, during the Roman age, and between the fifth- and the ninth-century AD (Mozzi et al., 2004; Tosi et al., 2007b). For the sake of completeness, it is worth recalling that Piovan et al. (2012) suggest that additional freshwater supplies were provided, between the first-century BC and Roman times, by the Adige River, which constructed its own delta in the southern Venice Lagoon. During the 14th century, the transition from palustrine to salt-marsh depositions points to a reorganization of depositional dynamics. Similar changes can be ascribed to a decrease in the rate of relative sea-level rise and/or an increase in sediment supply (Kirwan et al., 2011; Marani et al., 2010; Mudd, 2011). The lack of detailed stratigraphic (e.g. sea-level curves) or historical (e.g. geographic maps) documentation prevents us to discuss the onset of salt-marsh deposition in terms of sea-level variations or human pressure. Nevertheless, the present dataset highlights that over the past 650 years, a stable salt-marsh system occupied the study area, where historical sources document a generic ‘swamp’ environment only since AD 1556 (Cristoforo Sabbadino Map). The aggradation of the Punta Cane salt marsh, whose vertical accretion rate is not constant over time, highlights the capability of the marsh to keep pace with the increasing rates of relative-sea level rise. Accordingly, there is no evidence of significant drownings in the study stratigraphic interval. The aggradation trend shows three well-defined positive peaks between the 15th and the 20th centuries (named A–C in Figure 6b). Although peak B could have been enhanced by the significant error affecting two similar ages obtained from samples collected at −63 and −75 cm below MSL, respectively, these significant changes in aggradation rates are interpreted here because of pulses of local subsidence induced by the emplacement of deltaic lobes of the Brenta River during its repeated diversions into the southern Venice Lagoon (e.g. D’Alpaos, 2010a, 2010b). Peak C was further emphasized by the exploitation of underground water during the 20th century (e.g. Carbognin et al., 2005). Time intervals related to these peaks represent stages when the salt marsh managed to store an amount of organic and inorganic deposits (Roner et al., 2016) sufficient to compensate a remarkable relative sea-level rise and prevent its drowning.
Along the western margin of the Fondo dei Sette Morti basin, pinching out of salt-marsh deposits and absence of tidal-flat/subtidal-platform mud indicate that this area is affected by strong erosion. Accordingly, the top of salt-marsh deposits recovered in cores 7, 29, and 28 (Figure 6a) is located in the lower part of the intertidal zone or in the subtidal zone. Day et al. (1998) found, by direct measurements in this area, that the eastern edge of Punta Cane salt marsh retreated at rates of 1.2–2.2 m yr−1. The retreatment of the marsh edge is also documented clearly by a comparison between Figure 7b and c. Specifically, integration between the map by Augusto Dénaix (Figure 7b) and stratigraphic record reveals that over the past two centuries, salt-marsh retreat was associated with erosion of about 2 m of salt-marsh deposits (Figure 6a), accounting for a remarkable efficiency of wave-generated currents. Along the western margin of the Fondo dei Sette Morti basin, the action of the wind waves is particularly strong as a consequence of a combination of the wind from NE (Bora Wind) and the relevant fetch, and these contribute to significantly increase the power density of incident waves (Marani et al., 2011). The steep margin of the Fondo dei Sette Morti basin is consistent with the widespread erosion processes. Such a steepness causes a rapid shallowing of water in the tidal-flat zone, leading in turn to a consequent increase in the height of the incoming waves, and these are able to remobilize sediment at deeper (Bendoni et al., 2016; Francalanci et al., 2013).
Conclusion
In this study, we provide the first depositional model of the latest Holocene succession of the southern Venice Lagoon across a 5-km-long transect oriented transverse to the current salt-marsh edge. The sedimentary succession testifies the evolution from a palustrine to a lagoonal depositional environment over the last ~2000 years. The depositional history depicted by this work agrees with information derived from historical datasets and also offers new insights into the depositional evolution of the southern Venice Lagoon. The depositional history started within a palustrine setting, which evolved into tidal flats, subtidal platforms, and salt marshes. The oldest tidal flats and subtidal platforms developed between the second- and fifth-century AD, whereas the salt marshes started to form around the 14th century. The vertical aggradation of the salt-marsh system occurred in parallel with a decrease in the salt-marsh lateral extent and progressive tidal-flat expansion. Sedimentological evidence shows that salt-marsh disappearance was controlled by wave-induced erosion, suggesting a positive feedback between tidal-flat deepening and expansion and salt-marsh retreat, driven by an increased wave power density impacting salt-marsh margins. The rate of salt-marsh vertical aggradation was not constant over time. Three significant peaks in the trend between the 15th and 20th centuries are consistent with the introduction of the Brenta River into the Lagoon. The important loading generated by the fluvial input caused a localized accretion in the study area, thus allowing the salt-marsh surface to grow faster in order to keep pace with the increasing rate of relative sea-level rise, thus preventing its drowning. On the contrary, the aggradation rate of tidal flats and subtidal platforms in the Valle Millecampi area was reduced by the progressive loss of fine-grained deposits associated with wind-wave driven erosion events because of the morphological and bathymetric configuration of the basin that has never become deep enough to prevent winnowing of the depositional interface.
Footnotes
Acknowledgements
The authors wish to thank Alastair Dawson (editor) and Massimo Zecchin for the constructive review.
Funding
This work was supported by the CARIPARO Project titled ‘Reading signatures of the past to predict the future: 1000 years of stratigraphic record as a key for the future of the Venice Lagoon’ that is gratefully acknowledged.