
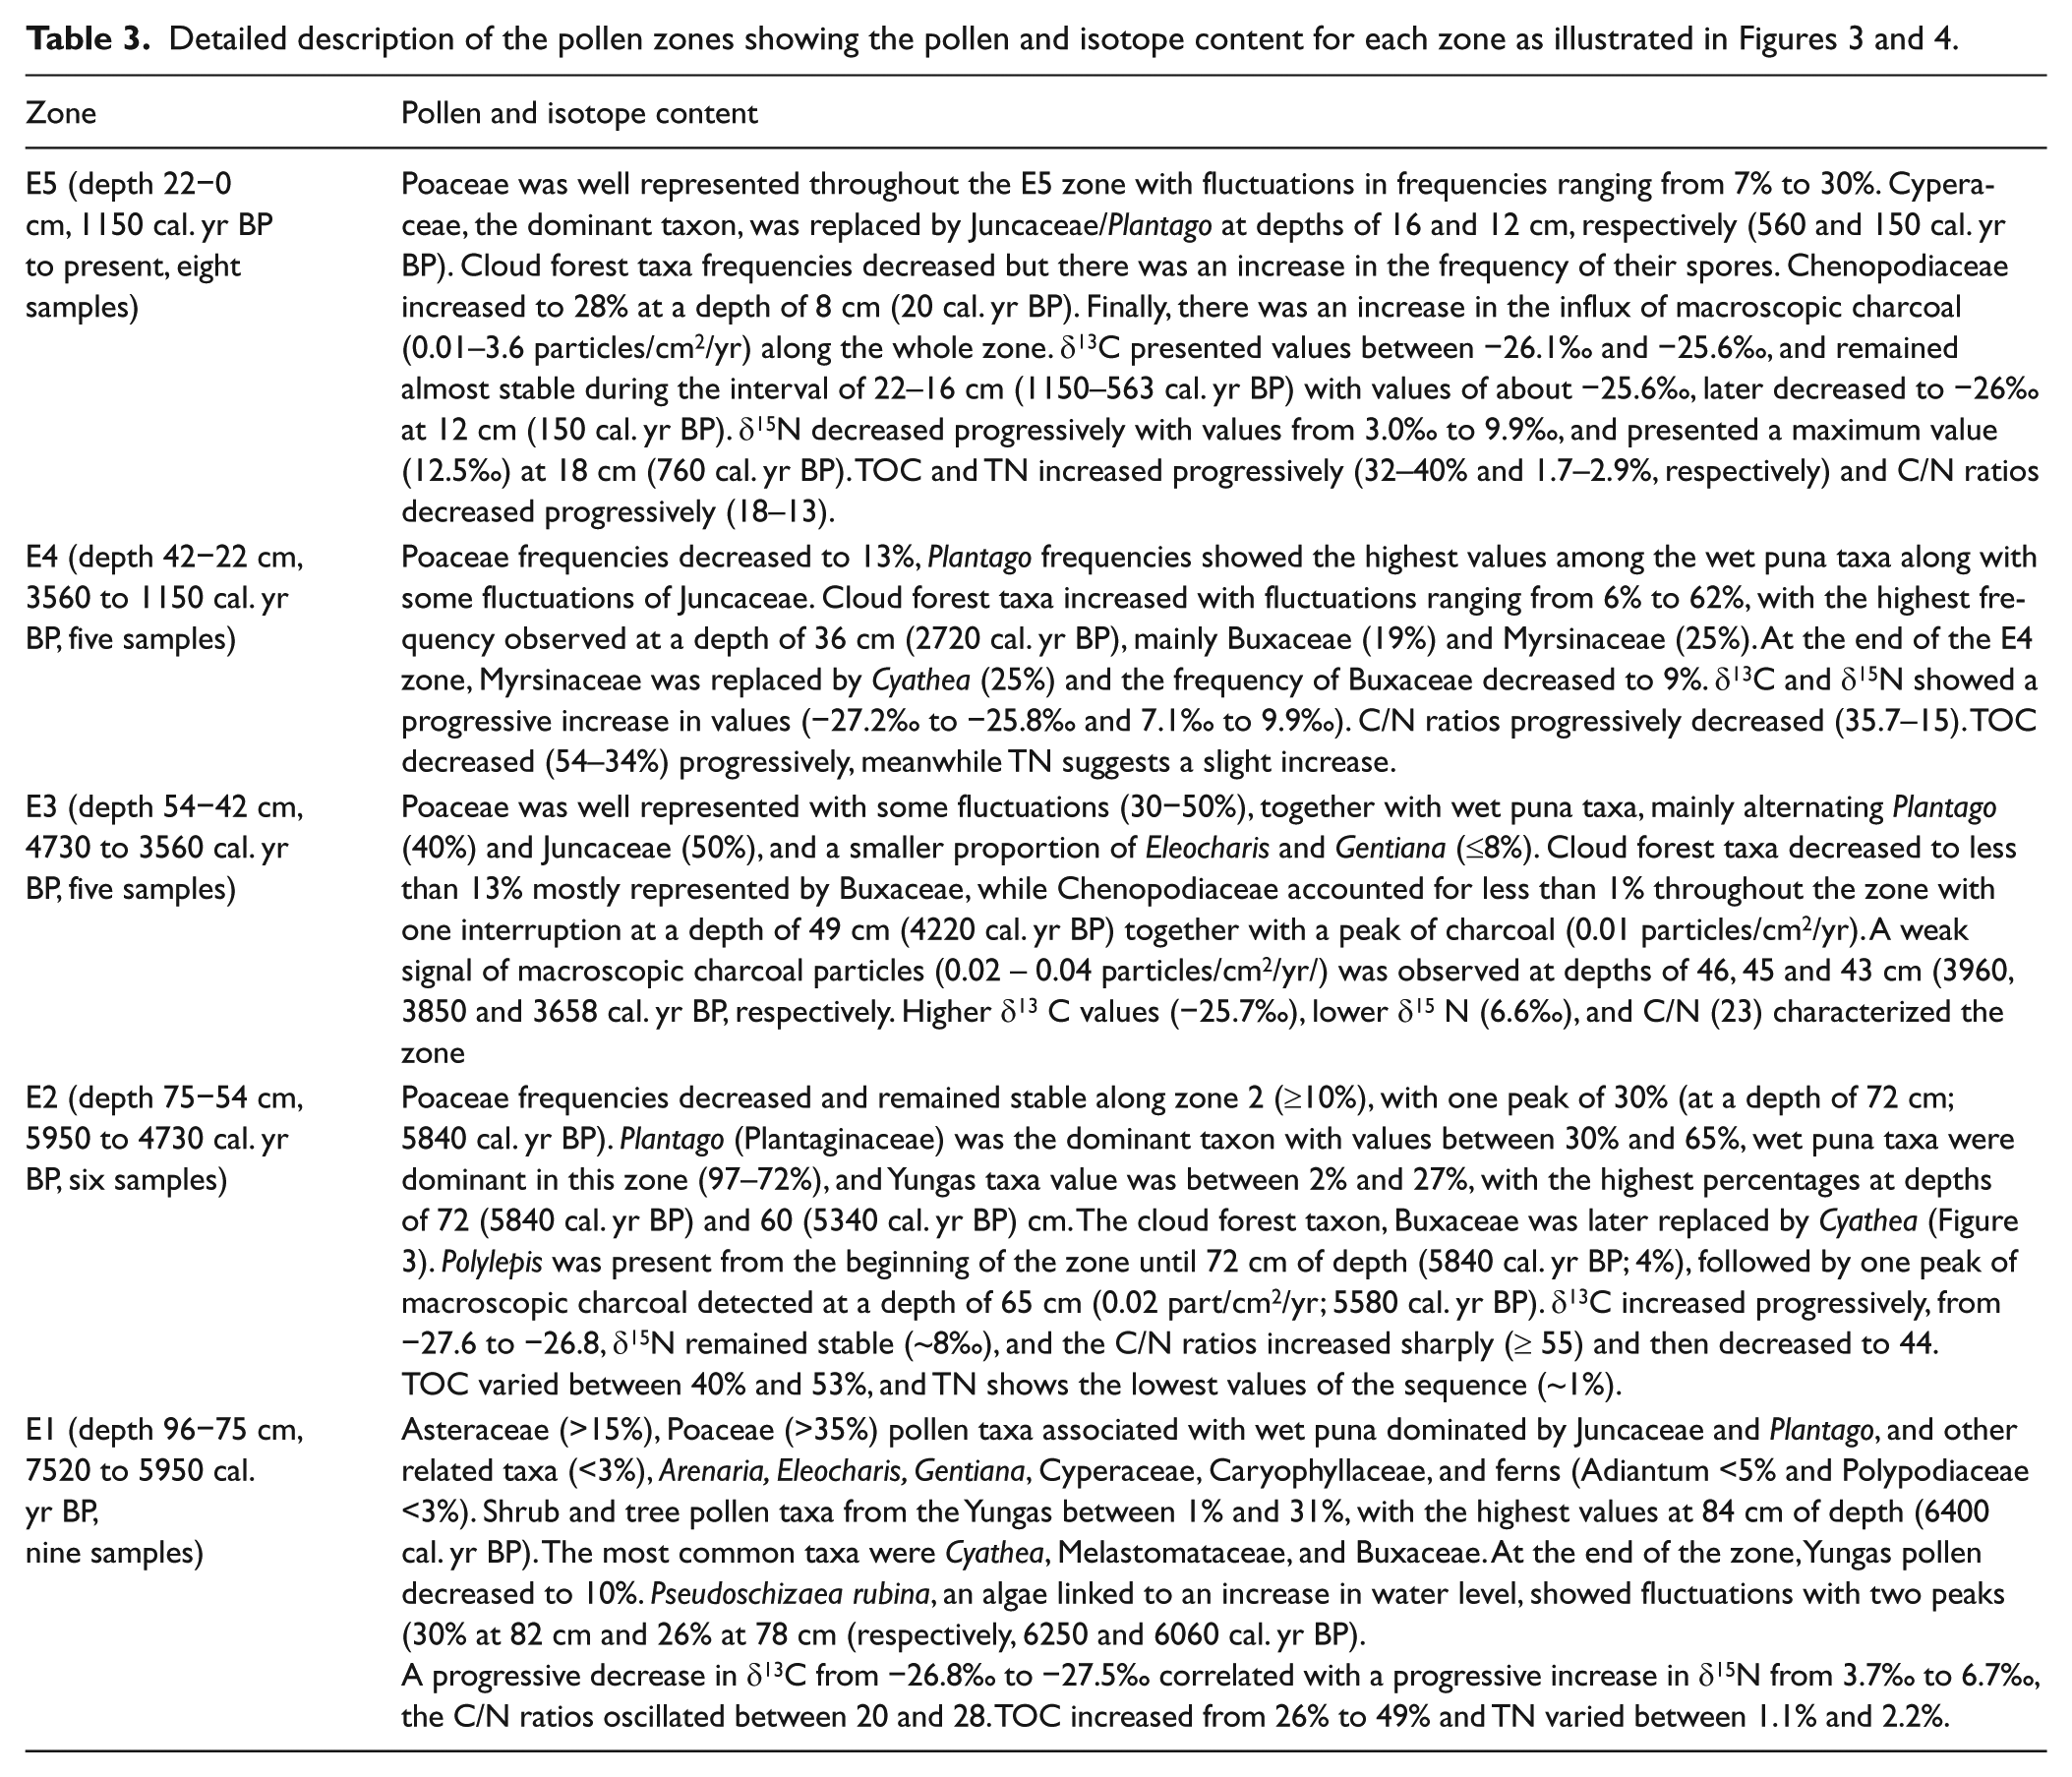
Abstract
Changes in climate conditions during the Holocene are documented in different parts of South America, showing contrasting responses to global changes. This study was conducted in the wet puna at an elevation of 4040 m a.s.l. on the eastern side of the Cordillera Real in Bolivia near Lake Titicaca. Pollen, charcoal, and stable isotopes in a sediment core collected in the peatland of Escalerani were analyzed. Results revealed environmental changes during the past 7500 yr BP, with an increase in wet climate conditions from 5900 to 4700 cal. yr BP and 3500 to 1300 cal. yr BP, and two dry periods between 4700 and 3500 cal. yr BP and 1300 to 560 cal. yr BP. Changes in hydrological conditions ranged from local changes because of glacier melting to regional changes in annual rainfall variability, related to South American monsoon activity. Moreover, our results highlight the importance of cloud convective activity from the Amazon basin along the adiabatic gradient, which maintained moist conditions at high elevations even during the mid-Holocene dry phase. The last 70 years have been characterized by the degradation of the peatland because of human activity.
Introduction
The Andean plateau is the main mountain range in South America and one of the largest ranges in the world (Muñoz et al., 2015). The Andean uplift event, which occurred 50 Myr ago, was the greatest driver for species migration and diversification, and the beginning of endemism of many plant species (Antonelli et al., 2009; Chacón et al., 2012; Garzione et al., 2008; Luebert et al., 2011; McHenry and Barrington, 2014). The Central Andes are also considered as a main center of origin for several of the cultivated plants of the planet today (Antonelli et al., 2009) and they sheltered some of the richest civilizations of the Neolithic (Bruno and Whitehead, 2003; Chepstow-Lusty and Jonsson, 2000; Chepstow-Lusty et al., 2009; Janusek, 2006; Power et al., 2012) despite the elevation, aridity, and contrasted climatic changes during the Holocene (Gosling and Williams, 2013). The high Andean ecosystems are composed of the puna, high elevation grassland, and Polylepis forests. These ecosystems show different kinds of adaptation to high ultraviolet (UV) radiation and moisture stress caused by low temperature, high evapotranspiration rates, and desiccating winds (Muñoz et al., 2015). Among these adaptations is a particular ecosystem, referred to as ‘highland-bogs’ or peatlands, which are able to store and preserve water in the soil, thus enabling a unique range of rare and endemic species in the Andes (Squeo et al., 2006b). Fresh and mildly saline groundwater derived from glacier streams, snowmelt, and rain contributed to the development of the peatlands (Squeo et al., 2006a). Consequently, the life of a peatland is closely related to hydrological cycles and climate changes at these high elevations. However, the chronology of the pollen analyses performed in the puna altitudinal band in the 1970s was poor (Graf, 1981) and most of the knowledge of the high Andean landscape and environmental responses to the drastic climate changes in the Holocene was based on lacustrine and glacier studies (Abbott et al., 1997, 2003; Argollo and Mourguiart, 2000; Baker et al., 2005; Jomelli et al., 2011; Liu et al., 2005; Mourguiart et al., 1998; Paduano et al., 2003; Rabatel et al., 2005). In Bolivia, the Telata glacier record showed high moisture rates and low temperature until 8500 cal. yr BP. Recent paleoecological studies show that high-elevation peatlands became free of ice after 7000 cal. yr BP and remained moist during the mid-Holocene owing to upslope convective activity from lowland rainforests (Ledru et al., 2013a). Sedimentological and geochemical studies of Andean lake records, including Lake Titicaca, showed a sharp regional decrease in moisture between 6000 and 4000 cal. yr BP (Abbott et al., 2003; Baker et al., 2001). In the central Cordillera, from north to south, the sensitivity of lakes to changes in the moisture balance illustrated a pattern of aridity from the late glacial until 4800 cal. yr BP when climatic conditions became moister in the northern Andes. The moisture belt progressively shifted southward, where wetter conditions were observed from ~ 3400 cal. yr BP (Abbott et al., 2003). Archeologists showed that populations were able to survive the mid-Holocene aridity in the puna; these prolonged dry periods induced a change in population, from hunter-gatherer to the beginning of sedentarism. Populations living on the Altiplano started the management of plants with seasonal growth, recognized the altitudinal areas with sensitivity to climate variation, and the emergence of pastoralism until the Columbian encounter (Gosling and Williams, 2013; Hastorf, 2004; Núñez and Grosjean, 1994; Roddick and Hastorf, 2009). Abrupt changes in climate conditions were observed during the Little Ice Age (LIA), from 350 yr BP to 100 yr BP, with a substantial increase in temperature and solar radiation (3.3°C) which more than offset the impact of increased precipitation (Jomelli et al., 2011). The LIA was characterized by a maximum glacier advance in the 17th century and continuous warming with three colder/moister intervals during the 18th and 19th centuries (Rabatel et al., 2005). Since the 19th century, the drastic decrease in Andean glaciers is evidence for current climate warming.
Here, we document for a densely populated area the past changes in resources and landscapes that have been subjected to variable climatic conditions during the Holocene. Organic components in peatbog sediments are supplied by different sources (i.e. allochtonous organisms, and terrestrial and atmospheric inputs). Here, Holocene environmental changes are inferred from a multi-proxy data set of pollen, charcoal, carbon, and nitrogen stable isotope ratios of sediment and AMS carbon-14 datings obtained by analyzing a new core collected in a peatland at the site of Escalerani in the puna vegetation belt in northeastern Bolivia. Specifically, past vegetation is reconstructed through the analysis of pollen, and response of the vegetation to environmental and climatic stressors is accessed through means of sedimentary organic matter δ13 C and δ15 N. Interpretation of biogeochemical proxies is compared with published climate proxy (i.e. δ18O ice core).
Study area
Site description
The Escalerani peatland is located in the eastern side of the Cordillera Real in Bolivia, at 4040 m a.s.l. (15°50’42’’S, 68°16’35.5’’W; Figure 1a) above the village of Chakapa, whose inhabitants raise llamas and cows, and grow vegetables including potatoes. The peatland is located ~ 60 km from Lake Titicaca, near glacier formations. The water originates from an almost extinct glacier today 600 m above the peatland (Figure 1b). The nearest climate station is located in the vicinity of Hichucota glacier on the western slope, about 38 km from Escalerani (Figure 1a). The climate is characterized by a wet season (December to February) and a dry season (June to August), with an annual precipitation rate of 500 to > 900 mm and mean temperatures that do not exceed 7°C (Figure 1c). A botanical survey of the bog revealed the dominance of Plantago tubulosa (Plantaginaceae), which forms flat cushions, accompanied to a lesser extent by Deyeuxia spicigera (Poaceae), Gentiana sedifolia (Gentianaceae) and Aciachne acicularis (Poaceae). A. acicularis is a good colonizer of peat organic soils and an indicator of current disturbances (natural or anthropic; Ortuño et al., 2011). A Polylepis pepei (Rosaceae) forest grows in the vicinity of the peatland, approximately 300 m from the site of the core. Today, the peatland is used by the local community for grazing.
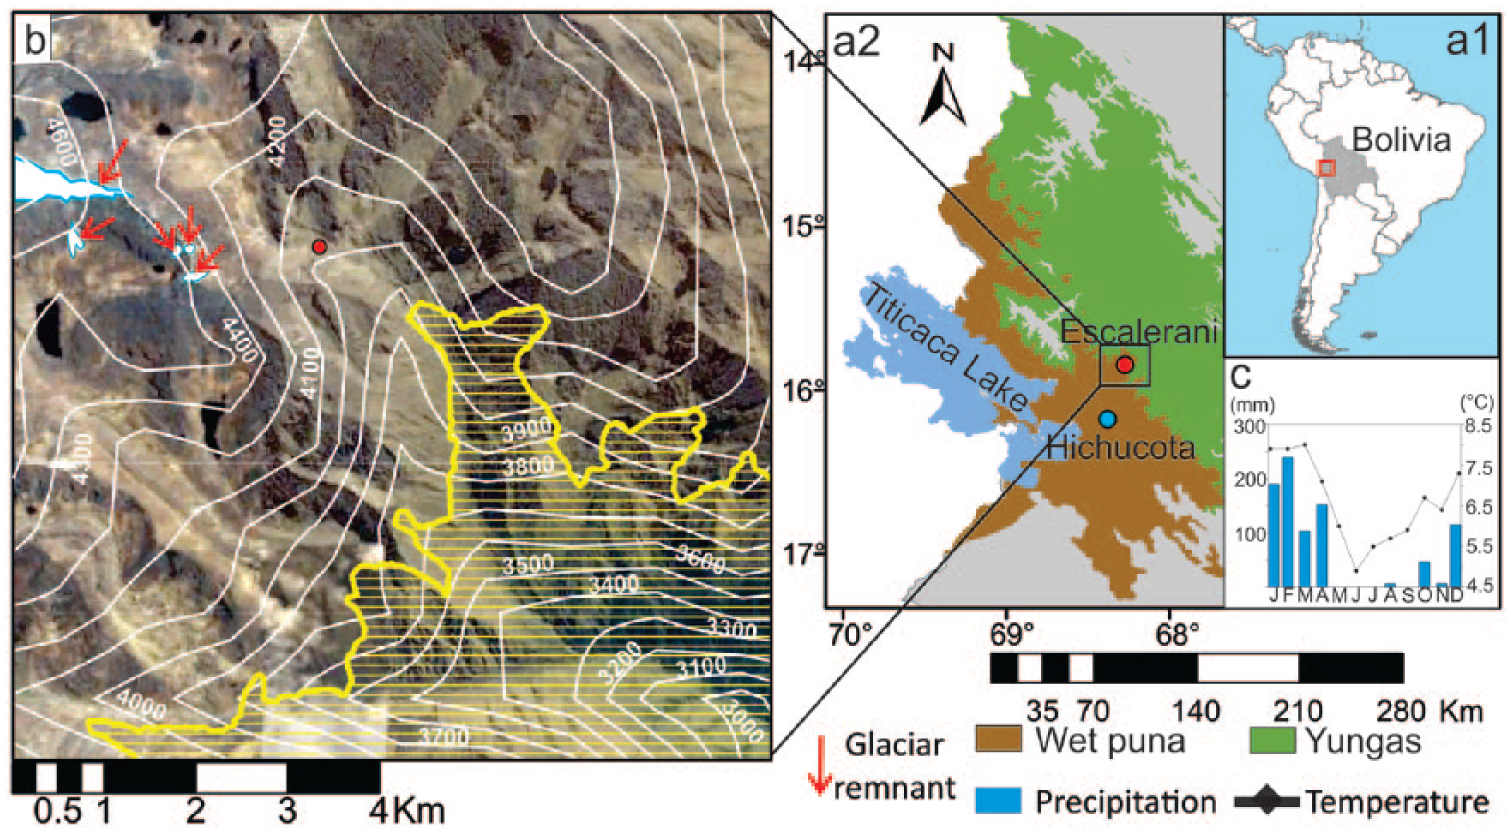
(a1) Map of South America showing Bolivia and the study area (red square), (a2) the location of the peatland of Escalerani (red dot), the location of the climate station (blue dot), Lake Titicaca, and the main regional vegetation zones (Dinerstein et al., 2017). (b) Topography from Escalerani area showing the Escalerani site (red dot) and the almost extinct glacier (red arrows). The white lines represent the altitudinal belts each 100 m, and horizontal yellow lines represent the Yungas vegetation zone. (c) Climate diagram with mean monthly precipitation and temperature at Hichucota (SENAMHI, 2017).
Climate
In general, the wet puna presents a marked dry season during austral winter in the west of the Cordillera Oriental, as observed at the station of Hichucota (Figure 1). However, contrasted climate conditions are observed along the eastern and western slopes of the Andes and the adjacent lowlands. Escalerani is located on the eastern slope and submitted to the influence of different factors. First, the Andean Cordillera acts as a climate barrier where the air masses from the Amazon basin accumulate inducing continuous rainfall at Escalerani because of the moist convection produced by the atmospheric boundary layer (ABL; Garreaud et al., 2003). This rainfall activity increases during the austral summer, when the Inter Tropical Convergence Zone (ITCZ) moves southward over the continent, increasing the intensity of the South American Summer Monsoon (SASM) system (Vuille et al., 2000, 2012) over the Amazon Basin and surroundings (Garreaud, 2009).
In addition, superimposed on these climatic features, the climate variability in this area is strongly modulated by El Niño/Southern Oscillation (ENSO) representing one of the most prominent sources of interannual climate variability causing worldwide extreme weather anomalies. Glacier mass balance, rain, and snowfall variability in the Central Andes are strongly modulated by ENSO (Vuille et al., 2000). Cooler/warmer sea surface temperatures (SSTs) in the Eastern Pacific Ocean cause changes in the mean zonal wind over the Altiplano that are responsible for interannual climate variability. During El Niño (La Niña) events, warmer (cooler) tropical eastern Pacific SSTs are responsible for the northward position of the Bolivian high (southward Bolivian High) and, consequently, of the drier and warmer conditions (increase cloud-cover and convective precipitation; Aceituno, 1993; Garreaud et al., 2003; Vuille et al., 2000).
Vegetation
The peatland is located in the wet puna vegetation belt, only 1 km from the Yungas vegetation belt. Winds bring air masses from the Altiplano (particularly Lake Titicaca) and transport convective moisture upslope from the Amazon Basin (Baker et al., 2001; Garreaud, 2009).
Wet puna
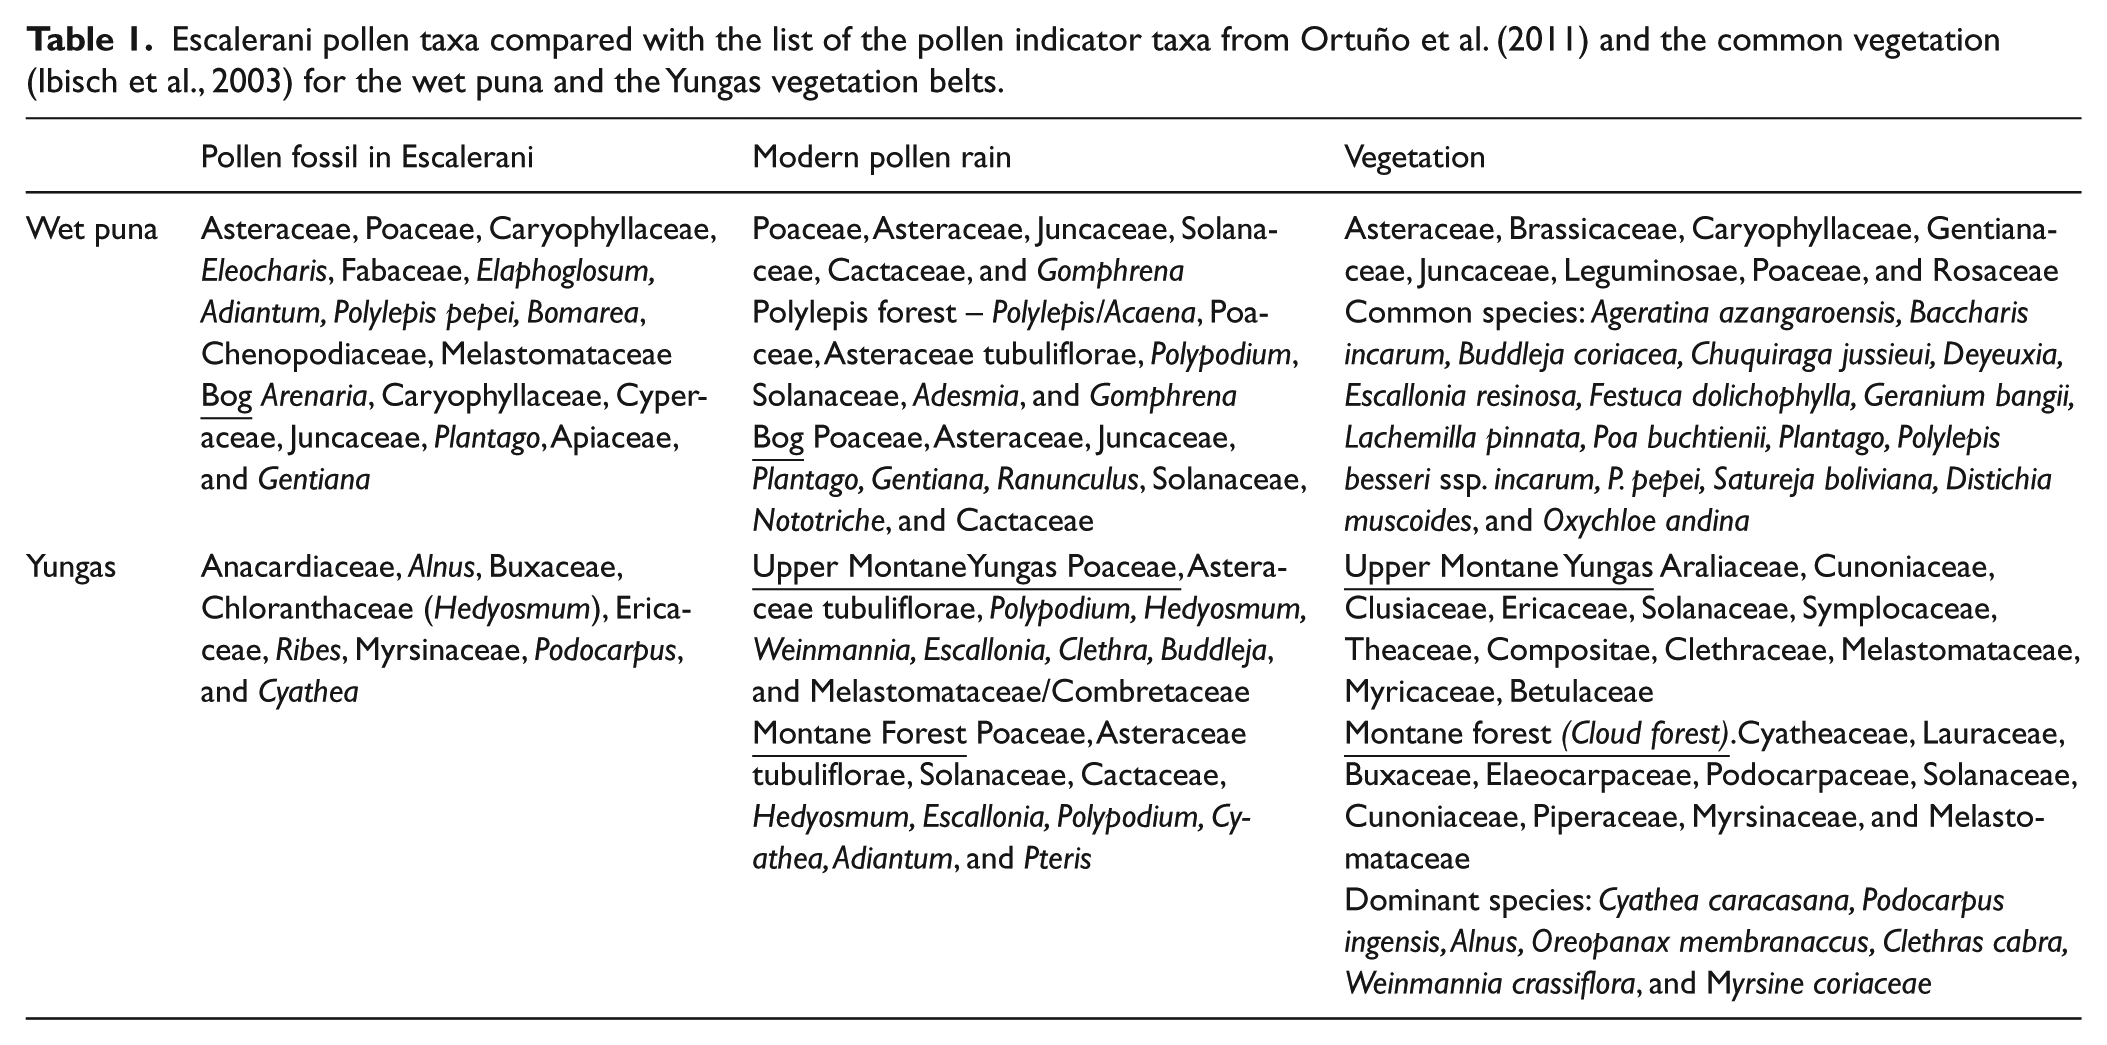
In Bolivia, south of the department of La Paz, the Central Andean wet puna ecoregion comprises magnificent mountains and a high plateau. Most of the ecoregion consists of Tertiary and Quaternary volcanic bedrock. Glacial moraines and associated landforms (snowcapped peaks, glacial lakes, and several rivers that originate in the Cordilleras) are present throughout the puna. The area includes three subregions: the high Andean puna, the wet puna, and the wet montane grassland (Dixon et al., 2014). The wet puna, also called the moist puna belt by Troll (1968), extends between 3700 and 4200 m a.s.l. The wet puna is dominated by grasslands with sparse shrubs and tree species (Beck et al., 1993; Seibert, 1993), where grasses mainly comprise the following genera: Agrostis, Calamagrostis, Festuca, Paspalum, and Stipa. The wettest areas include the following genera: Carex, Juncus, Oreobolus, and Scirpus and large cushions formed by D. muscoides, O. Andina, and Plantago in the peatlands. Although most of the vegetation assemblages are dominated by grass with rare shrubs, small trees are represented by the evergreen species of Polylepis pepei (local names queñua or kewiña). In the Eastern Cordillera, Polylepis woodlands grow up to a maximum of 4200 m a.s.l. (Navarro, 2011; Seibert, 1993). Some cultivated and/or introduced tree species, like Eucalyptus, Pinus, Cupressus, Salix, and Populus are also found in the villages and along the riverbanks (Beck et al., 1993). Plant species and their associated pollen taxa for the wet puna are listed in Table 1. Pollen indicators were defined from modern pollen rain studies (Ortuño et al., 2011).
Escalerani pollen taxa compared with the list of the pollen indicator taxa from Ortuño et al. (2011) and the common vegetation (Ibisch et al., 2003) for the wet puna and the Yungas vegetation belts.
Bolivian Yungas
This ecosystem is found on the slope of the Oriental Andes, between 1000 and 4200 m a.s.l., and is commonly referred to as Yungas. Geomorphological features include mountain ranges with broad mounds and hillsides, and narrow ravines and valleys with sedimentary metamorphic rocks. The climate conditions range from humid to subhumid depending on the elevation. Annual precipitation is about 2000 mm. The average annual temperature is between 17°C and 24°C (Navarro, 2011). Although physiognomy and floristic composition of the Yungas vary with altitude, evergreen forests and considerable plant diversity are found in well-protected areas (Killeen et al., 1993). The Yungas vegetation belt includes the Montane Yungas vegetation, between 1000 and 3100 m a.s.l., and the Upper Montane Yungas vegetation (Yungas Ceja de Monte) ranging from 3100 to 4200 m a.s.l. (Navarro, 2011). The former belt is formed by two components: the montane humid forest and the cloud forest (2500 to 3100 m a.s.l.). The cloud forest, one of the relevant vegetation forms of this study, is characterized by permanent orographic fogs, which gather on the upper part of the hillsides. In general the canopy is less closed, with many less dense strata and abundant vascular epiphytes, hemi-epiphytes, and mosses. In the upper Montane Yungas vegetation belt, clouds frequently collide with the forest, and humid conditions prevail all year round. Mean annual precipitation is >1500 mm and the mean annual temperature ranges between 7°C and 14°C. Small evergreen trees with coriaceous leaves, abundant epiphytes, especially mosses, and lichens characterize this ecosystem. Ericaceae shrubs and colonies of Chusquea (bamboo) and Gleichenia fern are also observed. Trees up to 15 m in height are characterized by Myrica pubescens, Weinmannia bangii, Weinmannia sorbiflora, and terrestrial ferns. In the upper part of the upper montane Yungas vegetation, patches of small Oreopanax, Escallonia, Gynoxys, and Polylepis pepei trees are observed in the grassland. As for Puna, Yungas plant species and associated pollen taxa are listed in Table 1 and pollen indicators were defined from modern pollen rain studies (Ortuño et al., 2011).
Material and methods
Material
A sediment core (ESC) was removed to a depth of 1 m with a Russian corer in the peatland of Escalerani in November 2013. The core was wrapped in aluminum foil in a PVS-tube, sealed in a plastic film, and stored at IGEMA (Instituto de Geología y del Medio Ambiente) at 4°C. Sediment lithology was first described and then sampled at 1-cm intervals (100 samples) at the laboratory of Palynology of the Herbario Nacional de Bolivia (HNB LPB) in La Paz.
Chronology
The sediment chronology is based on seven radiocarbon dates measured at the Laboratoire de Mesure du Carbone 14 (LMC14) by accelerator mass spectrometry radiocarbon dating (Table 2). All the radiocarbon ages were calibrated using the Southern Hemisphere SHCal13 14C data set (Hogg et al., 2013) with the program Calib 7.0 (Stuiver and Reimer, 1993) (Table 2). The age-depth model was obtained by running the ‘CLAM’ program (Blaauw, 2010) under the ‘R’ mathematical software version 2.12.2, and the age-depth relationship was estimated using a smooth spline approximation (Figure 2).
Radiocarbon ages obtained on total organic matter from the ESC core. 14 C dates were calibrated using Calib 7.0 (Hogg et al., 2013) at 2 σ.
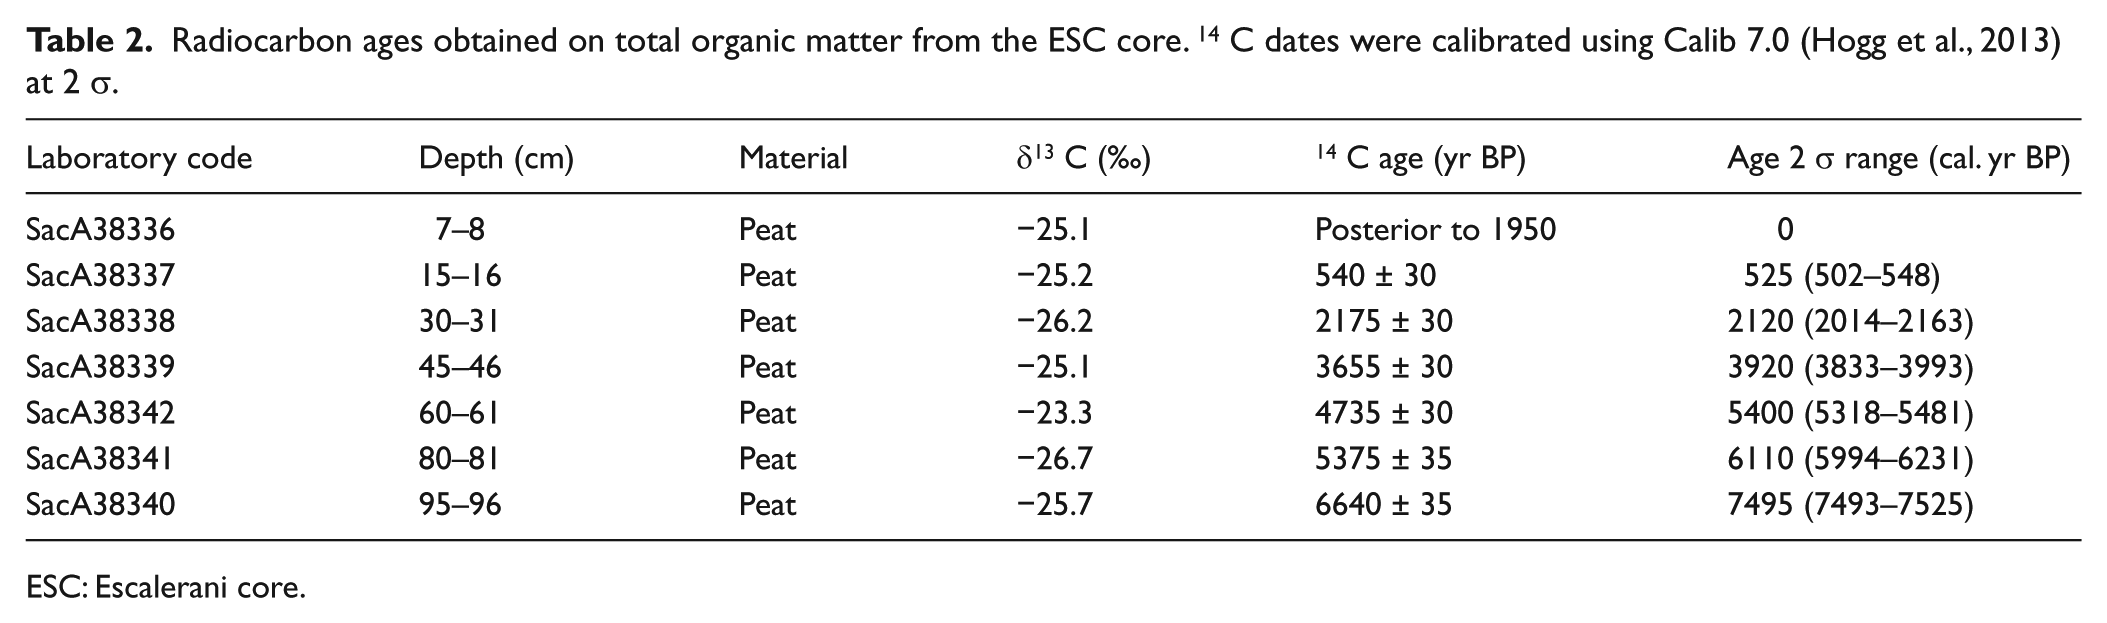
ESC: Escalerani core.
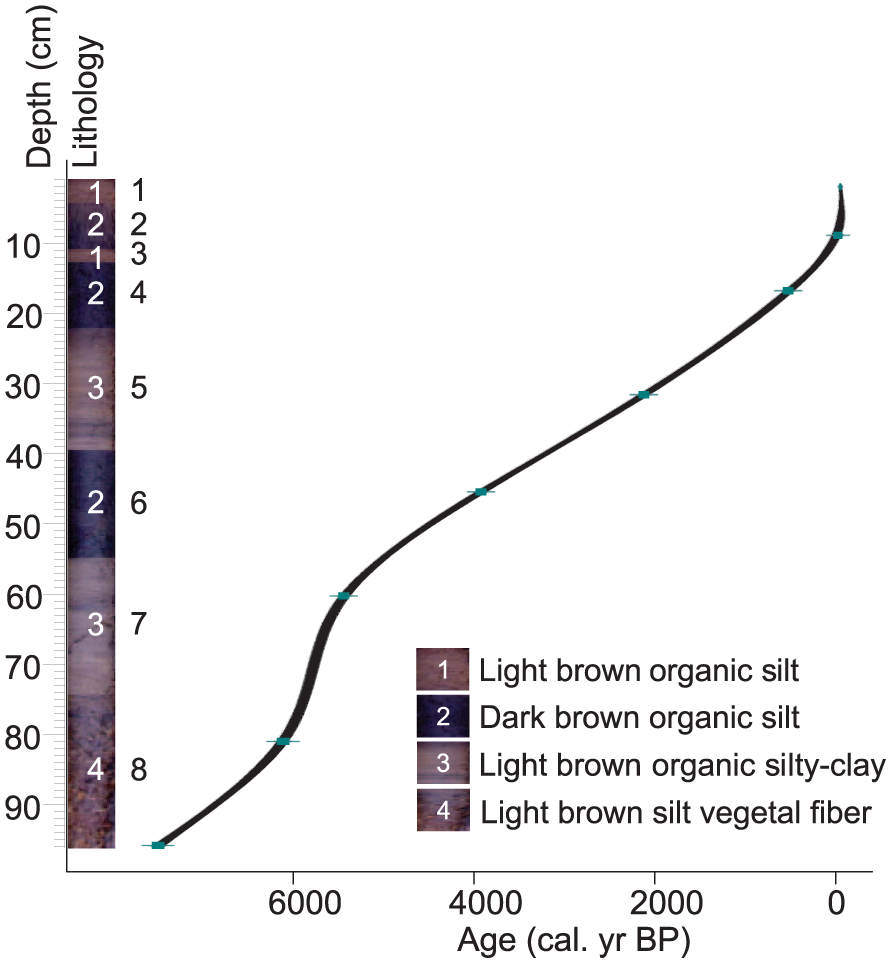
Escalerani core (ESC) lithology is plotted as a function of the age model. Eight sedimentation units are described (black numbers to the right of the core) and four different types of facies (in white). The age versus depth model was constructed using the calibrated 14 C dates from Table 2 in the Clam package, ‘R’ software (Blaauw, 2010).
Fossil pollen and charcoal analysis
Pollen extractions were performed on samples of ~0.5 g or cm3. A tablet of Lycopodium spores was added as a spike to measure microfossil concentrations and influx (Stockmarr, 1971); sediment samples were pretreated with 10% KOH followed by gravity separation with ZnCl2 (Kummel and Raup, 1965). Samples were mounted in glycerol and analyzed at 400 and 1000 magnification. Pollen grains and spores were identified using the HNB-LPB reference pollen collection and pollen keys (De la Riva and Ortuño, 2006; Heusser, 1971; Roubik and Moreno, 1991; Sandoval, 2011). The pollen record was plotted using the Psimpoll program (Bennett, 1994) and divided into five pollen zones on the basis of the constrained cluster analysis by sum of squares (CONISS) with pollen taxa ≥1% (Grimm, 1987).
For macroscopic charcoal analyses, 1 cm3 samples were treated with 10% KOH and sodium hypochlorite (NaOCl) solution, sieved at 165 µm, washed with distilled water, and counted at ×60 under a stereomicroscope (Long et al., 1998). Macroscopic charcoal particles were analyzed based on the morphological criteria defined by Jensen et al. (2007). The macroscopic charcoal was used to analyze the source of fire activity, either local or regional, and as an additional complement for fossil pollen interpretation. Palynological richness was calculated using rarefaction analysis in the Psimpoll program (Birks and Line, 1992). To enable a better understanding of our results, we separated the pollen taxa into two ecological groups, the wet puna and the Yungas, based on the description of the vegetation and pollen indicators (Table 1; Ortuño et al., 2011). Finally, we represented the log transported pollen/Poaceae (T/P) convection index to characterize the origin of the moisture sources (Ledru et al., 2013b) where values >0 revealed atmospheric moisture and values <0 are related to edaphic moisture. The T/P grains are represented by the Yungas tree pollen taxa.
Carbon and nitrogen stable isotopic analysis of the ESC sediment core
We analyzed the carbon and nitrogen stable isotopic ratios and the total organic carbon and total nitrogen contents of 27 samples of the ESC sediment core. All the samples were prepared at the ISEM laboratory. The sediments were dried, ground, sieved, and weighed (>0.8 mg) in small tin capsules before isotopic analysis, as described in Ledru et al. (2013a). The samples were then sent to the UC-DAVIS (University of California) stable isotope facility for isotopic and elemental C and N analysis. Results are expressed as δ13 C and δ15 N using the conventional delta (δ) notation: δ (‰) = [(Rsample/Rstandard) − 1] × 1000, where Rsample and Rstandard are the 13 C/12 C and 15 N/14 N ratios of the sample and standard, respectively. δ values are expressed in per mil relative to the Vienna Pee Dee Belemnite (V-PDB) and to the atmospheric nitrogen (V-N2/air) standard for C and N isotopic ratios, respectively. Analytical precision was better than 0.2‰ for δ13 C and δ15 N. Results of elemental C and N contents are expressed as (%) and are also presented as C/N ratios.
Isotopic biogeochemistry, δ13 C and δ15 N, is important for understanding the biogeochemical carbon and nitrogen cycles, inferring past climatic and ecological conditions. Interpretation of the carbon and nitrogen isotopic compositions depends upon a thorough knowledge of the key isotopic fractionation factors explaining the wide range of isotopic composition variations observed in nature. Photosynthetic pathways through the inorganic carbon fixation are known to be the main physiological processes affecting the carbon isotopic signatures. Median δ13 C values for C3 and C4 plants are −27‰ and −12‰, respectively. It was commonly believed that altitudinal distribution of C4 plants was reduced to range below 3000 m a.s.l. but C4 plants have been described at altitude higher than 4500 m a.s.l. (Livingstone and Clayton, 1980). C3 vegetation type in highlands of South America predominates, with δ13C values of ~ −27‰ (Powell and Still, 2009), like the Andes and the Altiplano, region in which our study site is located. It is usually agreed that high water availability tends to decrease the δ13 C values of C3 plants (Ma et al., 2012). Besides, δ15 N is related to availability of nutrients and water (Ma et al., 2012). δ15 N values have been observed to be positively correlated with mean annual temperature (Amundson et al., 2003; Martinelli et al., 1999), and negatively correlated with mean annual precipitation (Amundson et al., 2003). In addition, C/N ratios values are used to characterize the source of the bog organic material, autochthonous (~<10; phytoplanktonic and fixed algal), and allochthonous (~>20; vegetal matter from within the catchment; Sifeddine et al., 2004). In this context our analysis is centered on the interpretation of δ13 C, δ15 N, and C/N ratios. The combination of the result allows us to infer hypothesis on changes of parameters such as water availability, sources of organic material and precipitation, and temperature. Recently, Kohn (2016) has suggested that pCO2 dependencies are negligible in isotopic fractionation. Then no correction for pCO2 is needed for the last 7000 years.
Results
Description and chronology of the sediment
The entire core was composed of peat rich in organic matter with a small quantity of silt or silty-clay minerals. Four types of facies were observed, dividing the core into eight units (Figure 2). Unit 8, at the bottom of the core, at a depth of between 74 and 96 cm, was composed of undecomposed plant fibers. The age model showed an age of 7500 cal. yr BP at the base of the core (Table 2). The age depth model suggests continuous low sedimentation with no evidence of gaps in the deposition (Figure 2) and a marked increase in sedimentation between 81 and 61 cm (6130–5430 cal. yr BP). A total of 33 samples each weighing 0.5 g were analyzed for pollen fossil with a resolution of 4 and 2 cm (~ 400 yr for 4 cm and ~ 200 yr for 2 cm).
Palynological and isotopic analysis
The Escalerani sediment core presents high organic carbon and total nitrogen contents ranging from 27% to 54% and ~<1% to ~<3%, respectively. Both C and N contents show little variation along the core without clear trends from the top to the bottom parts of the sediment core, suggesting no severe organic matter degradation through time. The corresponding C/N ratios ranged from ~<14 to ~<60. The δ13 C at the ESC site are typical of C3 plants with values ranging from −27.6‰ to −25.5‰ and δ 15 N ranging from 3‰ to 12.6‰. Five isotopic intervals matched quite well the pollen zones (Figures 3 and 4 and Table 3). Palynological and isotopic results were correlated and are described in Table 3.
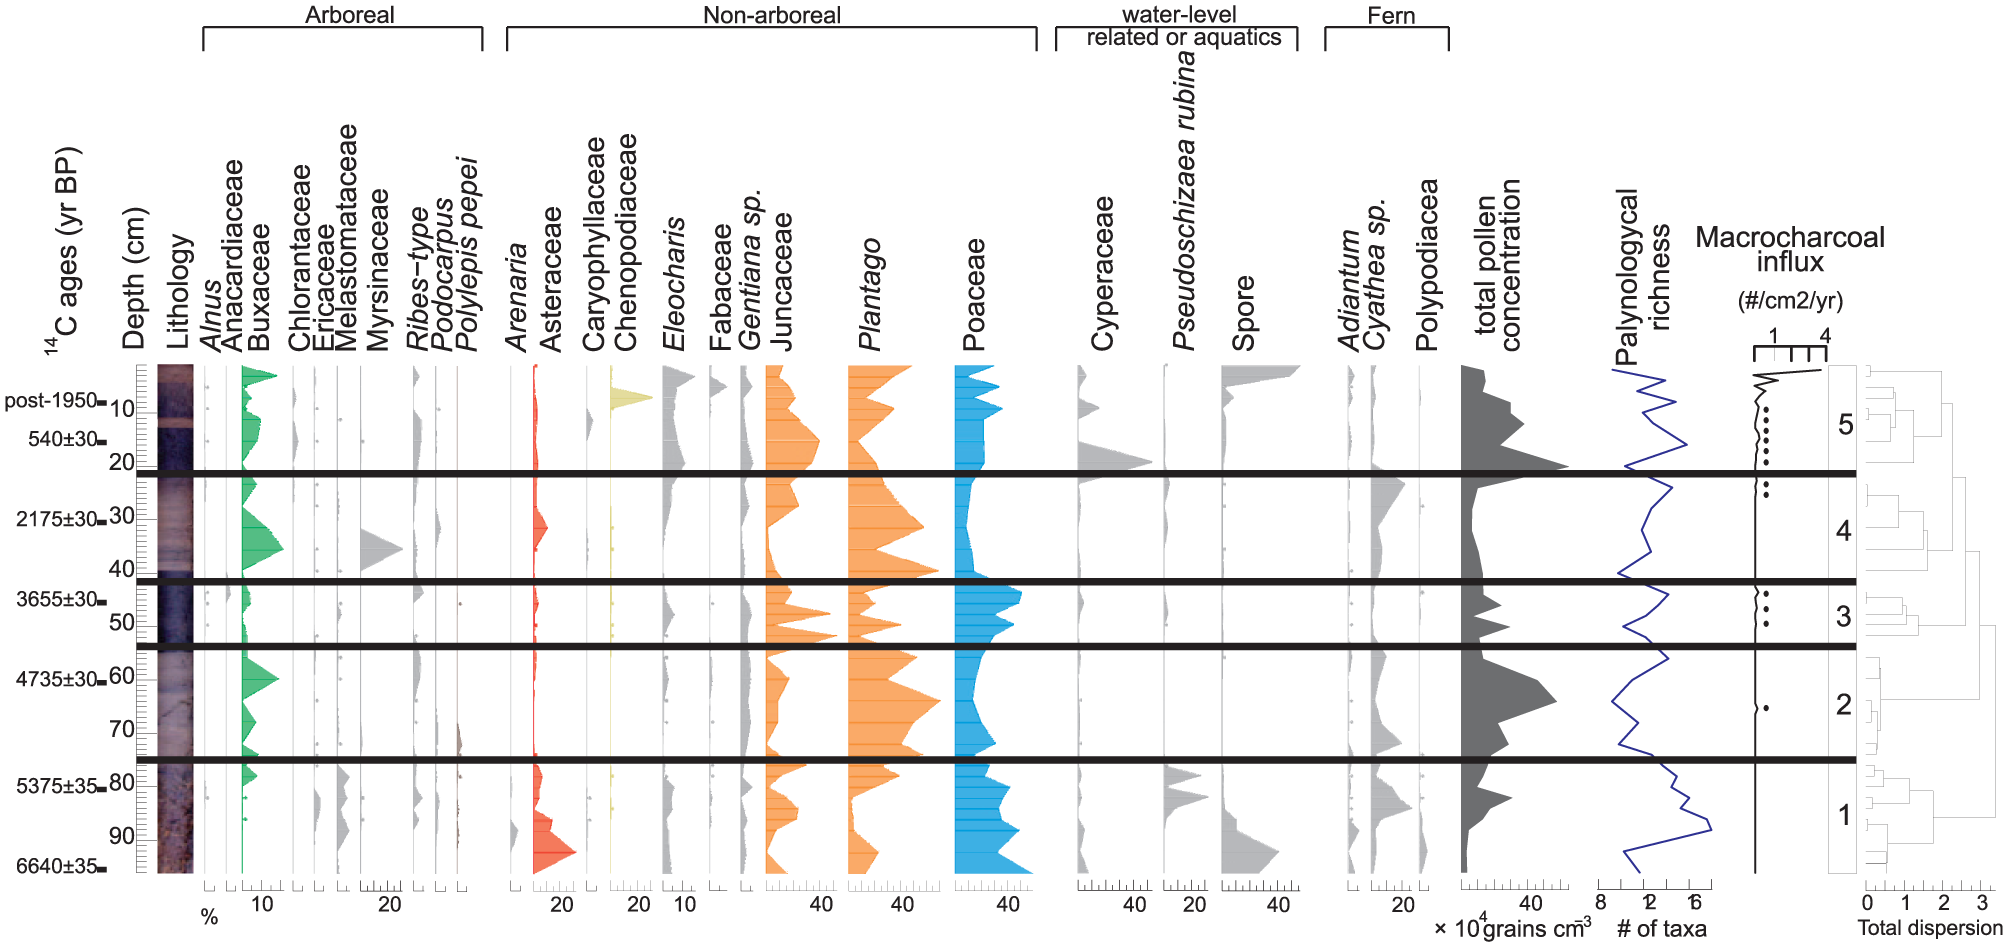
Pollen diagram of the Escalerani (ESC) core. Selected pollen and fern taxa are expressed as percentages of the total sum (except aquatics and ferns) along a depth scale with total concentration, palynological richness, macroscopic charcoal influx, and cluster analysis delimiting the five pollen zones.
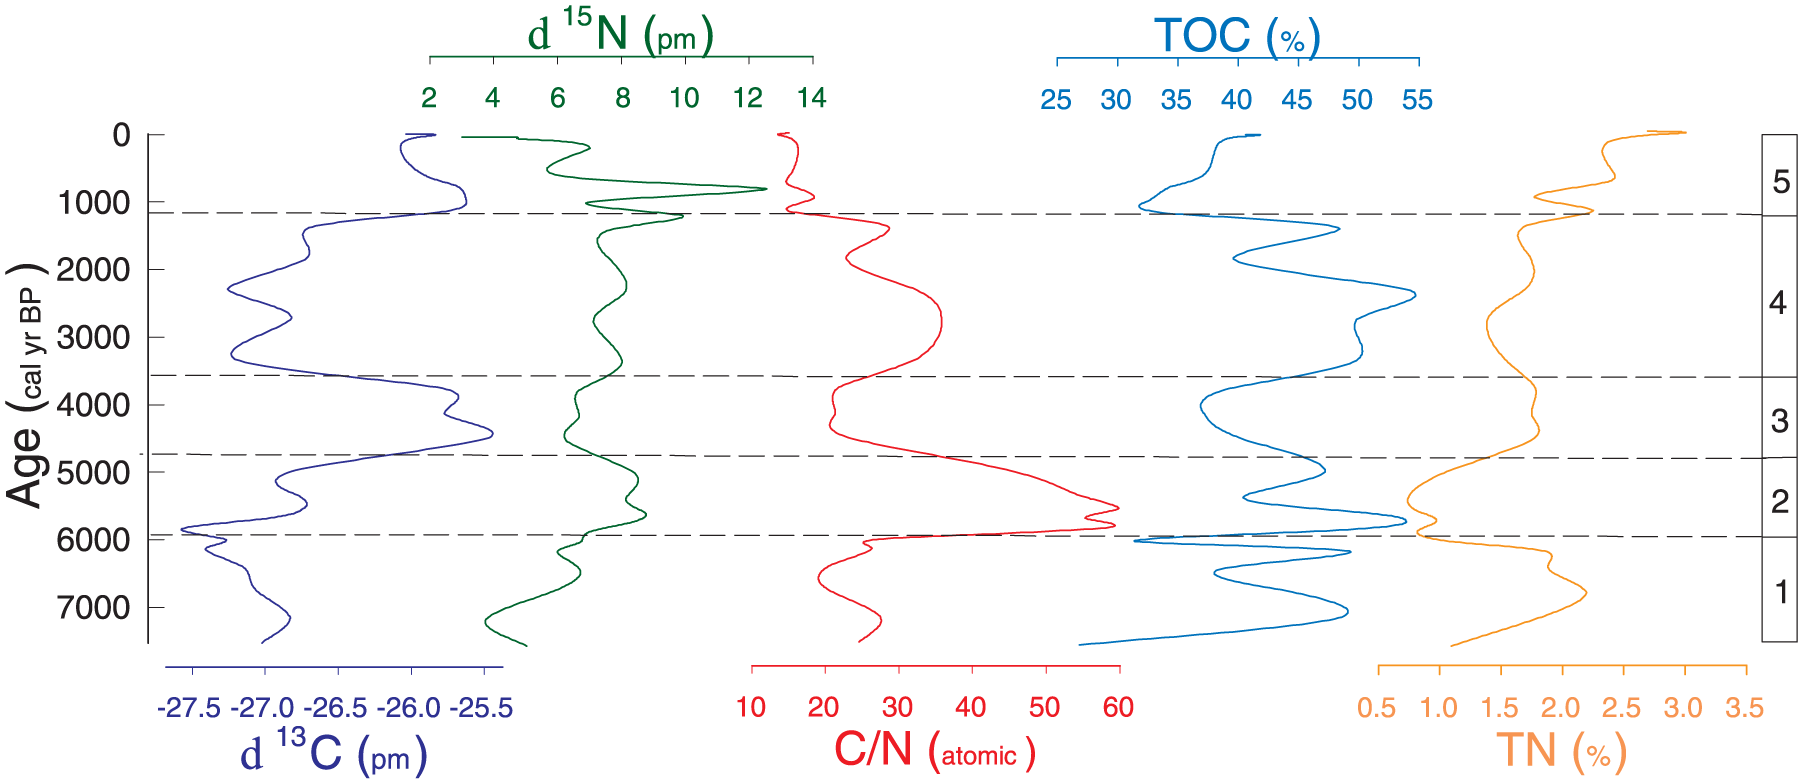
Variations of δ13 C, δ15 N, TOC (total organic carbon), TN (total nitrogen), and C/N ratios of the Escalerani sediment core plotted in front of the pollen zones for the last 7500 years.
Interpretation
Changes in vegetation and climate at Escalerani
In the central Andes, peatlands present different physiognomies according to their plant assemblages. In the eastern Cordillera, the two main species in the bog, P. tubulosa and D. muscoides, form flat cushions (Coronel et al., 2009). According to Alzérreca et al. (2001), these two species are present in soils where water availability remains constant almost throughout the year. However, there is a slight difference in soil moisture where the two species develop. P. tubulosa dominates the bog formation in hydromorphic soils with no submersion and where the water table is superficial, while D. muscoides grows in saturated hydromorphic soils and a water table with surface runoff. In the Escalerani peatland, we observed an anticorrelated link between Plantago and Juncaceae, the plant family of D. muscoides. Experimental studies were recently conducted in Central Andean peatlands, mainly in Juncaceae bogs (e.g. O. andina in Squeo et al. (2006b) and D. muscoides in Hribljan et al. (2015) and Cooper et al. (2015)) to understand their responses to drier and moister conditions. Rapid peat accumulation rates were attributed to an increase in organic matter and organic carbon. The increase in total organic carbon was related to water availability in the peat (Benavides et al., 2013; Cooper et al., 2015; Hribljan et al., 2015), mainly with Juncaceae. These authors showed that when the water table drops and these plants become disconnected from the groundwater, Juncaceae do not survive (Cooper et al., 2015).
Today, the peatland is located at a distance of 4 km from the upper boundary of the cloud forest belt, with the upper limit of the forest at 3100 m a.s.l., 900 m below the bog. According to the modern location of the Yungas and previous published research, we deduce that the Yungas indicator taxa (Table 1) are transported from the Yungas vegetation belt by the wind and deposited on the bog by cloud dripping (Ortuño et al., 2011). The hypothesis that Buxaceae and Cyathea tree species, which are considered as the main indicator taxa for the Yungas vegetation belt, could have migrated near the bog without any other tree components of the forest must be discarded. In addition, other factors like humidity, light, and soil conditions associated with semipermanent fogs would be needed to allow the establishment of the other tree species (Bush, 2002). Poaceae, a family widely distributed in the different ecoregions of Bolivia, shows strong differences in pollen representation, according to the environmental conditions. For instance, Ortuño et al. (2011) shows that Poaceae pollen frequency is higher in the puna (near to 80%) than in the Yungas (<10%). Besides, Poaceae is commonly used as an indicator of soil moisture conditions, owing to its capacity to expand in wetter conditions and its water storage ability (Ledru et al., 2013a; Liu et al., 2005). Therefore, the T/P index variations, which express atmospheric moisture versus soil moisture, are reflecting the variation in cloud convection activity (Figure 5).
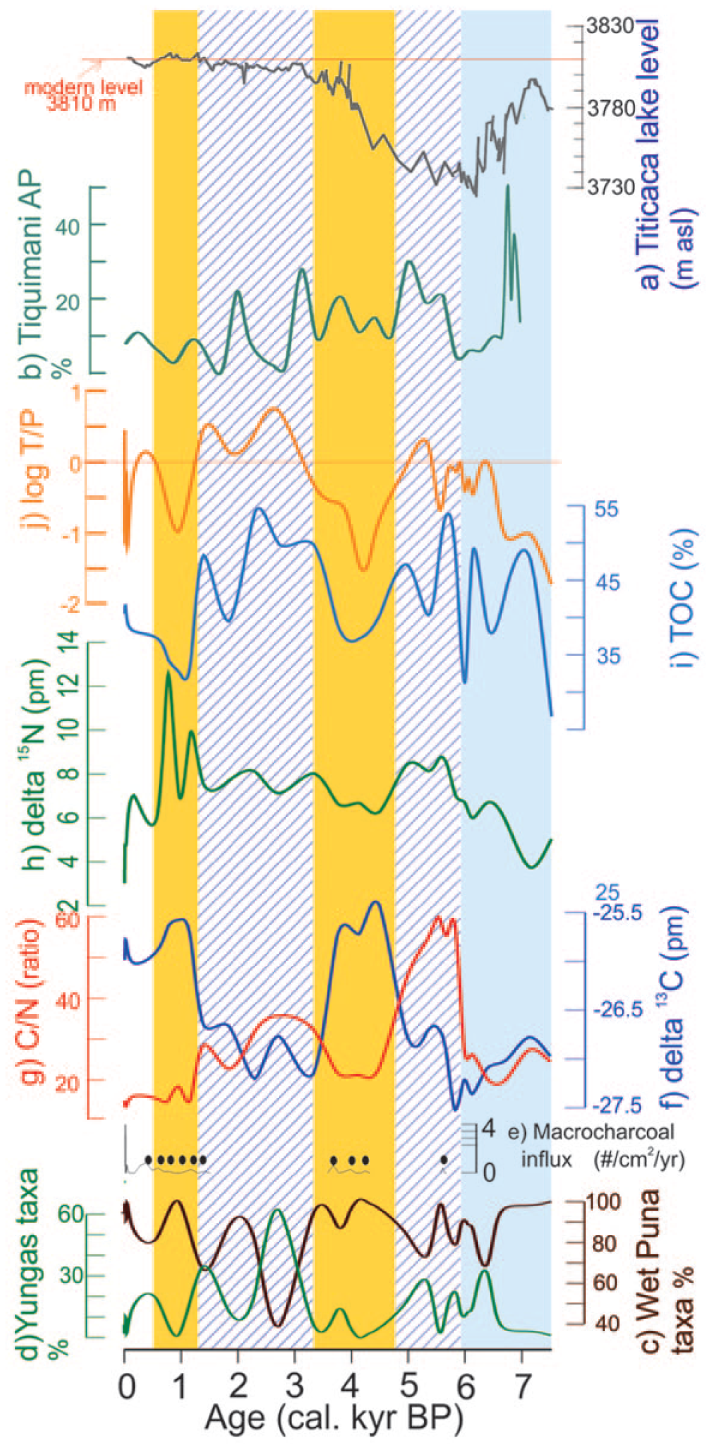
Climate and environmental changes in the Lake Titicaca region over the last 7500 years. Synthetic diagram showing (a) changes in level of Lake Titicaca in the last 7.5 kyr (from Abbott et al., 2003), (b) arboreal pollen frequencies from the Tiquimani record (Ledru et al., 2013b) and for the Escalerani record, (c) the frequencies of puna indicator taxa, (d) the frequencies of Yungas indicator taxa, (e) the charcoal influx, and (f) d13 C values, (g) C/N ratios, (h) d15 N, (i) TOC (%), and (j) T/P index along a timescale. Vertical bands highlight differences in climate conditions, with light blue for moist conditions, blue slashed lines for moister conditions, and yellow for drier conditions.
This is also demonstrated by the δ13C values of C3 herbaceous plants, which show a negative correlation between δ13C and water availability (Wang et al., 2003). δ13C values of two of the most abundant Poaceae species in the area showed a range of −27.8‰ to −25.4‰ (Ledru et al., 2013a). Escalerani C/N ratios values were >20, suggesting a dominance of terrestrial organic matter along the different intervals of time. At Escalerani, the variability of δ13C and δ15N during the different intervals suggests responses of the bog vegetation organic matter to changes in the climatic parameters. A comparison of the different responses of δ13C of C3 plants using a humidity index (HI) in different climate zones showed a strong positive correlation between δ13C plants and HI in arid zones (Liu et al., 2014), where the change in HI depends mainly on evapotranspiration, and the influence of annual temperature is highly correlated with evapotranspiration. Here, we infer that the dry climatic event that prevailed at Lake Titicaca and contributed to the major decrease in lake levels also affected climatic conditions in the wider region. Consequently, a strong influence of temperature was inferred to explain the δ13C enrichment of the C3 plants.
7520–5950 cal. yr BP
The beginning of this interval was dominated by wet puna taxa, mainly Poaceae, and a progressive increase in water availability. This zone starts with low T/P that gradually increases. The δ13 C and δ15 N record a local relatively drier terrestrial vegetation (C/N > 15) characterized by low ETP followed by a signature of wetter conditions with higher ETP (increase in the δ15 N). Likewise, the low T/P index showed that wet conditions were edaphic-related rather than atmospheric-related. This pattern changed at around 6400 yr BP (Figure 5) with the simultaneous increase in P. rubina and in the T/P index revealing a relatively balanced relation between local wetness and cloud convection activity.
5950–4730 cal. yr BP
The simultaneous progressive decrease in wet puna indicator taxa, mainly Poaceae, and the increase in Yungas indicator taxa and T/P index suggest a more intense upslope convective activity. The expansion of Plantago in the bog together with the increase in δ13 C and δ15 N values suggests a reduction in water table. The significantly higher C/N ratio can be interpreted as a predominant contribution of terrestrial organic matter and/or long-distance transported material (which preferentially degrades the more labile nitrogen compounds). In this interval, the single charcoal signal observed at around 5580 yr BP is interpreted as extra-local charcoal transported to the bog because of the high convective activity. This interval characterizes an increase in atmospheric wetness, leading to moister edaphic conditions in the bog.
4730–3560 cal. yr BP
This interval witnessed an increase in both Juncaceae and Poaceae taxa and a decrease in Yungas taxa; in addition, the negative T/P index characterized moister soil conditions in the bog. We thus inferred an increase in water availability in the bog and in the water table, also reflected by the abrupt decrease in the C/N ratio and a reduction in TOC values. The C/N decrease can be a response to an increase in the contribution of autochthonous algae producers. However, that C/N ratios remain >15 also suggests that the bog organic matter biogeochemical proxies reflect the local terrestrial vegetation. The δ13 C increase is interpreted as a reduction of the water availability and the δ15 N decrease as a limitation of the evapotranspiration and/or a change of the nitrogen sources (i.e. nitrate fixation by the algae). It is likely that the installation of a regional arid episode was responsible for the enrichment in δ13 C in the peatland though moister soil conditions prevailed in the bog fed by glacier melting just above the peatland. Drier regional conditions are also supported by the increase in fire frequencies during this interval and the increase in Poaceae.
3560–1150 cal. yr BP
The decrease in Poaceae frequency and the increase in Plantago frequency and T/P index point to a reduction in the bog water table and to moist atmospheric conditions, likely related to more cloud convection activity. The C/N ratio (20−35) still reflects a major terrestrial organic matter contribution to the bog. The decrease of δ13 C (concomitant with the lower Poaceae contribution) suggests that the growth of the ‘newly’ terrestrial C3 plant taxa vegetation is favored by water availability through air humidity in relation to the cloud convection activity. The slight increase in δ15 N relative to the previous period can be interpreted as an increase of the ETP in agreement with higher air humidity. Here, a change of the nitrogen source can be related.
1150–0 cal. yr BP
In this last interval the wet puna taxa is mainly represented by Cyperaceae and Juncaceae. This zone can be divided into two phases. From 1150 to 560 cal. yr BP the decrease in the T/P index and Yungas indicator taxa frequency suggests less cloud convective activity. This situation is similar to zone 3 except for the δ15 N, which is relatively high and variable. We observe lower TOC and C/N. The highest δ13 C ratios in agreement with the increase in Poaceae relate to the lowest δ15 N. The inferred climatic processes in zone 3 are likely similar to those observed in zone 1. We suggest an increase in the bog water table and soil moisture, linked to glacier melting until 560 cal. yr BP. The second phase from 560 cal. yr BP to the present is characterized by higher Plantago frequencies at 150 cal. yr BP and an increase in the T/P index that reflects a balance between soil and atmospheric moisture until today. The slightly higher humidity conditions are in agreement with δ13 C decrease, suggesting a higher amount of humidity. The slight increase in δ15 N is either because of higher ETP or change in the nitrogen source. The increase in fire activity with a high signal in the top part of the core together with the high Chenopodiaceae frequencies suggests the peatland has been used for agriculture during the past 70 years (Ledru et al., 2013a). The significant decrease in the δ15 N (3‰) can be attributed to a higher contribution of Leguminosae able to fix the molecular N2. If agriculture is based on the use of green manures (legumes), it can also explain these lower δ15 N.
The Holocene at Escalerani
The paleoecological record at Escalerani revealed several edaphic and atmospheric hydrological changes during the last 7500 cal. yr BP. The bog started 7500 years ago when the glacier reached an elevation above 4100 m a.s.l. in agreement with the changes observed at Telata where the equilibrium line altitude was reached at 4800 m a.s.l. (Jomelli et al., 2011). At Escalerani, environmental changes are very precise in comparison with the large Lake Titicaca. For instance, charcoal deposition in the Lake Titicaca shows a continuous signal owing to the size of the lake and the continuous human occupation of its margins. Between 5900 and 3500 yr BP (Figure 5), the mid-Holocene was characterized by two phases: first, between 5900 and 4700 cal. yr BP, wet climate conditions because of active convective activity in the site, and second, between 4700 and 3500 cal. yr BP (Figure 5), a drier phase characterized by a decrease in convective activity between the Amazon Basin and the summits of the eastern Cordillera. Late-Holocene is characterized by the succession of a wet, between 3500 and 1300 cal. yr BP, and a dry phase, between 1300 and 560 cal. yr BP (Figure 5).
Discussion
Mid-Holocene episodes
In the central Andes, the hydrological changes in Lake Titicaca are controlled by the regional climate on the Altiplano (Abbott et al., 2003; Baker et al., 2001; Rowe et al., 2002). Changes in the level of Lake Titicaca during the Holocene reflect changes in the regional climate and more specifically the mid-Holocene aridity, characterized by the low level of the lake, which reached 120 m below its present level between 6000 and 4000 yr BP, and related to the low phase of the precession cycle (Baker et al., 2001). The Escalerani record showed that the bog was still active during this arid phase, owing to a continuous supply of the water table, either convective activity or water from glacial melting or both. Water supply in the highland comes from the Amazon Basin thanks to upslope cloud convection; consequently, when Lake Titicaca was at its lowest stand and the climate conditions were dry, high elevation bogs were able to remain moist. At Titicaca, between 7000 and 3100 yr BP, the driest interval occurred between 6000 and 5000 yr BP and was characterized by maximum pollen concentration, high charcoal content, and also the presence of Andean taxa attributed to the cloud dripping activity from the Amazon Basin (Baker et al., 2001; Paduano et al., 2003). The record of Tiquimani, located at 3700 m a.s.l., in a valley of the eastern Cordillera, showed an increase in cloud convection activity between 5800 and 3200 cal. yr BP, which was also observed at Escalerani between 5900 and 4700 yr BP. Differences in the timing are likely related to local environmental conditions such as topography and elevation. Further, phases of glacier melting during the mid-Holocene have been reported at Telata glacier, with a progressive retreat until the late-Holocene, where the increase in temperature and solar radiation would have increased regional temperatures and affected the albedo, thereby increasing glacier melt (Jomelli et al., 2011). The presence of a recently exposed remnant of D. muscoides dated 5200 cal. yr BP at Quelcaya in Peru (Buffen et al., 2009; Thompson et al., 2006) also reinforces the hypothesis of strong ice melting during the mid-Holocene as observed at Escalerani.
In southwestern Peru, at 4450 m a.s.l., a high-resolution record describes the mid-Holocene as a series of alternating episodes of dry and humid spells with a moister phase between 5400 and 4900 cal. yr BP and a drier phase between 4600 and 4200 cal. yr BP (Schittek et al., 2015). The record at Nevado Coropuna, also in southern Peru, at 4400 m a.s.l., showed a similar trend, with the driest episode between 5200 and 3000 cal. yr BP (Kuentz et al., 2012).
Wet and dry phases during the late-Holocene
During the late-Holocene, the record of Escalerani shows first a wet phase between 3500 and 1300 cal. yr BP, in agreement with the moraines of Telata, the tree pollen frequency at Tiquimani (Figure 5b), and the speleothem records (Bustamante et al., 2016). Second, a dry phase between 1300 and 560 cal. yr BP characterized by changes in pollen assemblages, increase in Chenopodiaceae at Tiquimani (Ledru et al., 2013a), and by the low stand of the Lake Titicaca at 1300 cal. yr BP (Abbott et al., 1997) is also observed in northwestern Argentina (Schittek et al., 2016). This dry episode likely provoked the collapse of the Tiwanaku civilization (Abbott et al., 1997).
Influence of the SASM at Escalerani
The progressive enhancement of SASM during the Holocene occurred in response to the increasing insolation during the precession cycle (Bernal et al., 2016; Bustamante et al., 2016; Vuille et al., 2012). In northeastern Peru, high-resolution speleothem and pollen records show that the increase in wetter conditions was interrupted by a series of dry spells throughout the mid-Holocene (Bustamante et al., 2016; Schittek et al., 2015). At Escalerani, the strongest decrease in precipitation was observed between 4700 and 3500 cal. yr BP and related to low monsoon activity at the latitude of Escalerani.
The late-Holocene was characterized by an increase in summer insolation, an increase in the intensity of the SASM because of the southward position of the ITCZ in agreement with the wetter interval observed at Escalerani between 3500 and 1300 cal. yr BP. Indeed, wetter climatic conditions were observed during the late-Holocene, particularly pronounced between 3500 and 3000 cal. yr BP (Bernal et al., 2016) together with increase in the level of Lake Titicaca (Abbott et al., 1997). The last drier interval observed at Escalerani between 1300 and 560 cal. yr BP is related to a weaker SASM in the southernmost tropical latitudes in agreement with the pollen record located in northwestern Argentina (Schittek et al., 2016).
Human activity at Escalerani
Archeological records from ancient roads suggest a continuous movement between highland and lowland populations for trading (Aviles, 1998). Around AD 1100 (850 cal. yr BP), unfavorable climate conditions led to the decline of the Tiwanaku and the migration to new areas (Chepstow-Lusty et al., 2009; Williams et al., 2011). The development of the Pacajes (Aymaras) is related to the cultivation on terraces, later improved by the Incas (Binford et al., 1997; Chepstow-Lusty and Josson, 2000; Chepstow-Lusty et al., 2009; Kuentz, 2009). At Escalerani, we infer the beginning and increase in fire activity could be related to the use of fuel by these new populations that moved to Escalerani at 1130 yr BP. Finally, the record of Escalerani showed that during the last 70 years, an increase in fire activity and the peak of Chenopodiaceae point to a direct use of the peatland by local population. These differences in fire activity were not observed at Titicaca because of the size of the lake and the location of the core in the deepest part of the lake. Schittek et al. (2016) point out that peatlands offer unique opportunities to investigate timing and character of climatic shifts in the Central Andes, indicating their importance not only for their ecological functions, but also for their historical record. In this context, Escalerani peatland offers a good signal for climatic events, free of direct human activity, during the last ~7500 cal. yr BP.
Conclusion
The paleoecological record at Escalerani shows that bogs of the Altiplano remained permanently moist during the Holocene from the beginning of their formation, between 8000 and 7000 cal. yr BP, until today. Permanent moist conditions have been enabled by glacier melting and water evaporation from the trees in the Amazon Basin lifted to high elevations through convective activity along the slopes of the Cordillera. The moisture enabled the preservation of plant diversity and probably of human activity under regional arid climatic conditions when the ITCZ remained located further north and the SASM became weaker, as for instance, between 1300 and 560 cal. yr BP. We highlight the differences in responses to global and regional climate changes between a big lake, such as Lake Titicaca, and the bog of Escalerani located above the lake. Furthermore, the bog of Escalerani responded sharply to changes in the SASM activity, to changes in glacier melting, and to changes in the intensity of the cloud upslope convection from Amazonia and our results showed that high Andean ecosystems are also highly sensitive to global climate changes. Today, the Andean glaciers have almost disappeared and Amazonia is being progressively deforested, putting pressure on these peatlands and on the resources they represent for local populations.
Footnotes
Acknowledgements
The authors thank Jorge Molina-Rodriguez (Instituto de Ecología), Elodie Brisset (ISTerre), and Cesin Curi for support during fieldwork and Emilia Garcia for helpful comments and for solving some doubts concerning plant physiology.
Funding
This research benefited from an ISEM-IRD research grant in 2015 and 2016. All radiocarbon dating was performed in the framework of the agreement between IRD and LMC14 (CEA-CNRS-IRD-IRSN-MCC).