
Abstract
River valleys are critical water-gas-rock interactions zone, where close interaction between fluvial and aeolian deposition are a pronounced feature in arid, semi-arid, and semi-humid environments. Pedo-sedimentological investigations were carried out in the Jin-Shaan Gorges of the Yellow River valley. Two late-Pleistocene and Holocene aeolian sand-loess profiles were identified within the cliff riverbank. The aim of this study is to reveal the palaeoclimatic conditions and driving factors for the formation of palaeo-aeolian sand in the Jin-Shaan Gorges of the Yellow River valley. Five samples were taken from the aeolian sand-loess profiles for optically stimulated luminescence (OSL) dating. The OSL ages are in stratigraphic order and range from 12.8 ± 0.7 ka to 11.8 ± 1.0 ka. By combining OSL ages with additional stratigraphic correlations, the deposition period of the palaeo-aeolian sand is dated to 12.5–11.8 ka, which would place it at the Younger Dryas (YD) time interval that punctuated the last glacial-Holocene transition period. The formation of palaeo-aeolian sand in the region was due to sufficient sediment supply from the riverbed sand of the Yellow River, strong East Asian winter monsoon, and strong wind erosion. These results give insights into the palaeoclimatic and palaeoenvironmental conditions for the formation of aeolian sand associated with the river valleys in semi-arid and sub-humid regions.
Keywords
Introduction
The formation and evolution of aeolian deposits are an important part of the Earth’s surface depositional system and play critical roles in human survival and development (Daniel, 2013; Prospero and Lamb, 2003). Especially aeolian deposits are important archives for understanding aeolian sedimentary and geomorphological processes as well as their dynamic responses to paleoclimatic variation (Lancaster, 2008; Peng et al., 2016; Singhvi and Porat, 2008). River valleys are critical water-gas-rock interactions zone, where close interaction between fluvial and aeolian deposition is a pronounced feature in arid, semi-arid, and semi-humid environments (Al-Masrahy and Mountney, 2015; Bullard and Livingstone, 2002; Shen et al., 2012; Van Huissteden et al., 2000; Zhou et al., 2014). Primary sedimentary structures of deposits in these environments, mainly fluvial and aeolian sand, can be very useful to reveal the dynamic interaction between fluvial and aeolian processes (Van Huissteden et al., 2000; Vandenberghe et al., 2013).
Aeolian processes can be affected by modification of wind regimes by fluvial landforms in the river valleys. Therefore, driving factors for the formation and evolution of aeolian sand layers (or aeolian sand dunes) associated with valleys have been investigated in arid, semi-arid, and semi-humid environments (Bullard and Livingstone, 2012; Bullard and Nash, 1998, 2000; Loope et al., 1995; Ma et al., 2017; Nanson et al., 1995; Shen et al., 2012; Wang et al., 2004; Zhou et al., 2014). Bullard and Nash (1998) studied four types of aeolian sand dune variation on a valley margin in the southwestern Kalahari Desert and two main factors which influence the evolution of these associations were identified as the effect of the valley upon sediment supply and the effect of the valley upon wind regime. Ma et al. (2017) found that the source of aeolian sand dunes in the upper Yellow River valley which are interbedded in the fluvial coarse sand and floodplain silt are built through aeolian reworking of the underlying fluvial sand. Shen et al. (2012) identified dynamics of aeolian sandy land in the Yarlung Zangbo River valley and noted that the climate-dominated natural factors are the internal driving forces for the development of aeolian sandy lands, and the human factors are the external driving forces responsible for the increase of the aeolian sandy land area. Zhou et al. (2014) described the geomorphology and evolution of aeolian landforms within the Yarlung Zangbo River valley, and highlighted a number of significant differences in the formation mechanisms between arid and humid aeolian sand dunes associated with valleys.
The Jin-Shaan Gorges of the Yellow River valley is located in a semi-arid and sub-humid monsoon climate region. Aeolian sand was found to be widely distributed on ramp platform in the river valley. We investigated the chronology of the palaeo-aeolian sand in the BSY-a and BSY-b profiles adjacent to Beisangyu village. And the objective of this study is to reveal the palaeoclimatic conditions and driving factors for the formation of palaeo-aeolian sand in the Jin-Shaan Gorges of the Yellow River valley.
Geographical setting
The Yellow River originates from the Tibetan Plateau and runs eastward across the Loess Plateau and the Ordos Plateau of North China (Figure 1). The river is characterized by an extremely high sediment discharge of 1.6 × 10⁹ tons/a, the highest sediment discharge in the world (Xu et al., 2009). The middle Yellow River, ca. 1206 km long with a drainage area of 344,000 km2 has been deeply dissected into the Permian and Triassic sedimentary bedrock forming the Jin-Shaan Gorges (U-shaped valleys), which extends from Hekou to Longmen between Shanxi (Jin) and Shaanxi (Shaan) provinces. The Jin-Shaan Gorges is 723 km in length with a drainage area of 111,600 km2. The river channel drops 607 m with 400–600 m in width along the gorges (Figure 2). There are 10 fluvial terraces covered with thin gravel bed and thick aeolian loess and paleosol sequence distributed intermittently along the Jin-Shaan Gorges (Hu et al., 2016).
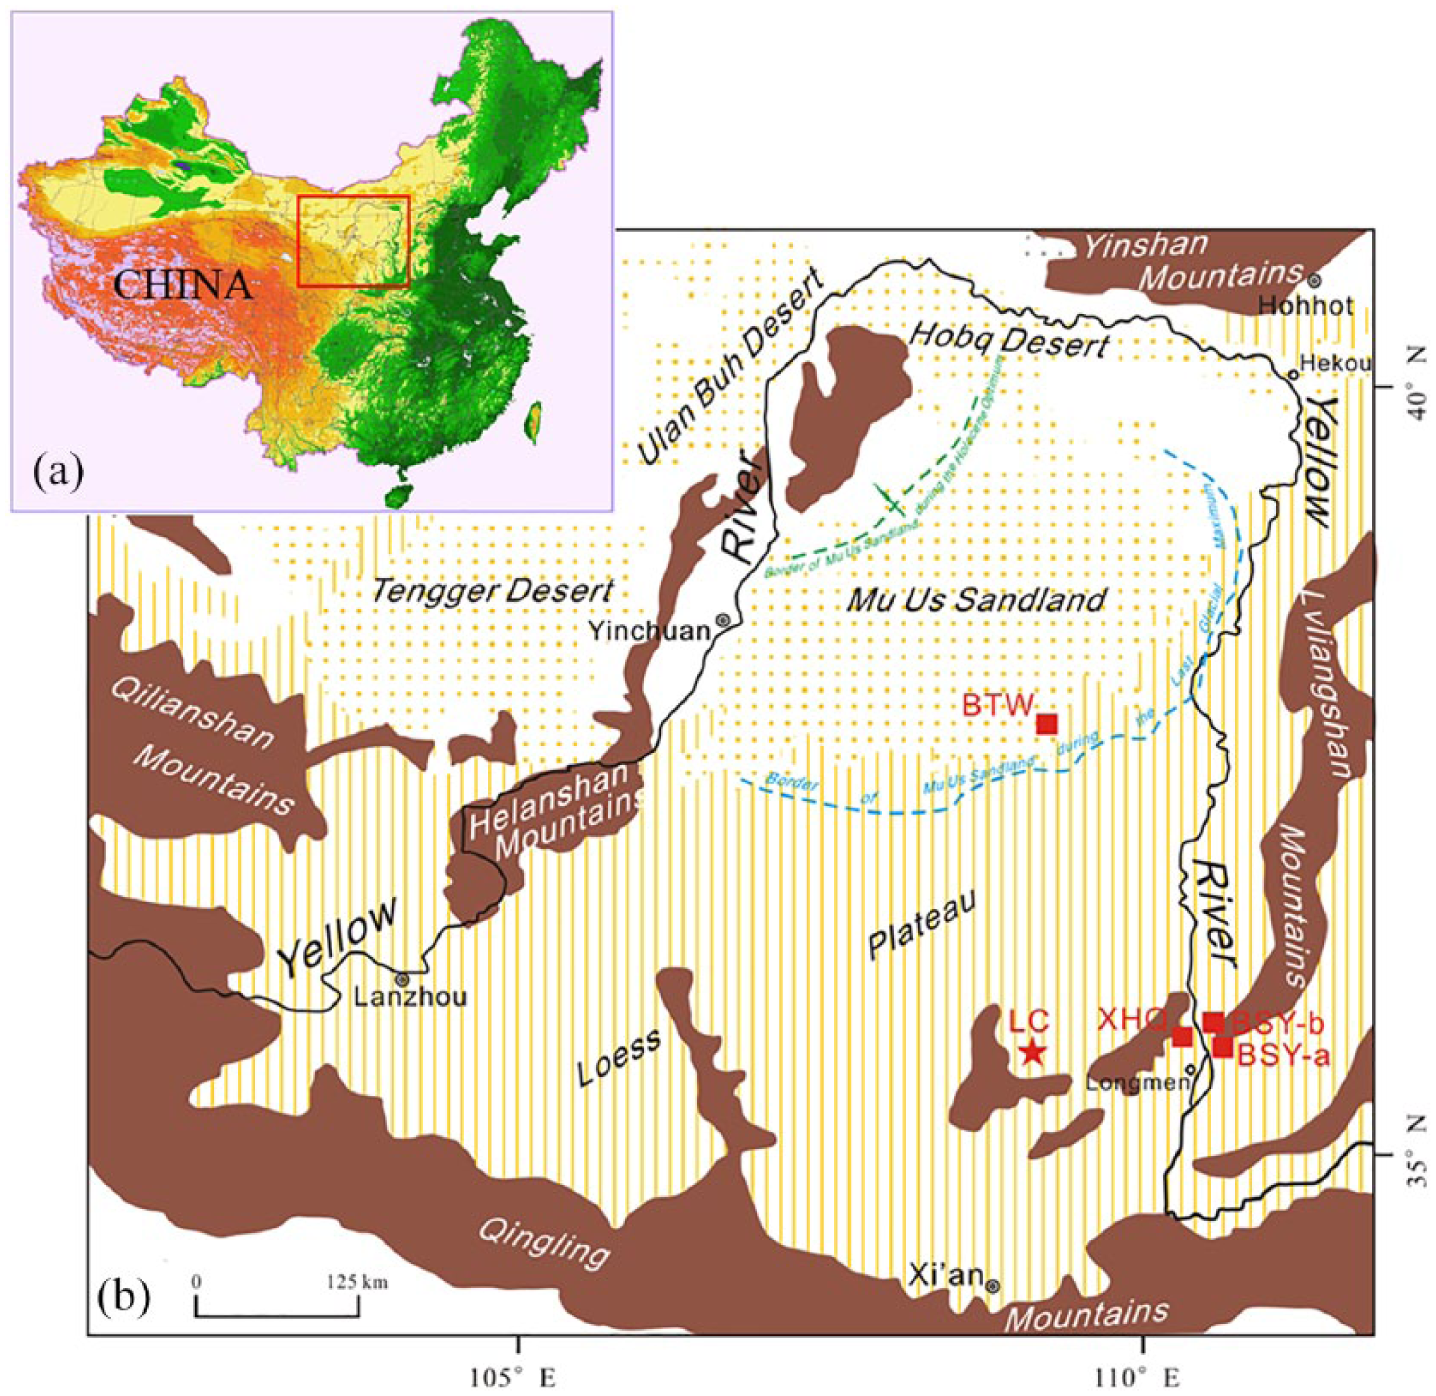
(a) Location of the upper and middle reaches of the Yellow River. (b) The BSY-a, BSY-b, XHQ and BTW sites are marked with red squares. Another comparative site (LC) in the central Loess Plateau (Liu et al., 2018) is marked with red pentagrams. And the border of the Mu Us Sandland during the Last Glacial Maximum and the Holocene Optimum marked with ‘—’, which indicated that the deposition of paleo-aeolian sand is irrelevant to the extension of the Mu Us Sandland since the Last Glacial Maximum (Xu et al., 2013).
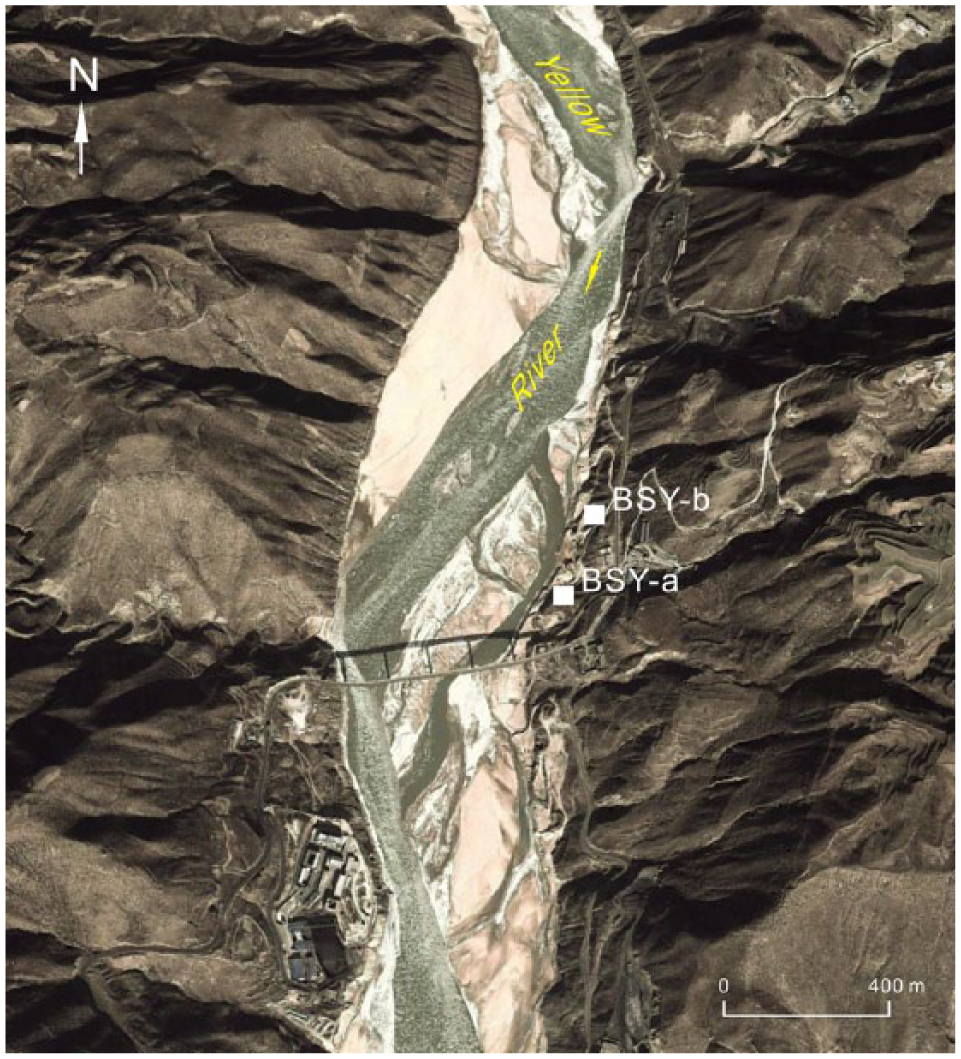
Satellite image showing the exposed floodplains and channel bars in winter 2010 at the BSY-a and BSY-b sites in the Jin-Shaan Gorges of the Yellow River.
The middle Yellow River is situated in the semi-arid and sub-humid zones and its present climate is influenced by the East Asian monsoon (EAM) circulation. The mean annual temperature varies in a range of 3.8–11.8°C and the mean annual precipitation is 300–550 mm regionally. The hydro-climatic conditions are characterized by very high seasonal variability; about 61.6% of rainfall occurs from July to September. Drought has always been the most serious natural disasters in the Jin-Shaan Gorges. Here drought disasters not only occur at high frequency, but also have a long duration, a wide range, and a great harm (Bureau of Hydrology and Water Resources in the Middle Reaches of the Yellow River, 2005). There are numerous records and narratives on drought disasters in the middle reaches of the river. For instance, ‘hot is enough to scorch the soil and melt metals, smoke rises from the ground, grasses die out in the field, no grains are harvested, people with a bone-and-flesh relationship eat each other, and nine houses out of ten are deserted’. In this region, the mean annual wind speed is 2 m/s, and the maximum wind speed during the winter and spring is 24 m/s.
Study sites, sampling, and measuring techniques
Study sites and sampling
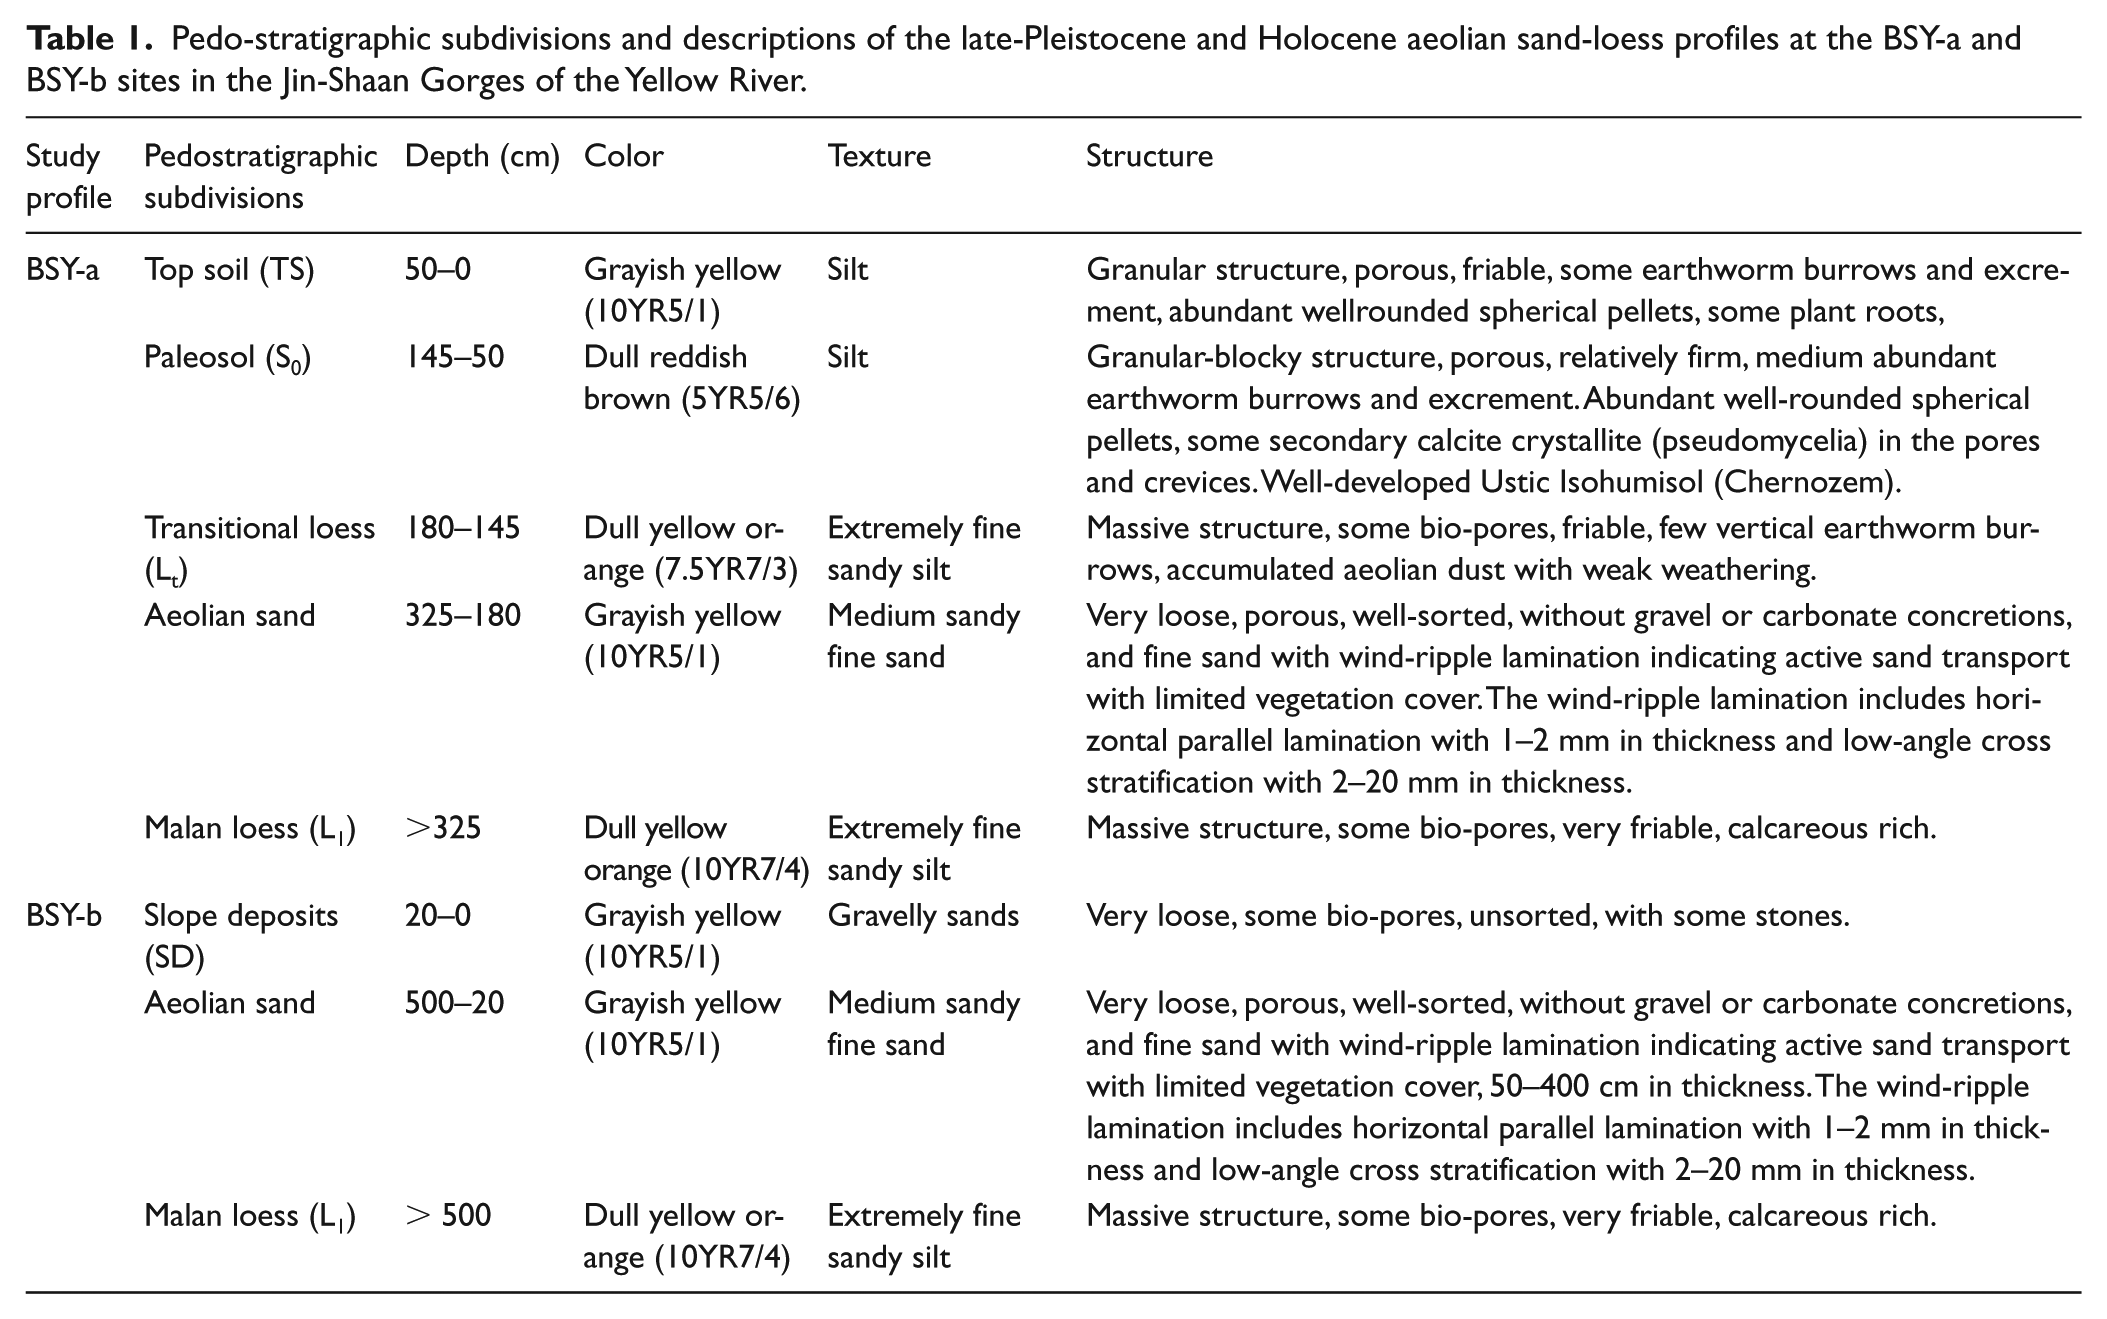
Extensive and detailed fieldwork was carried out in the Jin-Shaan Gorges of the Yellow River between 2015 and 2017. BSY-a and BSY-b profiles were examined and pedostratigraphically described in detail (Figure 3, Table 1). Geomorphologic conditions, preservation conditions, and sedimentary features of the palaeo-aeolian sand in these two profiles can be summarized as follows: (1) Geomorphological conditions – the palaeo-aeolian sand, interbedded in the late-Pleistocene and Holocene aeolian sand-loess profiles, is located on ramp platform of the left riverbank (Figure 3). (2) Preservation conditions – the palaeo-aeolian sand (50–400 cm in thickness) extends along the terrain surface of the late-Pleistocene Malan loess. The distance of horizontal extension of the palaeo-aeolian sand is up to 10 m in the BSY-b profile. The thickness of the palaeo-aeolian sand gradually decreases from the top to the two sides (Figure 3b). (3) Sedimentary features – the palaeo-aeolian sand is grayish yellow, well-sorted, very loose, without gravel or carbonate concretions, and fine sand with wind-ripple lamination indicating active sand transport with limited vegetation cover (Figure 3b). The wind-ripple lamination of the palaeo-aeolian sand includes horizontal parallel lamination 1–2 mm in thickness and low-angle cross stratification 2–20 mm in thickness. After detailed observations and establishment of pedostratigraphical subdivisions, two samples for sedimentary analysis were collected from the late-Pleistocene Malan loess and the palaeo-aeolian sand. In order to accurately identify sedimentary features and provenance of the palaeo-aeolian sand, two samples were taken from the modern riverbed sand of the Yellow River (XHQ) and the modern dune sand on the southeast margin of the Mu Us Sandland (BTW), respectively, for comparative study (Figure 1).
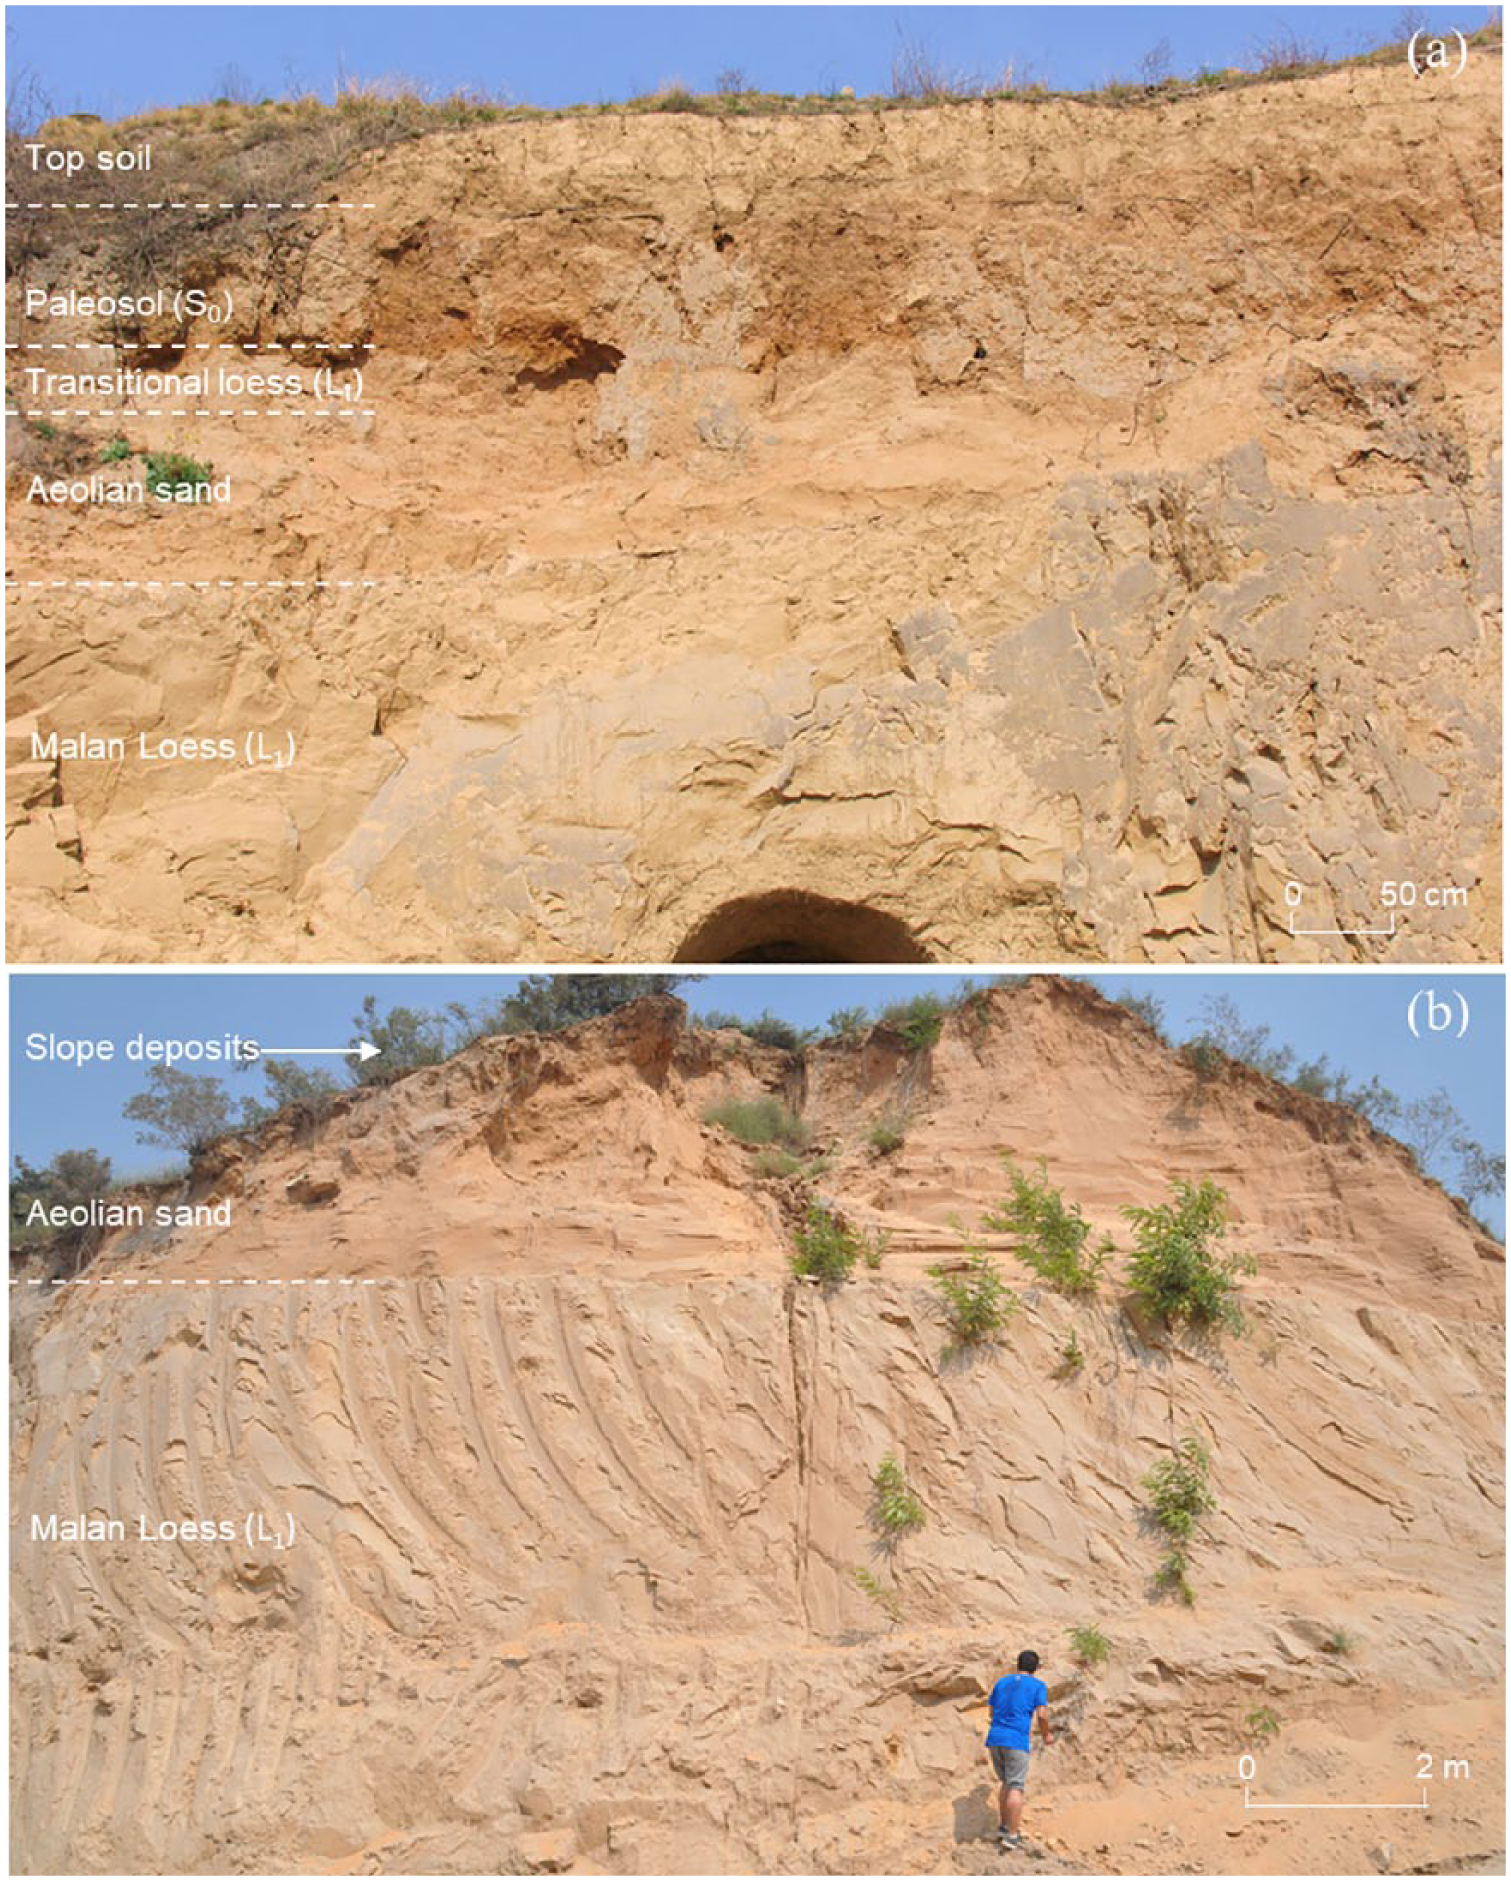
The late-Pleistocene and Holocene aeolian sand-loess profiles containing paleo-aeolian sand at the (a) BSY-a and (b) BSY-b sites in the Jin-Shaan Gorges of the Yellow River.
Pedo-stratigraphic subdivisions and descriptions of the late-Pleistocene and Holocene aeolian sand-loess profiles at the BSY-a and BSY-b sites in the Jin-Shaan Gorges of the Yellow River.
After detailed observations and establishment of pedostratigraphical subdivisions, one optically stimulated luminescence (OSL) sample was collected from the palaeo-aeolian sand in the BSY-a profile and another four OSL samples were collected from the late-Pleistocene Malan loess (L1) and the palaeo-aeolian sand in the BSY-b profile (Figure 4). All OSL samples were taken by hammering metal tubes into the thoroughly cleaned profile. After removal of tubes, the open ends were immediately closed with plastic caps and additional tape to avoid light exposure and moisture loss.
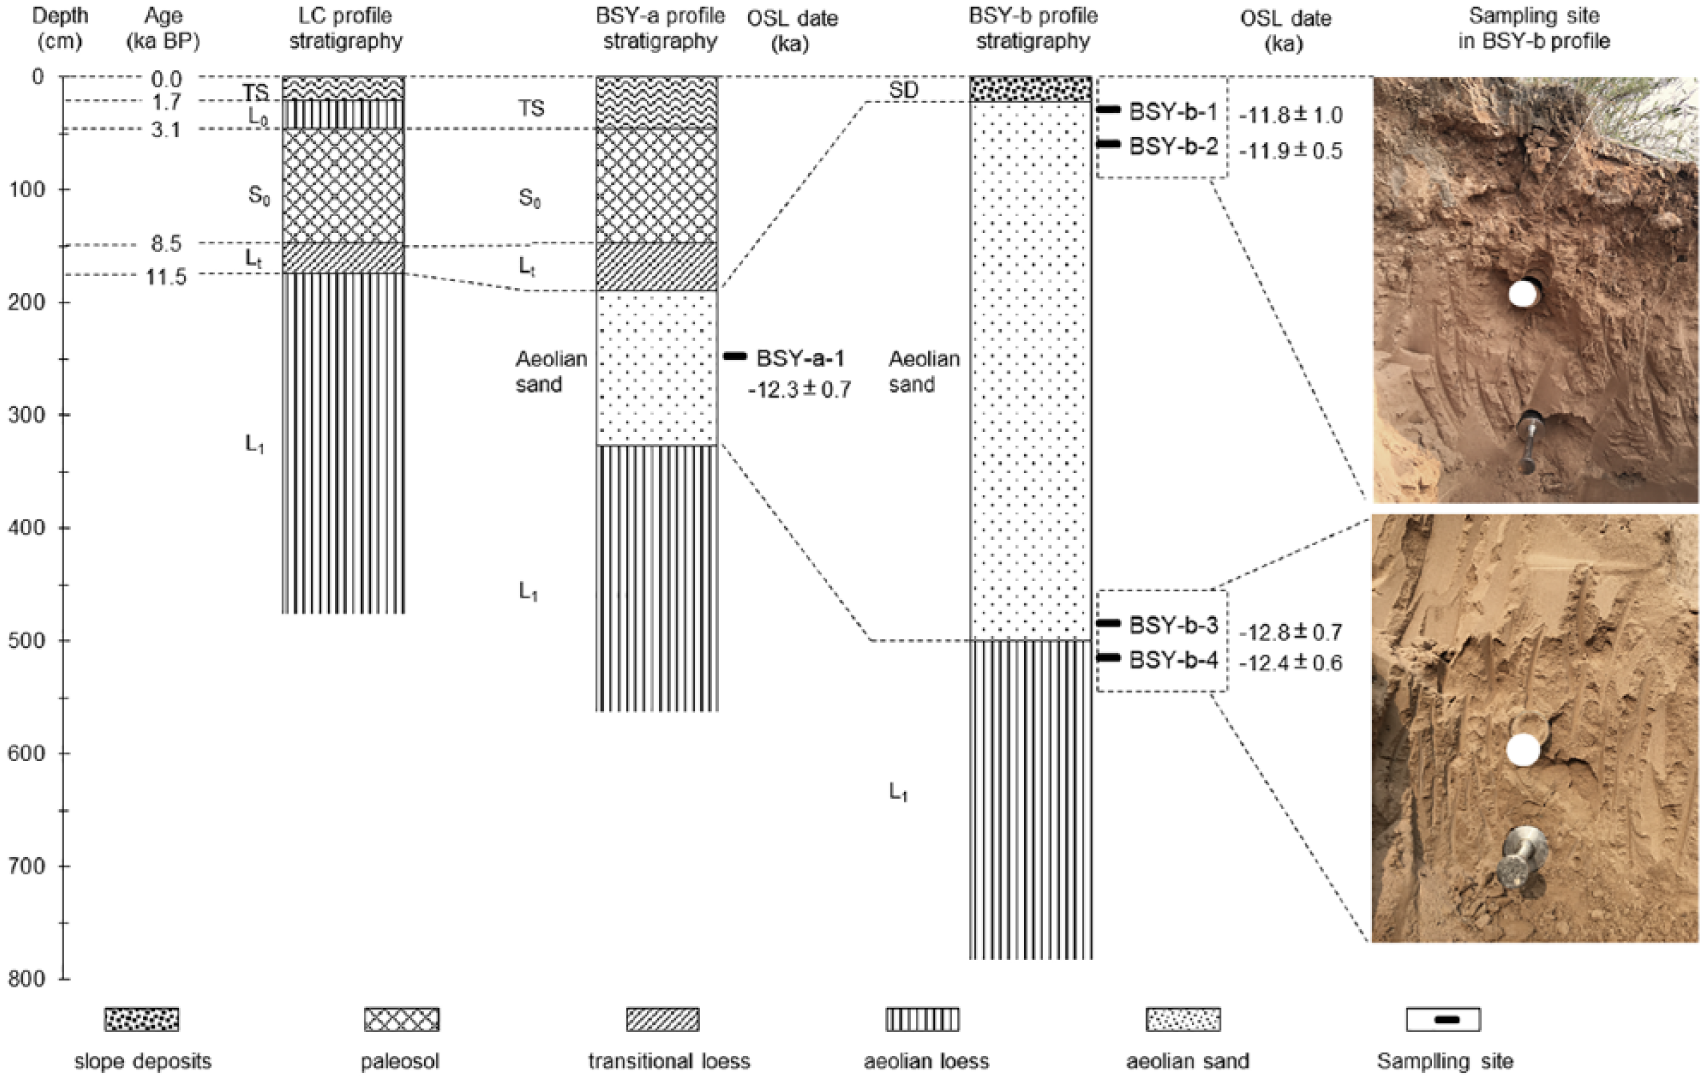
Stratigraphic correlations between the late-Pleistocene and Holocene aeolian loess-soil profile at the LC site in the central Loess Plateau (Liu et al., 2018) and the late-Pleistocene and Holocene aeolian sand-loess profiles at the BSY-a and BSY-b sites in the Jin-Shaan Gorges of the Yellow River.
Optical luminescence dating and equivalent dose determination
Sediments at each end of the luminescence sample tube that may have been exposed to light were scraped away. Where necessary, OSL samples were reacted with 10% HCl and 30% H2O2 to remove carbonate and organic materials, respectively. The samples were analyzed in the OSL laboratory at Shaanxi Normal University using coarse-grained fractions (90–125 μm). These 90–125 μm grain fractions were separated by wet sieving, and the quartz grains were isolated by density separation, using heavy liquids of specific gravity 2.62 and 2.75 g/cm3. The quartz grains were dried and then treated with 40% HF for 40 min to remove the outer layer, irradiated by alpha particles and any remaining feldspars. The grains were further treated with 10% HCl for 1 h to remove fluorides created during the HF etching. The separated quartz grains were finally mounted on the center part (with a diameter of ~0.5 cm) of aluminum aliquots (with a diameter of 9.7 mm) with silicone oil for measurement.
The luminescence measurements were carried out using an automated Risø TL/OSL-DA-20 reader equipped with blue diodes (470 ± 30 nm, ~50 mW/cm2) and IR laser diodes (830 nm, ~145 mW/cm2) (Lapp et al., 2009). At least 24 aliquots per sample for equivalent dose determination (De) determination were measured using a modified single-aliquot regenerative-dose protocol (SAR) (Murray and Wintle, 2000, 2003). The obtained SAR data were processed via the software Analyst v4.53. Data outside the range of the following standard quality criteria were rejected: a recycling ratio error < 10%, a test dose error < 10%, and a recuperation of < 10% (relative to the natural signal). The OSL signal was detected with an EMI9235 QB15 photomultiplier tube with 7-mm-thick Hoya U-340 glass filter and calculated by subtracting the average of the last 4 s (background signal) from the first 0.8 s (5 channels) of the signal decay curve. The OSL decay curves of the natural dose for the samples BSY-b-3 and BSY-b-4 show rapid decay dominated by the fast component of the signal (Murray and Wintle, 2003). Growth curves were fit within saturating-exponential fits to calculate D e values (Figure 5a and b). The reader is equipped with a 90Sr/90Y beta source delivering 0.138 Gy/s and IR laser diode (830 nm, ~145 mW/cm2).
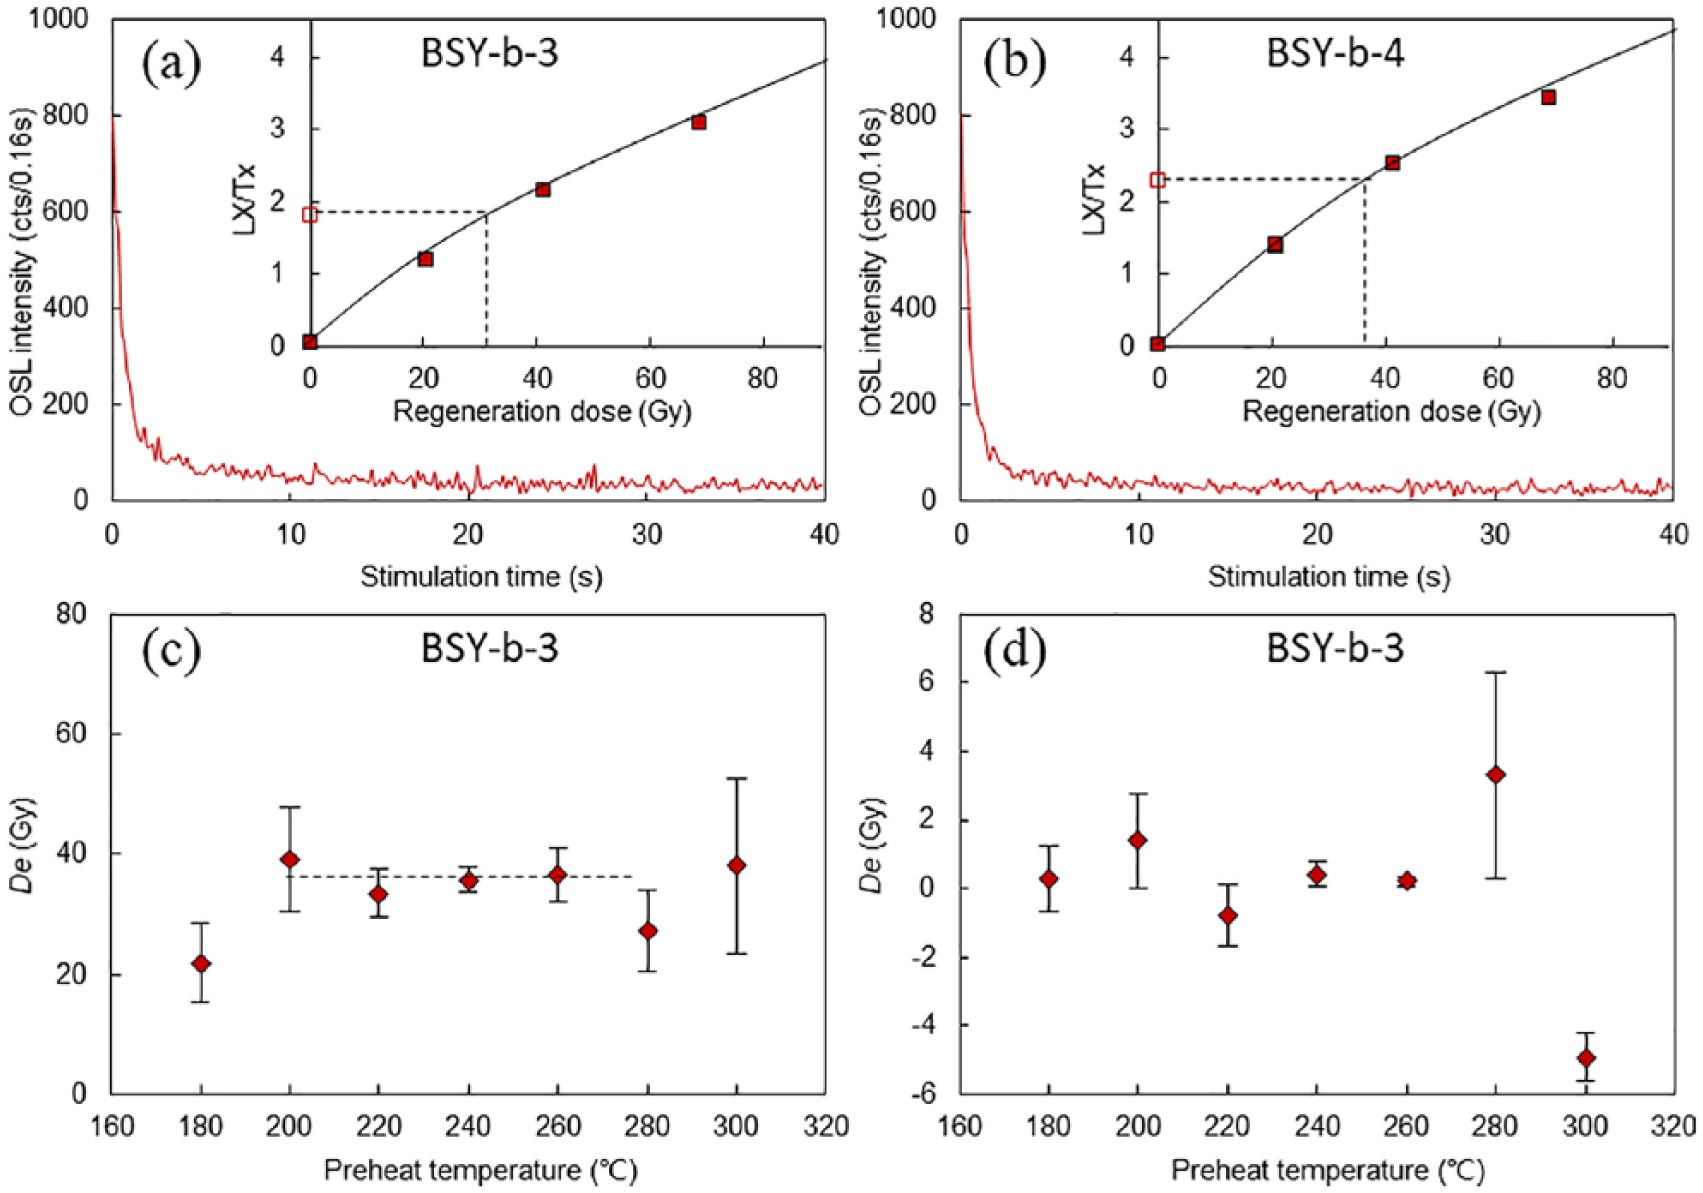
(a) Decay curve and growth curve for the sample BSY-b-3, (b) decay curve and growth curve for the sample BSY-b-4, (c) preheat temperature plateau test using the sample BSY-b-3, and (d) thermal transfer test using the sample BSY-b-3.
De for each aliquot was determined according to the results of the preheat temperature plateau and thermal transfer tests of sample BSY-b-3; in this test, preheat used was 240°C for 10 s, and cut-heat 200°C for 10 s after De plateau test (Figure 5c and d). Dose recovery test was also carried out on sample BSY-b-3 to check the performance of SAR measurements as described by Murray and Wintle (2003). Fifteen aliquots were stimulated twice by blue diodes at room temperature for 100 s with a 10,000 s room temperature storage, and each aliquot was then given a laboratory dose of 35.17 Gy. The aliquots were then measured using SAR protocol to obtain De values, giving an average of 33.69 Gy.
Dose rate determination
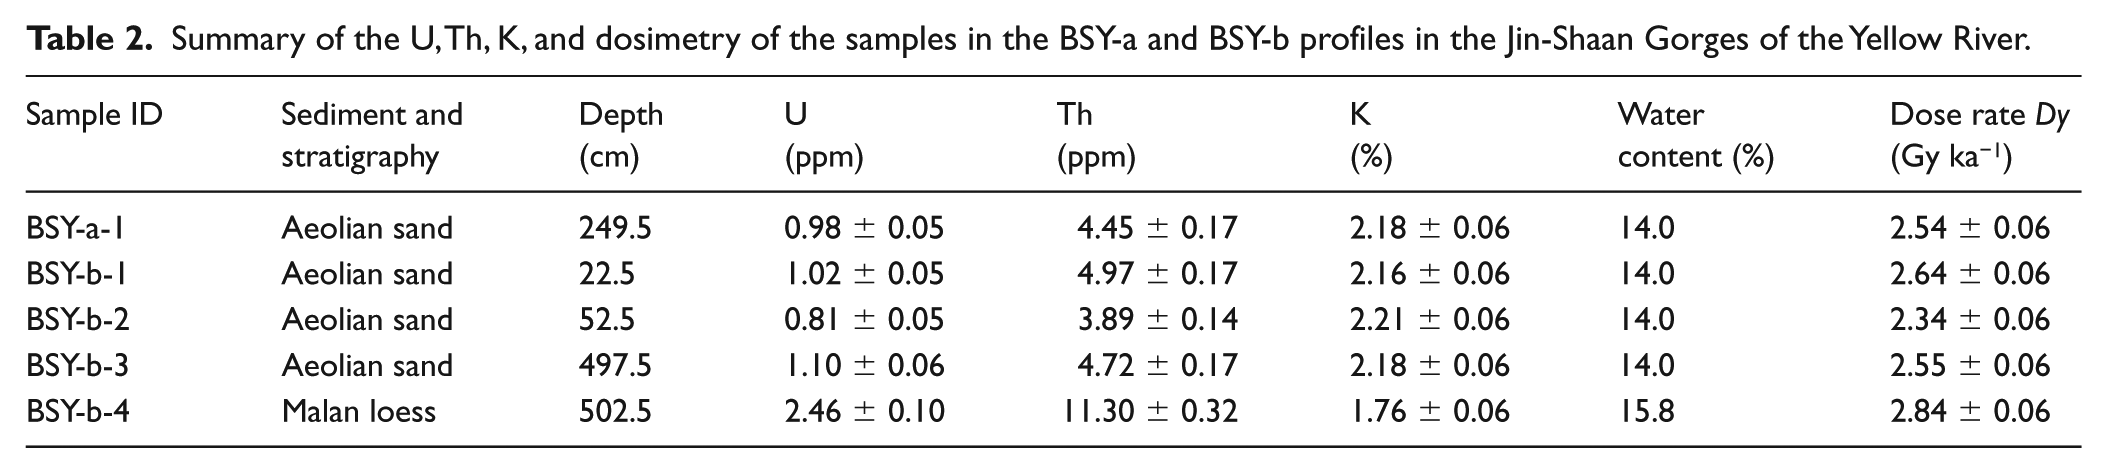
Dose rates were calculated from the U, Th, and K concentrations determined by Neutron Activation Analysis (NAA) (Table 2). The cosmic-ray dose rate was estimated for each sample as a function of depth, altitude, and geomagnetic latitude (Prescott and Hutton, 1994).
Summary of the U, Th, K, and dosimetry of the samples in the BSY-a and BSY-b profiles in the Jin-Shaan Gorges of the Yellow River.
Proxy analyses
Prior to analysis, the samples were air-dried in the laboratory. Grain size was determined using a Mastersizer-2000 laser analyzer with (NaPO3)6 as a dispersing agent after pretreatments with 30% H2O2 to remove organic materials and 10% HCl to dissolve carbonates. Geochemical elements were analyzed using a Panalytical PW2403 x-ray Fluorescence Spectrum.
Results and interpretations
Grain size distribution
Grain size distribution of various samples at the BSY-b and XHQ sites in the Jin-Shaan Gorges of the Yellow River are shown in Figure 6a. The grain size distribution of the palaeo-aeolian sand in the BSY-b profile is dominated by fine sand (45.59%), with the graphic medium at 219.05 µm and mean at 213.17 µm, respectively, and it presents grain size distribution similar to that of typical modern dune sand on the southeast margin of the Mu Us Sandland (BTW). It is thus defined as medium sandy fine sand. It should be noted that similar grain size distribution does not manifest that they have a similar source, but can be caused by similar wind dynamic conditions. Some studies have shown that the expansion of the Mu Us Sandland since the Last Glacial Maximum has not reached the southern section of the Jin-Shaan Gorges of the Yellow River (Jia et al., 2015; Xu et al., 2013) (Figure 1). The grain-size distribution of the modern riverbed sand of the Yellow River (XHQ) is dominated by medium sand (31.58%) with the graphic medium at 203.49 µm and mean at 140.98 µm, respectively. It is thus defined as silty medium sand. This is because the Jin-Shaan Gorges of the Yellow River has a high river bed gradient (0.84‰) and the gushing torrential Yellow River with strong transporting energy that can carry coarse sediments. Therefore, the modern riverbed sand of the Yellow River has a large amount of coarse sediments. The grain-size distribution of the late-Pleistocene Malan loess (L1) in the BSY-b profile is dominated by silt (71.07%) with the graphic medium at 19.76 µm and mean at 24.16 µm, respectively and it exhibits grain size distribution, similar to that of typical loess deposits from the central Loess Plateau. They are thus all defined as silt. The result indicates that they are all deposited from the dust storms and dust falls which are mainly transported by the East Asian winter monsoon (EAWM) (Liu, 1985).
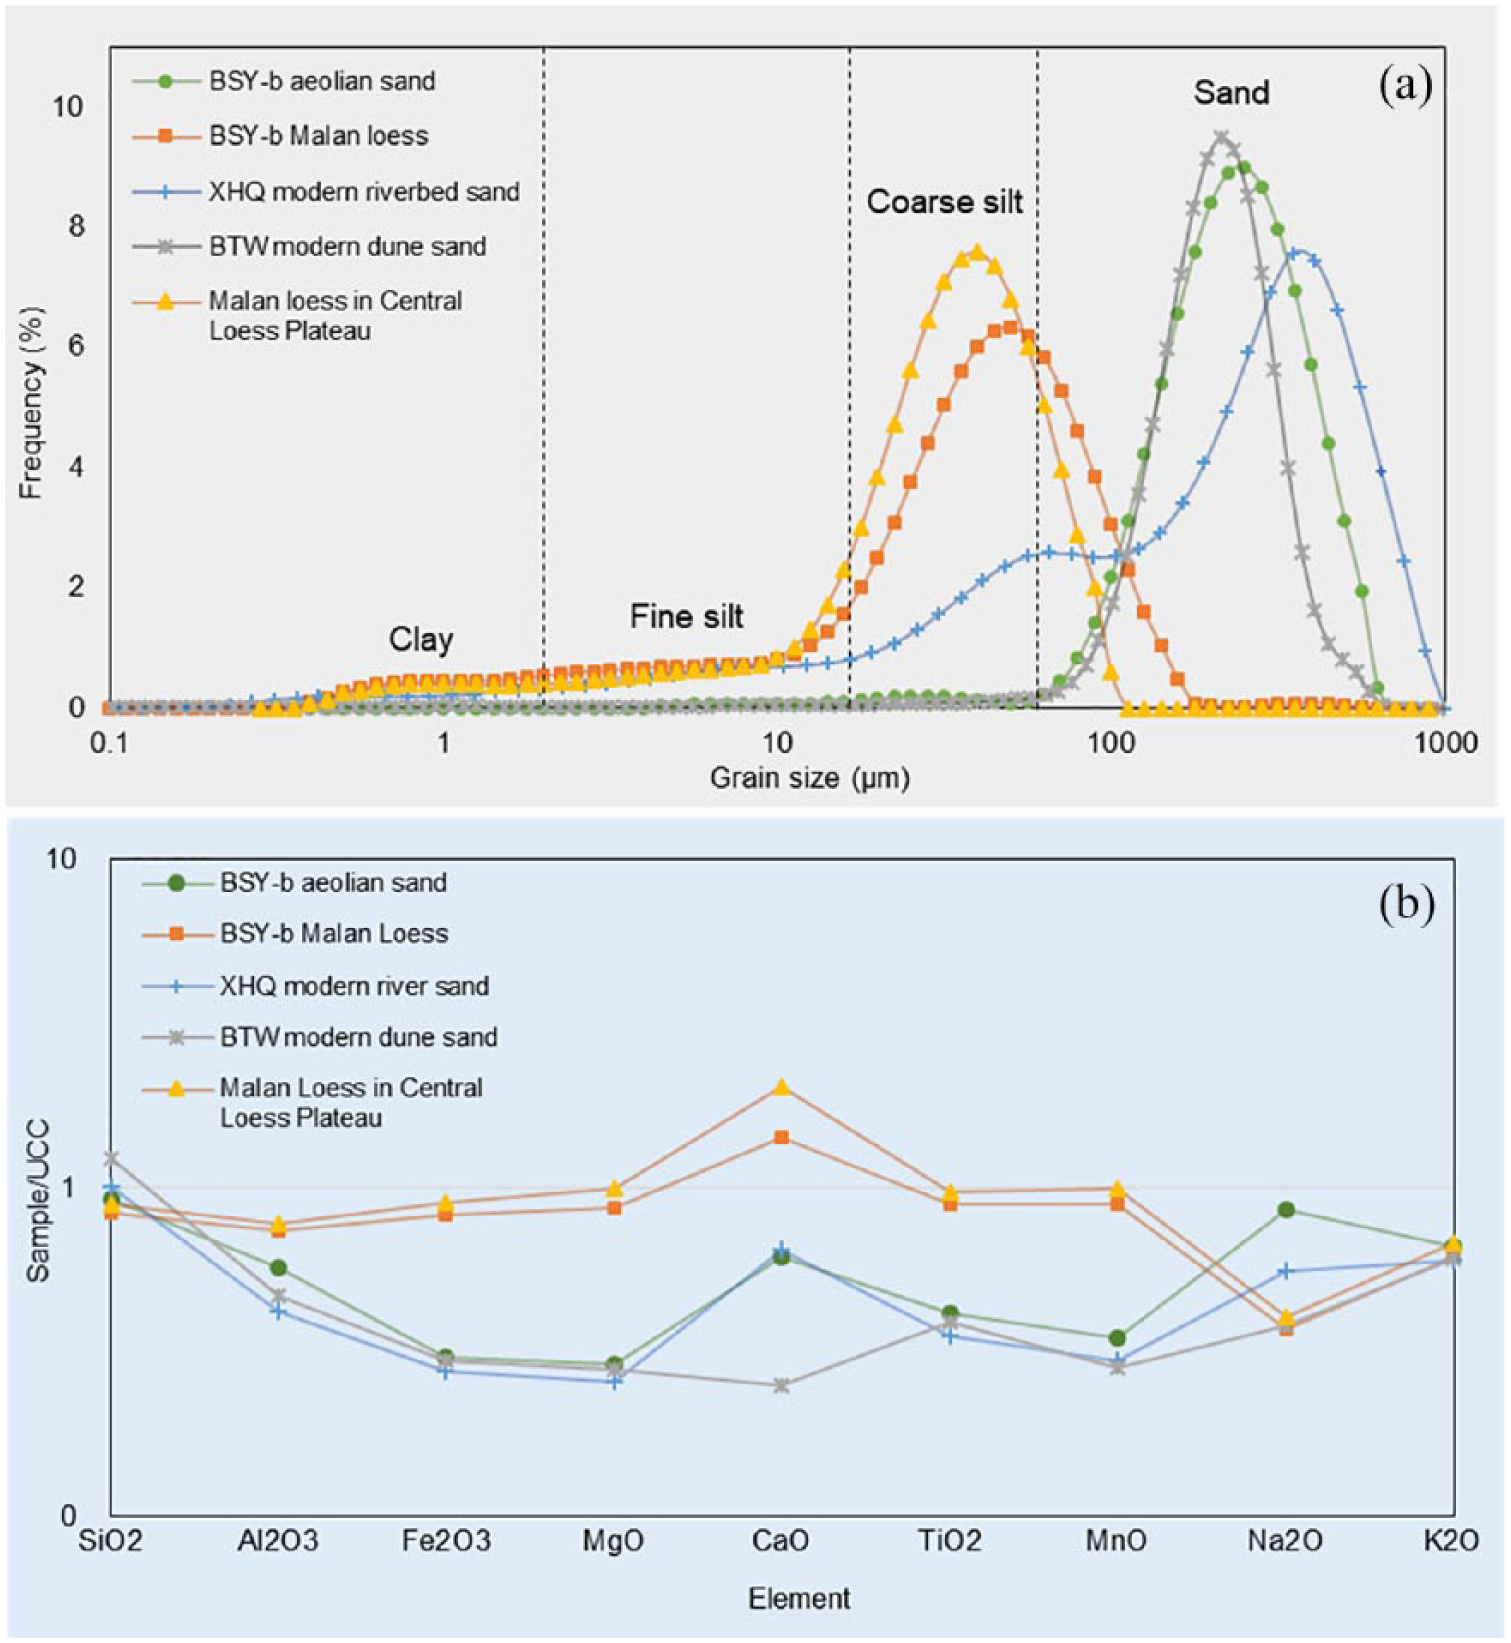
(a) A comparison of grain size distribution frequency curves between the samples of the late-Pleistocene and Holocene aeolian sand-loess profile at the BSY-b site in the Jin-Shaan Gorges of the Yellow River and other sediments. (b) A comparison of sample/UCC (Hu and Gao, 2008) ratio curves between the samples of the late Pleistocene and Holocene aeolian sand-loess profile at the BSY-b site in the Jin-Shaan Gorges of the Yellow River and other sediments.
Geochemical properties
Major elements of the various samples at the BSY-b and XHQ sites in the Jin-Shaan Gorges of the Yellow River and the BTW site on the southeast margin of the Mu Us Sandland, normalized by corresponding elements of the Upper Continental Crust (UCC, Hu and Gao, 2008), are shown in Figure 6b. SiO2 in well-sorted palaeo-aeolian sand in the BSY-b profile, modern riverbed sand of the Yellow River (XHQ) and modern dune sand on the southeast margin of the Mu Us Sandland (BTW), is enriched relative to the late-Pleistocene Malan loess (L1) in the BSY-b profile. Coarse-grained aeolian particles are usually enriched in quartz, feldspar, and carbonate (Pye, 1987). The enriched quartz in these sand samples increases their SiO2 content. In contrast, Al, Fe, Ca, Mg, Mn, and Ti are depleted in these sand samples. Major elements of the late Pleistocene L1 exhibits a distribution pattern different from the palaeo-aeolian sand in the BSY-b profile, but similar to that of the late Pleistocene L1 in the central Loess Plateau (Gallet et al., 1996). The result also suggests that these aeolian loess deposits are all sourced from the Asian interior desert lands (Liu, 1985). It should be noted that the late-Pleistocene L1 in comparison with the palaeo-aeolian sand in the BSY-b profile is characterized by Na depletion. The Na depletion may have resulted from mineralogical transformation due to higher precipitation.
OSL ages
In the case of wind-borne sediments, resetting of the latent luminescence signal to a sufficient near-zero residual value almost always occurs (Hilgers et al., 2001). The R package ‘Luminescence’ (Kreutzer et al., 2012) that offers plot_KDE() and plot_Histogram() for dose-distribution visualization to illustrate the distributions of De values and analyze the factors affecting the scatter in De, such as microdosimetric variability within the sediment matrix or partial bleaching was used. For the samples in the BSY-a and BSY-b profiles in the Jin-Shaan Gorges of the Yellow River valley, overdispersion (OD) values are generally less than or close to 20% and dose distributions are either symmetric or only slightly positively and negatively skewed (Figure 7, Table 3). We calculated the OD values (18%) from the spread in dose estimates obtained from dose recovery experiments (Figure 8). It can be indicated that these aeolian samples are subject to microdosimetric variability within the sediment matrix and there is little reason to infer partial bleaching (e.g. Burrough and Thomas, 2008; Jacobs et al., 2006; Olley et al., 2004; Roberts et al., 2000). Many other studies have also shown that up to 20% OD values among De estimates for single aliquots and individual grains of quartz that are known or thought to have been well bleached or adequately heated before irradiation (e.g. Burrough and Thomas, 2008; Jacobs et al., 2006; Olley et al., 2004; Roberts et al., 2000). Furthermore, Arnold et al. (2007) have proposed a more formal decision process for selecting between these models, based on values of sample statistics such as overdispersion (OD), skewness (sk), kurtosis (k) and relative standard deviation (RSD). For this reason, the central age model (CAM) was considered to be the most appropriate estimate of true sample De and was used in this study (Galbraith et al., 1999). As shown in Table 3, one OSL date (12.3 ± 0.7 ka) was obtained from the middle part of the palaeo-aeolian sand in the BSY-a profile. And, another four samples were taken from the BSY-b profile for OSL dating. The OSL dates are in stratigraphic order and range from 12.8 ± 0.7 ka to 11.8 ± 1.0 ka.
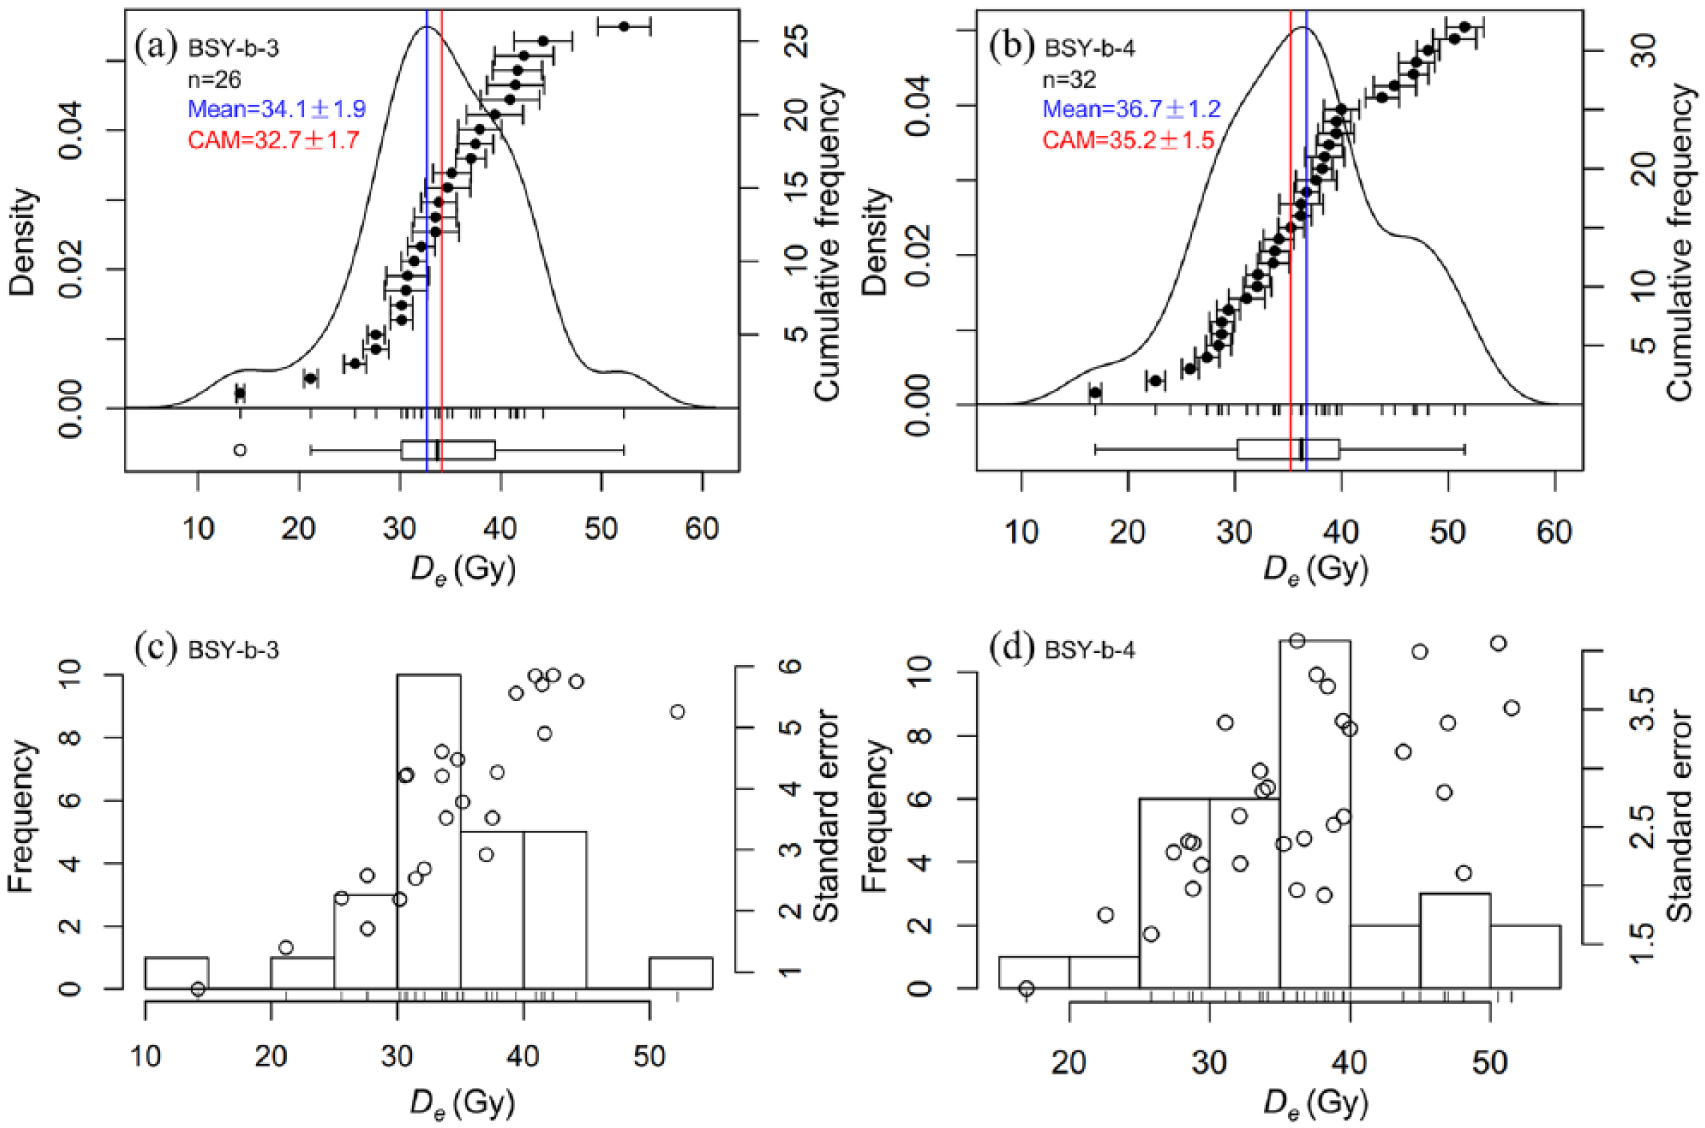
Plot_KDE() for the sample (a) BSY-b-3 and (b) BSY-b-4. Plot_Histogram() for sample (c) BSY-b-3 and (d) BSY-b-4.
Summary of the equivalent dose and OSL dates of the samples in the BSY-a and BSY-b profiles in the Jin-Shaan Gorges of the Yellow River.

N: total number of aliquots measured per sample; n: number of measured aliquots accepted for De analysis; OD: overdispersion; RSD: relative standard deviation.
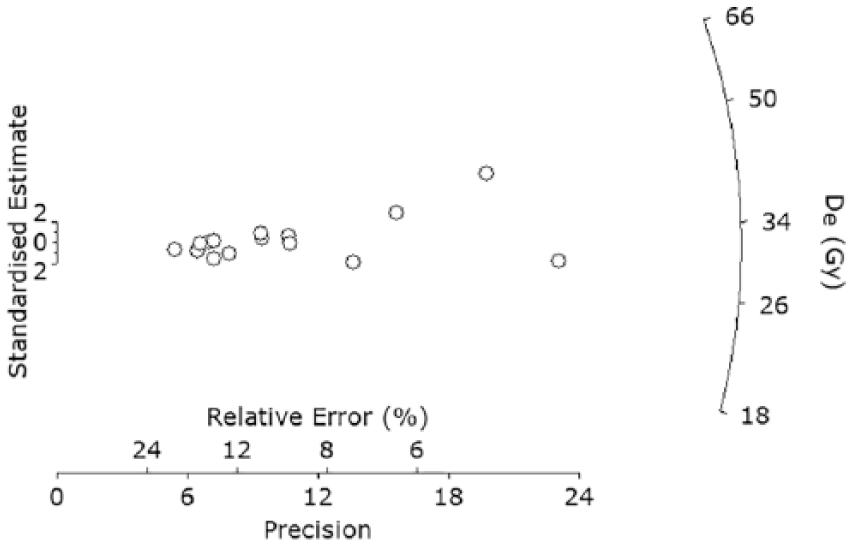
Radial plot of the fifteen disks De estimates obtained from dose recovery experiments for the sample BSY-b-3. Equivalent doses are plotted on a log scale and relative standard errors are indicated on the horizontal axis. The De estimates are overdispersed by about 18%.
Discussion
Clearly different sedimentary and geochemical features have been identified between the palaeo-aeolian sand and the aeolian loess sediments in the BSY-a and BSY-b profiles in the Jin-Shaan Gorges of the Yellow River. The grayish yellow palaeo-aeolian sand, consisting loose fine sand with high SiO2 content, displays wind-ripple lamination indicating active sand transport. The deposition period of the palaeo-aeolian sand was determined with two lines. First, pedostratigraphical correlation to a well-dated late-Pleistocene and Holocene aeolian loess-soil profile at the LC site provides an initial chronological framework for the study profiles BSY-a and BSY-b (Figure 4). Previous research has suggested that the well-developed late-Pleistocene and Holocene aeolian loess-soil profiles in the central Loess Plateau are broadly correlated with each other because of their aeolian origin (Liu, 1985; Liu et al., 2018). Our fieldwork shows that the palaeo-aeolian sand overlies the late-Pleistocene Malan loess in the BSY-a and BSY-b profiles. This stratigraphical structure indicates that the palaeo-aeolian sand in these two profiles was deposited at the same period (Figure 4). A set of OSL ages obtained from the palaeo-aeolian sand at the BSY-a and BSY-b sites provides the second line. One sample collected from the middle part of the palaeo-aeolian sand in the BSY-a profile, yielded an OSL date of 12.3 ± 0.7 ka. Three OSL dates were obtained from the palaeo-aeolian sand in the BSY-b profile: 12.8 ± 0.7 ka, 11.9 ± 0.5 ka, and 11.8 ± 1.0 ka (Table 3). In addition, one sample collected from the top part of the late-Pleistocene L1 in the BSY-b profile was dated to 12.4 ± 0.6 ka. These results indicate that the deposition period of the palaeo-aeolian sand occurred at 12.5–11.8 ka, coincided within time error with the YD event which punctuated the last glacial-Holocene transition period (Broecker et al., 2010). Furthermore, palaeo-aeolian sand of a similar period also deposited in the Otindag, Hobq and Hulun Buir sand fields, respectively near our investigated sites (Jin et al., 2004; Li et al., 2002, 2007; Sun et al., 2006; Zhou et al., 2009).
Numerous independent high resolution investigations of the last glacial and Holocene climatic change in different regions have identified the prominent YD event. For example, the δ18O signal in the GISP2 ice cores from the Greenland ice cap has identified the cold YD episode in Greenland (Figure 9a; Svensson et al., 2008). The redness record of Qinghai Lake sediment since the late glacial time has revealed a late glacial climate sequence in which the cold, dry YD episode at 12.9–12.0 ka was followed by the warm Holocene (Figure 9c; Ji et al., 2005). The anomalous decrease in the East Asian summer monsoon (EASM) rainfall at the YD episode was indicated by the δ18O time series of speleothem from Dongge and Sanbao Caves in southern China (Figure 9b; Cheng et al., 2016) and the grain size (<5 µm) of the paleosol–loess profile at Wangguan site in the central Loess Plateau (Figure 9e; Guan et al., 2007). In contrast, the strong East Asian winter monsoon (EAWM) and the anomalous increased wind intensity at the YD episode was documented by the grain size (>40 µm) of the paleosol–loess profile at the Wangguan site (Figure 9d; Guan et al., 2007). All these facts can provide a context for understanding the palaeoclimatic conditions and driving factors for the formation of palaeo-aeolian sand in the Jin-Shaan Gorges of the Yellow River valley.
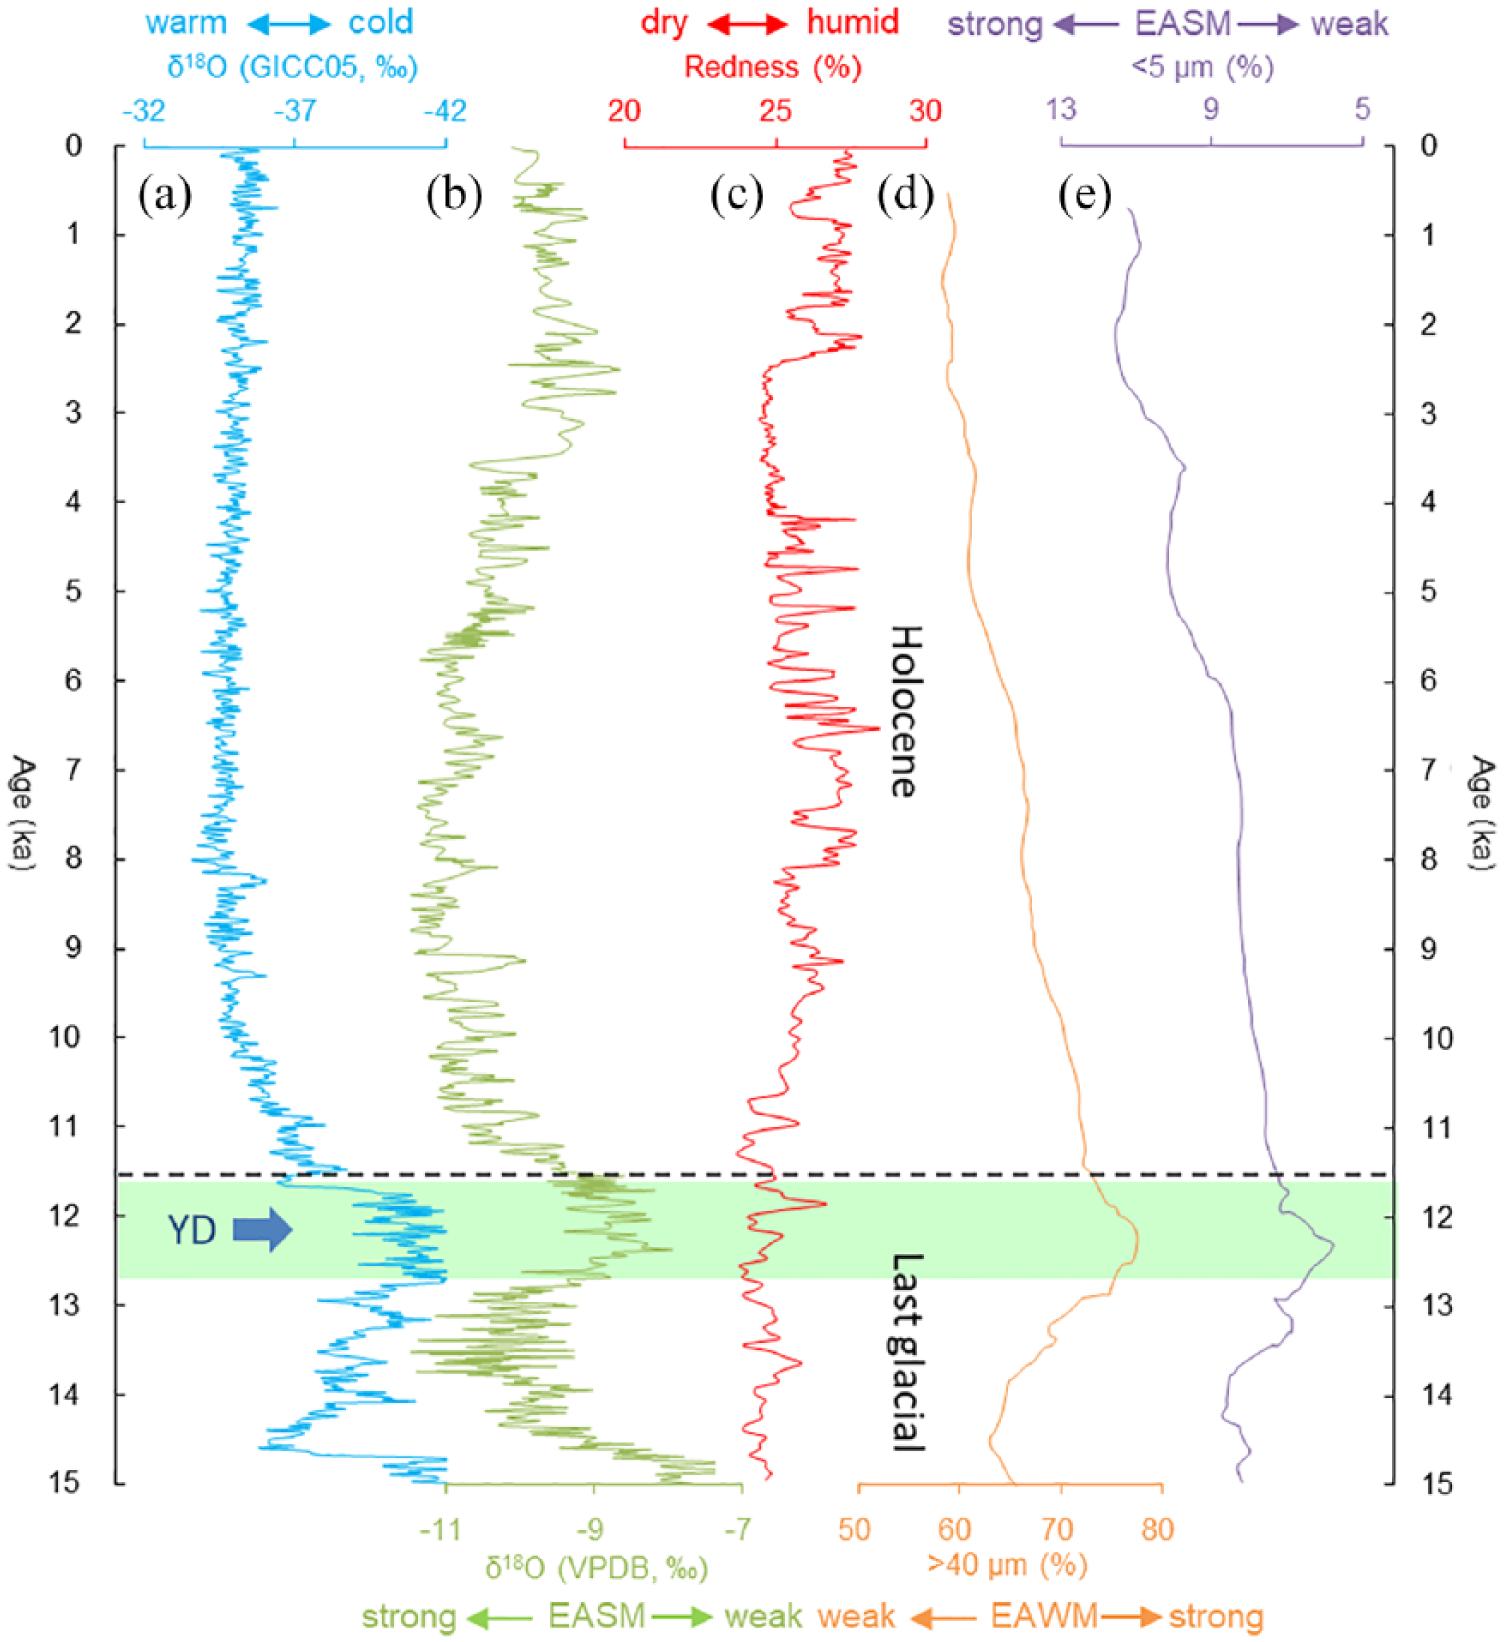
(a) δ18O time series of the Greenland Ice Core Chronology 2005 (Svensson et al., 2008). (b) δ18O time series of speleothem from Dongge and Sanbao Caves in southern China (Cheng et al., 2016). (c) Redness records of Qinghai Lake sediment since the late glacial time (Ji et al., 2005). (d, e) Grain size of the paleosol-loess profile at the Wangguan site in the central Loess Plateau (Guan et al., 2007).
Aeolian sand mobilization is controlled by multiple factors, including climatic aridity, transport capacity of the wind, sediment supply, and sediment availability (Kocurek and Lancaster, 1999; Lancaster, 1995). Based on the high resolution investigations of the palaeoclimate change in the central Loess Plateau, we can conclude that the palaeo-aeolian sand in the BSY-a and BSY-b profiles deposited in an extremely arid environment with strong EAWM and anomalous increased wind intensity during the YD episode (Cheng et al., 1998, 2016; Guan et al., 2007; Li et al., 2000; Lu et al., 2005; Zhou et al., 1996). Given that there is a difference in grain size distribution of the palaeo-aeolian sand at the BSY-b site and the modern riverbed sand of the Yellow River (XHQ), we can infer that the palaeo-aeolian sand is sourced mainly from ancient riverbed sand in the Jin-Shaan Gorges of the Yellow River, but has nothing to do with the expansion of the Mu Us Sandland since the Last Glacial Maximum (Figure 1) (Xu et al., 2013; Zhang et al., 2017). The decrease from the grain size of riverbed sand to that of palaeo-aeolian sand, suggests a spatial differentiation of aeolian deposition in the Jin-Shaan Gorges. Many studies also have indicated that fluvial sand distributed on riverbed and terraces in the river valleys can become the source areas for the dune building and/or expansion of dune fields in an arid and windy environment (Ma et al., 2017; Van Huissteden et al., 2000; Vandenberghe et al., 2013).
As discussed above, we can conclude that during the YD period, floodplains and channel bars in the river valley will be exposed in broad area in an extremely arid and windy environment (Figure 2), and a large quantity of sand drifts to the banks of the river under the force of strong EAWM, which becomes the main source of the paleo-aeolian sand in the platforms on the gentle slopes on both sides of the river valley. Therefore, the palaeo-aeolian sand deposition in the region was due to sufficient sediment supply from the riverbed sand, strong EAWM, and strong wind erosion.
Conclusion
Two late-Pleistocene and Holocene aeolian sand-loess profiles were found within the cliff riverbank in the Jin-Shaan Gorges of the Yellow River. The palaeo-aeolian sand in these two profiles is dated to 12.5–11.8 ka, by OSL dating and pedostratigraphical correlation. The deposition period of the palaeo-aeolian sand coincided within time error with the YD event that punctuated the last glacial-Holocene transition period. During the YD period, floodplains and channel bars in the river valley will be exposed in broad area in an extremely arid and windy environment, and a large quantity of sand drifts to the banks of the river under the force of strong EAWM, which becomes the main source of the paleo-aeolian sand in the platforms on the gentle slopes on both sides of the river valley. Therefore, sufficient sediment supply from the riverbed sand of the Yellow River, strong East Asian winter monsoon, and strong wind erosion are the driving factors for the formation of palaeo-aeolian sand in the river valley. These results are important for an understanding of palaeoclimatic and palaeoenvironmental conditions for the formation of aeolian sand associated with the river valleys in semi-arid and sub-humid regions.
Footnotes
Acknowledgements
We are grateful to Professor James Shulmeister for valued discussion, which greatly enhanced the clarity and consistency of the manuscript.
Funding
This work was supported by the grants from National Key Research and Development Program of China (2017YFC1502501), National Science Foundation of China (41801060, 41771110), Special Research Project of Education Department of Shaanxi Provincial Government (17JK0770), Open Foundation of State Key Laboratory of Loess and Quaternary Geology, Institute of Earth Environment, CAS (SKLLQG1725), Natural Science Basic Research Plan in Shaanxi Province of China (2018JQ4036), and China’s Post-doctoral Science Fund (2016M592829).