
Abstract
Investigation of the evolution of summer Asian westerly jet (AWJ) in Earth history may deepen our understanding of the behavior of AWJ in the present and future. Here, the variation of summer westerlies and the associated mechanisms over West and East Asia are examined using the last millennium simulations from the Paleoclimate Modeling Intercomparison Project Phase III (PMIP3). The multimodel ensemble mean of 11 PMIP3 models reproduces the spatial distribution of modern zonal wind at 200 hPa and captures the location and intensity of the summer AWJ well. The results illustrate that the location of summer westerlies over West and East Asia shows no clear long-term trend over the last millennium, whereas there is an enhancing trend for the intensity, but with significant interannual and multidecadal variability. Summer westerlies over West Asia mainly oscillate within ~25-year band in terms of the location and intensity, while the principal periodicity over East Asia oscillate within ~25- and ~15-year band, respectively. Moreover, summer AWJ broadly moves poleward and weakens during the ‘Medieval Climate Anomaly’ (MCA, AD 1000–1200) relative to the ‘Little Ice Age’ (LIA, AD 1400–1600), which is attributed to the reduced meridional temperature gradient during the MCA. This poleward shift is consistent with the reconstructed moisture conditions over Central Asia, but the lack of direct proxy for westerlies restricts detailed model–data comparisons. Nevertheless, a possible scenario is presented on the spatiotemporal variation of summer AWJ over the last millennium, which may shed light on the response of the AWJ to natural forcings.
Introduction
The Asian westerly jet (AWJ) is an important component of the mid-latitude westerlies which contain several active centers from Eurasia to North Pacific, and to North America in the Northern Hemisphere (Ding and Wang, 2005). The axis of the AWJ in summer is generally located at ~40°N, with zonal wind speeds exceeding 30 m/s. The AWJ has two active centers located over West and East Asia because of the blocking of the Tibetan Plateau (Hong et al., 2018; Lu, 2004; Lu et al., 2011; Zhao et al., 2014, 2018), named as the West Asian westerly jet (WAWJ) and East Asian westerly jet (EAWJ), respectively. Variations of the summer WAWJ and EAWJ have been proven to significantly affect precipitation over Asia via exciting the secondary circulation (Li et al., 1996; Zhang et al., 2000). In general, the southward shift of the summer EAWJ results in a decrease in precipitation over North China whereas it results in an increase in precipitation over the Yangtze River valley, and vice versa for the northward shift (Du et al., 2009; Kwon et al., 2007; Xie et al., 2015). The poleward (equatorward) migration of the summer WAWJ leads to decreased (increased) precipitation in summer over Central Asia and northern Xinjiang (e.g. Zhao et al., 2014). In addition, the summer AWJ also influences the behaviors of temperature, dust transport, and tropical convection (Chen et al., 2017; Lin et al., 2018; Zhang et al., 2018). Therefore, several studies have been conducted to investigate changes in the intensity and location of the summer AWJ, concluding that the summer EAWJ has weakened since the mid-1990s and migrated equatorward (Kuang and Zhang, 2005; Kwon et al., 2007; Zhang and Huang, 2011). However, the contributions of natural and anthropogenic forcings on the observed equatorward shift remain unclear, given the relatively short time-span of observations. Therefore, understanding the variation of the summer AWJ in Earth history and identifying the driving factors may advance our knowledge on the AWJ behavior in the present-day and future.
The last millennium (AD 850–1850) provides an opportunity to examine the role of natural forcings (i.e. solar activity and volcanic eruptions) in Asian climate change (Jones et al., 1998; Schmidt et al., 2011; Shi et al., 2015; Zhou et al., 2019). There are two typical intervals over the last millennium: the ‘Medieval Climate Anomaly’ (MCA, AD ~950–1250) and the ‘Little Ice Age’ (LIA, AD ~1400–1850). Multi-proxies indicated that temperatures were relatively higher and lower during the MCA and LIA over China, respectively (Ge et al., 2012, 2013; Ljungqvist, 2010; Yang et al., 2002), although the timing of peak warmth/cooling varied with different regions. East Asian summer monsoon was suggested to be stronger (weaker) during the MCA (LIA), contributing to enhanced (reduced) precipitation over eastern China (Li et al., 2012; Zhang et al., 2008; Zhao et al., 2015). Besides, Chen et al. (2010) found that moisture conditions exhibit opposite trends over North China and Central Asia, with wetter (drier) conditions over North China during the MCA (LIA) and drier (wetter) conditions over Central Asia. The geological evidence helps extend the histories of temperature, precipitation, and monsoons to millennia and place current climate change in the paleoclimate context (Chen et al., 2019). However, there is still a lack of direct indicator for the summer AWJ over the last millennium at high temporal resolution, hampering our efforts to obtain a comprehensive understanding of Asian climate.
Numerical modeling is proven as a useful tool to investigate the response of climate to various external forcings and identify the associated dynamic mechanisms (Huang et al., 2018). With respect to Asia, considerable modeling studies have been conducted to depict the spatiotemporal variations of temperatures, precipitation, and monsoon circulations over the last millennium (Jiang et al., 2015). Using the Flexible Global Ocean–Atmosphere–Land–Sea–ice (FGOALS-gl) model, Man and Zhou (2014) indicated that the higher (lower) temperatures over China during the MCA (LIA) are likely attributed to the variation of the effective radiative forcing over the last millennium. This result is consistent with the findings of previous studies using the ECHO-G model (Liu et al., 2005) and the Community Climate System Model (Peng et al., 2009). The climate models from the Paleoclimate Modeling Intercomparison Project Phase III (PMIP3) broadly capture the reconstructed stronger East Asian summer monsoon during the MCA and weaker summer monsoon during the LIA, which is attributed to the enhanced and reduced land-sea thermal contrast, respectively (Shi et al., 2017). Meantime, the winter Asian westerly jet gets stronger (weaker) during the MCA (LIA) because of the increased (decreased) meridional temperature gradient (Shi et al., 2016b). In addition, Shi et al. (2016a) suggested that the anti-phase precipitation variation between North China and Central Asia may be regulated by the thermal conditions over the tropical Pacific based on the PMIP3 last millennium simulations. These modeling results improve our understanding of several aspects of Asian climate over the last millennium, but there are still deficiencies with respect to the comprehensive cognition of the AWJ evolution in summer, which greatly alters the variations of temperatures, precipitation, and monsoon circulations. Particularly, two questions remain unclear: (1) how the location and intensity of the summer AWJ may vary over the last millennium and (2) whether the variations of the summer WAWJ and EAWJ are in phase or not.
In this study, model outputs from the PMIP3 last millennium simulations are used to investigate the evolution of the AWJ in summer and the associated mechanisms. Such an investigation may advance our knowledge on the response of the summer AWJ to natural forcings and shed light on the AWJ behavior in the present and future. The remainder of the paper is organized as follows. The model outputs used are briefly introduced and the model performance in simulating the present-day summer AWJ is evaluated in sections ‘Data’ and ‘Evaluation of climate models’, respectively. Time series of the summer WAWJ and EAWJ and their spatial differences between the MCA and LIA are presented in section ‘Variation of the summer AWJ over the last millennium’. In section ‘Discussion’, this study is summarized and potential limitations are discussed.
Data
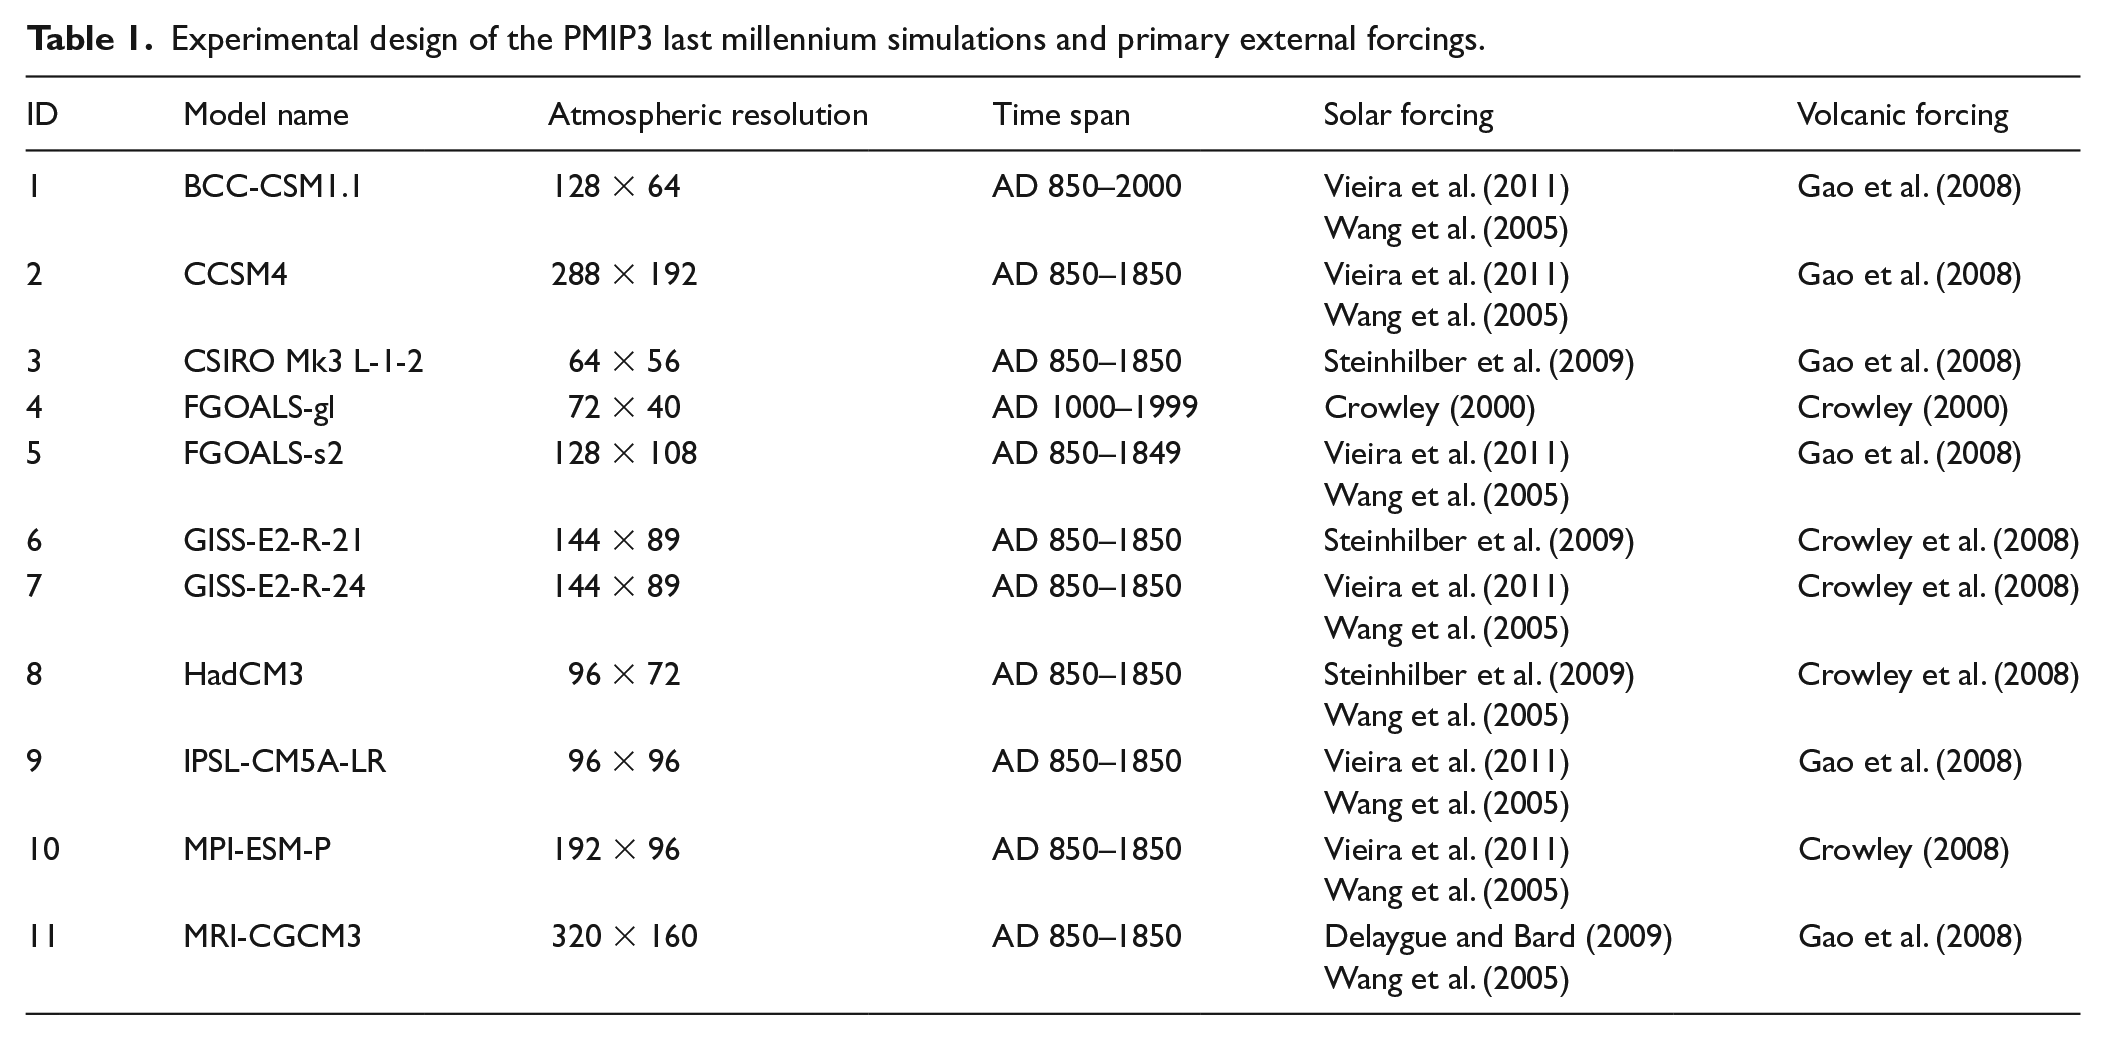
The last millennium experiments from the PMIP3 cover the period of AD 850–1850. The main external forcings include solar radiation (Crowley, 2000; Steinhilber et al., 2009; Vieira et al., 2011; Wang et al., 2005), volcanic activity (Crowley et al., 2008; Gao et al., 2008), greenhouse gases (Ammann et al., 2007), and land cover (Pongratz et al., 2008). The other boundary conditions are set to the pre-industrial levels. The outputs from 10 PMIP3 models are used except for the MIROC-ESM because of its long-term climate drift (Bothe et al., 2013; Sueyoshi et al., 2013; Yan et al., 2016). A summary of the PMIP3 models and experimental design is provided in Table 1. Note that the model outputs are regrided to a uniform grid (1.5° × 1.5°) by bilinear interpolation to facilitate the model–data evaluation and model–model comparison.
Experimental design of the PMIP3 last millennium simulations and primary external forcings.
Evaluation of climate models
The Taylor diagram is an efficient tool to measure the similarity between simulations and observations by providing statistical information on the rooted mean square error (RMSE), spatial correlation coefficients, and standard deviations (Taylor, 2001). Hence, the Taylor diagram is used to assess the performance of the PMIP3 models in modeling the climatological zonal wind at 200 hPa in summer (Figure 1). Compared with the ERA-Interim reanalysis datasets (1981–2000), the spatial correlation coefficients in zonal wind vary from 0.90 (GISS-E2-R) to 0.99 (CSIRO-Mk3 L-1-2), with a mean of 0.98. The RMSE between model results and ERA-Interim is 6.0 ± 2.4 m/s. These results indicate that the PMIP3 models have high skills in capturing the spatial characteristics of the zonal wind. In addition, the active centers of the summer AWJ, measured by the interannual variability, are largely reproduced by the PMIP3 models, with the spatial correlation coefficients of 0.95 ± 0.02 and the RMSEs of 1.50 ± 0.4 m/s.
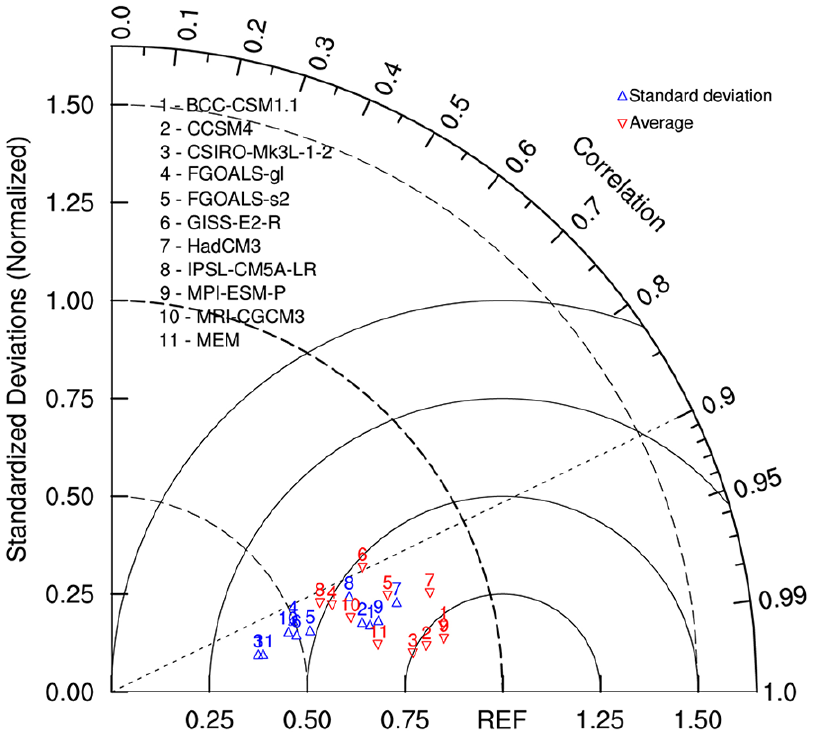
Taylor diagram displaying pattern statistics of climatological zonal wind speed at 200 hPa (red) and its interannual variability (blue) over Asia (30°N –50°N, 30°E–150°E) in boreal summer from 1981 to 2000 between historical experiments and EAR-Interim reanalysis. EAR-Interim is considered as the reference (REF). The standard deviation of a model is represented by the radial distance from the origin. The spatial correlation coefficient between a model and observation is displayed by the azimuthal position of the model. The root mean square error between a model and observation is shown by their distance apart.
Furthermore, the model performance is evaluated in simulating the intensity and location of the summer AWJ, which are two important metrics in estimating the variations of westerlies and their potential impacts, but the Taylor diagram provides limited information on them. The intensity of the summer AWJ is defined as the mean wind speed over the region of 30°N–50°N and 30°–150°E; and the location of the summer AWJ (i.e. jet axis) is interpreted as the mean latitude of the maximum wind speeds across 30°E–150°E (Kuang and Zhang, 2005; Lu, 2004). It is found that the PMIP3 models underestimate the intensity of the summer AWJ by ~10–25% relative to the ERA-Interim reanalysis, and the GISS-E2-R model shows the smallest bias (Figure 2). The simulated jet axis is biased poleward in BCC-CSM1.1 (3.90%), CCSM4 (3.68%), FGOALS-gl (5.72%), FGOALS-s2 (10.91%), and MPI-ESM-P (3.90%), whereas it is biased equatorward in CSIRO-Mk3 L (0.84%), GISS-E2-R (6.04%), HadCM3 (0.84%), IPSL-CM5A-LR (8.65%), and MRI-CGCM3 (2.53%).
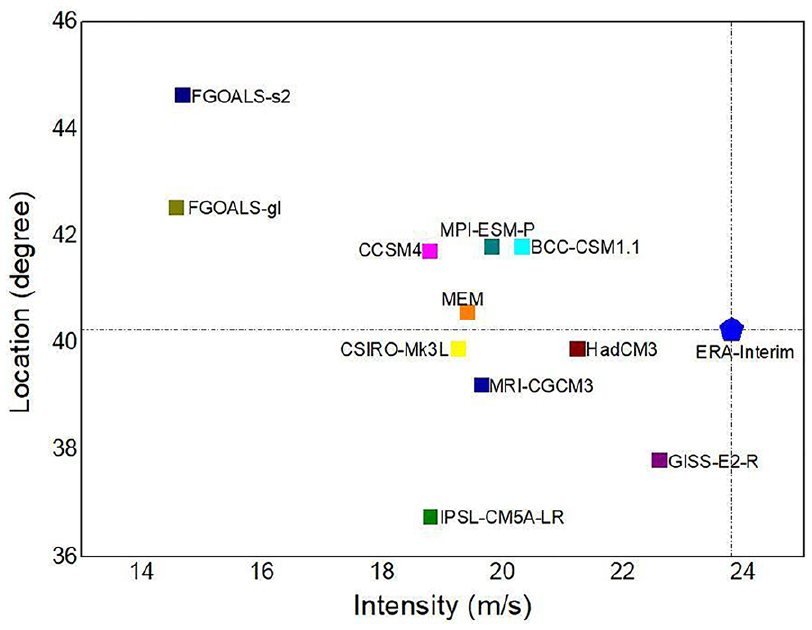
The intensity (x-axis; m/s) and location (y-axis; degree) of the summer Asian westerly jet from PMIP3 models, their MEM and ERA-Interim from 1981 to 2000 over Asia (30°N–50°N, 30°E–150°E).
As each PMIP3 model has its advantages and disadvantages in simulating key features of the summer AWJ, the capability of the multimodel ensemble mean (MEM) is evaluated, which is often suggested to perform better than individual models (e.g. Shi et al., 2016a; Yan et al., 2016). The spatial patterns of zonal wind speed and its interannual variability derived from the MEM are quite similar to those from the ERA-Interim datasets (Figure 3). The spatial correlation coefficient of the zonal wind speed and the interannual variability between the ERA-Interim and MEM reaches 0.98 and 0.97, respectively, larger than the majority of the PMIP3 models. The jet axis of the simulated summer AWJ from the MEM is generally located at approximately 40°N, and there are two active centers located over West Asia (30°N–50°N, 40°E–80°E), and East Asia (30°N–50°N, 120°E–150°E) in terms of the interannual variability. The bias of the simulated jet axis from the MEM is only 0.33°, the smallest among individual PMIP3 models, although the MEM still underestimates the zonal wind speed. Given its relatively better performance, it is preferred to use the MEM to investigate the variations of the location and intensity of the summer AWJ over the last millennium in the following sections.
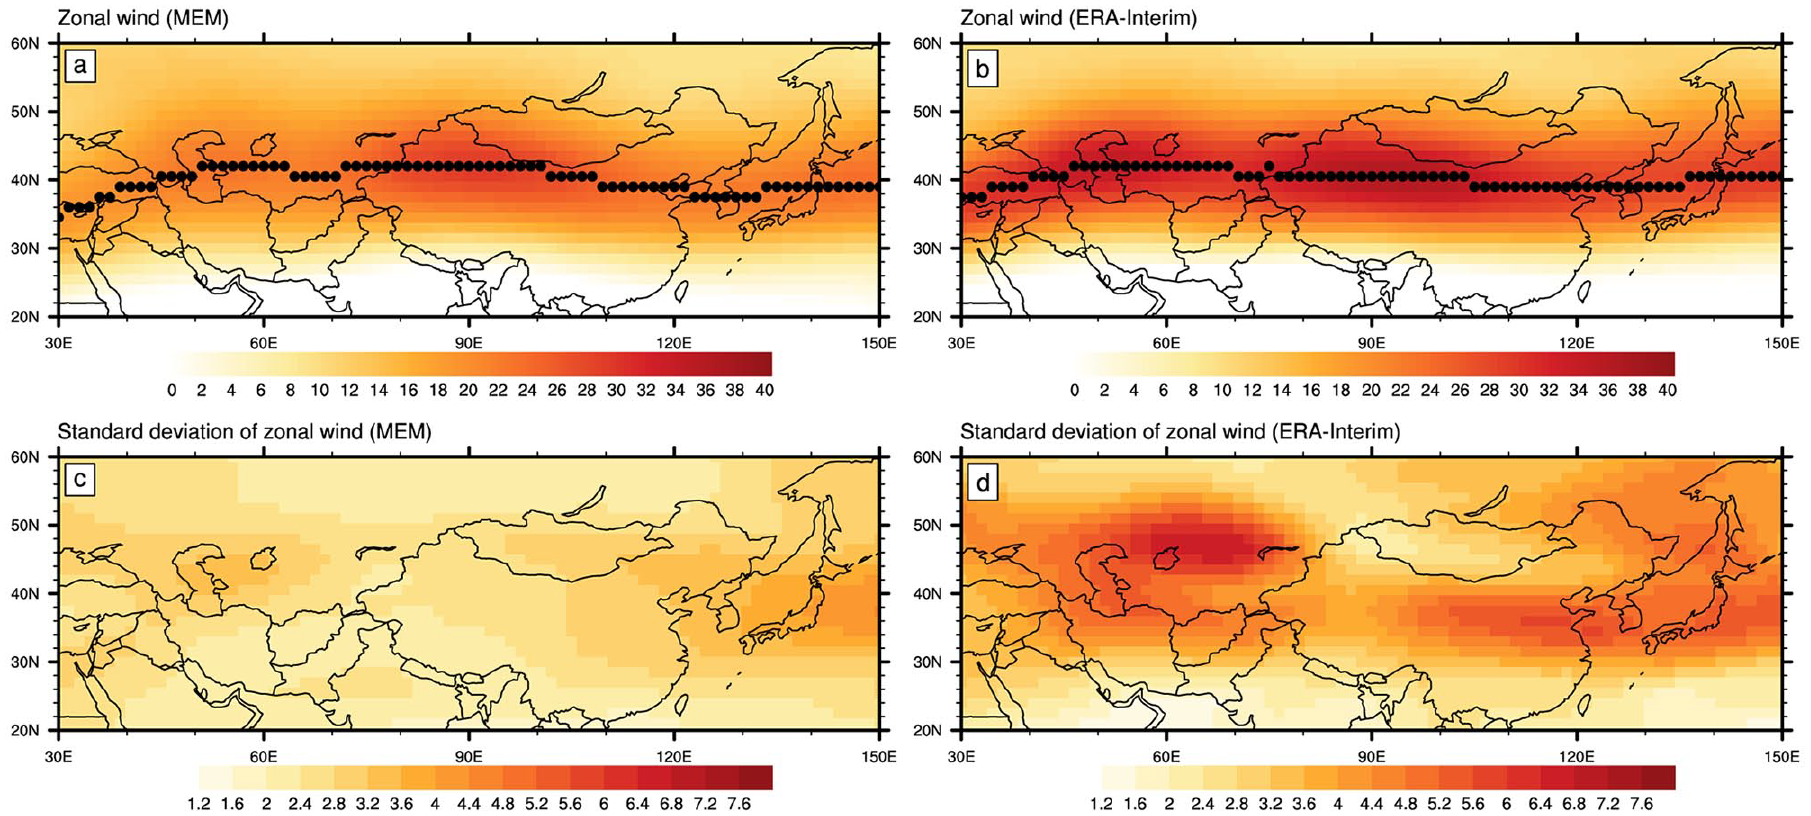
Spatial distributions of the climatological Asian zonal wind speed at 200 hPa (a, b) and its interannual variability (c, d) in boreal summer (JJA) from 1981 to 2000 based on the MEM of the historical experiments (a, c) and ERA-Interim (b, d). The black dots denote the Asian westerly jet axis.
Variation of the summer AWJ over the last millennium
Time series
The modeled location and intensity of the summer WAWJ exhibit clear interannual and interdecadal variability over the last millennium (Figure 4). There is no significant long-term shift in the evolution of the location (–0.0001°/yr and does not pass the 95% significant test), whereas an upward trend in the intensity (0.0002°/yr and passes 99% significant test) (Figure 4a and f). The interannual variability of the location and intensity derived from the MEM is ~0.54° and 0.44 m/s over the last millennium, respectively. The spread of the interannual variability among the PMIP3 models is relatively small and lies within a 1.05°–2.94° (0.77–1.66 m/s) window for the location (intensity). On the multidecadal and centennial timescale, the summer WAWJ broadly moves poleward and weakens during the period of AD 900–1100, whereas it shows an equatorward shift and intensifies during the period of AD 1400–1600 (Figure 4b and f). Based on the thermal wind relationship, the variation of the summer WAWJ can be attributed to the change of the meridional temperature gradient at 200–500 hPa over West Asia (Rojas, 2009; Wilcox et al., 2012). The 31-year smoothed simulated variation of the location and intensity of the summer AWJ shares great similarity with the meridional temperature gradient over West Asia (Figure 4b and f). Specifically, a poleward (equatorward) shift of the meridional temperature gradient is corresponding to a poleward shift of the summer WAWJ and an increased (decreased) meridional temperature gradient results in a strengthened (weakened) summer WAWJ over the last millennium. Based on the spectral analysis by the fast Fourier transform (FFT) after 10-year low-pass filtering, the majority of the summer WAWJ oscillations occur within the ~25-year frequency band (Figure 5), in good agreement with Hale’s 22-year cycle (Benevolenskaya, 1998; Cliver, 2014). Moreover, variations of the WAWJ location in summer also oscillate within the ~83-year band, which may be tied to the Gleissberg solar cycle (80–90 years; Gleissberg, 1939; Ma, 2009; Reid, 1987), although variations are not statistically significant at 95% confidence level (Figure 5a). In addition, the WAWJ intensity in summer varies within ~33- and ~15-year band as well, likely to be related to Hale’s 22-year cycle and 11-year sunspot cycle (Figure 5b). These results imply the potential role of solar irradiation in regulating the evolution of the summer WAWJ.
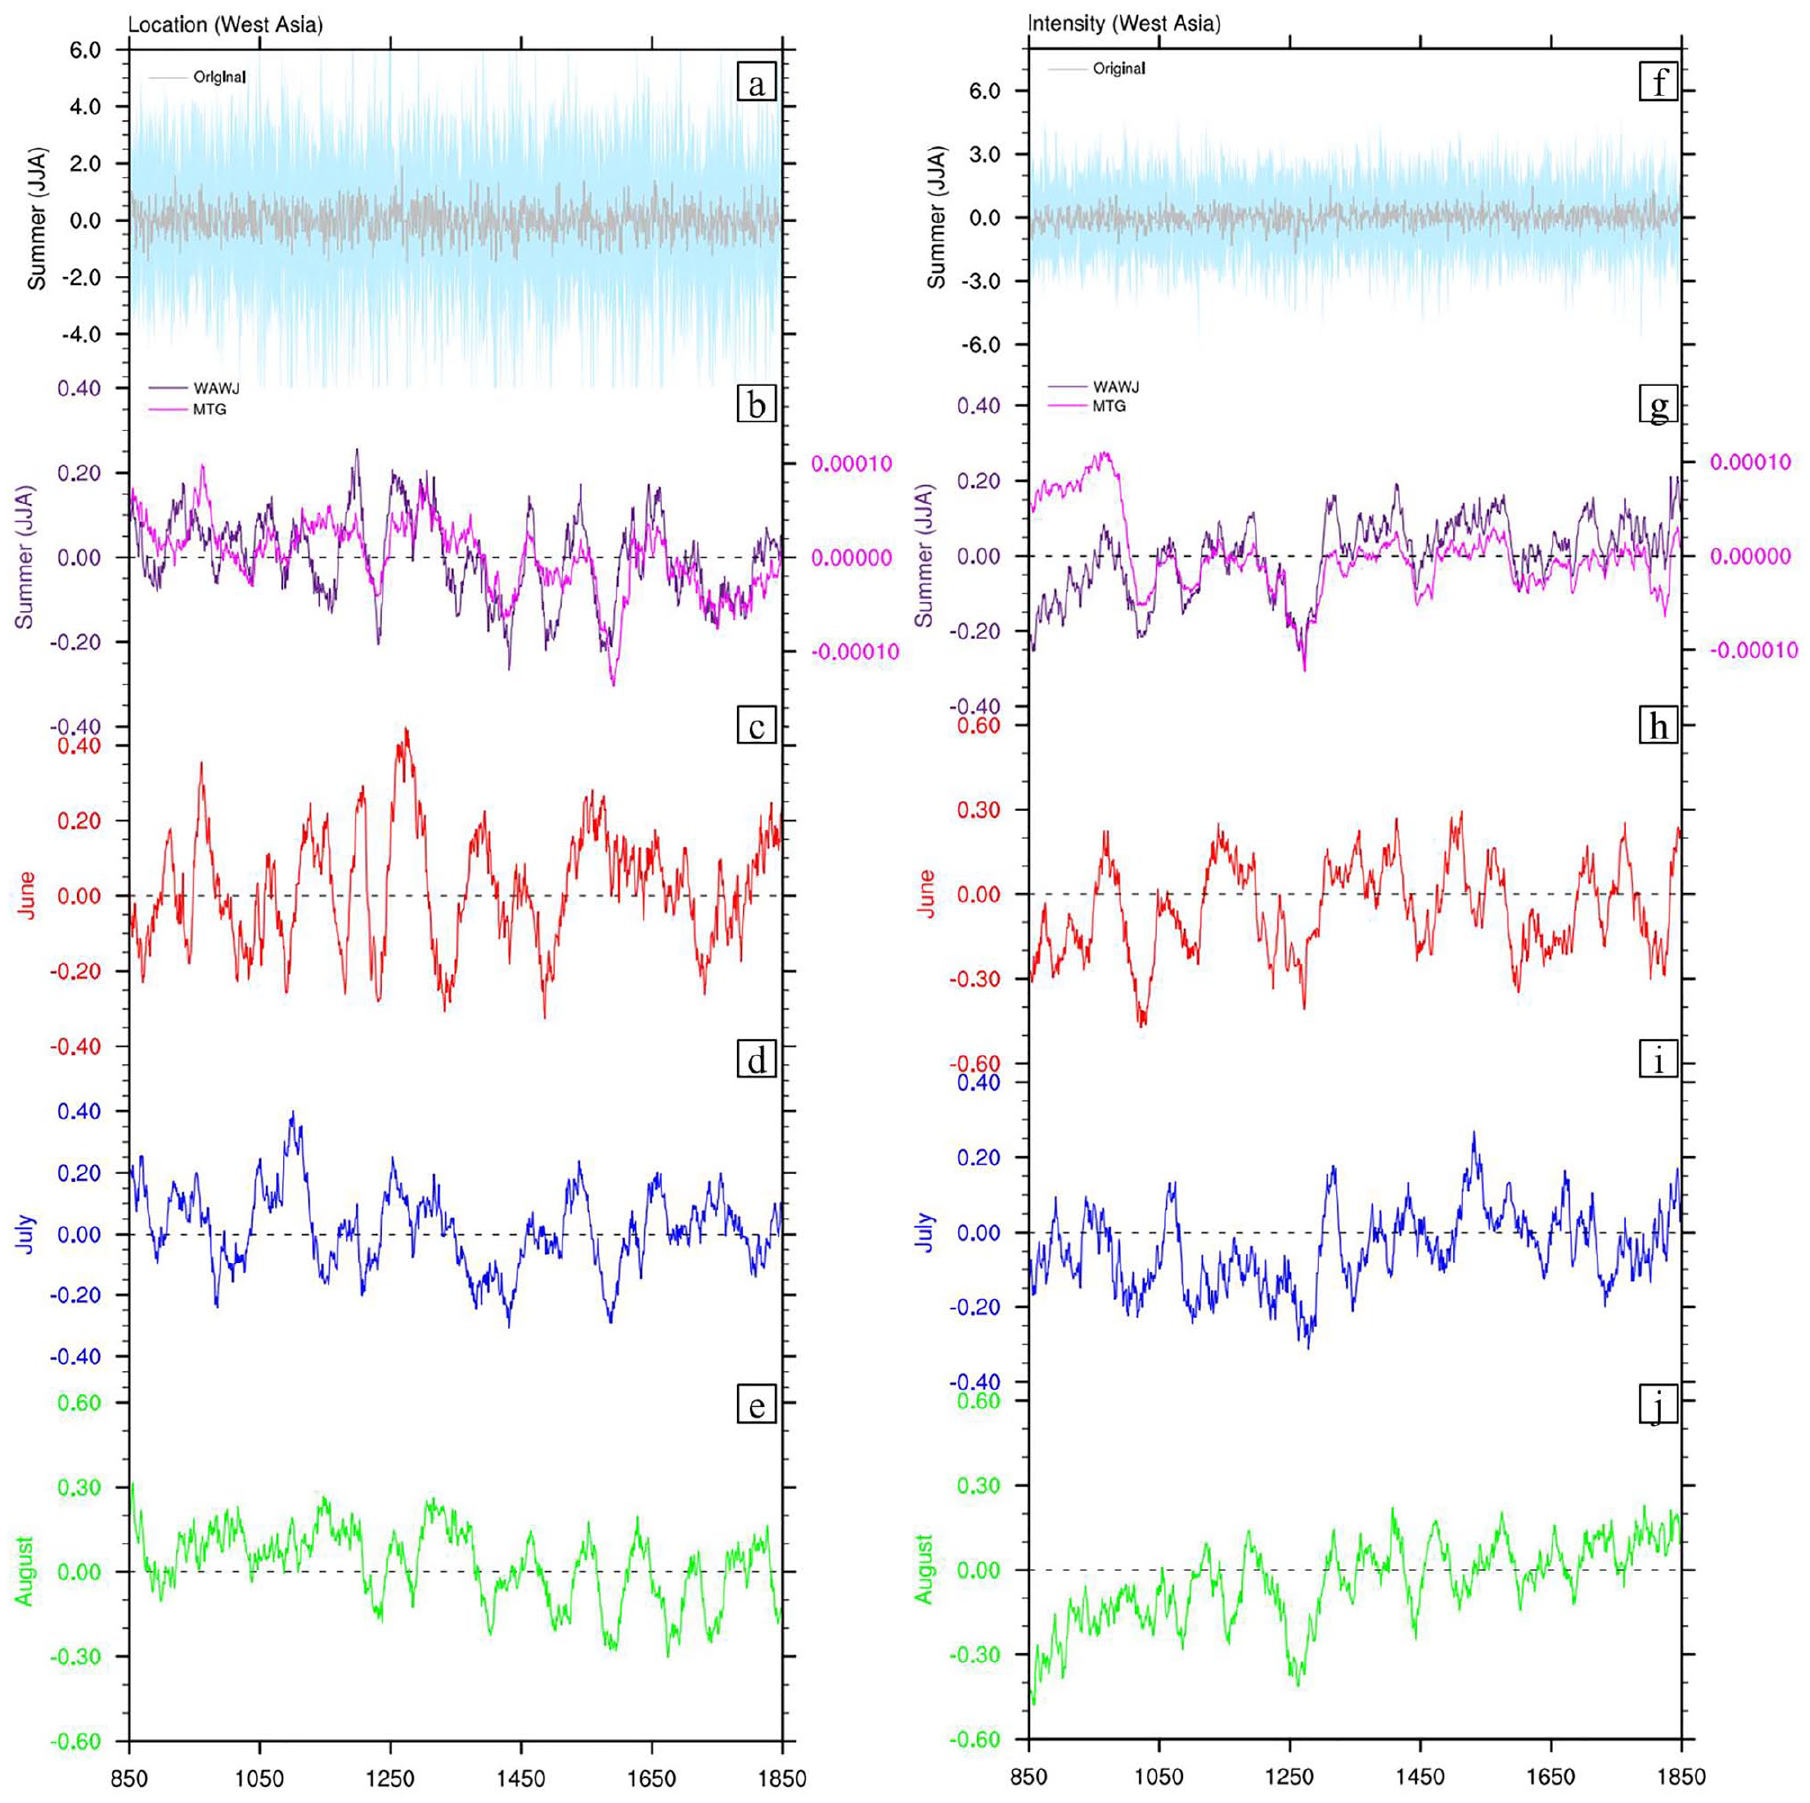
Left panel: the original (a) and 31-year smoothed (b–e) time series of the location of the westerly jet over West Asia in summer (a, b), June (c), July (d), and August (e) over the last millennium relative to the long-term mean. Right panel: (f, g) same as left panel (a–e) but for the intensity of the West Asian westerly jet. Note that the gray line in (a, f) indicates the MEM and the light blue shadings stand for the maximum and minimum of the anomalies among the PMIP3 models. The pink line in (b, g) represents the 31-year smoothed location (b) and intensity (g) of the meridional temperature gradient (MTG, ×–1) over West Asia relative to the long-term mean in summer. The location of the meridional temperature gradient over West Asia is defined as the difference in the temperature gradient between the north (40°N–60°N, 40°E–80°E) and south (20°N–40°N, 40°E–80°E) West Asia. The intensity of the meridional temperature gradient over West Asia is interpreted as the mean temperature gradient over 30°N–50°N and 40°E–80°E.
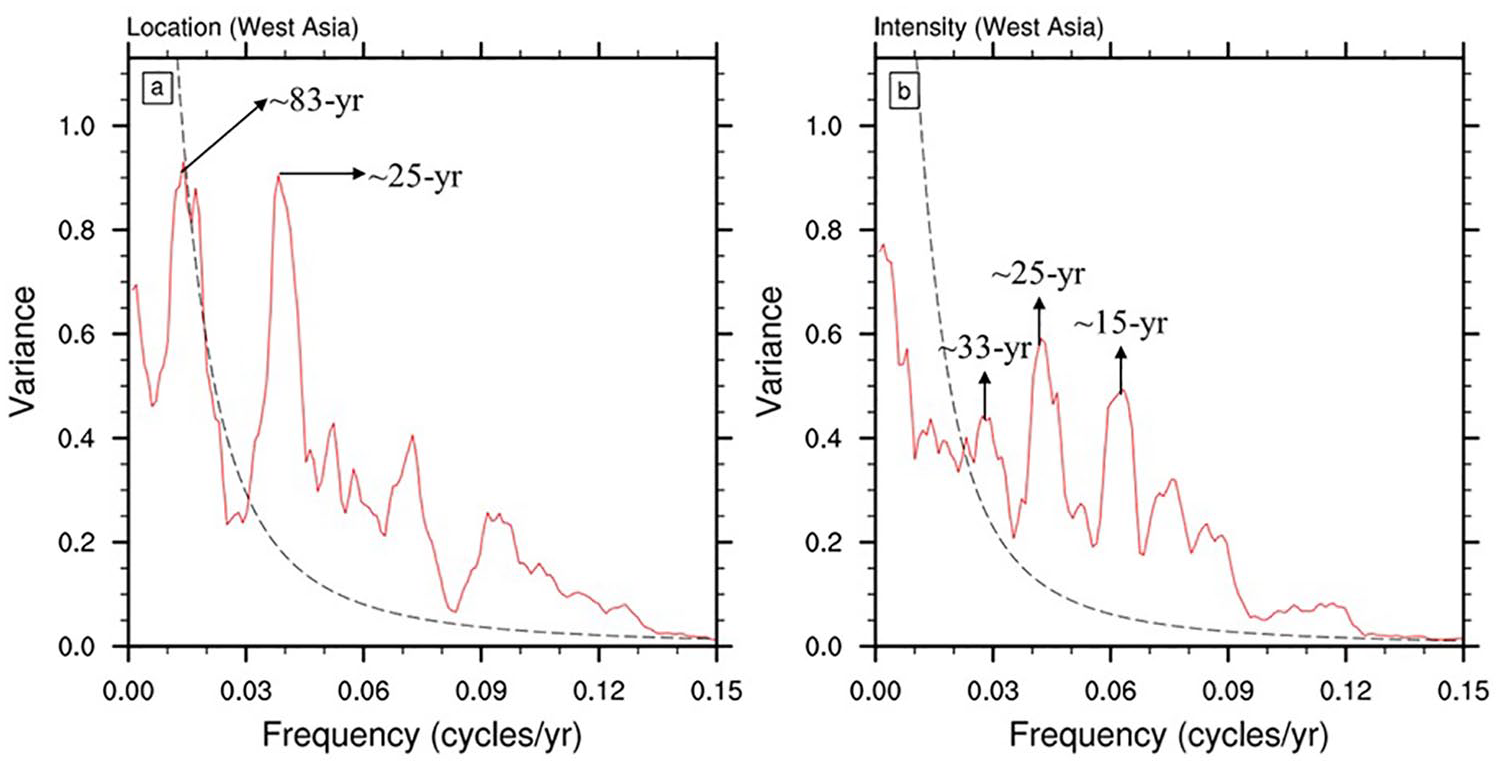
The power spectrum of the location (a) and intensity (b) of the summer West Asian westerly jet by 10-year low-pass filtering over the last millennium.
Moreover, our results indicate that the evolution of the AWJ varies by month in summer. The multidecadal variability of the summer WAWJ location is 0.15°, 0.13°, and 0.13° in June, July, and August, respectively, and 0.16, 0.10, and 0.14 m/s for the intensity (Figure 4c–e and h–j). This indicates that the summer WAWJ variability is the most significant in June. However, the poleward (equatorward) shift during the MCA (LIA) relative to the long-term mean is more profound in August, and so does the upward trend in the intensity. Besides, the principal periodicity of the summer WAWJ is ~40, ~25, and ~25 years in June, July, and August for the location, respectively, and is ~33, ~25, and ~15 years for the intensity, respectively. These cycles may be associated with different periods of solar activity and imply the complex roles of solar activity in the regulation of the summer WAWJ.
Over East Asia, the modeled location and intensity of the summer EAWJ share large similarity with the evolution of the summer WAWJ, although they differ in amplitude and periodicity (Figures 6 and 7) Specifically, the interannual variability of the EAWJ location and intensity in summer is 0.66° and 0.58 m/s over the last millennium, respectively, larger than those of the summer WAWJ (Figure 6a and f). The principal oscillation of the summer EAWJ is within ~25- and ~15-year band in terms of the location and intensity, respectively (Figure 7). Moreover, the location also oscillates within ~20- and ~11-year band (Figure 7a). These oscillations may be associated with 11-year sunspot cycle and Hale’s 22-year cycle. For the sub-seasonal variations, the multidecadal variability of the summer EAWJ is the most significant in August, during which the intensity also exhibits the most intense strengthening trend. The principal periodicity of the EAWJ location (intensity) in summer also differs with months, with a ~50-, ~25-, and ~40-year (~25, ~13, and ~15 years) cycle in June, July, and August, respectively.
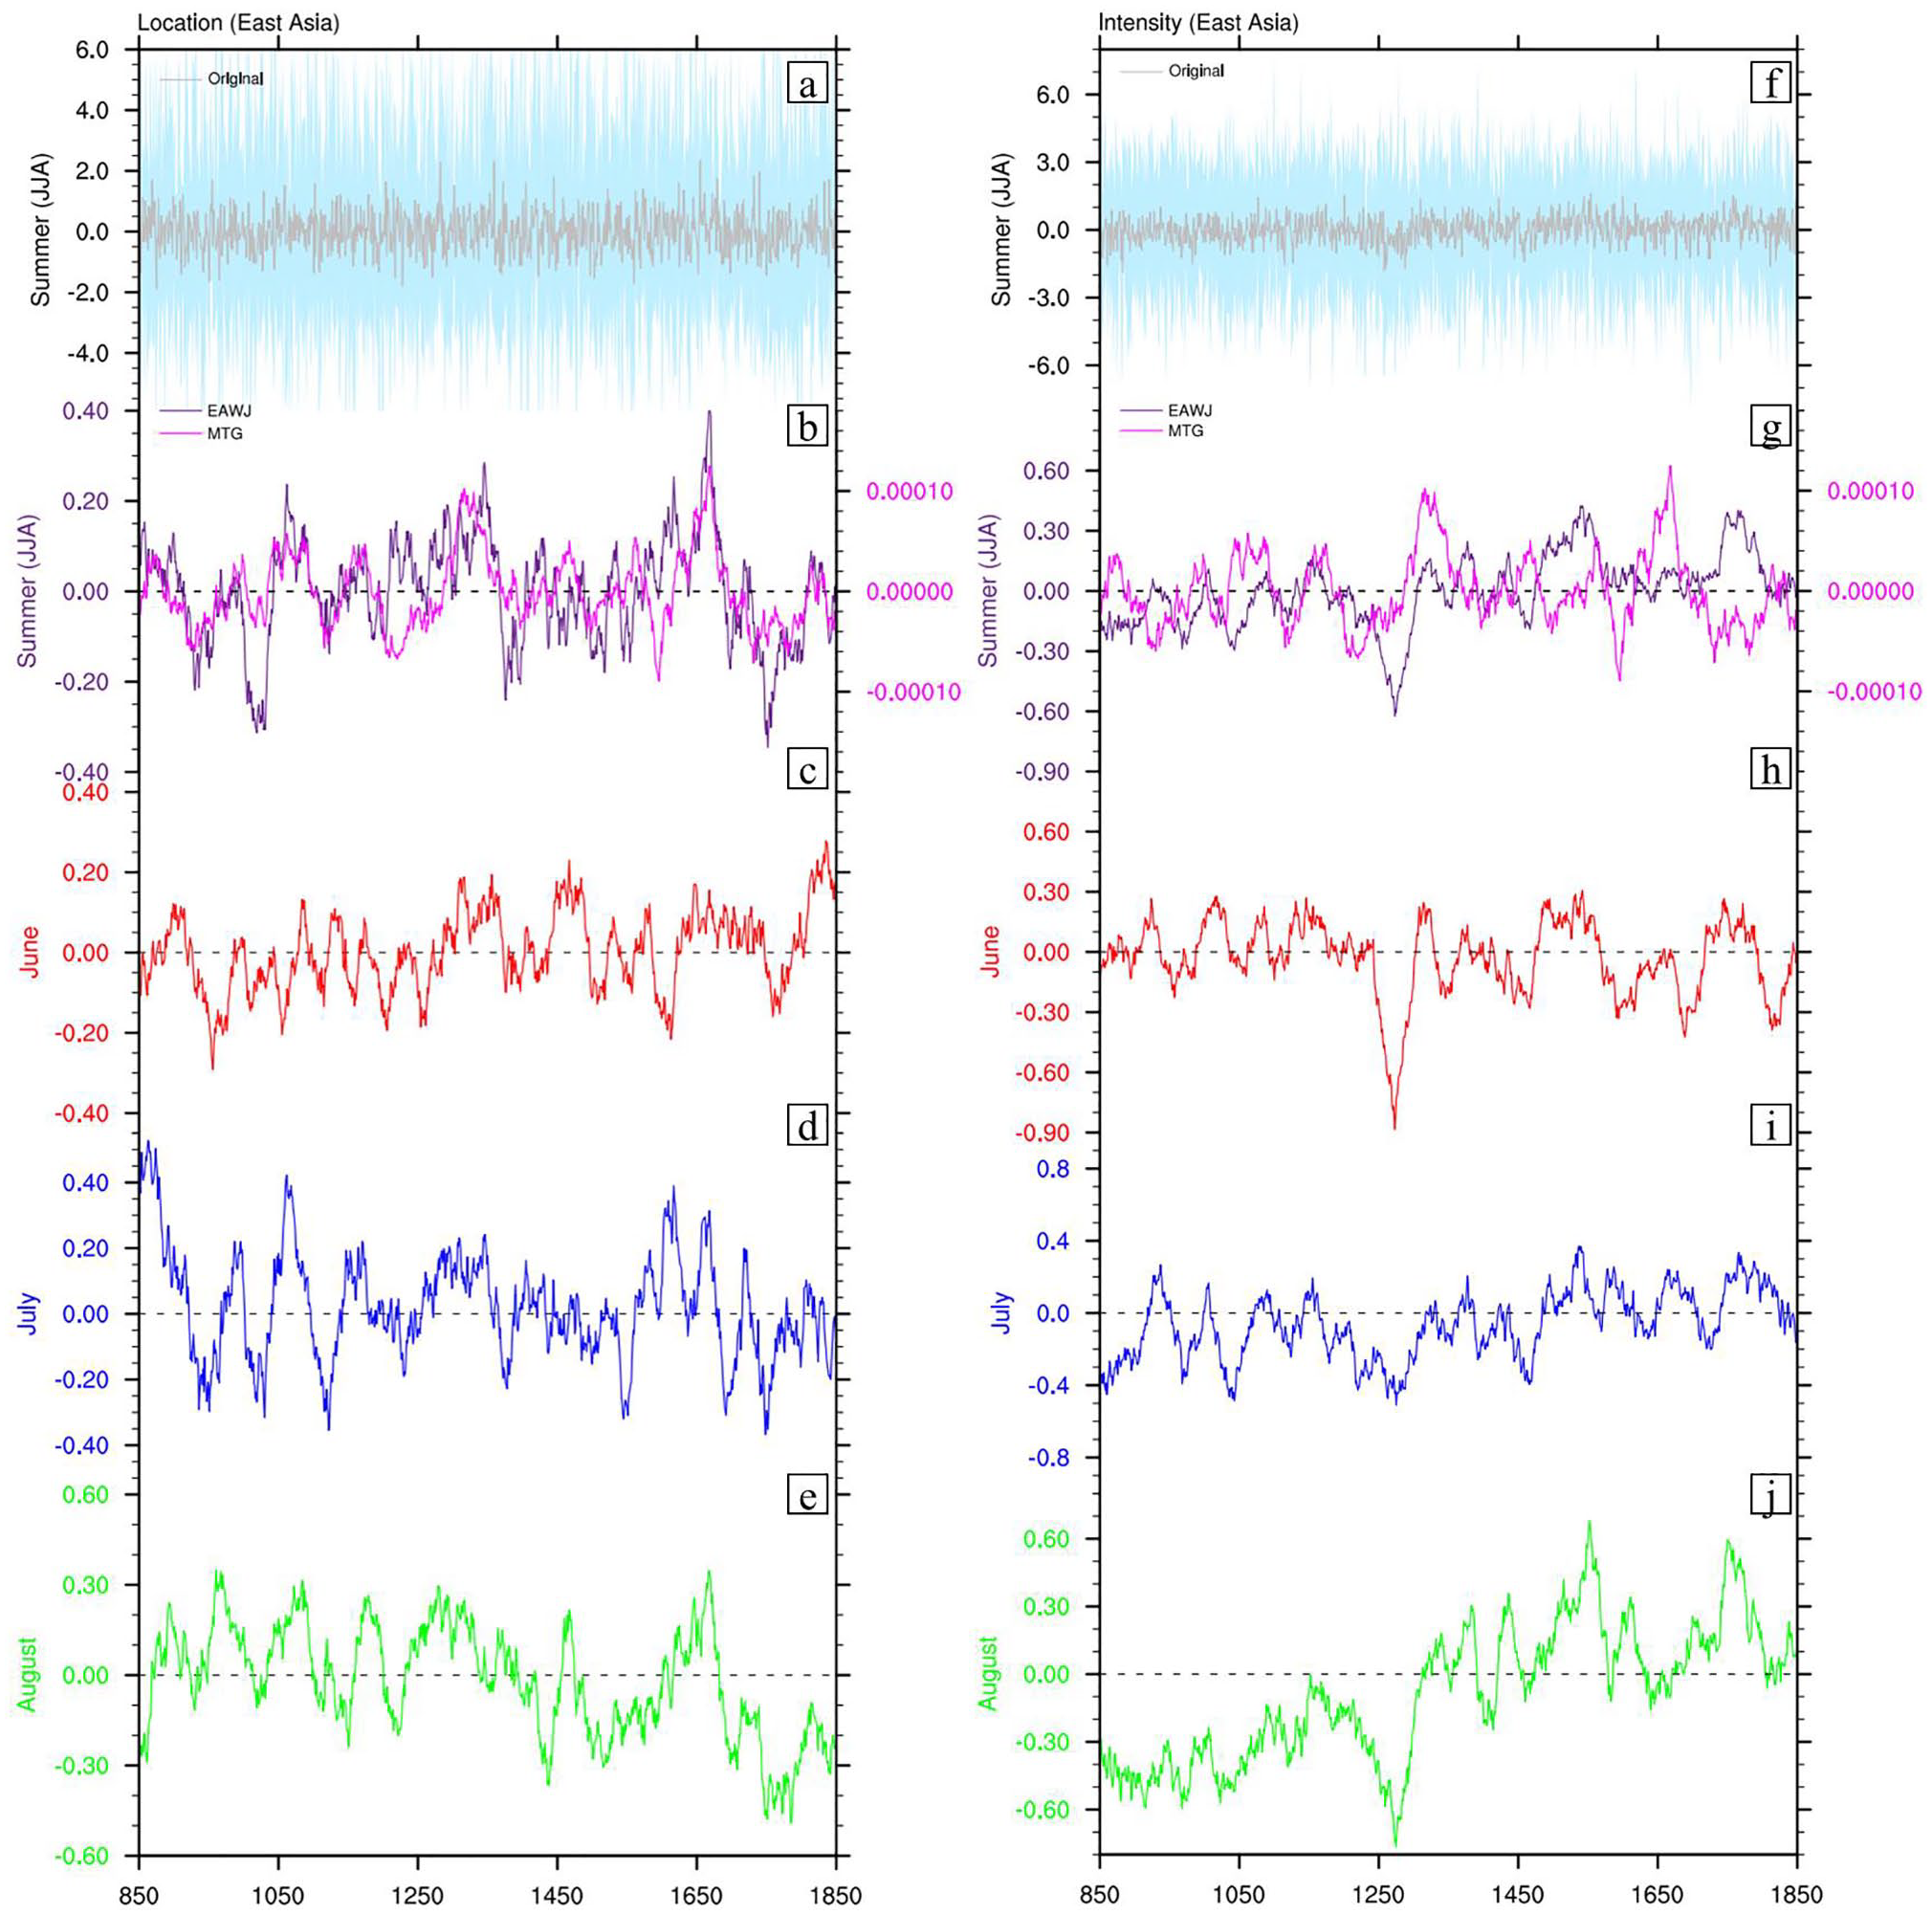
Same as Figure 4, but for the East Asian westerly jet.
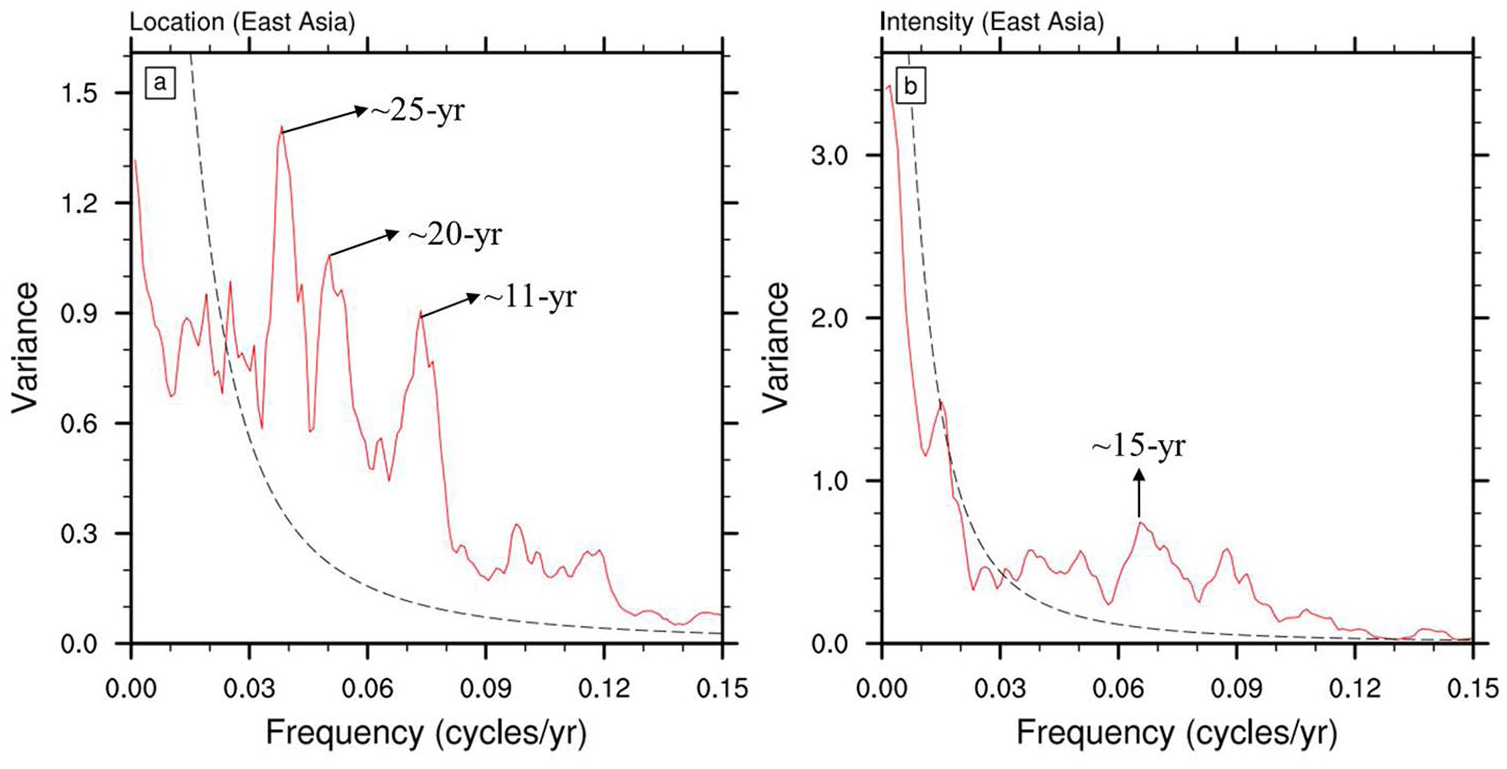
Same as Figure 5, but for the East Asian westerly jet.
Overall, the location of the WAWJ and EAWJ in summer shows no long-term trend over the last millennium, whereas there is an enhancing trend in their intensities. The interannual and multidecadal variabilities of the summer WAWJ are relatively smaller than those of the summer EAWJ. The principal periodicity of the summer WAWJ oscillations is within the ~25-year band, which is also observed in the variations of the EAWJ intensity in summer. Regarding the monthly variation (i.e. June, July, and August), the multidecadal variability of the WAWJ location in summer is the largest in June, whereas in August for the summer EAWJ. The leading periodicity is the longest in June for both the summer WAWJ and the summer EAWJ.
The MCA–LIA transition
The spatial difference is further examined in the summer AWJ during the transition from the MCA (AD 1000–1200) to the LIA (AD 1400–1600) and the associated mechanisms. It is shown in Figure 8a that the zonal wind anomaly in summer exhibits a meridional dipole pattern during the MCA relative to the LIA, with weakened zonal winds over the two active centers of the summer AWJ and enhanced wind to the north. This result indicates a poleward shift of the summer AWJ during the MCA relative to the LIA, which is closely linked with changes in the atmosphere thermal structure (Ihara and Kushnir, 2009; Lorenz and DeWeaver, 2007). The MEM shows that the temperature is higher over Eurasia continent during the MCA than the LIA (Figure 8a). For West Asia, the warming is relatively larger over the active center of the summer WAWJ with summer temperature anomaly reaching up to +0.18°C. This leads to an enhanced meridional temperature gradient at the north of the summer WAWJ core (~40°N) and a reduced gradient to the south, resulting in a poleward shift of the summer WAWJ during the MCA according to the principle of the thermal wind (Rojas, 2009; Wilcox et al., 2012) (Figure 8c). With respect to East Asia, the meridional temperature gradient is weaker over the active center of the summer EAWJ during the MCA relative to the LIA. This gives rise to a weaker EAWJ in summer and limited northward migration, as the meridional temperature gradient is only slightly enhanced at the north of ~50°N.
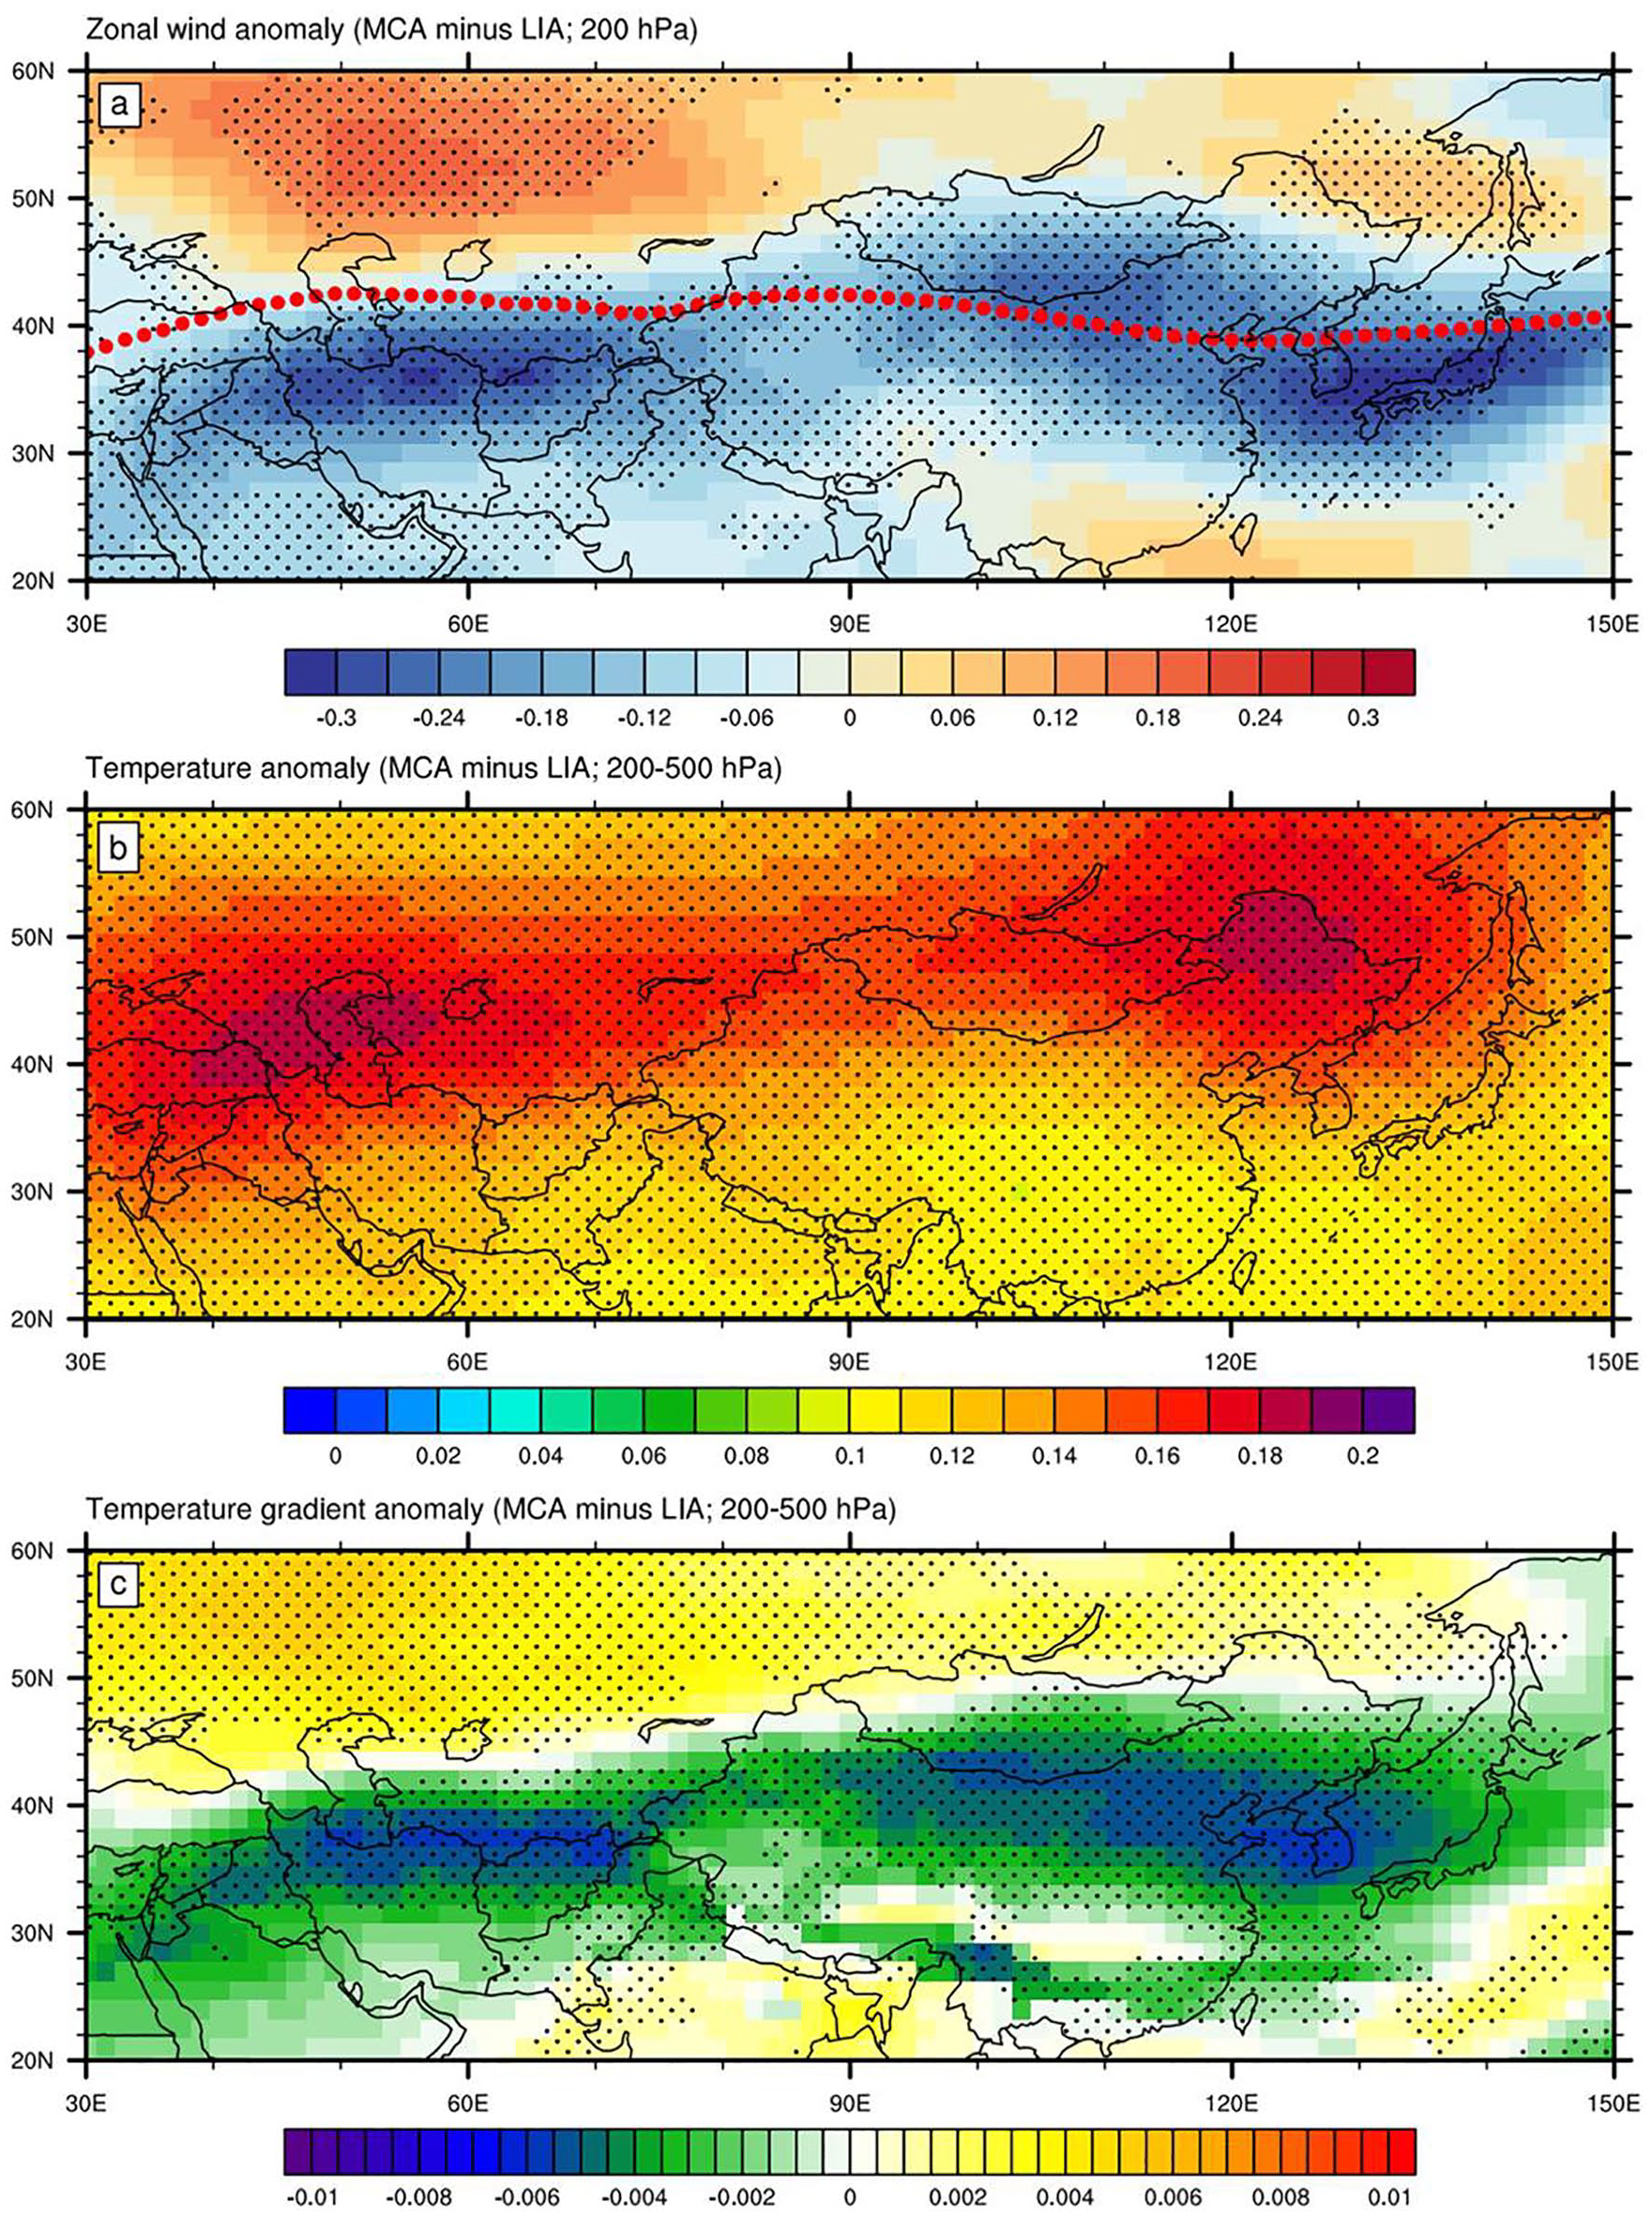
Differences in zonal wind speed at 200 hPa (a; m/s), temperature averaged between 200 and 500 hPa (b; °C), and meridional gradient of temperature averaged between 200 and 500 hPa (c; °C/°) between the MCA and LIA based on the MEM. Red dots denote the jet axis of the summer AWJ during the MCA. Dotted areas denote more than eight models have the same sign change with the MEM.
As PMIP3 models show diverse capacity in reproducing the zonal wind speed in summer over Asia, the model consistency is also assessed in the variation of the mid-latitude westerly between the MCA and the LIA (Figure 8a). It is found that the dipole pattern of zonal wind anomaly is seen in the majority of PMIP3 models (>70%), suggesting a relatively robust signal. Moreover, the MCA and LIA generally span AD 950–1250 and AD 1450–1850, respectively. The influence of the definition of MCA/LIA is further examined in the zonal wind anomaly. Our results show that the meridional dipole pattern of the zonal wind during the MCA relative to the LIA is generally independent of the selected time interval (Supplemental Figure S1, available online), although the magnitude of wind anomaly differs.
Discussion
The summer WAWJ dominates the atmospheric circulation over West Asia that controls precipitation over arid Central Asia (Chen et al., 2008, 2010; Zhao et al., 2014). Thus, the variation of moisture conditions could be used as an indirect indicator for the summer AWJ, because of the paucity of direct geological evidence over the last millennium. Based on multi-proxies for moisture, Chen et al. (2010) found that it is relatively wetter over arid Central Asia during the MCA and drier during the LIA, which is also confirmed by Chen et al. (2015) and Li et al. (2017). This implies a weaker and northward shift of the summer AWJ during the MCA relative to the LIA, which is confirmed by our results. Moreover, the geological evidence showed that the tropical Pacific experiences an El Niño-like state during the MCA (Henke et al., 2017; Park et al., 2017; Yan et al., 2011), and the Indian Ocean and North Atlantic are relatively warmer (Fallah and Cubasch, 2015; Trouet et al., 2012). These changes in sea surface temperatures may contribute to the poleward shift of the summer AWJ through teleconnection (Ding and Wang, 2005; Tang and Yu, 2018).
Regarding the external forcings, our results indicate that the evolution of the summer AWJ is largely affected by solar activity and exhibits a quasi-25-year cycle, which is linked with Hale’s 22-year cycle. Then the simulated 31-year smoothed location and intensity of the summer AWJ with the solar forcing used in the PMIP3 models (Figure 9) are compared. On multidecadal–centennial timescale, variations of the location and intensity of the summer AWJ share similarity with the solar irradiance. In general, the summer AWJ tends to move poleward (equatorward) and weakens (strengthens) when the solar irradiance is relatively higher (lower). However, out-of-phase relationship is also observed during several intervals of the last millennium, which may be attributed to the potential influence of other factors (e.g. natural variability of climate system). Furthermore, two typical solar periods, that is, ‘Medieval Maximum’ (AD ~1100–1250) and ‘Spörer Minimum’ (AD ~1460–1550) are selected, to investigate the impact of solar activity on the summer AWJ (Figure 10). In response to higher solar irradiance, the meridional temperature gradient is enhanced and reduced at the north and south of the summer WAWJ core (~40°N), respectively, resulting in a poleward shift of the summer WAWJ during the ‘Medieval Maximum’ relative to the ‘Spörer Minimum’. The variation of the summer EAWJ shows limited northward migration as the meridional temperature gradient is only slightly enhanced at the north of ~50°N.
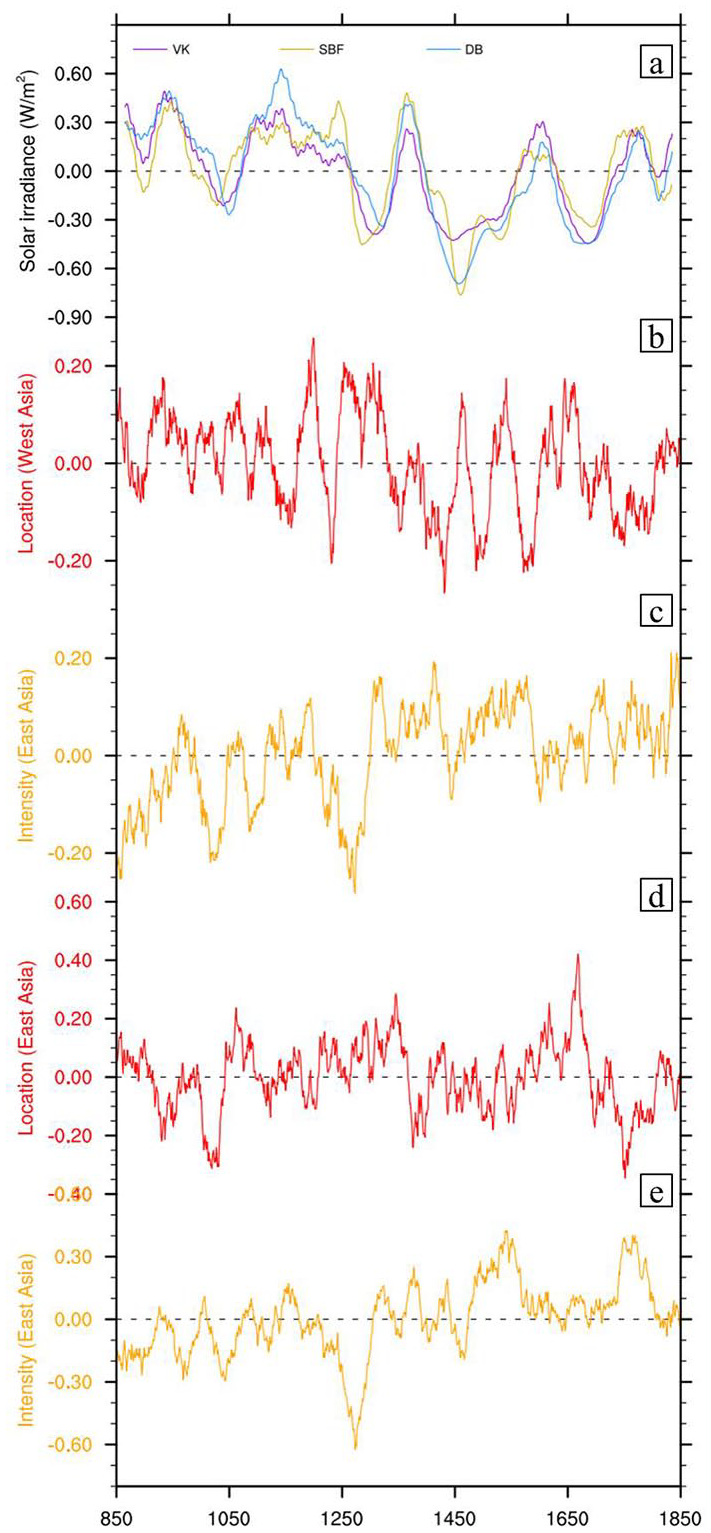
(a) Time series of 31-year smoothed solar irradiance (VK: Vieira et al. (2011) and Wang et al. (2005); SBF: Steinhilber et al. (2009); DB: Delaygue and Bard (2009) and Wang et al. (2005)) utilized in PMIP3 simulations. (b, c) Time series of 31-year smoothed location (b) and intensity (c) of the summer WAWJ over the last millennium from PMIP3 simulations. (d, e) Same as (b, c), but for the location (d) and intensity (e) of the summer EAWJ.
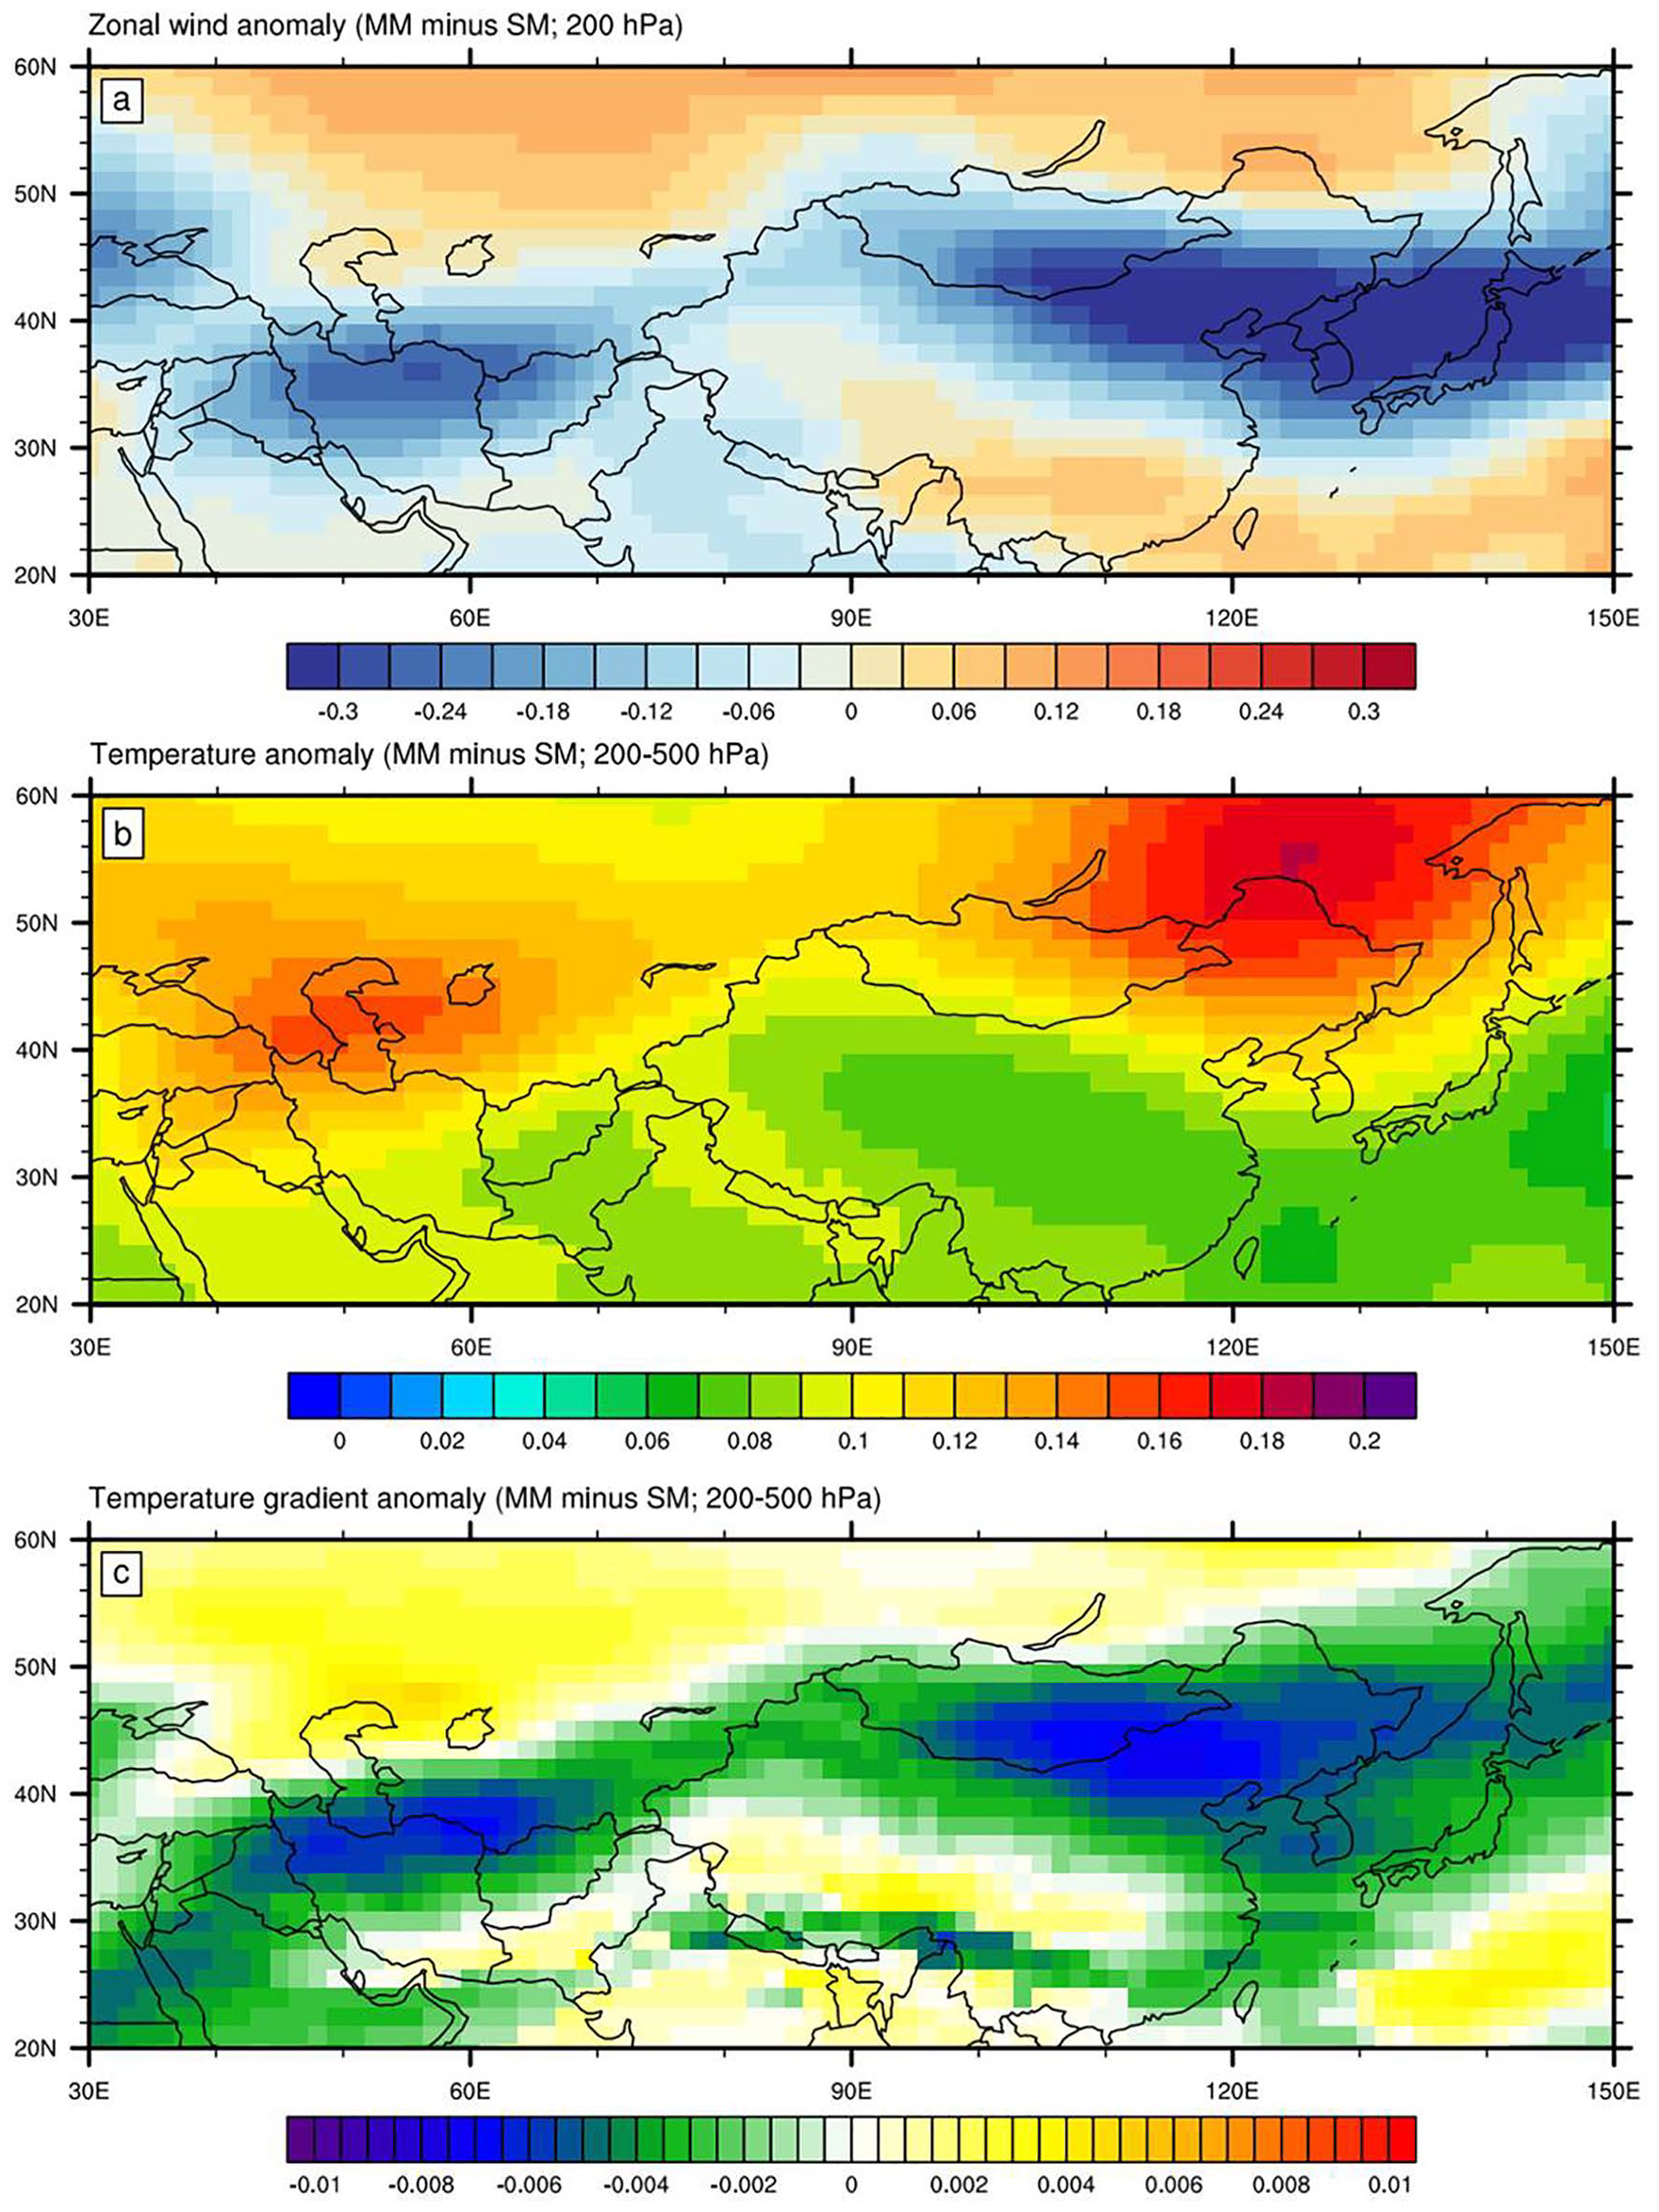
Same as Figure 8, but for differences between the ‘Medieval Maximum’ (MM, AD ~1100–1250) and ‘Spörer Minimum’ (SM, AD ~1460–1550) based on the MEM.
In addition, the potential role of volcano eruptions is examined in the summer AWJ by taking the eruption at AD 1258 as an example, which is the strongest tropical eruption over the last millennium. Based on the PMIP3 simulations, the zonal wind anomaly in summer exhibits a meridional dipole pattern during the post-eruption period (AD 1258–1260) relative to the last millennium, with weakened zonal winds over the two active centers of the summer AWJ and enhanced wind to the north (Figure 11a). This northward shift of summer AWJ is tied to the poleward migration of the meridional temperature gradient rising from the volcanic aerosols-induced stronger cooling at the low-mid latitudes (Figure 11b and c) (Haywood et al., 2013; Schneider et al., 2009). These results imply that the summer AWJ tends to become weaker and shifts northward following large volcanic eruptions. However, the impact of volcanic activity on the summer AWJ may also be related to the locations of volcanoes (e.g. Northern Hemisphere or Southern Hemisphere) and intensity of volcanic eruptions (e.g. Yan et al., 2018), which is worthy of further investigation in a future study.
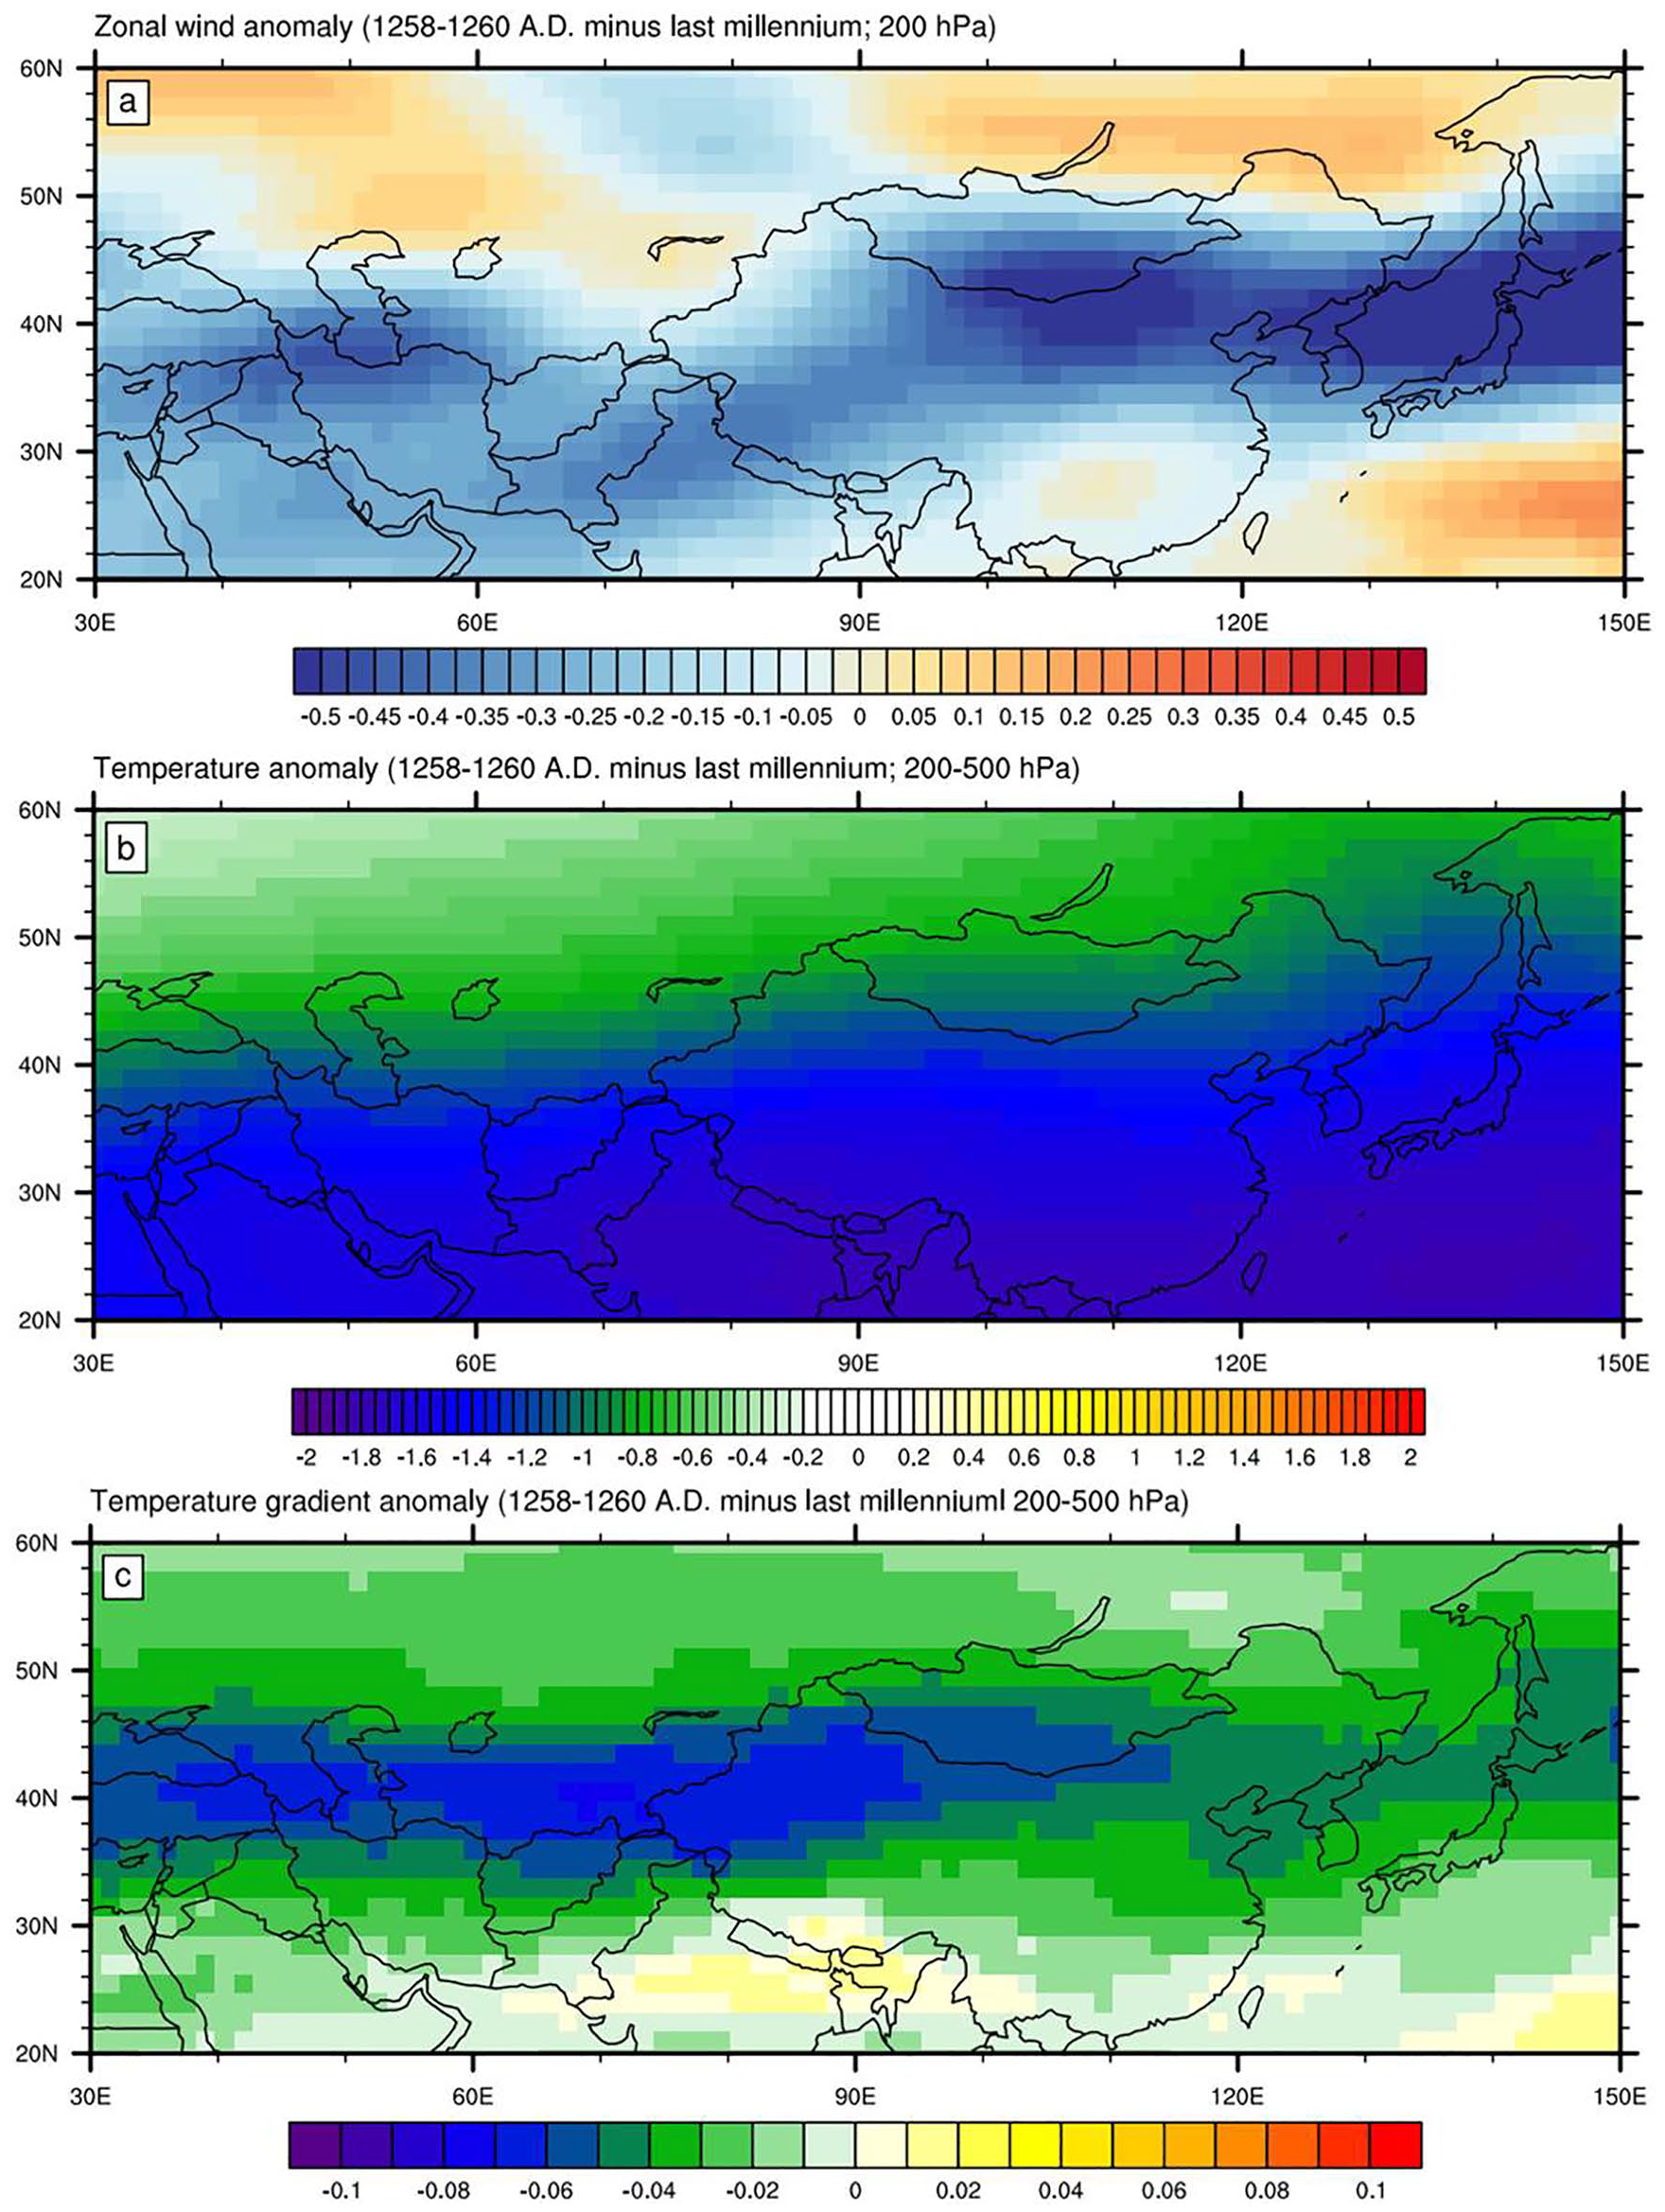
Same as Figure 8, but for differences between the post-eruption period (AD 1258–1260) and the last millennium based on the MEM.
There are, however, several limitations to be considered. The PMIP3 models broadly capture the spatiotemporal characteristics of the summer AWJ over the last millennium revealed by indirect geological evidence, but the amplitude of the modeled response is relatively small. This limitation is also noted in the modeled variations of temperature (Yang and Jiang, 2017), precipitation (Shi et al., 2016a), and tropical cyclone genesis (Yan et al., 2016) over the last millennium using PMIP3 models. This may be attributed to relatively small changes in external forcings (e.g. solar irradiation) and uncertainties in climate models (e.g. parameterizations). It is found that solar activity and volcanic eruption can significantly alter the evolution of the summer AWJ, but their roles are not isolated here and should be examined in the future work. In addition, the lack of direct geological evidence for the evolution of the summer AWJ at high temporal resolution limits a more detailed model–data comparison. Nevertheless, our results may advance our knowledge on the evolution of the summer AWJ over the last millennium from a modeling perspective and shed light on the response of the summer AWJ to natural forcings in both past and future climates.
Conclusion
The summer AWJ is a vital component of the mid-latitude westerlies and significantly modulates precipitation over Asia on multi-timescales. Here, the evolution of the summer AWJ over the last millennium based on the model outputs from the PMIP3 is investigated. Preliminary evaluation illustrates that the PMIP3 models generally perform well in reproducing the modern spatial distribution of the zonal wind at 200 hPa, with the spatial correlation coefficients ranging from 0.90 to 0.99 and the RMSEs of 6.0 ± 2.4 m/s. Compared with individual climate models, the MEM shows superiority in depicting the distribution and interannual variability of the summer AWJ. The MEM accurately captures the location of the summer AWJ axis with a bias of only 0.33°, although the intensity of the summer AWJ is underestimated, as seen in all the PMIP3 models.
Based on the MEM, it is found that the simulated location of the summer AWJ shows no obvious long-term trend over the last millennium, whereas there is an enhancing trend in the intensity. Meantime, the location and intensity of the summer AWJ exhibit clear interannual and multidecadal variability, with larger variability over East Asia than over West Asia. For the periodicity, the location of the summer WAWJ and EAWJ oscillates primarily within the ~25-year band, whereas for the intensity, it oscillates within the ~25- and ~15-year band, respectively. The summer AWJ also varies differently by months in terms of the variability and periodicity. Specifically, the multidecadal variability of the summer AWJ is the largest in June over West Asia, whereas it is the largest in August over East Asia, and the leading periodicity of both the summer WAWJ and EAWJ is the longest in June. With respect to the MCA–LIA transition, the summer AWJ broadly moves northward and weakens during the MCA relative to the LIA. This is attributed to the reduced meridional temperature gradient at the north of the summer AWJ core and enhanced gradient to the south.
Supplemental Material
westerlies_past1000_supplementary – Supplemental material for Variation of the summer Asian westerly jet over the last millennium based on the PMIP3 simulations
Supplemental material, westerlies_past1000_supplementary for Variation of the summer Asian westerly jet over the last millennium based on the PMIP3 simulations by Nanxuan Jiang, Qing Yan and Huijun Wang in The Holocene
Footnotes
Acknowledgements
Many thanks to the three anonymous reviewers for their very constructive and useful comments in helping to improve our manuscript. The PMIP3 outputs are available at https://esgf-node.llnl.gov/projects/esgf-llnl/. The ERA-Interim reanalysis products are available at ![]()
Funding
The author(s) disclosed receipt of the following financial support for the research, authorship, and/or publication of this article: This research was supported by the Strategic Priority Research Program of Chinese Academy of Sciences (XDA20070103), the Youth Innovation Promotion Association by CAS (2019080), and the Young Elite Scientists Sponsorship Program by CAST (2017QNRC001).
Supplemental material
Supplemental material for this article is available online.
References
Supplementary Material
Please find the following supplemental material available below.
For Open Access articles published under a Creative Commons License, all supplemental material carries the same license as the article it is associated with.
For non-Open Access articles published, all supplemental material carries a non-exclusive license, and permission requests for re-use of supplemental material or any part of supplemental material shall be sent directly to the copyright owner as specified in the copyright notice associated with the article.