
Abstract
Microcharcoal in soils and sediments is an ideal proxy for studying fire activity. Phytoliths in soils and sediments record the environmental conditions in which the phytoliths were formed by plants. However, our understanding of the relationships between fire activity, plant communities, and the preservation of microcharcoal and phytoliths in soils and sediments remains limited. In this study, we collected soils and sediments across a gradient of burned and unburned forest in southwest China, and analyzed the microcharcoals and phytoliths in these samples to understand the relationships between these microfossils (ratios of microcharcoal to phytolith particles (Ch/Ph)), fire activity, and vegetation cover. We show that the Ch/Ph ratios recorded fire activity and were significantly different across the gradient of burned to unburned forest. The highest and lowest ratios (0.25 and 0.01) were found in burned forest (Bs1) and unburned forest samples (Us2), respectively. The ratios gradually decreased with increasing distance from the fire. This study suggests the ratio (Ch/Ph) to be a useful proxy for studying fire activity and/or history using soils and sediments.
Introduction
Fire is a ubiquitous agent of disturbance in terrestrial ecosystems (Bowman et al., 2009; Power et al., 2010). The existence and occurrence of fire is affected by vegetation and climate but is also essential in the dynamic evolution of vegetation (Carcaillet and Thinon, 1996; Earle et al., 1996; Lertzman and Fall, 1998; Pierce et al., 2004; Romme and Knight, 1981). Fire has important impacts on ecological processes, atmospheric chemistry and the global carbon cycle (Power et al., 2010). Understanding the occurrence and evolution of fire is helpful for understanding the relationships between fire, vegetation, climate and/or human activities, and provides the basis of fire management and prevention policies (Bowman et al., 2009; Chipman et al., 2015; Fauria and Johnson, 2008; Pierce et al., 2004). Charcoal is the product of incomplete combustion of plants and when preserved in soils and sediments, can be used to reconstruct fire history and fire regimes (e.g. frequency and intensity) (Carcaillet, 1998; Cochrane et al., 1999; Pierce et al., 2004; Whitlock et al., 2002). Microscopic charcoal particles are interpreted to represent a regional fire signal, whereas larger charcoal fragments serve as a proxy of local fire history (Ballard et al., 2017; Carcaillet et al., 2001; Clark, 1988; Lebreton et al., 2018; Vachula and Richter, 2018). The quantification of charcoal and charcoal abundance indices (such as charcoal to pollen ratios, charcoal concentration, accumulation rate or sediment flux) have been applied to soils, lakes, peats and cultural sediments to evaluate the background levels of wildfire and the use of fire by humans (Ballard et al., 2017; Carracedo et al., 2018; Gavin et al., 2003; Jara et al., 2019; Lebreton et al., 2018; Luo et al., 2001; Pierce et al., 2004). Microscopic charcoal is generally preferred by pollen researchers, because it can be quantified with pollen slides (Burjachs and Expósito, 2015; Carracedo et al., 2018; Finsinger and Tinner, 2005).
Microcharcoal abundance is related to the accumulation rate of sediments. Reliant on the dating of sediments, the accumulation rate or sediment flux of microcharcoal is a valid means of determining fire events and fire regime (Carracedo et al., 2018; Luo et al., 2001). However, using charcoal accumulation alone is not an effective approach in some vegetation communities (Cordova et al., 2011). Microcharcoal concentration incorporated with another index is useful to understand the multifaceted characteristics of fire. Alternatively, the ratio of microcharcoal to pollen tends to eliminate false peaks and reduce the influence of biases that deposition rate, vegetation type and biomass have on microcharcoal abundance, and thus is a more accurate index for determining the fire occurrence and range, as pollen should be redeposited along with microcharcoal (Ballard et al., 2017; Jia et al., 2017; Swain, 1973). Despite this, pollen does not typically exhibit in-situ sedimentation, and can therefore be a representation of local and regional vegetation (Jara et al., 2019; Sun et al., 2001). Thus, comparisons of microcharcoal with other particles might overcome this limitation and provide promising supplementary approaches to evaluate fire events using sediments. Phytoliths are microscopic mineralized bodies formed in living plants. Monosilicic acid is brought into the plant through the uptake of water and precipitates to form opaline silica within and between cells (Das et al., 2013). The opaline composition of phytoliths makes them particularly resistant to degradation (Wu, 2008). Since phytolith morphologies and density do not easily facilitate aerial transportation, most phytoliths released from expired plants settle into the substrate before they can be transported by water, wind or ash clouds produced by fire (Aleman et al., 2014; Li et al., 2010; Wallis, 2001). As opposed to pollen and charcoal, phytoliths are generally not susceptible to aerial dispersal, but rather are typically preserved in-situ (Li et al., 2019; Piperno, 1988, 2006). Furthermore, phytolith assemblages can be used to infer vegetation cover (grassland, scrub grassland and tree forest; Gu et al., 2008; Hyland et al., 2013; Piperno, 2006;). However, there is a significant difference in the yields of phytoliths between grass and woody plants. Grass species normally produce more phytoliths than woody plants (Carnelli et al., 2001; Hyland et al., 2013; Piperno, 2006; Tsartsidou et al., 2007). Experimental burns show that woody plants produce higher ratios of microcharcoal to phytolith particles (Ch/Ph) than do grasses (Li et al., 2019). Therefore, phytoliths and microcharcoal together may provide unique opportunities for understanding the relationships between vegetation, natural and anthropogenic fire (Cordova et al., 2011; Gu et al., 2008; Li et al., 2010).
In this study, we investigated the ratio of Ch/Ph in topsoil and gully sediments in a forest where a wildfire occurred 2 years ago, in order to determine whether it could be used as an indicator of fire activity. The opportunity for such a study arose following a forest fire in November 2017 at Liandaowan Village, in Guilin City, Southwest China.
Materials and methods
Regional setting
Liandaowan Village (110°34′-111°02′ E,24°16′-24°53′ N) is located in Pingle County, Guilin City, in southwest China. Pingle County is situated in the south of the subtropical monsoon climate region and is affected by both the SW maritime monsoon from the Indian Ocean and the SE maritime monsoon from the western Pacific Ocean. It has an annual mean temperature of 19.9°C, and precipitation of 1357.5 mm. The highest and lowest monthly mean temperatures are in July and in January, respectively. The landforms of the sampling region are medium and low sandstone mountains with attitudes ranging from 72 m to 1372.1 m. A tributary river of the Xijiang River system passes through the study area. The vegetation is characterized by subtropical evergreen broad-leaved forest. The regional forest is a secondary coniferous forest, which is composed of Pinus massoniana Lamb, Cunninghamia lanceolata (Lamb.) Hook (Chinese fir) and fern species. Pinus massoniana Lamb is the dominant plant species. Meanwhile, grass Panicoideae species, such as Setaria palmifolia (Koen.) Stapf, Microstegium ciliatum (Trin.) A. Camus, Miscanthus floridulus and Miscanthus sinensis are widely distributed outside of forest stands. After the wildfire event occurred in 2017, the area’s vegetation was characterized by a scrub-grass community with shrubs, ferns and Panicodeae species.
Sampling
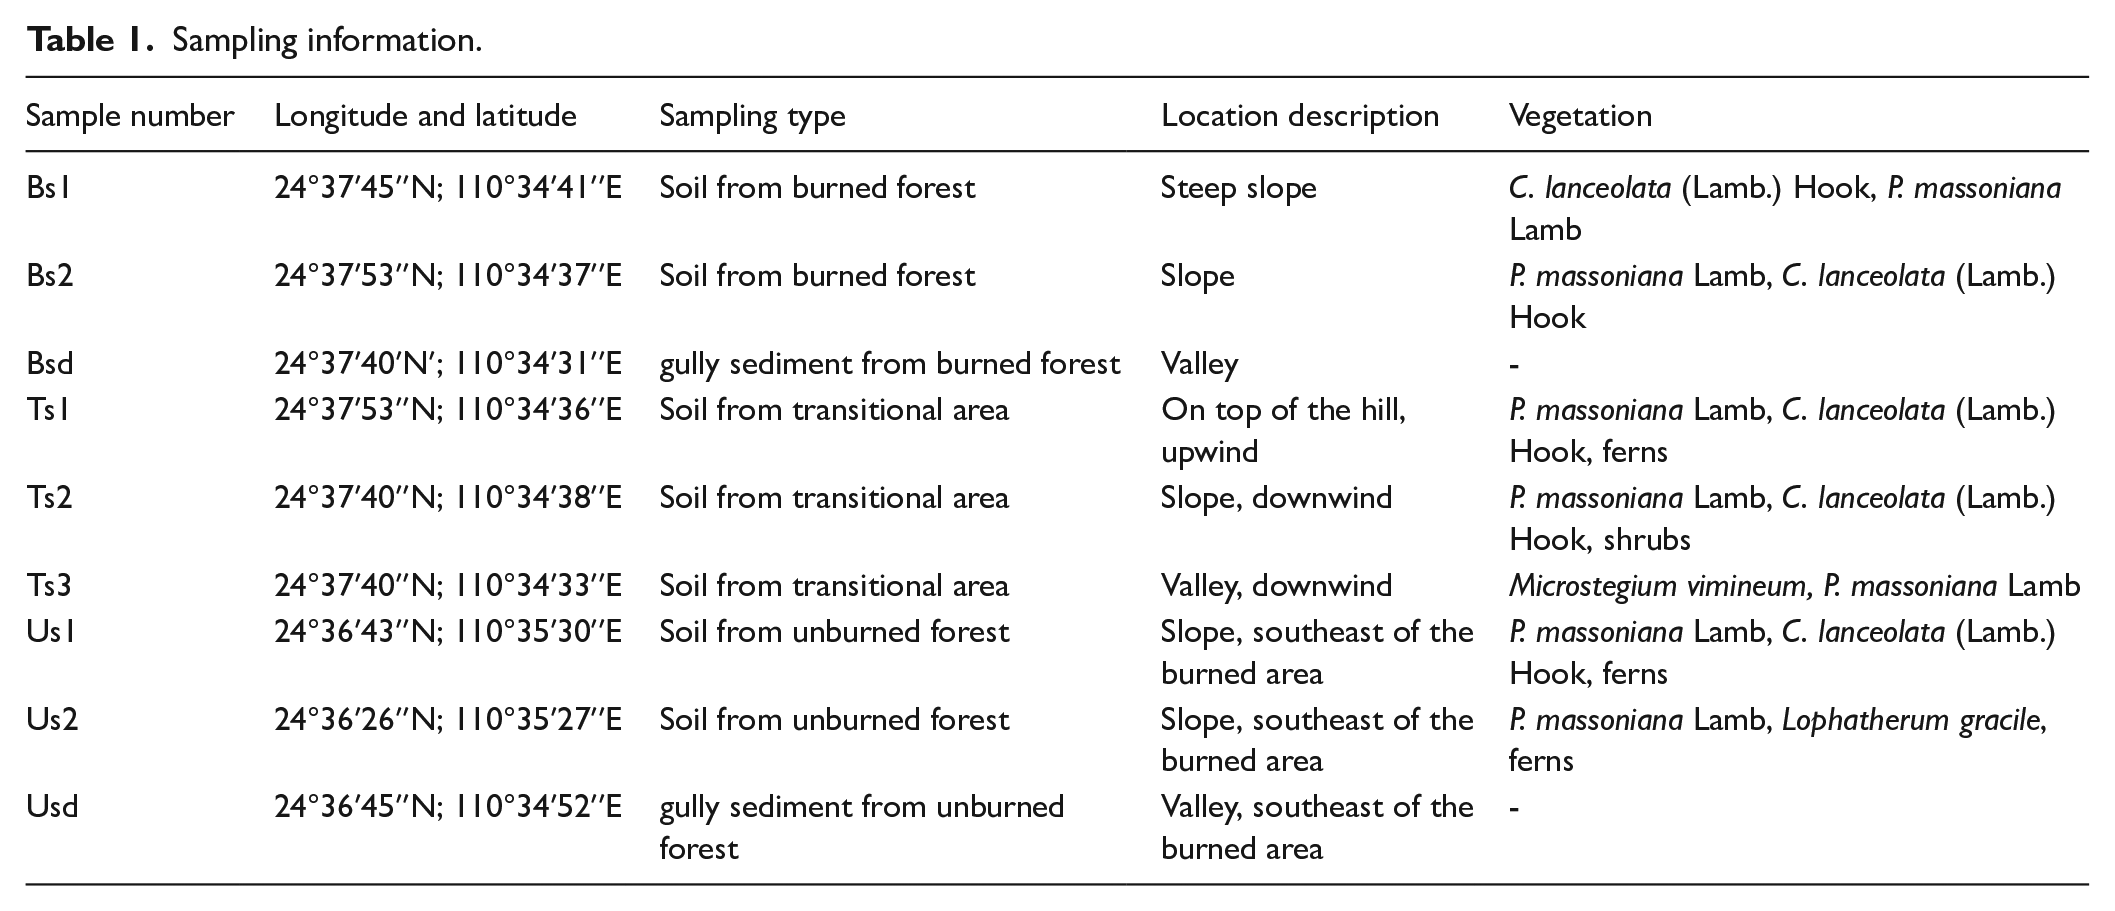
The fire was started by farmers to clear land, but moved swiftly upslope and downwind by northeasterly winds, eventually causing stand-replacing crown fires which spread across an area of 0.1 km2 (Figure 1). In 2019, samples of sediments, soils and gully sediments were taken from this burned area of forest. Samples were also taken from the unburned forest 2–3 km away from the fire perimeter. This forest stand was chosen to ensure similar vegetation cover to the burnt area. Samples were also taken from the transition area. It is the burned-unburned forest boundary, covering hundreds of meters (500 m in this study) (Blackford, 2000). All samples were taken using 5-point sampling method (five points from four vertices and the diagonal intersection of a quadrilateral), and 5 cm thick topsoil of five points was mixed as one sample, in order to maintain the sampling representativeness. A total of nine samples were obtained from nine sample locations (detailed information is listed in Table 1).

Map of sampling location. (a) Map of China, (b) Map of Guilin City, (c) Google EarthTM map of sampling site.
Sampling information.
Phytolith extraction, classification, and analysis
Phytoliths and microcharcoal were extracted using the wet ash method (Gu et al., 2008; Li et al., 2010, 2019; Wang and Lu, 1993). The summarized protocol is as follows:
The soil samples were dried in an oven (70°C). The dried and ground samples passed through 60 mesh screen. Two Lycopodium spore spikes (27,560 particles/piece) were added to each sample (10 g) and were placed in 2000 mL beaker. Carbonates were removed using 15% HCl and organic matter was oxidized using 30% solution of H2O2. Samples were poured into 50 mL centrifuge tubes and dried (70°C). Phytoliths and charcoal combined samples were transferred into a ZnBr2 solution (ρ = 2.30), centrifuged at 3000 rpm for 15 min, and washed with 98% acetic acid (CH3COOH). Ethyl alcohol (C2H6O, 2 mL) was added to the extracts to prevent mixed solution deterioration and the extracts were placed in a refrigerator to be prepared for identification. The extracted samples were scanned and counted at 400× magnification using a Nikon-Eclipse 5Oipo microscope. We identified microcharcoal, black vegetal structures (carbonised elements with a recognizable cellular structure), phytoliths (burned phytoliths) and Lycopodium spores, and sought to identify approximately 400 particles in each sample. All types of burned phytoliths were identified.
Phytoliths were classified using the methods of Wang and Lu (1993) and Hu et al. (2018) and named according to the International Code for Phytolith Nomenclature 1.0 (Madella et al., 2005). In this study, the phytoliths, therefore, were divided into four groups on the basis of their origin:
(1) Grass silica short cell phytoliths (GSSC). Grass silica short cells (GSSC) are phytolith morphologies characteristic of Poaceae (Aleman et al., 2014; Li et al., 2019; Novello et al., 2012). Although some phytolith morphologies cannot indicate the species of a plant, phytoliths from grass silica short cells are generally distinguishable at the subfamily level, and thus have a certain level of taxonomic significance (Li et al., 2019). The saddle morphotype includes both short saddle and oblong concave saddle. Short saddle is the characteristic phytolith morphotype of Chloridoideae. The oblong concave saddle (very tall saddle) (Figure 2e) is diagnostic at the subfamily level and is exclusively derived from the epidermal short cells of Bambusoideae (Piperno and Pearsall, 1998; Yost et al., 2018). The bilobate (Figure 2f and g) are mainly produced in the epidermal short cells of Panicoideae and are also found in Oryzoideae grasses (Gu et al., 2008; Lu and Liu, 2003; Piperno and Pearsall, 1998; Wang and Lu, 1993). Polylobate (Figure 2h and i) phytoliths are commonly found in some species of Panicoideae (Li et al., 2019; Lu and Liu, 2003; Watling and Iriarte, 2013). Rondel (Figure 2j) phytoliths are mainly produced in the epidermal short cells of Pooideae (Li et al., 2019; Wang and Lu, 1993).
(2) Palm phytoliths. The globular echinate (Figure 2p) is characteristic of palms (Fenwick et al., 2011; Pearsall 2000; Piperno, 2006).
(3) Woody dicotyledon phytoliths. The woody dicotyledon phytolith types, for instance, multifaceted blocky (Figure 2q and r), blocky scrobiculate (Figure 2s), blocky polyhedral (Figure 2v and w) etc. are produced in broad-leaved evergreen and semi-deciduous trees (Pinaceae) (Gu et al., 2008; Hu et al., 2018; Lu et al., 2006; Wang and Lu, 1993). Blocky scrobiculate, blocky polyhedral, multifaceted blocky and elongate (Figure 2 Aa and Ab) are characteristic of conifers (Hu et al., 2018).
(4) Non-diagnostic types are mainly composed of cuneiform (Figure 2a–d), elongate, hair cell (Figure 2n), acicular (Figure 2k) and tracheid morphotypes (Figure 2o).
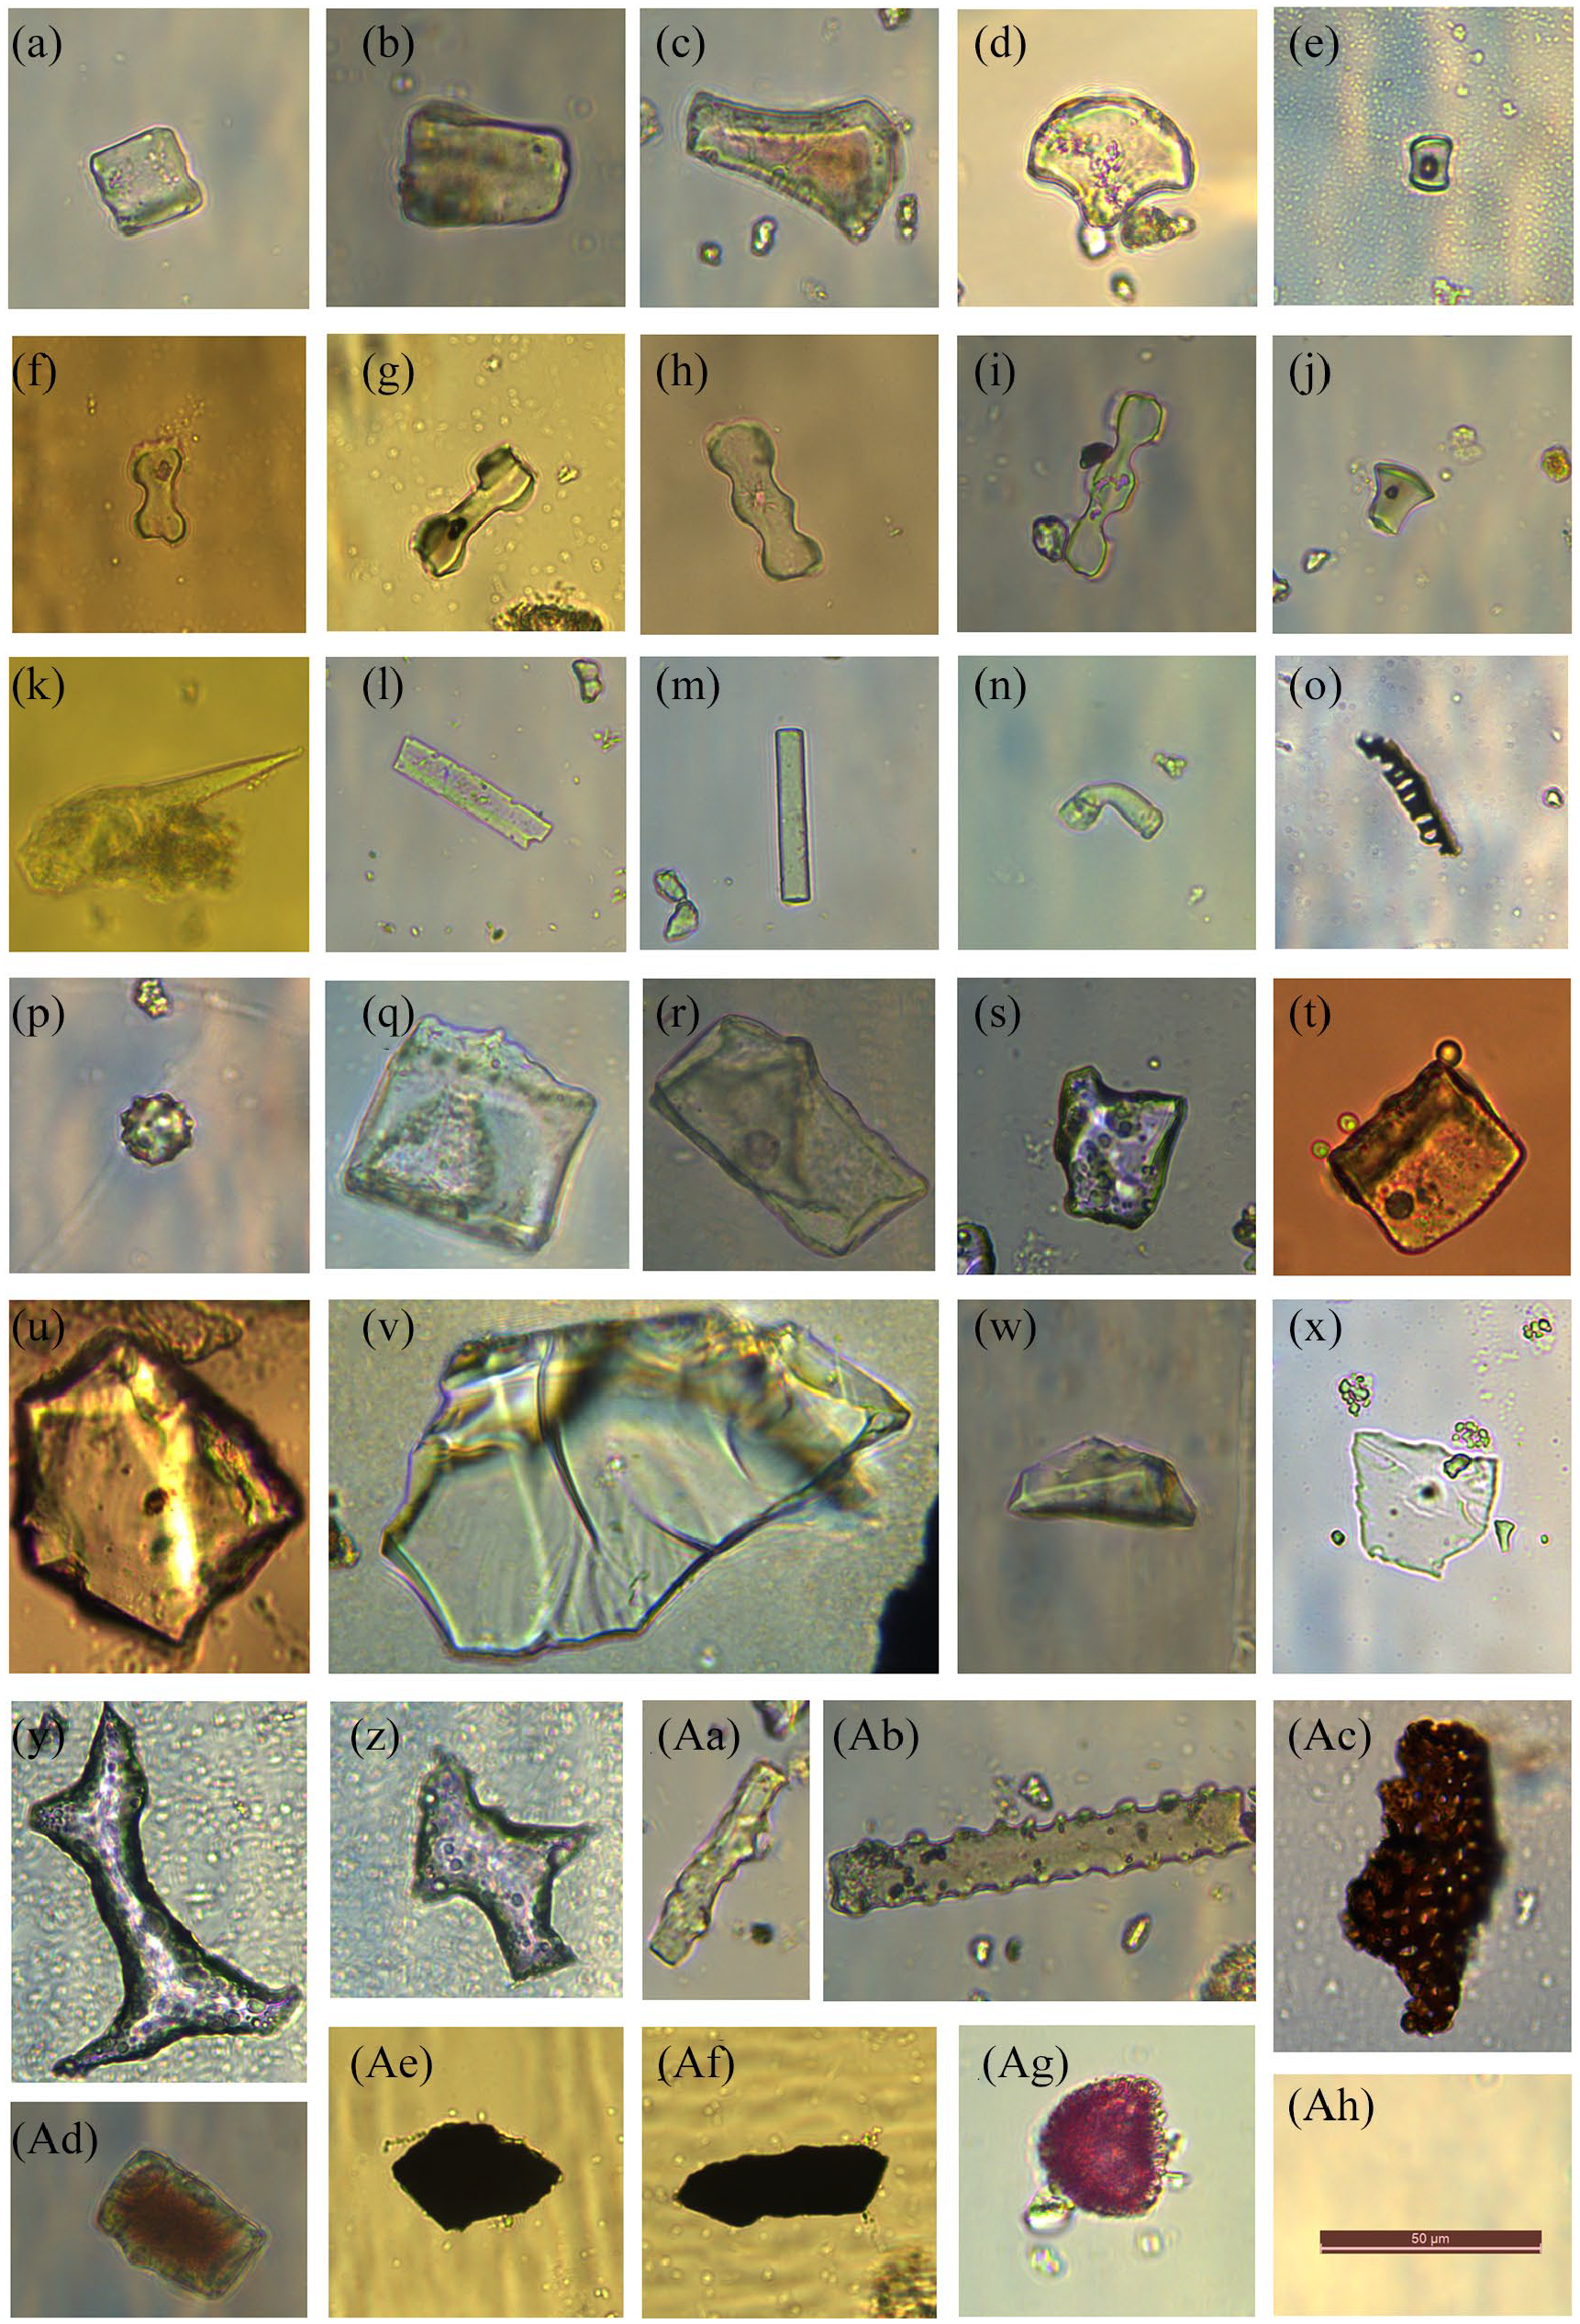
Photomicrographs of major phytolith morphotypes, microcharcoal, black vegetal structure and burned phytolith. (a–d) Cuneiform; (e) Saddle; (f and g) Bilobate; (h and i) Polylobates; (j) Rondel; (k) Acicular; (l and m) Elongate; (n) Hair cell; (o) tracheid; (p) Globular echinate; (q and r) Multifaceted blocky; (s) Blocky scrobiculate; (t and u) Round hole blocky; (v and w) Blocky polyhedral; (x) Platelets polygon; (y and z) Irregular convex blocky; (Aa and Ab) Elongate (woody); (Ac) Black vegetal structure; (Ad) Burned phytolith; (Ae and Af) Microcharcoal; (Ag) Spore; (Ah) Scale = 50 μm.
Based on size, charcoal particles can be classified into macrocharcoal and microcharcoal. Studies generally agree that 120 μm or 125 μm serves as the upper size bound for microscopic charcoal particles (Blackford, 2000; Li et al., 2006; Li et al., 2010), and 50 μm serves as another size bound of microcharcoal (Lu et al., 2002; Vachula, 2018). In this study, microcharcoal (Figure 2, Ae and Af) particles in slides were classified into two size groups, namely 15–50 μm and 50–120 μm. Black vegetal structures (Figure 2Ac) are charcoal particles with visible cellular structures. These particles were differentiated from microcharcoal which lack visible cellular structures but were identified as charcoal from its color, shape, and clear edges (Lindskoug and Marconetto, 2019). Some authors defined natural discoloration as being transparent and opalescent, as opposed to the dull opaque discoloration that occurs with natural fires (Cordova et al., 2011; Gu et al., 2008; Li et al., 2010; Parr, 2006). The concentrations of microcharcoal and phytoliths were calculated using the number of Lycopodium spores in each sample (Figure 2Ag). The equation for the percentage (1), and the concentration of microcharcoal, phytoliths, burned phytoliths, and black vegetal structures (2) are as follows:


In equation 1, P is the percentage of microcharcoal (phytoliths, burned phytoliths and black vegetal structures) particles counted. T is the total number of particles counted. In equation 1 and 2, n is the number of phytolith and charred (microcharcoal burned phytolith, and black vegetal structures) particles counted. In equation 2, N is the number of Lycopodium spores counted on slides of each samples. M is the number of Lycopodium spores per sample (27560 grains), m is the weight of each sample (g), W is per mass concentration of these particles (104 Grains/g) (Liu et al., 2016).
The ratio of the woody dicotyledon phytoliths to the sum of GSSC is a proxy for tree cover density (Wd/P) (Li et al., 2019). The Ch/Ph is the ratio of the microcharcoal particles to the sum of phytoliths (Li et al., 2019). Ch/PhG and Ch/PhW are the ratios of the microcharcoal particles to the numbers of grass silica short cell (GSSC) and woody dicotyledon phytolith types, respectively. These proxies are calculated using the percentage of phytolith morphotypes and microcharcoal particles.
Statistical analyses
The concentrations of particles identified and the values of Wd/P and Ch/Ph were analyzed with principal components analysis (PCA) to identify the factors which influence the Ch/Ph index. Correlation analyses were conducted to investigate the relationships between the values of Wd/P and Ch/Ph, as well as the concentrations of microcharcoal, black vegetal structures and burned phytolith particles. All statistical analyses were performed using SPSS 19.0 software.
Results
Phytolith abundance and assemblage
The dominant herbaceous phytolith morphotypes identified were as follows: cuneiform, bilobate, elongate, oblong concave saddle, polylobates, rondel, and acicular. The two most abundant morphotypes in the phytolith assemblages were bilobate (range = 5.1–26.6%, average = 17.3%) and oblong concave saddle (range = 1.2–26.15%, average = 9.5%). The percentages of woody dicotyledon phytoliths ranged from 12.3% to 29.6% and were dominated by coniferous types (multifaceted blocky, blocky scrobiculate, round hole blocky, elongate (edge curve and dendtritic), blocky polyhedral, platelets polygon, irregular convex blocky). In addition, abundant globular echinate phytoliths (range = 0.5–16.0%, average = 6.7%) were identified in samples (Figures 2 and 3).
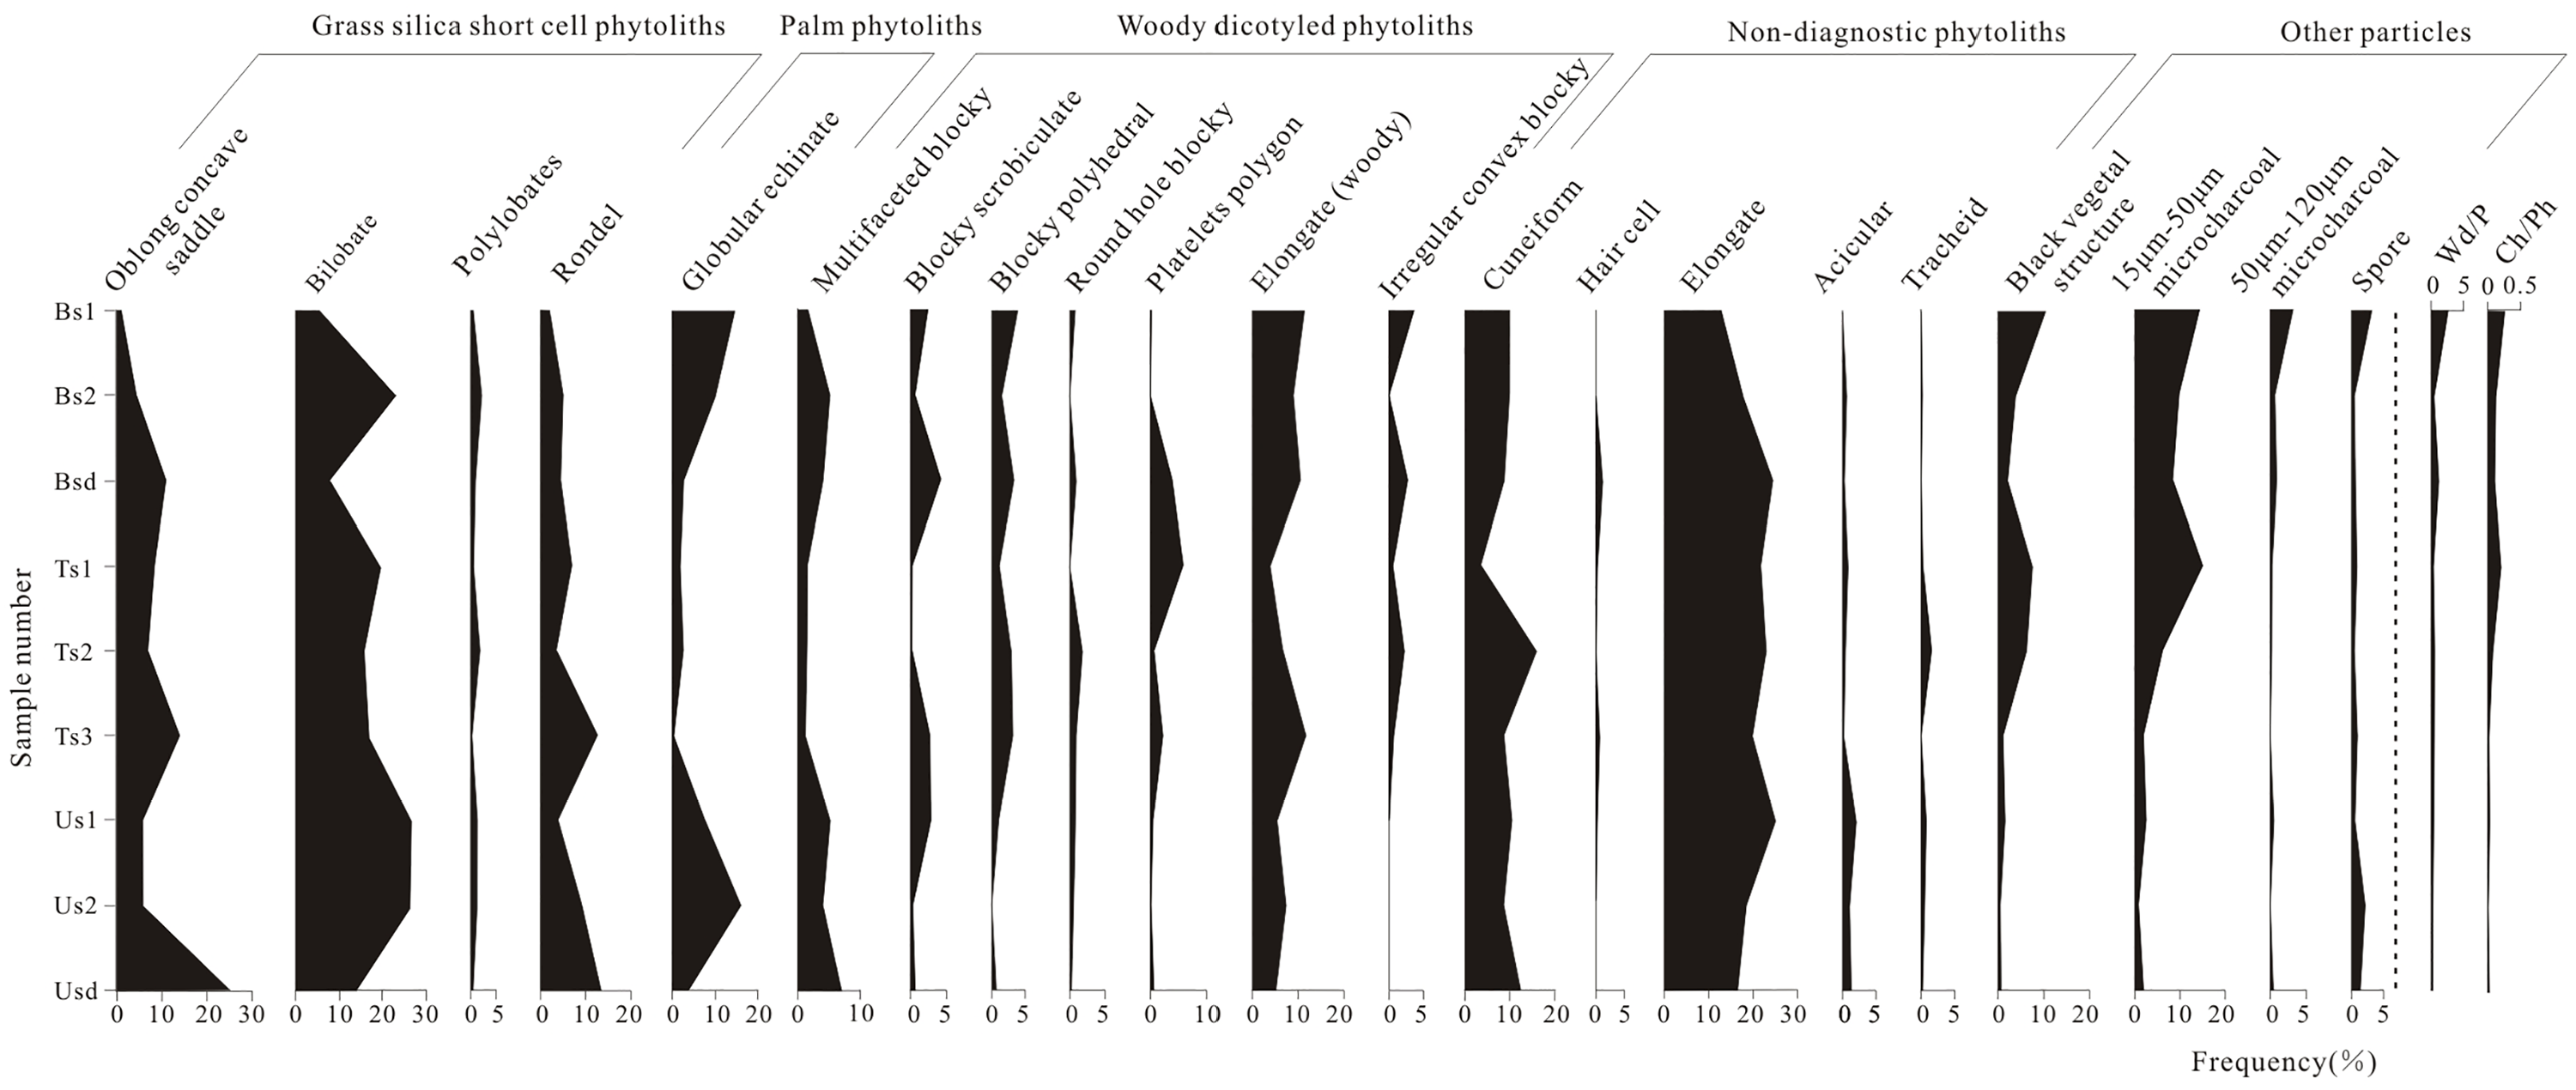
Phytolith and microcharcoal assemblages, assemblage indices (Wd/P, tree cover density index; Ch/Ph, the ratio of microcharcoal to phytolith) of soil from burned, transitional and unburned forest.
GSSCs occurred at higher relative abundances (range = 8.7–53.6%, average = 34.7%) than woody dicotyledon phytoliths (average = 18.2%). Most samples had Wd/P values close to 0.4, except for samples Bs1 and Bsd from the burned area, which had values exceeding 1.
Variability of microcharcoal
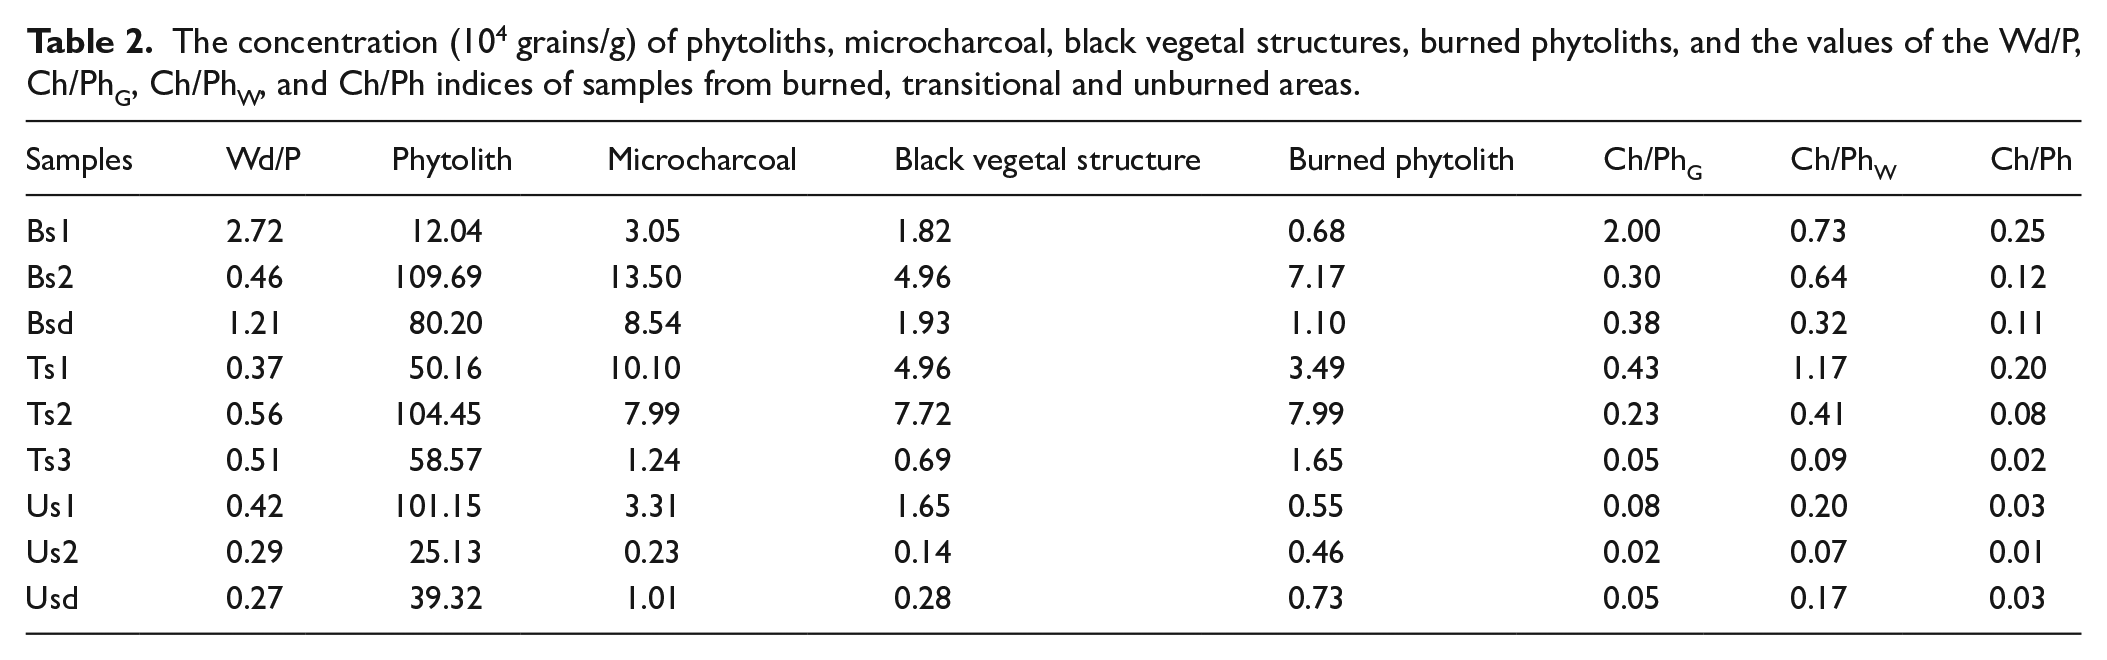
Abundant microcharcoal, black vegetal structures, and burned phytoliths were identified using the microcharcoal identification criteria of published studies (Lindskoug and Marconetto, 2019; Turner et al., 2008). Microcharcoal particles with diameters of 15–50 μm comprise a majority of the charcoal assemblages on phytolith slides. The higher percentages of microcharcoal with 50–120 μm diameter occur in the samples from the burned area. The percentage of microcharcoal varied from 0.9% to 17.5%. The total concentrations of microcharcoal ranged from 0.23 × 10⁴ particles/g to 13.50 × 10⁴ particles/g (Table 2). The percentages and concentrations of microcharcoal of samples from unburned areas had lower values than those of samples from the burned area. The highest values were found in the sample Bs2 (~13.50 × 10⁴ Grains/g) from the burned area. The concentrations of microcharcoal were lower in sample Bs1 (~3.05 × 10⁴ Grains/g) from the burned area, whereas higher values were evident in the samples Ts1 (~10.10 × 10⁴ Grains/g) and Ts2 (~7.99 × 10⁴ Grains/g) from the transitional area (Table 2). The concentration of microcharcoal, black vegetal structures, and burned phytolith share positive correlations (Figure 5a–c). The principal component analysis (PCA) results show vegetal structures, burned phytoliths and microcharcoal indices have the same primary controls (Figure 4).
The concentration (104 grains/g) of phytoliths, microcharcoal, black vegetal structures, burned phytoliths, and the values of the Wd/P, Ch/PhG, Ch/PhW, and Ch/Ph indices of samples from burned, transitional and unburned areas.
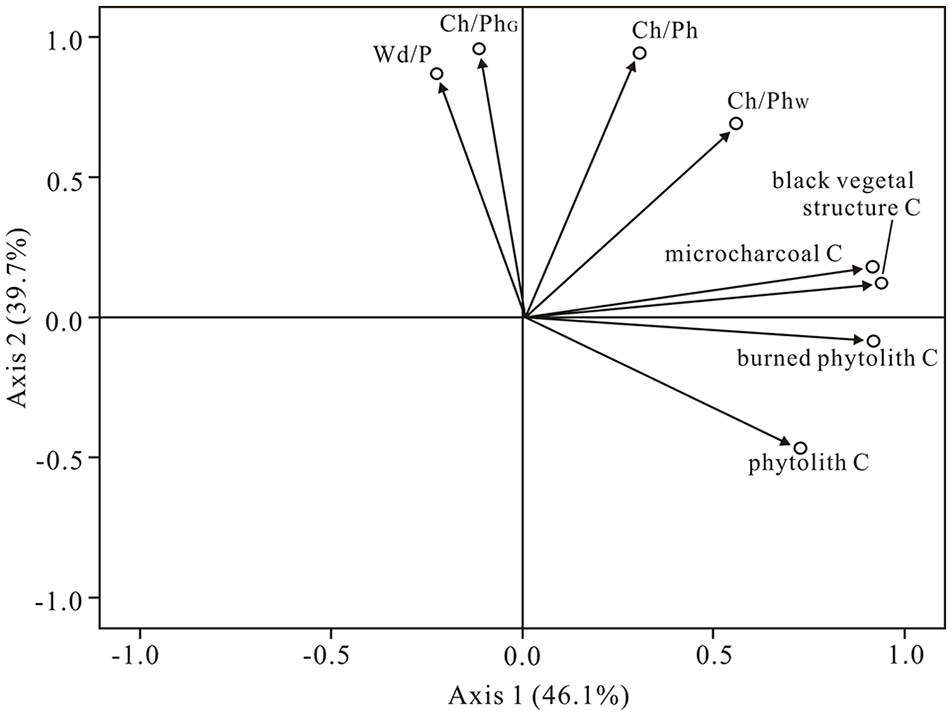
Ordination diagrams of the assemblage indices (Wd/P, Ch/PhG, Ch/PhW and Ch/Ph), and the concentration of phytolith and charred particles (burned phytoliths and black vegetal structure) from the principal component analysis. Axes 1 and 2 explained 46.1% and 39.7% of the variance, respectively.
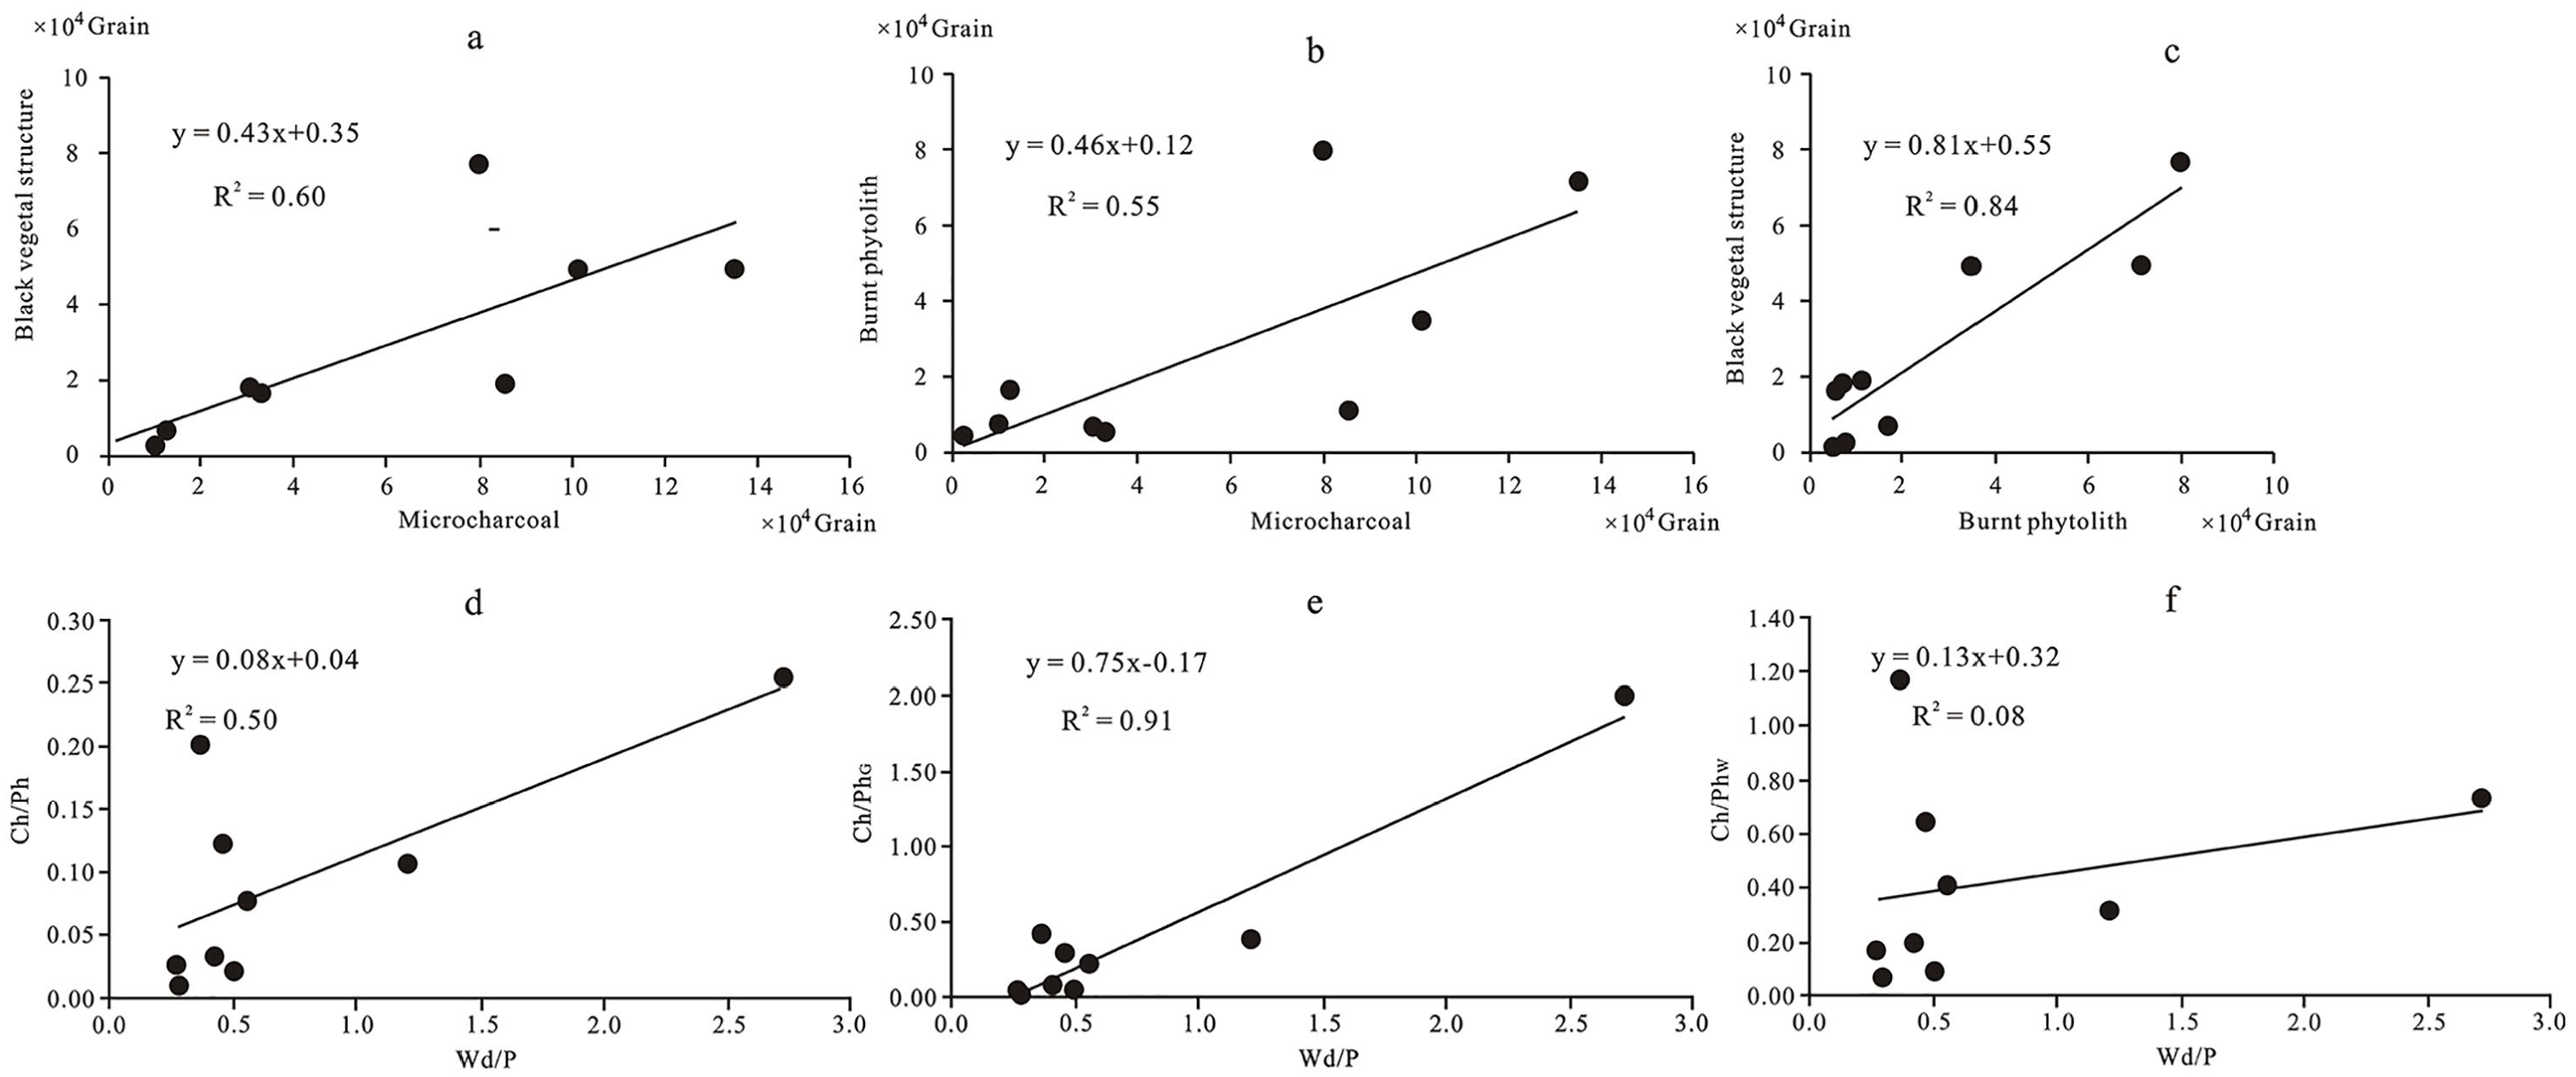
The positive correlation relationships between (a) microcharcoal and black vegetal structures, (b) microcharcoal and burned phytolith, (c) burned phytolith and black vegetal structures, (d) the values of Wd/P and Ch/Ph, (e) the values of Wd/P and Ch/PhG, and (f) the values of Wd/P and Ch/PhW.
Variability of the ratio of microcharcoal to phytolith particles
The ratios of microcharcoal to phytolith (Ch/Ph, Ch/PhW, Ch/PhG) ranged from 0.01 to 0.25, 0.07 to 1.17 and 0.02 to 2.0, respectively, and generally decreased across the gradient spanning the burned area, transitional to unburned area (Table 2; Figures 3 and 6). The Ch/Ph and Ch/PhW values and phytolith C (concentrations) did not correlate (R2 = 0.05 for Ch/Ph, R2 = 0.005 for Ch/PhW, respectively), but a moderate positive correlation with microcharcoal concentrations/percentages (R2 = 0.22 for Ch/Ph, R2 = 0.43 for Ch/PhW) (Figure 4). The positive correlation relationships exist between the values of Wd/P and Ch/PhG (R2 = 0.91), Ch/Ph and Wd/P (R2 = 0.50), respectively (Figure 5d and e). Responding to the relatively high abundance of the microcharcoal, the higher ratios of microcharcoal to phytolith particles also occurred in Ts1 and Ts2 from the transitional area. The Bs1 sample from the burned area has a low microcharcoal concentration but has the larger values of Ch/Ph, Ch/PhW and Ch/PhG (Table 2; Figure 6).
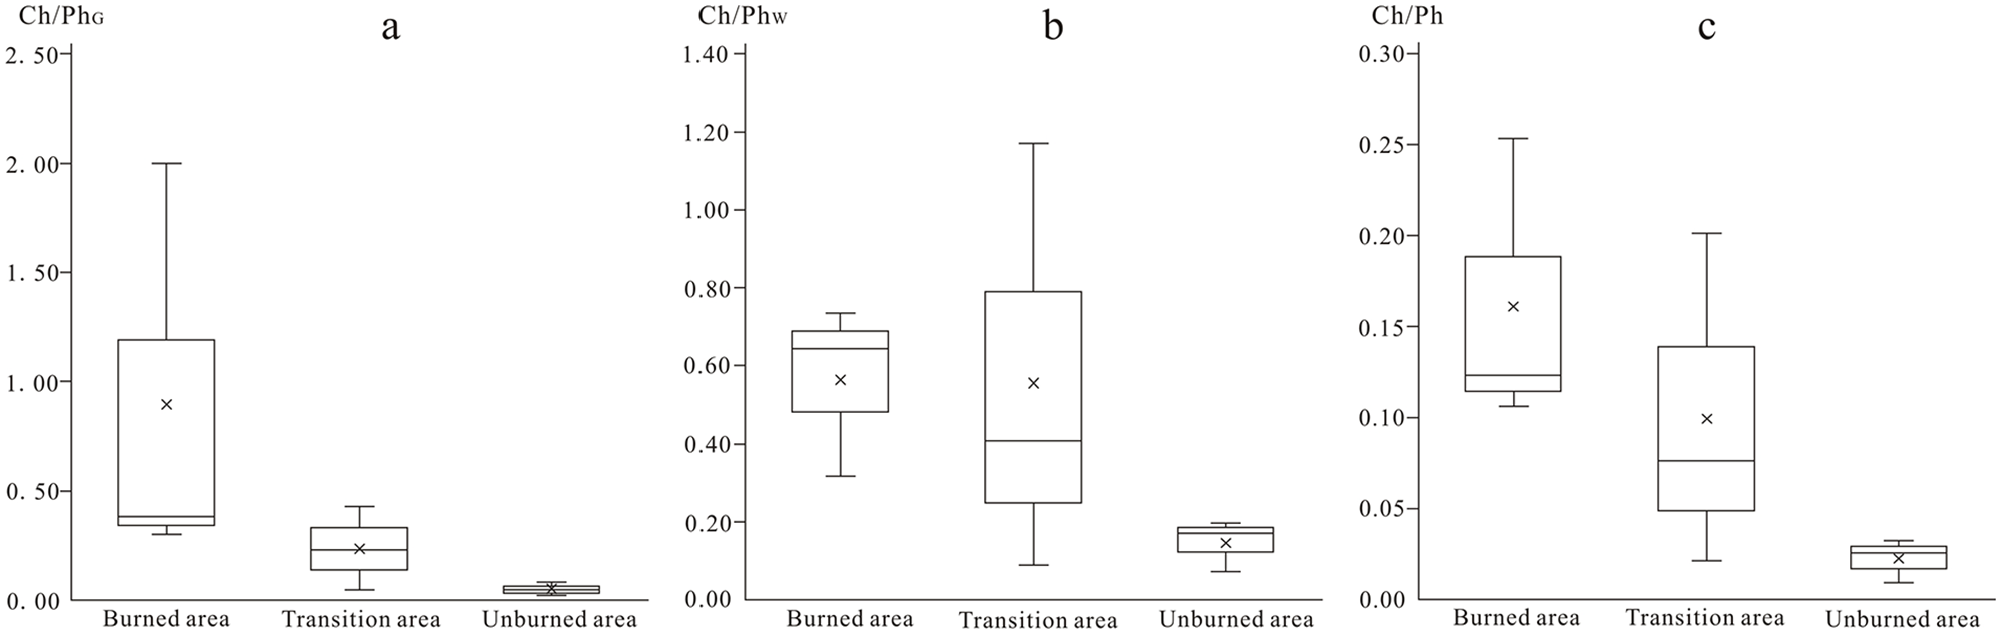
The box plots of Ch/PhG, Ch/PhW and Ch/Ph indices distinguishing from the burned, transitional For Peer Review and unburned area.
Discussion
Phytolith assemblages represent vegetation cover
Phytoliths in the topsoil are primarily derived from surface plants and can be used to characterize the plant community because of their in-situ deposition (Bremond et al., 2005; Dickau et al., 2013). Multifaceted blocky, blocky scrobiculate, blocky polyhedral and elongate (woody) phytoliths characteristic of coniferous plant dominate the assemblages in our study, which is consistent with phytolith assemblages of coniferous forest (Barboni et al., 1999; Hu et al., 2018; Piperno, 2006; Sase et al., 2001). The bilobate and oblong concave saddle phytoliths constitute a relatively high proportion of the GSSC, which is in agreement with the local Poaceae community dominated by Panicoidea and Bambusoidea.
Although the sampling locations are located in forest or adjacent to the edge of the forest, the percentages of GSSCs show larger values than those of the woody dicotyledon phytoliths. The Wd/P values of most samples are less than 1, with the exception of samples Bs1 and Bsd from the burned area (Table 2). Low Wd/P values (close to 0.4 (average = 0.8)) are supported by Li et al. (2019), who reported the Wd/P values of Qingshitan Lake surface sediment samples ranged from 0.05 to 0.69 responding to subtropical evergreen broad-leaved forest, and by Gao et al. (2018) who demonstrated the tree cover density ranged from 0.5 to 2.0 in Larix mixed forest in Northeast China. The low values of the Wd/P index in this study likely result from three factors: (1) The differential production rates of phytoliths by plants, which can produce a bias in the assemblages by over- or under-representation. The phytolith yield of herbaceous plants and monocotyledons is significantly higher than that of woody dicotyledon plants (Carnelli et al., 2001; Hyland et al., 2013; Li et al., 2019; Piperno, 2006; Tsartsidou et al., 2007). As is generally known, the phytoliths from some plant families are not diagnostic. Thus, a few grasses grown in a conifer forest might contribute a significant proportion of phytolith to the topsoil. (2) The exogenous grass phytoliths imported and deposited in the forest increase the proportion of grass phytoliths (Aleman et al., 2014; Li et al., 2010; Wallis, 2001). In particular, the short cells can be carried by wind and redeposited in nearby ecosystems. Furthermore, grass leaf cuticles imported probably contribute phytoliths to topsoil. (3) It is assumed that the grass and shrub vegetation might have grown in this area before. It is likely that the grass and shrub vegetation contributed phytoliths to the soil before the fire event. The fact that most forests in the study area are secondary forests supports this assumption. Thus, the low Wd/P ratios indicate that these values must be interpreted with caution or in conjunction with other data as absolute phytolith values/percentages are simply a representation of the percentages of vegetation cover. Palm trees are known to produce phytoliths abundantly (Pearsall, 2000; Piperno, 2006). The differential production rates of phytolith morphotypes can also be a useful means of interpreting high globular echinate proportions in subtropical soil phytolith assemblage (Li et al., 2019).
The Bs1 sample was collected from a steep slope zone dominated by C. lanceolata (Lamb.) Hook (Chinese fir). It would have caused heavy shade, inhibiting the growth of grass, and the steep slope would have increased erosion of surface soils, explaining why this sample had lower concentrations of phytoliths and higher Wd/P values.
Variability of charcoal content in surface samples responding to fire activity
There are differences in microcharcoal concentrations (percentages) in samples from burned plots, the transitional area and unburned plots. The difference between the unburned and the burned plots is obvious. The concentrations of microcharcoal show a decreasing trend with distance from the burned area, indicating the sources of charcoal input to topsoil in these areas are different. The source of charcoal is generally divided into two types: the in-situ deposition of charcoal and the inputs of wind and water transport (Cao et al., 2005; Luo et al., 2001). Thus, the variations of microcharcoal concentration are likely related to the charcoal production and transportation.
The burning of plants directly provides microcharcoal to the topsoil. Although microcharcoal particles can be transported by surface runoff, some microcharcoal particles were visible on the surface of soils in the burned area because we collected samples 2 years after the fire event. The abundant burned phytoliths were obtained from soil samples in the burned plots also indicate a local source. In addition, a number of factors may be expected to influence the amount and type of charcoal produced by fire. The vegetation type being burned influences the amount of charcoal produced (Patterson et al., 1987). However, the vegetation cover at our sampling sites were generally consistent except for sample Ts3, which was collected on the edge of forest and was characterized by grassland and Microstegium vimineum. The amount of microcharcoal in topsoils distinguished between burned, transitional and unburned area could not be attributed to vegetation cover.
In-situ deposition of microcharcoal caused the highest concentrations of microcharcoal to be found in the burned area. Aerial and fluvial transport is considered the most important transport modes of microcharcoal (Blackford, 2000; Clark, 1988; Conedera et al., 2009; Lebreton et al., 2018). Here, water has no effect on transport of microcharcoal particles from burned area to unburned area because burned area and unburned area belong to different isolated highlands, and the sample Ts1 was collected from upslope of the burned plots. Indeed, the unburned site is about 2–3 km away from the burned forest. Secondly, there were relatively less microcharcoal particles input to the unburned area, because the unburned area is located southeast of the burned area, and perpendicular to the prevailing northeast wind which carried charcoal particles. In addition, the low microcharcoal content in the unburned area samples can be explained by Andersen’s pollen distribution model (Andersen, 1974). Composed of pine and Chinese fir, the tree canopy is closed in the unburned area. It is therefore difficult for the charcoal in the air to penetrate through the canopy and be preserved in the soil. There are similarities between the microcharcoal concentrations in the burned area and the transitional area samples. High concentrations of microcharcoal in the sample Ts1 and Ts2 from transitional area were probably due to their proximity (Ts1) and downwind location (Ts2) of the burned area. Although Ts3 sample was also collected near the burned area, the thick grass (Microstegium vimineum) may have acted like a mat to prevent microcharcoal particles from penetrating into the soil, and thereby reducing the amount of microcharcoal in those samples. In addition, topography, soil texture and rainfall intensity might influence the deposition and preservation of microcharcoal and phytoliths in topsoil. The sample (Bs1) from the burned area had very low microcharcoal content as well as phytolith content, probably because the topsoil on this steep slope was eroded and carried away (Figure 1). This conclusion is supported by findings that microtopography can influence the deposition and preservation of microcharcoal in topsoils (Gavin et al., 2003).
Burned phytoliths are darkened by fire. Some researchers use this dark coloration as an indicator of fire (Cordova et al., 2011; Gu et al., 2008; Li et al., 2010, 2019). The abundance of burned grass phytoliths has been used as a proxy for fire incidence, and as a supplementary approach to the microscopic charcoal method (Cordova et al., 2011; Gu et al., 2008). Black vegetal structures are considered more conservative indicators of fire activities (Lindskoug and Marconetto, 2019). The concentration of black vegetal structures and burned phytolith varied with microcharcoal concentrations. There were strong correlations between the concentration of black vegetal structures, burned phytoliths and microcharcoal particles (Table 2; Figures 4 and 5a–c), suggesting these particles were subject to similar origin, deposition and transport processes. The principal component analysis (PCA) results show vegetal structures, burned phytoliths and microcharcoal indices have the same primary controls (Figure 4), indicating they were controlled by fire. Ch/PhG index was controlled by vegetation cover, and Ch/Ph and Ch/PhW indices were influenced by fire and vegetation (Figures 4 and 5). Burned phytoliths and black vegetal structures can serve as a supplementary approach to the microscopic charcoal method.
The content of microcharcoal with different sizes varied between the burned area, transitional area and unburned area in a way that is consistent with an airborne transport mechanism for the charcoal. It is assumed that the size of charcoal decreases with increasing transport distance (Clark, 1988; Lu et al., 2002; Sun et al., 2000), and charcoal particles might become smaller due to friction with the surrounding materials when the charcoal is transported by external force (Clark and Hussey, 1996). Meanwhile, the extraction of charcoal also could cause the charcoal to break into smaller pieces (Rhodes, 1998). However, since all samples were processed with the same methods, the data are not thought to be biased (Lebreton et al., 2018). Size irregularities can blur the size-dependent dispersal of charcoal (Vachula and Richter, 2018). The relative proportion of the larger size classes (50–120 μm) was lower than that of smaller size classes (15–50 μm) from burned area, transitional area to unburned area. This pattern is in accordance with Clark’s size dispersal model suggesting that smaller particles are more easily transported by the air, whereas larger particles are preferentially deposited (Blackford, 2000; Clark, 1988). The higher percentages of small particles found in samples further from the burned areas are probably due to the lack of production of in situ larger fragments.
The ratio of microcharcoal to phytolith particles distinguishes between burned and unburned area
The Ch/Ph (Ch/PhG and Ch/PhW) values are different between the burned, transitional and unburned areas. These Ch/Ph ratios were larger in the burned area, and in general, gradually decreased from the burned area to the transitional area and the unburned area. All of these indices can certainly distinguish between the burned and unburned area (Figure 6). The Ch/Ph and Ch/PhW values are mainly controlled by the amount of microcharcoal in a sample because these two indices show no obvious correlations with their corresponding phytolith concentrations, but a moderate positive correlation with microcharcoal concentrations/percentages, suggesting these two indices could respond to fire activity. However, the Ch/Phw index is unable to distinguish the transitional area from burned and unburned areas because of the dramatic changes rate of the percentage of woody dicotyledon (Figure 6b). The Ch/PhG values show negative correlation with grass phytolith concentration (R2 = 0.35), and no correlation with microcharcoal concentration (R2 = 0.00). There is a strong positive correlation (R2 = 0.91) between the Ch/PhG and Wd/P values (Figure 5e). This result shows the Ch/PhG values are mainly influenced by vegetation cover (Figure 4). Although the relationships between fire activity, vegetable types burned and these indices need to be further investigated by examining more soil samples from various vegetation types burned, compared with these three indices in this study, the Ch/PhG and Ch/PhW indices are excessively influenced by vegetation cover, and do not objectively reflect the fire activity. The Ch/Ph index are better than Ch/PhG and Ch/PhW indices in overcoming the bias from vegetation cover, because all phytolith type members of soils are able to reliably represent vegetation cover and have universal significance.
The Ch/Ph index is a promising proxy to discern the burned and unburned area. This result perhaps reflects that soil samples were collected from a similar coniferous forest, and so their phytolith concentration did not show significant differences. As a specific example, the Bs2, Ts2, and Us1 samples collected from burned area, transitional area and unburned area, respectively, have approximately the same phytolith concentrations, but show a decreasing trend of Ch/Ph values because of their varying microcharcoal concentrations. Thus, the variation of microcharcoal concentration determined the Ch/Ph values of samples from different areas of fire activity.
However, the Bs1 sample from the burned area has low microcharcoal concentration but larger Ch/Ph value. This result indicates that the microcharcoal concentration index could bias the paleofire interpretations, and that the Ch/Ph index could overcome the influence of accumulation and deposition rate. This is consistent with thinking that the ratio of charcoal to pollen should eliminate false peaks as pollen should be redeposited along with charcoal (Ballard et al., 2017; Swain, 1973). In addition, phytolith particles are resistant to fire (Wang and Lu, 1993). This makes the Ch/Ph a promising alternative indicator for wildfire reconstruction.
The positive correlation relationships (R2 = 0.50) between values of Ch/Ph and Wd/P indicate that the Ch/Ph index is influenced not only by fire events but also by the vegetation types burned. Although all samples were collected from coniferous forest, the different Wd/P values correctly demonstrate the microhabitats in which each sample was obtained have different vegetation compositions. Poaceae species commonly have a higher phytolith and a lower microcharcoal production rates than woody plants (Fredlund and Tieszen, 1994; Umbanhowar and Mcgrath, 1998). Combustion simulation experiments on modern herbs and woody plant leaves show that woody plants have higher Ch/Ph and microcharcoal production rates than grass plants (Li et al., 2019; Umbanhowar and Mcgrath, 1998). With the high density of woody plants, this area may have a higher Ch/Ph. Thus, the combination of Ch/Ph and Wd/P could provide a means to estimate the vegetation type burned.
Implications for charcoal investigations based on phytolith samples
In this study, percentages of each charcoal size-class (15–50 μm and 50–120 μm) were useful in distinguishing between burned and unburned areas, which could also be useful in assessing the efficacy of the extraction methodology of phytoliths. Some researchers have shown that processing methods and quantification techniques have a strong influence on the absolute amount of charcoal obtained from sediment samples (Carcaillet et al., 2001; Power et al., 2010). Because we used the same extraction process for all samples, our data suggest the microcharcoal particles >15 μm from phytolith slides are meaningful for investigating fire activities.
The Ch/Ph ratio is a potentially useful index for investigating fire activity and reconstructing past fire activity. This is consistent with previous work quantifying microcharcoal with phytolith analysis (Cordova et al., 2011; Gu et al., 2008; Li et al., 2010). Furthermore, the Ch/Ph index could potentially eliminate the influence of deposition rate on the concentration of microcharcoal because the phytolith and microcharcoal particles could deposit together and combine to indicate fire activity. In addition, the combination of Ch/Ph and Wd/P might be a useful means to reconstruct the burned vegetation type. Across a gradient of an area burned of grass and woody tree cover, the Ch/Ph should be different. The Ch/Ph variations in soil and sediment profiles probably provide a way to identify shifts in the forest-grassland border and estimate the coevolution of fire activity and vegetation cover.
Finally, the production of microcharcoal can be complicated because of fire frequency, intensity, fuel type (Li et al., 2010; Umbanhowar and Mcgrath, 1998; Whitlock and Larsen, 2002). The abundance of microcharcoal and phytolith in soils and sediments are influenced by transport biases and taphonomic effects (Higuera et al., 2007; Vachula and Richter, 2018). Thus, it is necessary to further study how these factors affect the Ch/Ph values, and especially to understand the differences of Ch/Ph values between grasslands and forests.
Conclusion
(1) High proportions of multifaceted blocky, blocky scrobiculate, blocky polyhedral and elongate phytoliths in topsoils are characteristic of coniferous forest vegetation. The low Wd/P values of soil samples from a subtropical forest in Southwest China were related to grasses having higher phytolith production rates than woody plants, and exogenous grass phytoliths imported to forest ecosystems.
(2) The concentrations of microcharcoal, black vegetal structures and burned phytoliths from topsoils consistently decreased with increasing distance from the burned area.
(3) The Ch/Ph values distinguished between burned and unburned area indicate the occurrence of fire. The positive correlation between the Ch/Ph and Wd/P values suggests the Ch/Ph could be influenced by vegetation type burned. The Ch/Ph index might be used as an alternative indicator for studying ancient fires. The combination of Ch/Ph and Wd/P could be used to estimate fuel types.
Footnotes
Funding
The author(s) disclosed receipt of the following financial support for the research, authorship, and/or publication of this article: The work is supported by grants from the National Natural Science Foundation of China (Grant Nos. 41867058) and the Natural Science Foundation of Guangxi Province, China (Grant No.2016GXNSFAA380114).