
Abstract
The Central Ganga Basin is one of the most densely populated regions of India. It is agriculturally diverse and contributes much to the Indian economy. The region has housed numerous ancient and mediaeval empires. This study presents a continuous record of the paleomonsoon from the Chandrika Devi lake, Lucknow district of Uttar Pradesh, India which is linked with paleo vegetational shifts over the last ~6000 years (5871–75 cal yr BP). The chronology of the lake core is based on three accelerated mass spectrometry (AMS) radiocarbon and two Optically Stimulated Luminescence (OSL) dates. The multiproxy data (grain size, major and trace element ratio, total organic carbon (TOC wt%), carbon isotopes (δ13Corg‰) and pollen), suggest that the lake was initially a part of the Gomti river that began to transform into a lake at ~5000 cal yr BP with weakening of the Indian summer monsoon (ISM) in the Central Ganga Basin. The lake formation was completed at ~4100 cal yr BP under the influence of the 4.2 ka arid event. This phase marks the beginning of human presence as well as agricultural activities in the lake region with the appearance of Cerealia pollen and other agricultural taxa. The agricultural activity surrounding the lake catchment peaked at ~3000 cal yr BP. The lake gradually shrank and became a marshy lowland at ~75 cal yr BP. Our study is significant because it is the first comprehensive multiproxy study from the Lucknow region in the Central Ganga Basin on paleomonsoonal variability and its relationship to human activity, agricultural practices during the Late-Holocene with a focus on the 4.2 Ka arid event. Also, pollen record suggests that the changes in agriculture and human activity began just after 4.2 ka arid event in the study area.
Introduction
The Holocene is anthropogenically significant interval in the history of Earth as numerous large- and small-scale centennial to millennial scale climatic events have been reported across the globe. These climatic events shaped the course of human history in various parts of the world. The millennial scale changes in the Northern Hemisphere called Bond events (Bond et al., 2001) as well as 8.2 and 4.2 ka events may have had pronounced effects on global climate and human societies, especially in the Northern Hemisphere (Berkelhammer et al., 2012; Dutt et al., 2018). The 4.2 ka event marks a major arid phase in southern Asia and has also been recorded from other parts of the tropics (Berkelhammer et al., 2012; Dutt et al., 2018).
The Indian summer monsoon (ISM) can be described as the seasonal reversal of winds driven by the land-sea thermal contrast and migration of the Inter Tropical Convergence Zone (ITCZ) (Gadgil, 2003) in the Indian Ocean region. The ISM is a complex atmospheric phenomenon that is dependent on insolation, wind pattern, ocean currents as well as orography of the Indian landmass (Gupta et al., 2005, 2015). In recent times, phenomena such as the El Niño–Southern Oscillation (ENSO) and the Indian Ocean Dipole (IOD) have been implicated as important drivers for ISM variability (Ashok et al., 2001, 2004; Prasad et al., 2014). ISM variability in the past has been primarily recorded from marine cores, yielding long records from the Arabian Sea and the Indian Ocean (Anderson et al., 2002; Gupta et al., 2003, 2004, 2005; Overpeck et al., 1996). In recent years, however, the terrestrial archives such as lake sediments and cave stalagmites from different parts of India have also been used to generate high resolution records to complement marine records of monsoon variability (Berkelhammer et al., 2012; Dutt et al., 2018; Singh et al., 2020). Major shifts in the ISM during the middle to Late-Holocene have been reported from different parts of the Indian subcontinent including the northeastern Himalaya, Central India, Western Himalaya, Central Ganga Basin and southern India. During the Middle Holocene Climatic Optimum (MCO) (7000–5000 cal yr BP) the increased monsoonal wind intensity and surging of Himalayan rivers suggest a strong ISM (Bryson and Swain, 1981; Gupta et al., 2005; Kale, 2007). This is followed by weakening of the ISM and beginning of aridity ~5000 cal yr BP (Gupta et al., 2003, 2005; Singh et al., 2022; Staubwasser et al., 2003) that culminated with the 4.2 ka event across the Indian subcontinent. The 4.2 ka aridity event changed the course of human civilisations in Asia and impacted human populations including the Indus and Mesopotamian (Akkadian empire) societies (Drysdale et al., 2006; Dutt et al., 2018, 2019). This arid phase resulted in human displacement, the rise and fall of numerous dynasties, changes in agricultural practices and land-use patterns, and socioeconomic growth across the Indian subcontinent (Gupta et al., 2006). Numerous short-term shifts are also noted in the ISM history including the Medieval Climate Anomaly (MCA), Little Ice Age (LIA) and the Current Warm Period (CWP) (Bradley and Jonest, 1993; Mann et al., 2008).
The Central Ganga Basin is one of the densely populated regions of India. The region is drained by numerous rivers (Ganga, Yamuna, Son, Sai, Gomti, Ghagghra) that have left a complex network of lakes in the form of oxbows, meander scars, paleochannels and ponds. Many of these lakes have been explored (Chauhan et al., 2015; Misra et al., 2019, 2020; Saxena and Singh, 2017; Singh et al., 2015; Tripathi et al., 2017) to decipher paleomonsoon variability, changes in paleo vegetation and land use pattern as well as agricultural practices in the region in the last few decades or centuries (Figure 1a). The majority of these lakes are oxbow lakes that are formed from rivers due to tectonic activity and climate change (Singh, 1996).
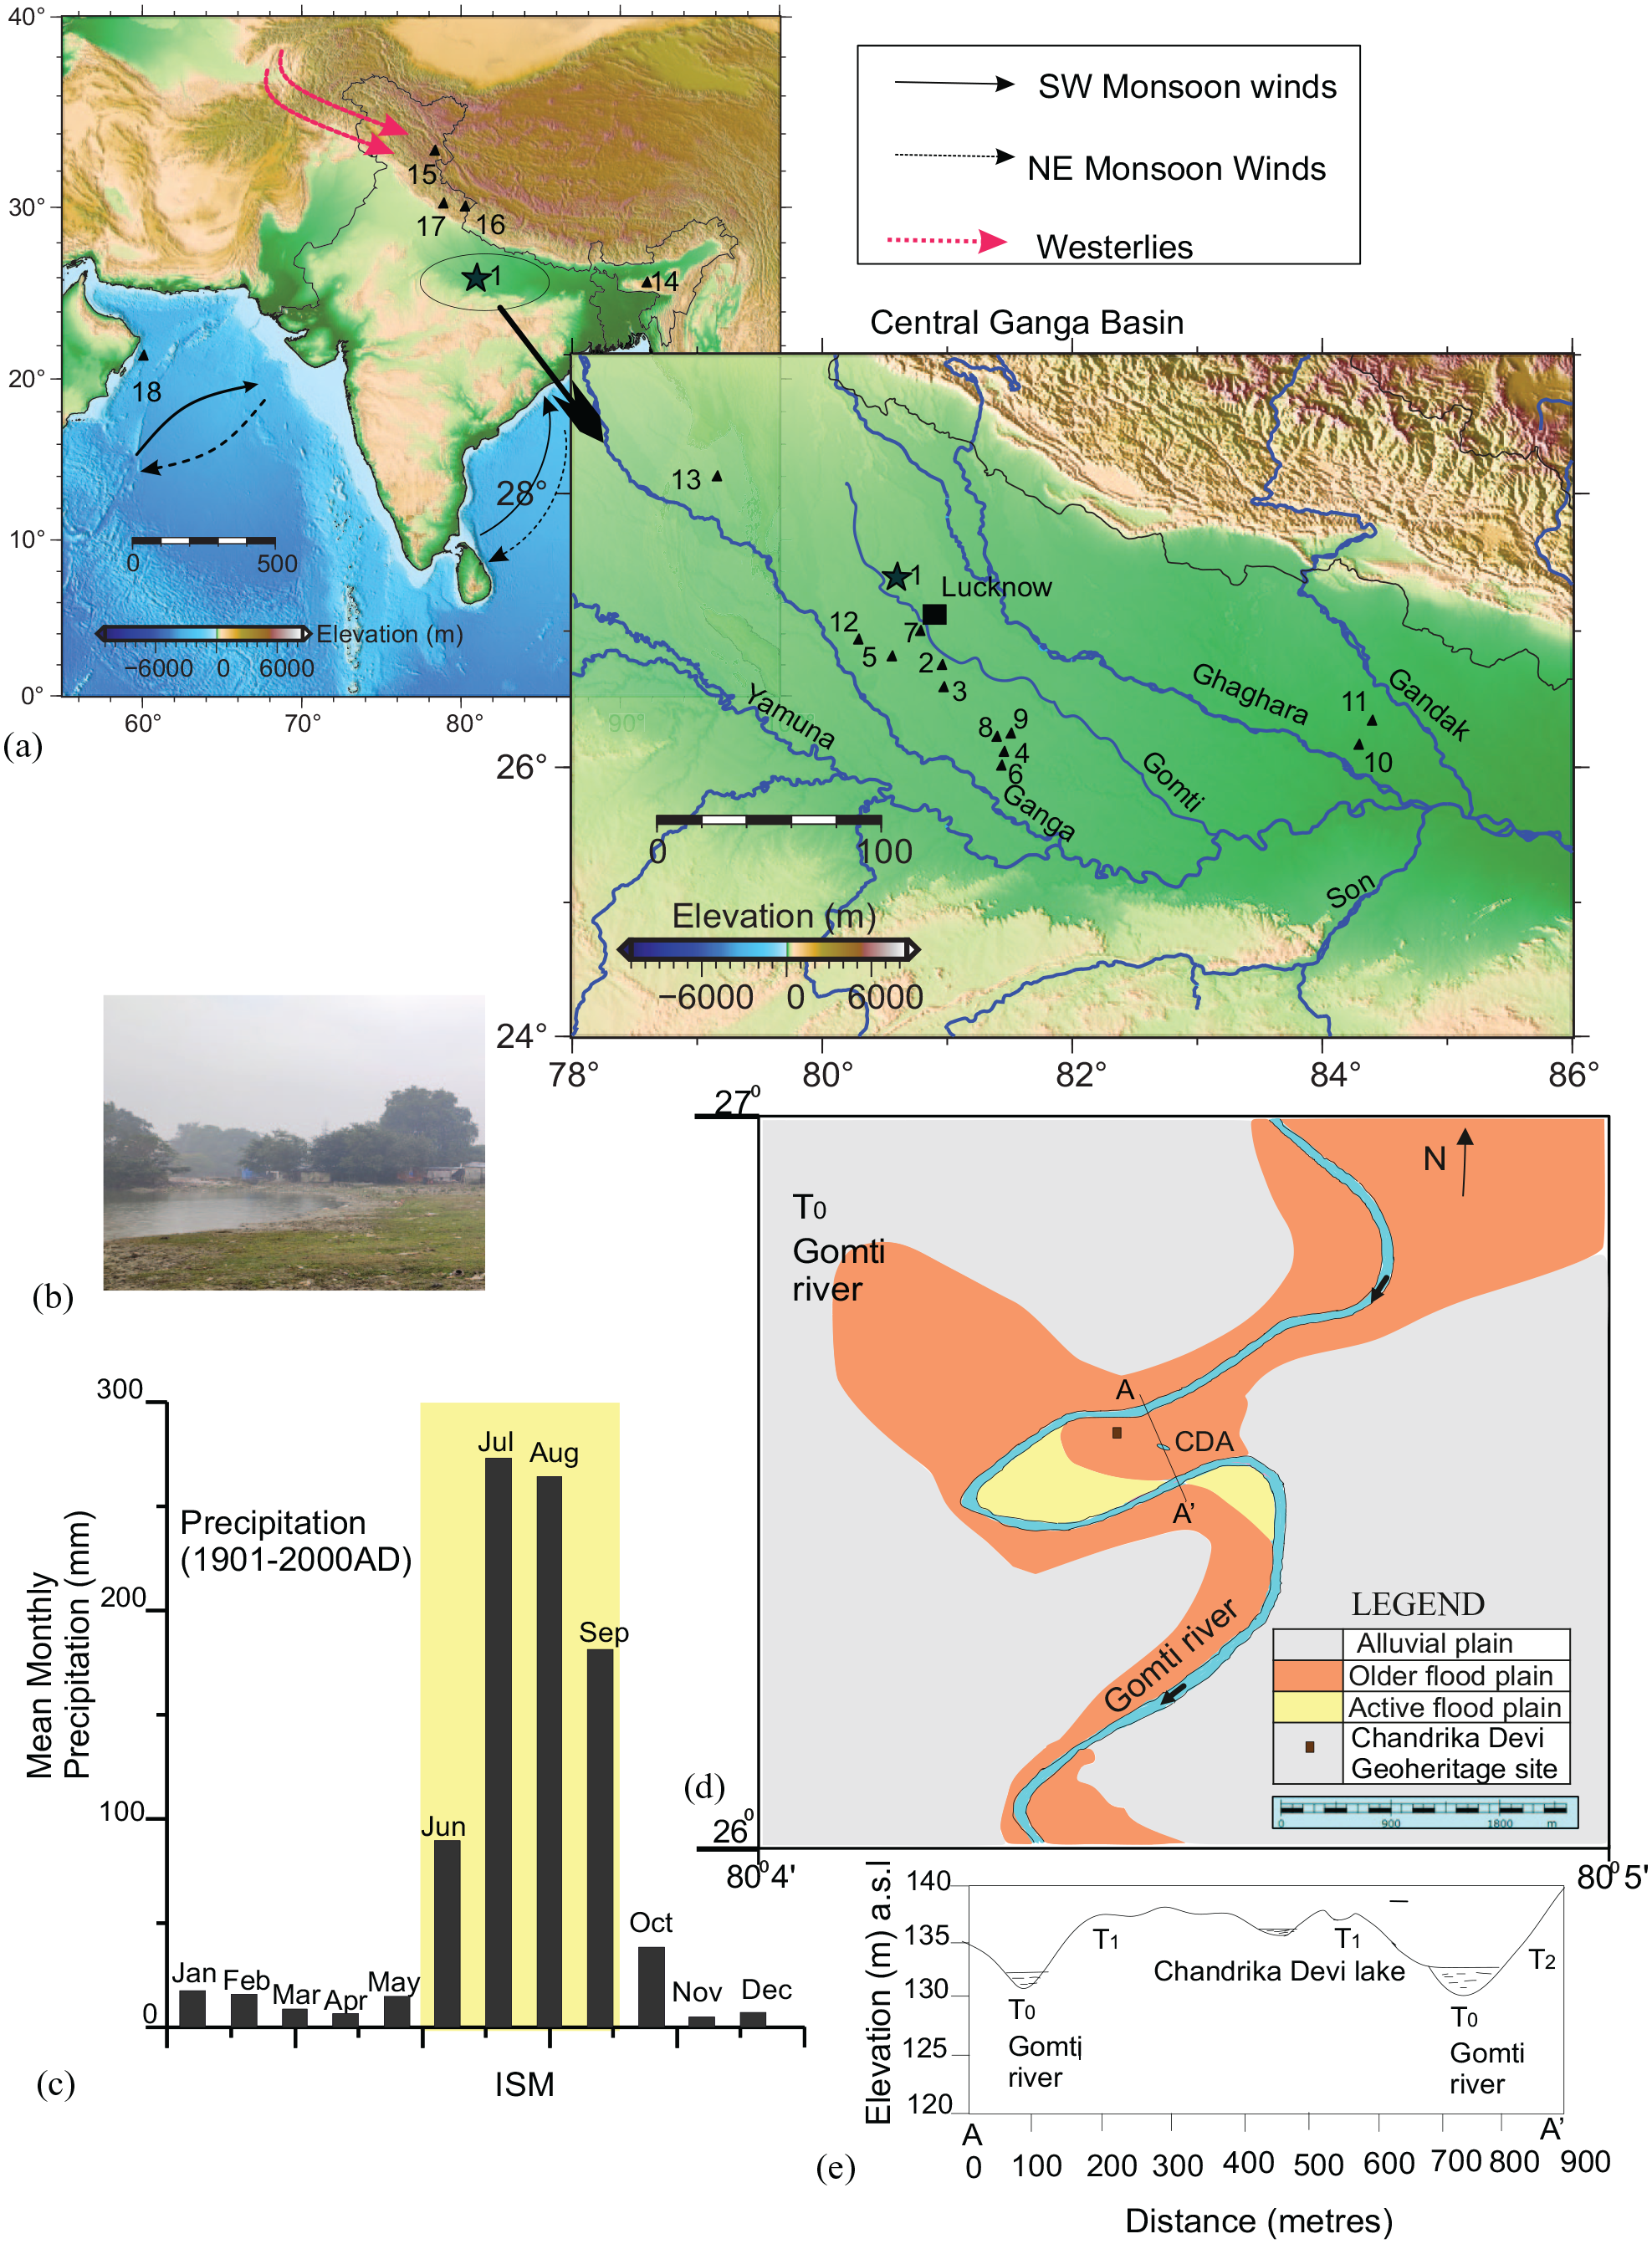
(a) Map of the Indian subcontinent with the study site location and the dominant wind pattern, along with a map of Central Ganga Basin with major rivers showing the study site location along with the neighbouring city Lucknow. The location of other proxy sites including (1) Chandrika Devi lake, (2) Karela Jheel, (3) Sanai Taal, (4) Lashoda Taal, (5) Jalesar lake, (6) Bairala Taal, (7) Misa Taal, (8) Chaudhury Ka Tal, (9) Kikar Taal, (10) Ropan Chhapra Taal, (11) Nikhari Taal, (12) Nawabganj lake, (13) Lilaur lake, (14) Mawnluh Cave, Meghalaya (15) Tso Moriri lake, Ladakh (16) Dharamjali cave, Uttarakhand, (17) Bednikund lake, Uttarakhand, (18) ODP Hole 723A, Oman Margin (b) Chandrika Devi lake, (c) The mean monthly precipitation in the Lucknow district from 1901 to 2000 AD extracted online from Climatic research Unit (https://crudata.uea.ac.uk/cru/data/hrg/cru_ts_4.06/cruts.2205201912.v4.06/), (d) The location of Chandrika Devi lake and trench site CDA (https://bhukosh.gsi.gov.in/Bhukosh/MapViewer.aspx) with a cross section AA’ And (e) Cross section along AA′. T0 – active flood plain, T1 – River valley terrace, T2 – Upland region.
Based on palynological, sedimentological and geomorphic evidences, it is inferred that the lake formations all over the Central Ganga Basin took place in phases due to climate change and tectonic activities. Though the presence of a lacustrine system is reported at 42,000 cal yr BP and 22,000 cal yr BP from Jalesar lake and Lashoda Tal (Trivedi et al., 2019), some of these lakes like Karela Jheel, Sanai Tal and Bairala Tal were formed during 15,000-12,000 cal yr BP (Chauhan et al., 2015; Misra et al., 2020; Saxena et al., 2011; Sharma et al., 2004a; Tripathi et al., 2017) due to geomorphic changes. But majority of these large linear lakes were formed during 8000–6000 cal yr BP due to major tectonic activities (Singh, 1996, 2005; Srivastava et al., 2003a). Misa Tal, Sanai Tal, Chaudhury Ka Taal, Kikar Tal are few such examples having tectonic linkages (Saxena et al., 2011, 2015; Saxena and Trivedi, 2017; Wasson et al., 2013). While others like Nikhari Tal and Ropan Chapra Tal were formed 2000 cal yr BP due to changes in the precipitation pattern (Saxena et al., 2011; Saxena and Singh, 2017; Singh et al., 2015; Figure 1a). The majority of these lakes have been studied using pollen proxies whereas others have used other biotic and abiotic proxies like phytoliths, diatoms, grain size, magnetic susceptibility, etc to understand shifts in climate due to changes in vegetation pattern. These studies have largely reported that higher precipitation events during the MCO followed by a considerable shift towards an arid phase due to weakening of the ISM in the Late-Holocene, followed by a weak monsoon phase ~3400–2300 cal yr BP (Thakur et al., 2018). This is further corroborated from mammalian teeth enamel study from geoarcheological sites of Central Ganga Basin (Sharma et al., 2004b). However, there are few lakes that have been formed due to an arid climate phase in the Ganga Basin following the 4.2 ka arid event. The Nawabganj and Lilaur lakes of Uttar Pradesh are such examples (Farooqui et al., 2023; Singh et al., 2022). The multi proxy studies from Nawabganj and Lilaur lakes have produced high resolution data of ISM variability during the Late-Holocene and its impact on agricultural practices as well as human lives (Farooqui et al., 2023; Singh et al., 2020). The 4.2 ka arid event is reported from the marine records, lakes and spelaeothems found in the Indian subcontinent. Studies from foraminifera records of Globigerinoides ruber near the Oman margin, the spelaeothem record of Mawmluh cave in northeastern Himalaya, Dharamjali Cave in North West Himalaya, Tso Moriri lake in Ladakh, Lilaur lake and Nawabganj lake in Central Ganga Basin have recorded this event with a weak ISM. (Berkelhammer et al., 2012; Dutt et al., 2018; Farooqui et al., 2023; Kotlia et al., 2018; Singh et al., 2022; Staubwasser et al., 2003) (Figure 1a). The 4.2 Ka event is often linked with the collapse of Early Bronze Age civilisations from the Aegean to the Indus Valley (Cullen et al., 2000; Drysdale et al., 2006; Dutt et al., 2018; Staubwasser et al., 2003) However, very few studies have been carried out in the Central Ganga Basin pertaining to the influence of 4.2 ka event on the ISM and human societies. Our study has attempted to bridge this gap of climate-human linkages in the Central Ganga Basin.
The presence of human habitation in the Ganga Basin has been reported since the Pleistocene (Singh, 2005). Palaeolithic, mesolithic sites and artefacts have been recovered throughout the Ganga Basin. The phytolith and pollen records from Karela Jheel and Lahuradewa lake (Chauhan et al., 2015; Thakur et al., 2018) have shown the appearance of Cerealia pollen between 9000 and 7500 cal yr BP in the region. Various archaeological sites have been recovered from the Central Ganga Basin that show different cultural strata for the last 3500 years. They are as follows: (i) Late Harrapan Culture (3900–3000 cal yr BP), (ii) Black Ware and Red Ware Culture (3700–3000 cal yr BP) along with Ochre Colour (OCP) pottery (iii) Pre Northern Black Painted Ware (3000–2700 cal yr BP), (iv) Northern Black Painted Ware (NBPW) (2700–2000 cal yr BP), (v) Kushan period (2000–1700 cal yr BP), (vi) Gupta period (1700–1400 cal yr BP), (vii) Post Gupta period (1400–1200 cal yr BP) and (viii) Rajput period (1200–800 cal yr BP) (Dutt et al., 2019; Singh, 2005; Sontakke and Sontakke, 2013). The archaeological sites in and around Lucknow, like Hulas khera have shown the existence of humans based on pottery at ~3000 cal yr BP.
The Central Ganga Basin has numerous abandoned paleochannels which were transformed into lakes after being cut off from the parent river. These lakes act as a sediment sink from the surrounding catchment through rill and sheet erosion during the monsoon season. The grain size proxy is used to understand the energy conditions of the lake (Kumar et al., 1995; Singh, 1996). The monsoon precipitation plays an important role in bringing coarse sediments into the lake basin during high energy conditions while finer fractions are deposited in the low energy conditions. The major and trace element ratios are used to understand detrital influx to the lake and the weathering (chemical and physical) history the surrounding catchment (Dutt et al., 2018). The TOC and δ13Corg‰ infers to the organic matter of the lake and surroundings (Meyers and Ishiwatari, 1993; Singh et al., 2022), while pollen proxy, charcoal provides information about vegetation of the lake and the catchment along with agricultural and land use pattern changes from the surroundings (Pandey et al., 2014). As ISM is a dominant factor in controlling these proxies, a combination of all the above-mentioned proxies can be used to understand paleomonsoon variability and its impact on the surrounding population. The Lucknow region has a rich cultural history but little is known about human habitation in the region since the ancient times. This study contributes to the understanding of monsoon control on human societies.
Study area
The Central Ganga Basin lies between Aravalli Delhi Ridge in the west to the Raj Mahal traps in the east, Himalayan foothills in the north and Bundelkhand Craton in the south (Singh, 1996). It is a neo-tectonically active peripheral foreland basin characterised by river channel deposits, muddy over bank deposits, crevasses splays, flood plains, meander scars, paleochannels, point bars, and oxbow lakes (Singh et al., 1999). The region receives moderate to heavy rainfall (85%) under the influence of the ISM (Parthasarathy et al., 1987). The major rivers draining this highly fertile region are Ganga, Yamuna, Gandak, Kosi, Rapti, Baghmati, Gomti, Son, (Jain and Sinha, 2003). Most of these rivers like Ganga and Yamuna start their journey from glaciers in the Himalaya whereas others like Gomti depends on groundwater and monsoon for the flow (Tangri et al., 2018). Numerous varieties of crops (both food and cash) like wheat, paddy, pulses, sugarcane, jute, etc. are grown throughout this region (Aggarwal et al., 2004).
The Chandrika Devi lake (N27.01999°/E80.83293°) is a small shallow, seasonal lake located on the T1 river terrace of the Gomti river about 28 km from the Lucknow City in the Central Ganga Basin (Figure 1a ) (Singh, 1996; Tangri et al., 2018). The Gomti river terrace is 5–10 m higher than its active flood plain (Kumar et al., 1995) and is not breached by the floods. It has numerous paleochannels and meander scars. The Chandrika Devi lake is an abandoned paleochannel of the Gomti river that transformed into lake. The geoarchaeological site of *Chandrika Devi dham (sacred to the Hindus) is located nearby. It has a small water body named mahi sagar tirth beside it (Figure 1d). Festivals are held on the eve of new moon and Navratri. The present area of the lake is 1190 m2 with a water depth of 1–2 m. The River Gomti has a sluggish and low flow (2–5 m3/s) throughout the year, except during the monsoon (500–900 m3/s) (Siddique et al., 2017; Tangri et al., 2018). A cross section AA′ across Gomti is taken to understand the geomorphologic surfaces (Figure 1e). The study area experiences a humid subtropical climate (Tangri et al., 2018) characterised by three distinct seasons, summer season (March-June) with minimum and maximum temperature range from 27°C to 45°C, monsoon season (July–September) with moderate to heavy rainfall (1200–1600 mm), average of about 1300 mm, and winter season (November–February) with a minimum and maximum temperature range from 6°C to 21°C (Singh et al., 2015). Thus the lake receives water and sediment load from the catchment during the monsoon through sheet and rill flows. These types of small water bodies (tals) are reported by Srivastava et al. (2003a, 2003b) that occur along a linear depression in clusters that were a part of meander belt, or paleochannel of rivers with an area of <0.05 km2 and act as local sink for sediments. They account for about 79% of waterbodies of Ghaghara- Ganga interfluve. These shallow seasonal lakes are very sensitive to changes in the precipitation versus evaporation ratio (Sharma et al., 2004b).
The modern-day vegetation located near the lake mainly consists of Mangifera indica (Mango), Azadirachta indica (Neem), Tectona grandis (Teak), Holoptelea integrifolia (Indian elm), Syzygium cumini (Jamun), Terminalia arjuna (Arjun), Milettia pinnata (Karanja), Ziziphus mauritiana (Indian jujube) and Dalbergia sissoo (Indian rosewood). Mustard farming takes place during winter and paddy farming during summer on the other bank of the Gomti river. The major grasses belong to the Poaceae type.
Methodology
Sample collection
The fieldwork was carried out in January 2020 in the Chandrika Devi lake where samples were collected from a 1.14 m deep trench CDA, at an interval of 2 cm each, obtaining 58 samples (Figures 1c and 2c).
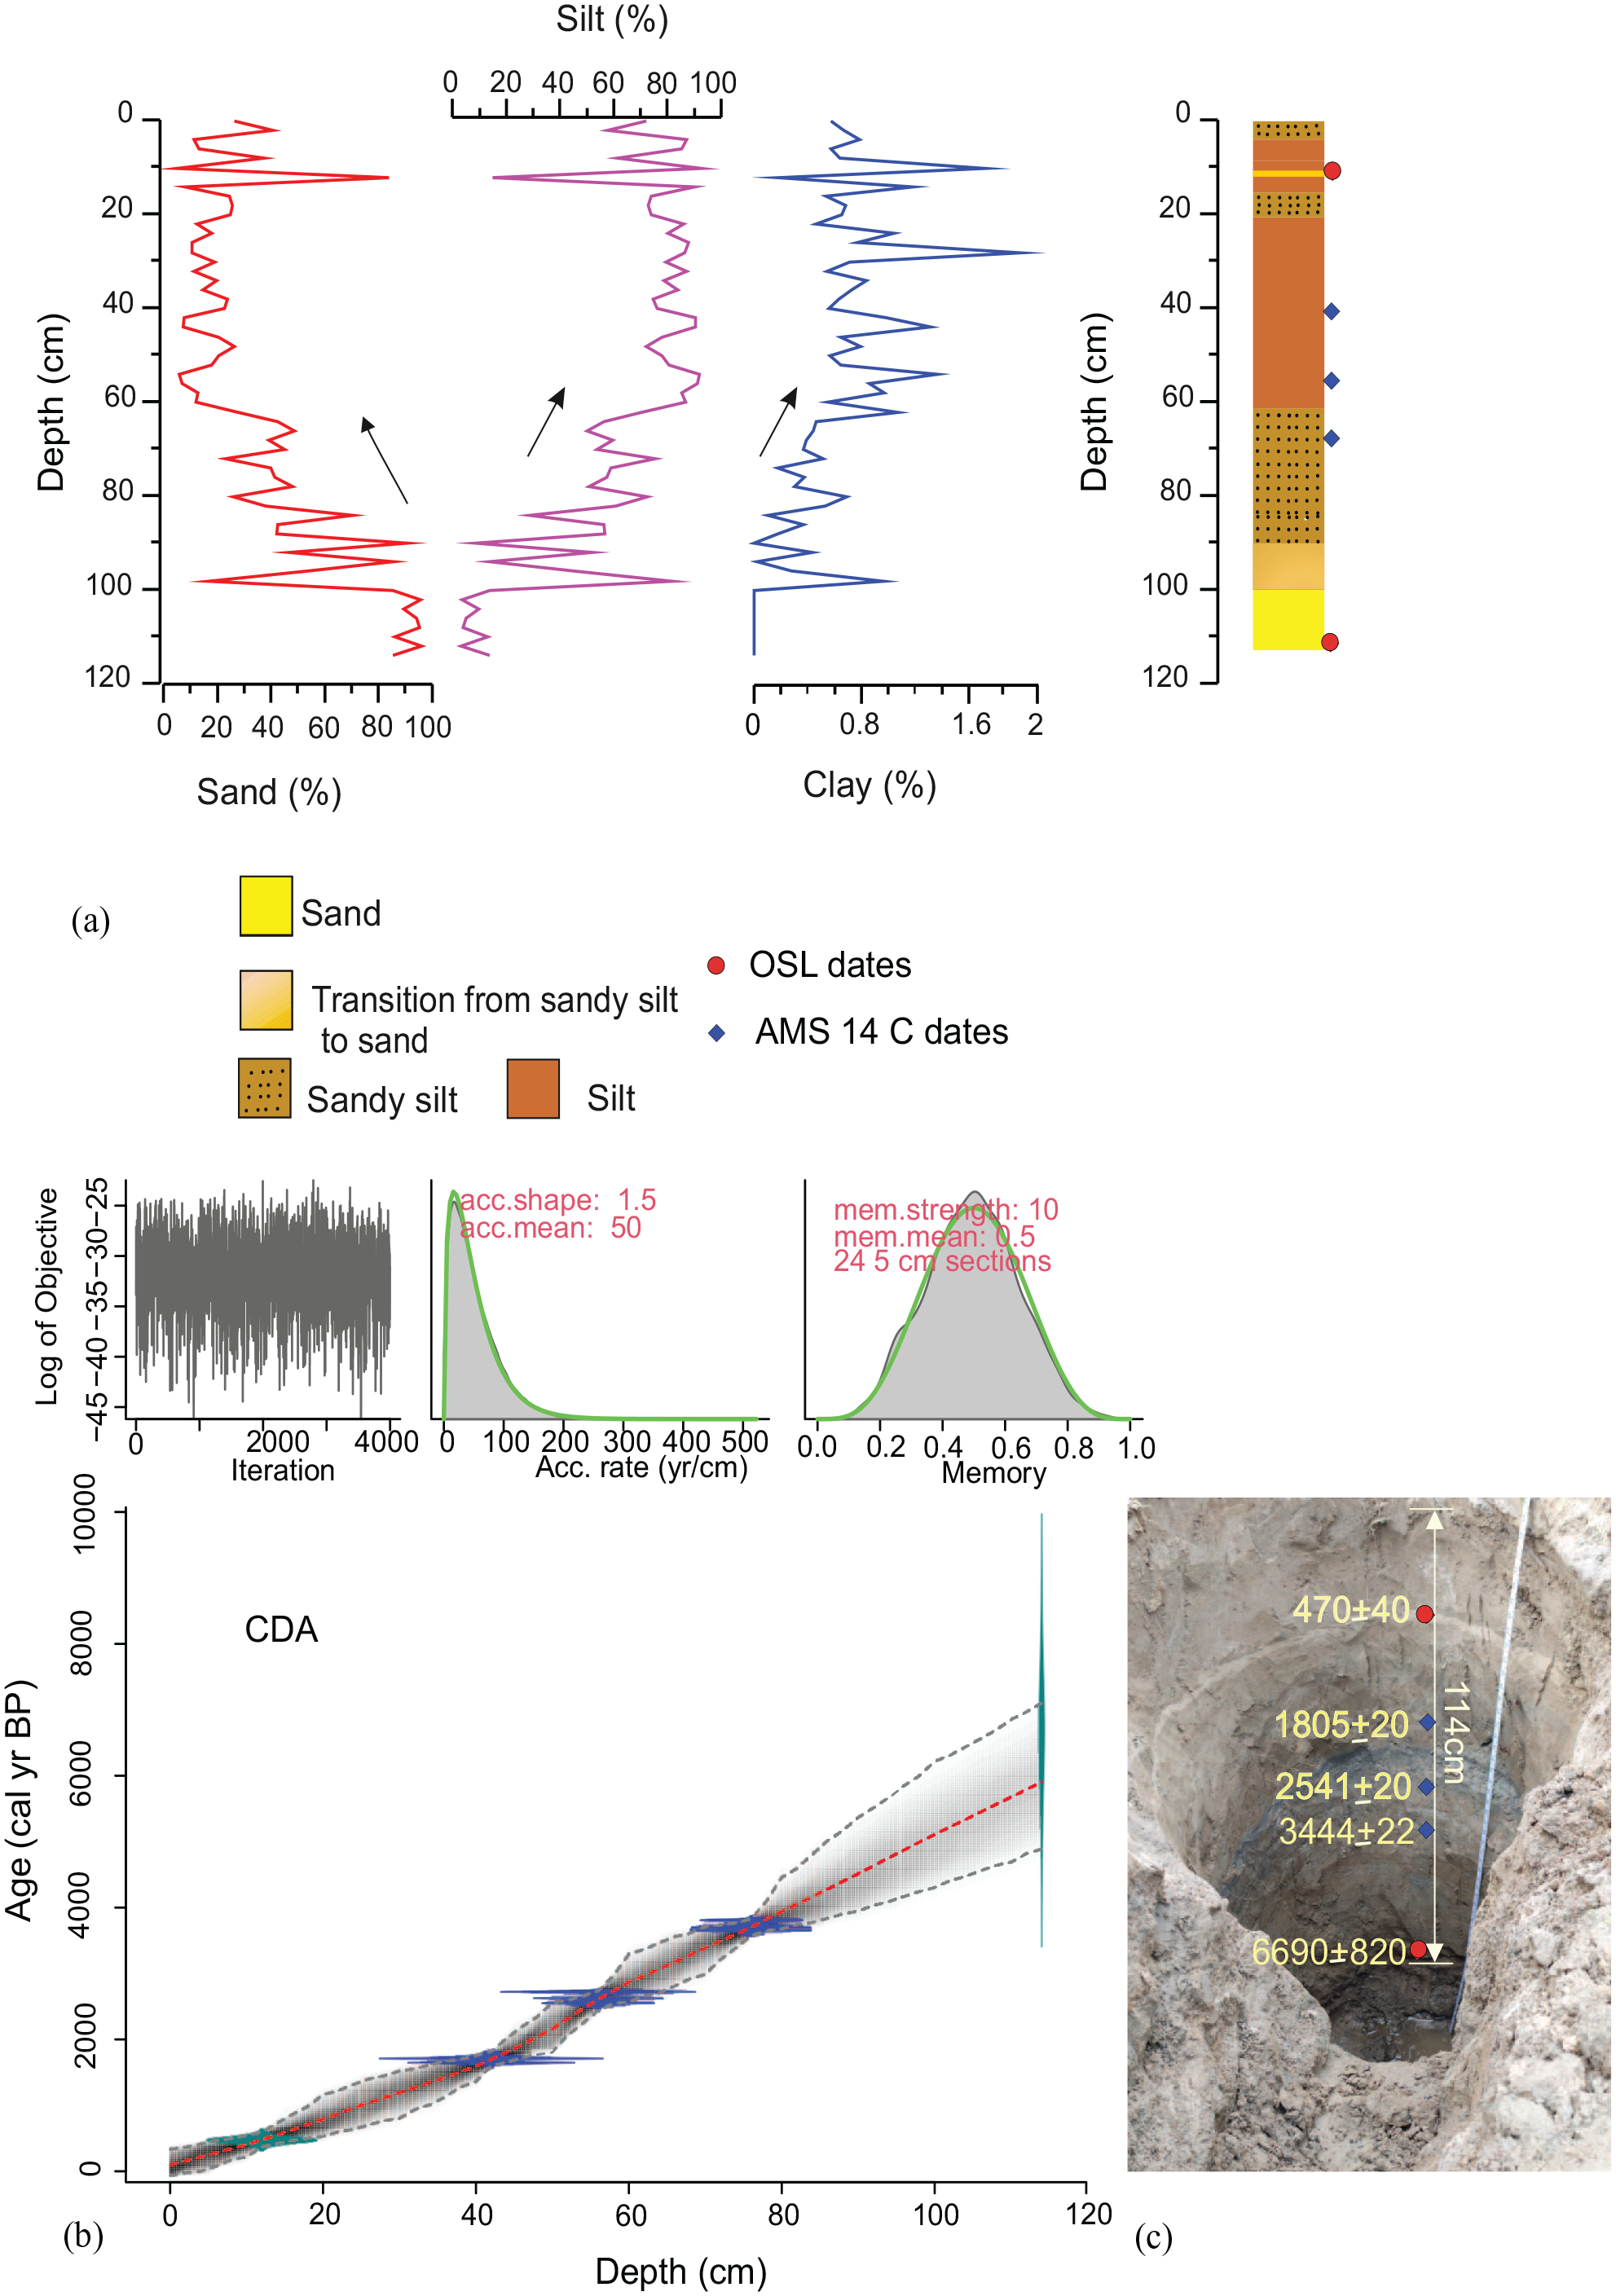
(a) The lithology of trench CDA based on grain size and the depth from which AMS 14C and OSL dates are taken. (b) The age depth model of CDA using three AMS 14C dates and two OSL dates using the R script (version 4.2.2) R Bacon (Bayesian statistics) applying IntCal 20 calibration curve on radiocarbon dates. The calibrated ages and the age-depth model (darker greys indicate calendar ages; grey stippled lines show 95% confidence intervals; red curve shows a single ‘best’ model based on the mean age for each depth). (c) The trench profile of CDA.
Chronology
The chronology of trench CDA was determined by a combination of three Accelerator Mass Spectroscopy (AMS) 14C dates and two Optically Stimulated Luminescence (OSL) dates (Table 1). What was the rationale for example, was there little carbon for the top and bottom date which prevented 14C being used ?The AMS 14C dates were obtained at the Inter-University Accelerator Centre (IUAC), New Delhi using bulk organic matter, the AMS radiocarbon samples were pre-processed using the Acid-Base-Acid method in the Graphitization Laboratory at IUAC, New Delhi (Kumar et al., 2022; Sharma et al., 2019). The AMS 14C dates were run in ‘R’ software (Version 4.2.2 (2022-10-31)) and calibrated using Bacon R (Version 3.0.0) using the INTCAL20 calibration curve (Reimer et al., 2020; Stuiver and Reimer, 1993).
AMS 14C age and OSL ages of the sediment samples from Chandrika Taal, Lucknow, Uttar Pradesh.
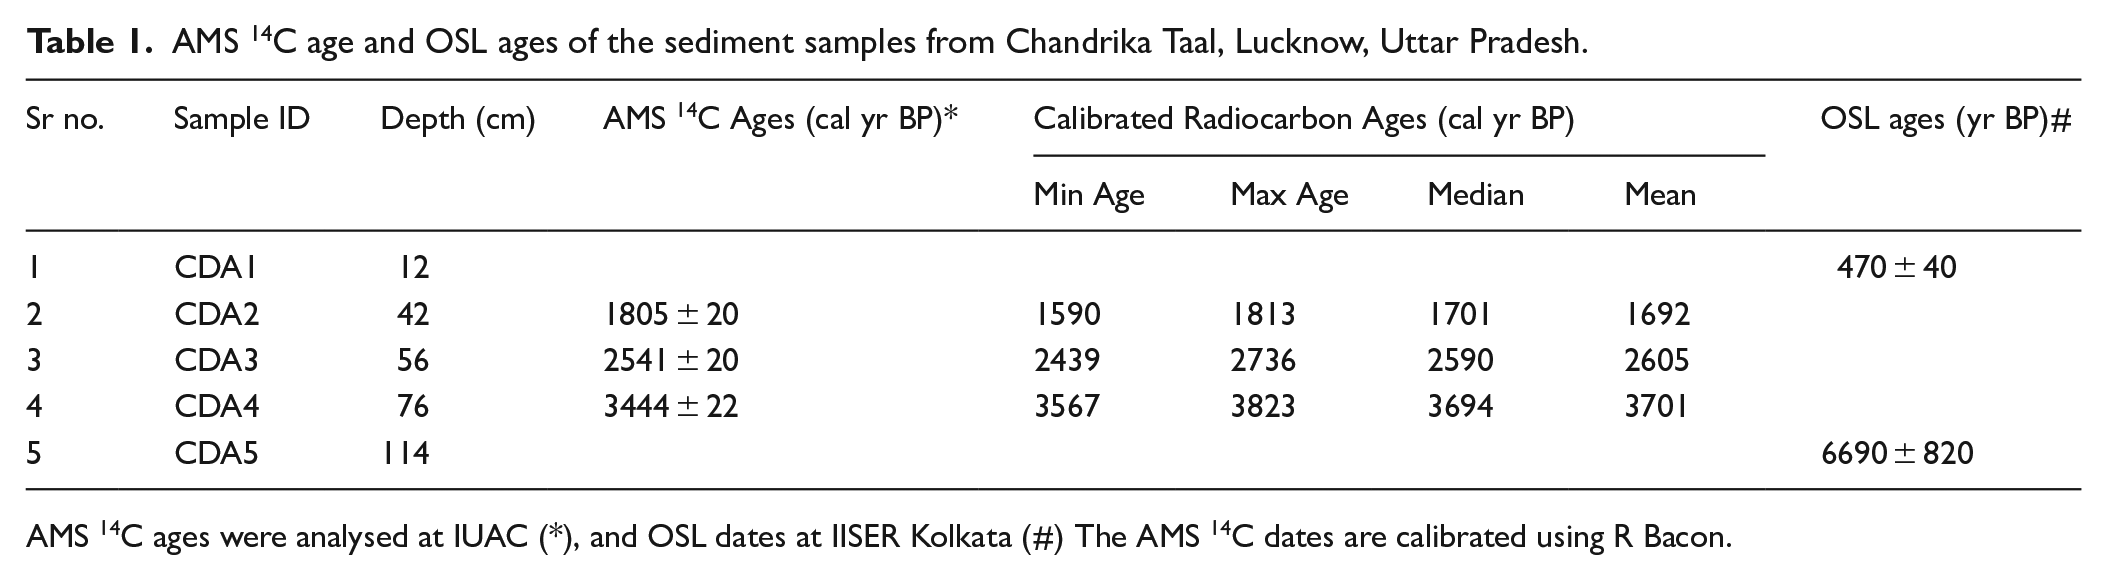
AMS 14C ages were analysed at IUAC (*), and OSL dates at IISER Kolkata (#) The AMS 14C dates are calibrated using R Bacon.
For the OSL dates, fine to medium grained sand sediments were collected from the sandy layers using opaque galvanised metal pipes, by hammering them into the trenched section. Samples were processed and OSL dates were analysed in the OSL/TL Laboratory at Indian Institute of Science Education and Research (IISER) Kolkata. The OSL methodology is described in Supplemental Note S1.
Grain size analysis
The grain size analysis of 58 samples from trench CDA was carried out at SILIKA laboratory, Indian Institute of Science Education and Research (IISER) Kolkata. The samples were treated with 10% HCl for a period of 2 h at a temperature of 50°C followed by 30% H2O2 for a period of 24 h in order to remove the carbonate and organic matter. The samples were centrifuged at 5000 rpm for a period of 5 min to remove the acid and H2O2 (Dutt et al., 2018; Singh et al., 2022). The samples were then analysed in the Laser Particle Size Analyser Malvern Mastersizer 3000. Prior to the analysis, the samples were ultrasonicated for a period of 1 min at 2400 rpm. For best results, average of five measurements are taken . The grain size measurements were then used to construct End Member Models (EMMs) using the MATLAB AnalySize package that are used to discern the various energy conditions active in the lake (Paterson and Heslop, 2015). The angular deviation (measured in degrees) is determined as the angular difference between reconstructed and observed datasets as a function of end members. The end members are defined by the correlation between coefficient of determination (R2) and end members (q) to determine the transportation processes of sediments (Kaushik et al., 2023). The classification of sediment grain sizes was done with the help of GRADISTAT9.1 software (Blott and Pye, 2001).
Geochemical analysis
Major oxides and trace elements were determined using X-ray Fluorescence (XRF) Spectroscopy. 28 samples were taken at an interval of 4 cm for XRF analysis. The samples were dried at a temperature of 60°C and ground to very fine powder using agate mortar and pestle. The crushed samples were sieved in 60 µm size sieve. Four grams of sample were mixed with 1 g of boric powder to form a homogenous mixture. Pressed pellets were prepared from the mixture using a hydraulic press pellet machine (Majumdar et al., 2021). The pressed pellets are run in the XRF Analyser (Bruker S8 Tiger, Germany, XRF, DST-FIST facility, IISER Kolkata). The reproducibility of the data has been ascertained using repeat analysis of two standards (JSD-2 and JLK-1 JSD-2) for major elements and three standards (JLK-1, GSP-2, PACS-3) for trace elements.
Stable carbon isotope ratio of organic matter (δ13Corg) and total organic carbon (TOC) analysis
Samples (n = 28) were finely powdered in agate mortar and pestle and treated with 0.5N HCl to remove inorganic carbon. The decarbonated samples were centrifuged at 5000 rpm using Milli-Q water to remove the acid. This process was repeated until the acid was completely neutralised. The decarbonated samples were air-dried in the oven at a temperature of 60°C. 10–20 mg of pre-treated samples were packed in tin capsules and combusted in Flash 2000 Elemental Analyser to produce CO2, that is introduced to Delta V Plus through the Conflo-IV interface (Samantaray and Sanyal, 2022). Analytical precision is obtained using the primary standards IAEA CH-3 (Cellulose, isotopic values −24.7‰) and IAEA CH-6 (Sucrose, isotopic values −10.5‰). Repeat analyses were performed after every fifth sample which showed a deviation from 0.1 (‰) to 0.2 (‰). The TOC was calculated from the peak area obtained from integrated sums of m/z, 44, 45 and 46 measured signals.
Pollen analyses
A total of 58 sediment samples were dried at 50°C and, then 10 g of each sample were chemically processed using acetolysis methods following the protocol suggested by Erdtman (1943) for the palynological studies. For thecamoebian study, same set of samples were processed post KOH treatment followed by sieving through 150 and 650 mesh sizes sieves respectively. Almost in all samples, 200–300 pollen/spores were counted except for a few samples with low pollen percentages. The final residue was stored in 50% glycerine solution to avoid bacterial and fungal attack. Pollen/spores were examined at 400x magnification under Olympus BX-63 Light Microscope. The results are expressed as percentage values of the pollen sum and percentage frequencies of the recovered taxa were calculated in terms of total terrestrial plant pollen. Other biological entities such as pteridophytes, algal spores, thecamoebians and microcharcoal are excluded from the pollen sum. Pollen studies including extraction from sediments, counting and identification were done at the Birbal Sahni Institute of Palaeosciences, Lucknow, using reference slides of BSIP Herbarium and standard published literature (Chauhan and Bera, 1990; Nayar, 1990). Palynomorphs recovered from the sediments were grouped broadly into different categories as Arboreal (trees and shrubs), Non-Arboreal (herbs), Aquatics, Spores, Algae, Thecamoebians and Microcharcoal (Supplemental Table S1). The percentages of all pollen and spores were calculated from Total Pollen Sum. The pollen diagram was drawn using Tilia and Tilia Graph 19 version 2.0.41 software (Grimm, 2015).
Results
Lake lithology
Based on the grain size data, five main size fractions have been identified in the study core: sand (2000–63 µm), coarse silt (63–16 µm), medium silt (16–8 µm), fine silt (8–4 µm) and clay (<4 µm) (Krumbein, 1934). Silt and sand are the dominant grain size fraction found in trench CDA (Figure 2a). The clay fraction ranges between 0 and 2%. The coarse silt values range between 2% and 58% and sand fraction ranges from 4% to 96%. The whole section is subdivided into five litho-units based on Folk’s classification of fine and coarse sediments (Figure 2a) and is shown in Supplemental Figure, Fig. S1. The top 20 cm comprises of sandy silt with occasional layers of sand and silt. The interval from 20 to ~60 cm is mainly composed of silt and from 60 to 90 cm sandy silt is dominant. A transition from sandy silt to sand occurs between 90 and 100 cm and sand fraction dominates from 100 to 114 cm.
Chronology
The age-depth model (based on Bayesian statistics using Markov Chain Monte Carlo Iteration) of the lake profile is constructed in R script, R Bacon (Blaauw, 2021) (Figure 2b) using a combination of AMS 14C and OSL dates. The R Bacon age depth model takes into consideration mixed ages where a combination of calibrated radiocarbon ages (cc = 1) and uncalibrated OSL ages (cc = 0) are used for determining the age depth model (Blaauw, 2021; Blaauw and Christen, 2013; Reimer et al., 2013). The age-depth model is interpolated at an interval of 2 cm giving an age range from 5871 to 75 cal yr BP (Figure 2b). The average age per sample is ~100 year per 2 cm.
Grain size analysis
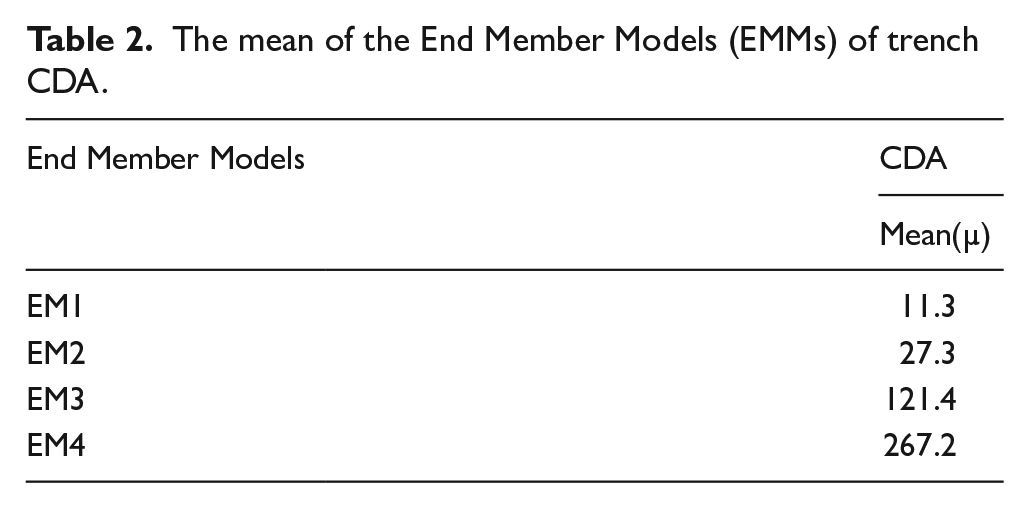
The End Member Modelling (EMM) Analysis was applied on the grain size distribution (GSD) to indicate the energy of the streams and rivulets entering the lake, surface runoff from the catchment and lake level (Anoop et al., 2013; Dutt et al., 2018; Mishra et al., 2015). Four EMM models have been extracted to differentiate between fluvial and lacustrine processes and identify any paleo flood layers in the sequence (Guan et al., 2022; Toonen et al., 2015; Figure 3a). The mean of all four EMMs is shown in Table 2. More information regarding the algorithm from which the EMMs are derived, number of members, and their depositional settings is given in Supplemental Information. EM4 dominates from ~ 5900 to 5000 cal yr BP, EM3 and EM2 dominate from 5000 to 3000 cal yr BP while EM1 dominates during the last 3000 years (Figure 4).
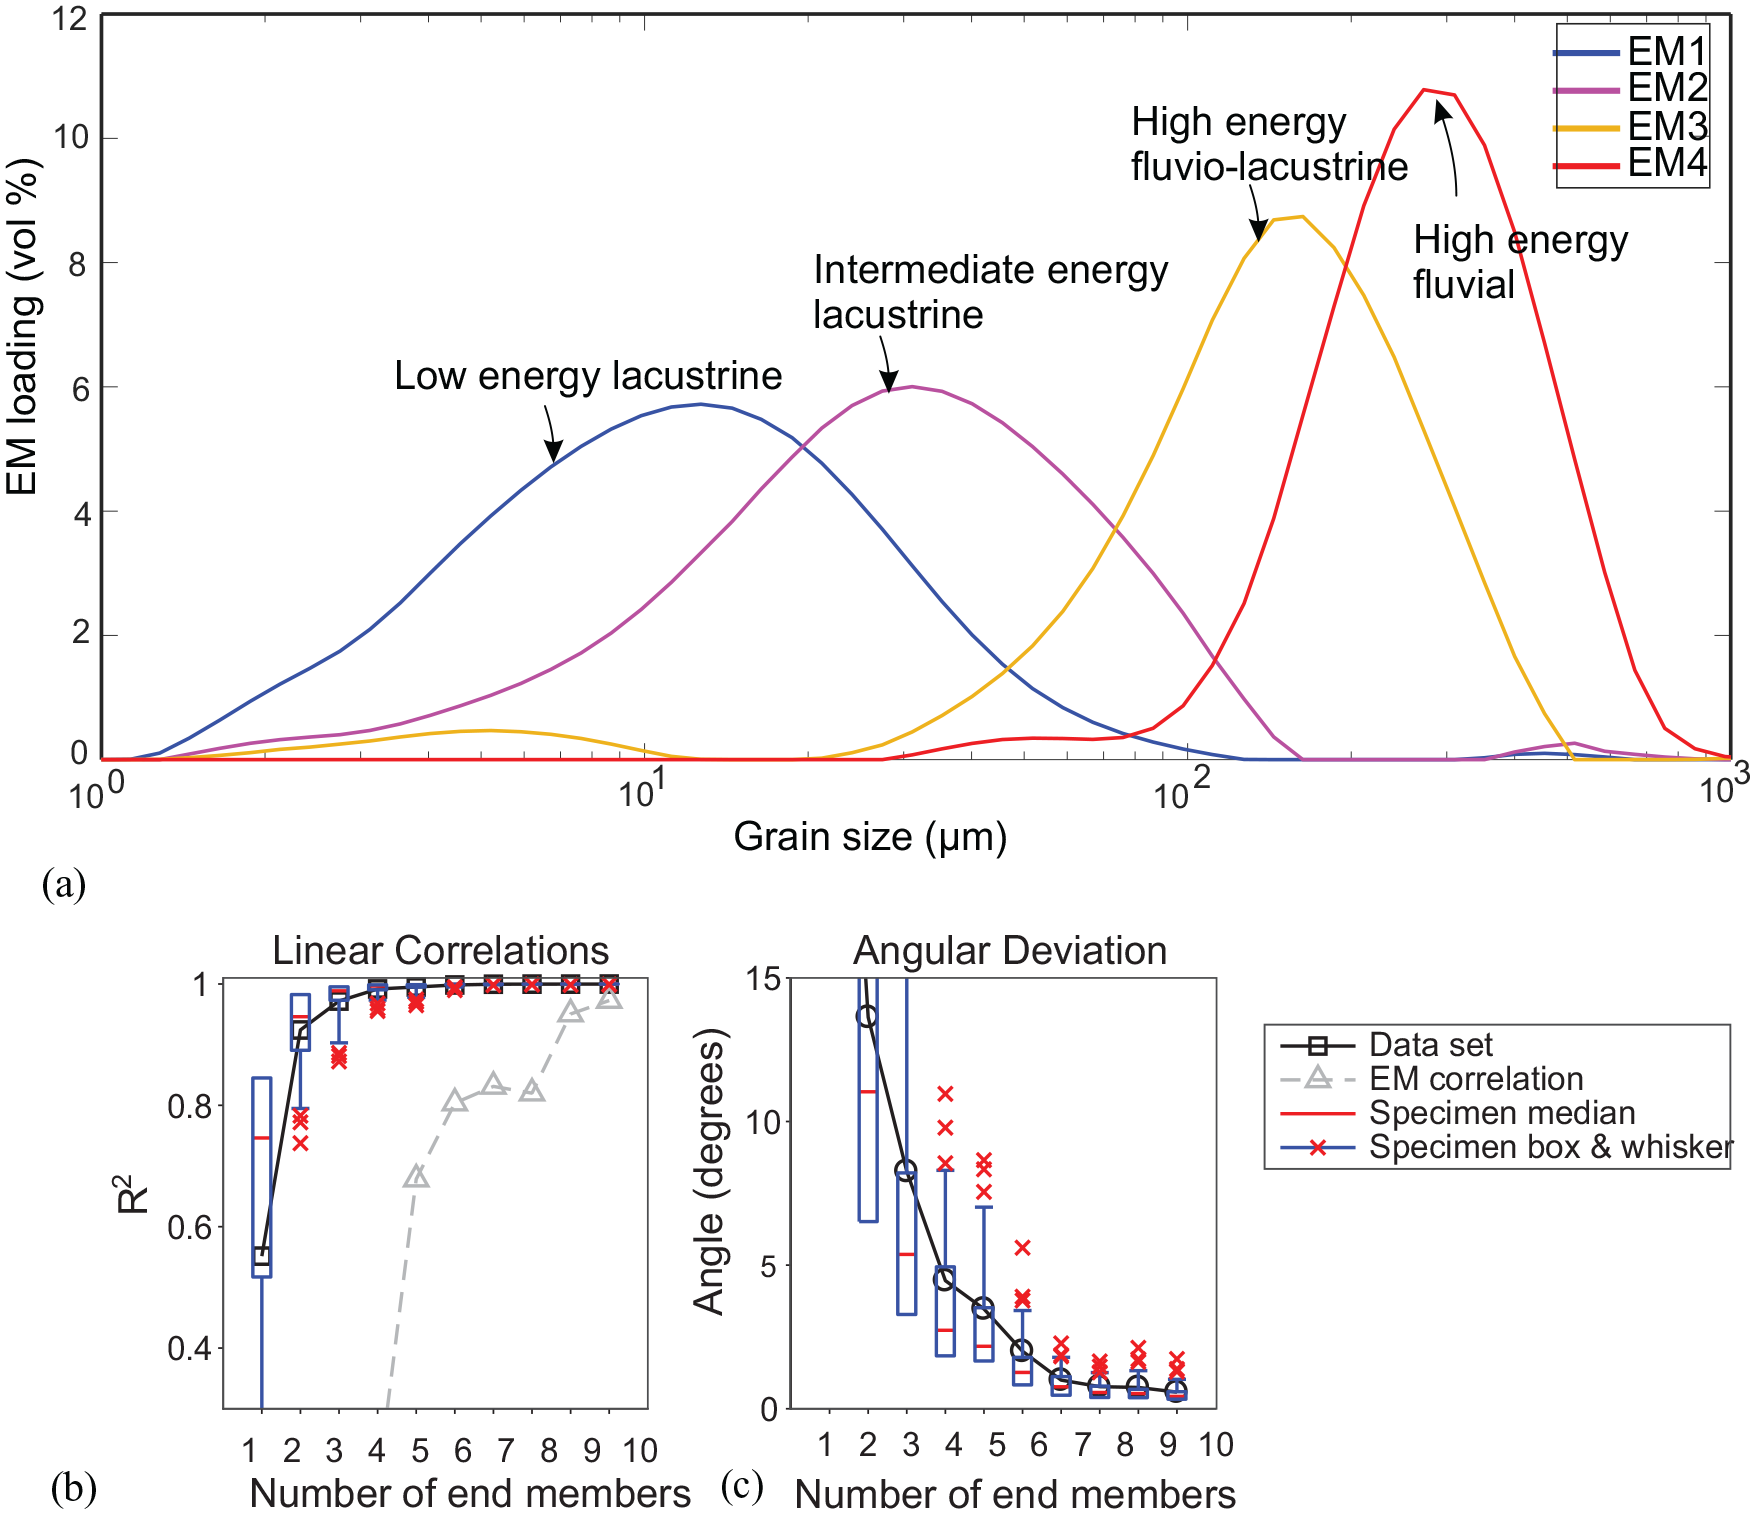
(a) Results of the End Member Modelling (EMM) of the grain size data from trench CDA, Chandrika Devi lake. The End Member (EM) loading indicates that unmixed grain size distribution can be categorised into four categories namely EM1, EM2, EM3, EM4. EM1: Low energy lacustrine deposition of fine silt and clay, EM2: Intermediate energy lacustrine deposition of coarse silt, EM3: Low energy fluvio-lacustrine processes characterised by the deposition of fine sand, EM4: High energy fluvial deposition of medium to coarse sand. (b) The linear correlation model for each model size class with 1–10 end members. (c) The angular deviations between reconstructed and observed datasets.
The mean of the End Member Models (EMMs) of trench CDA.
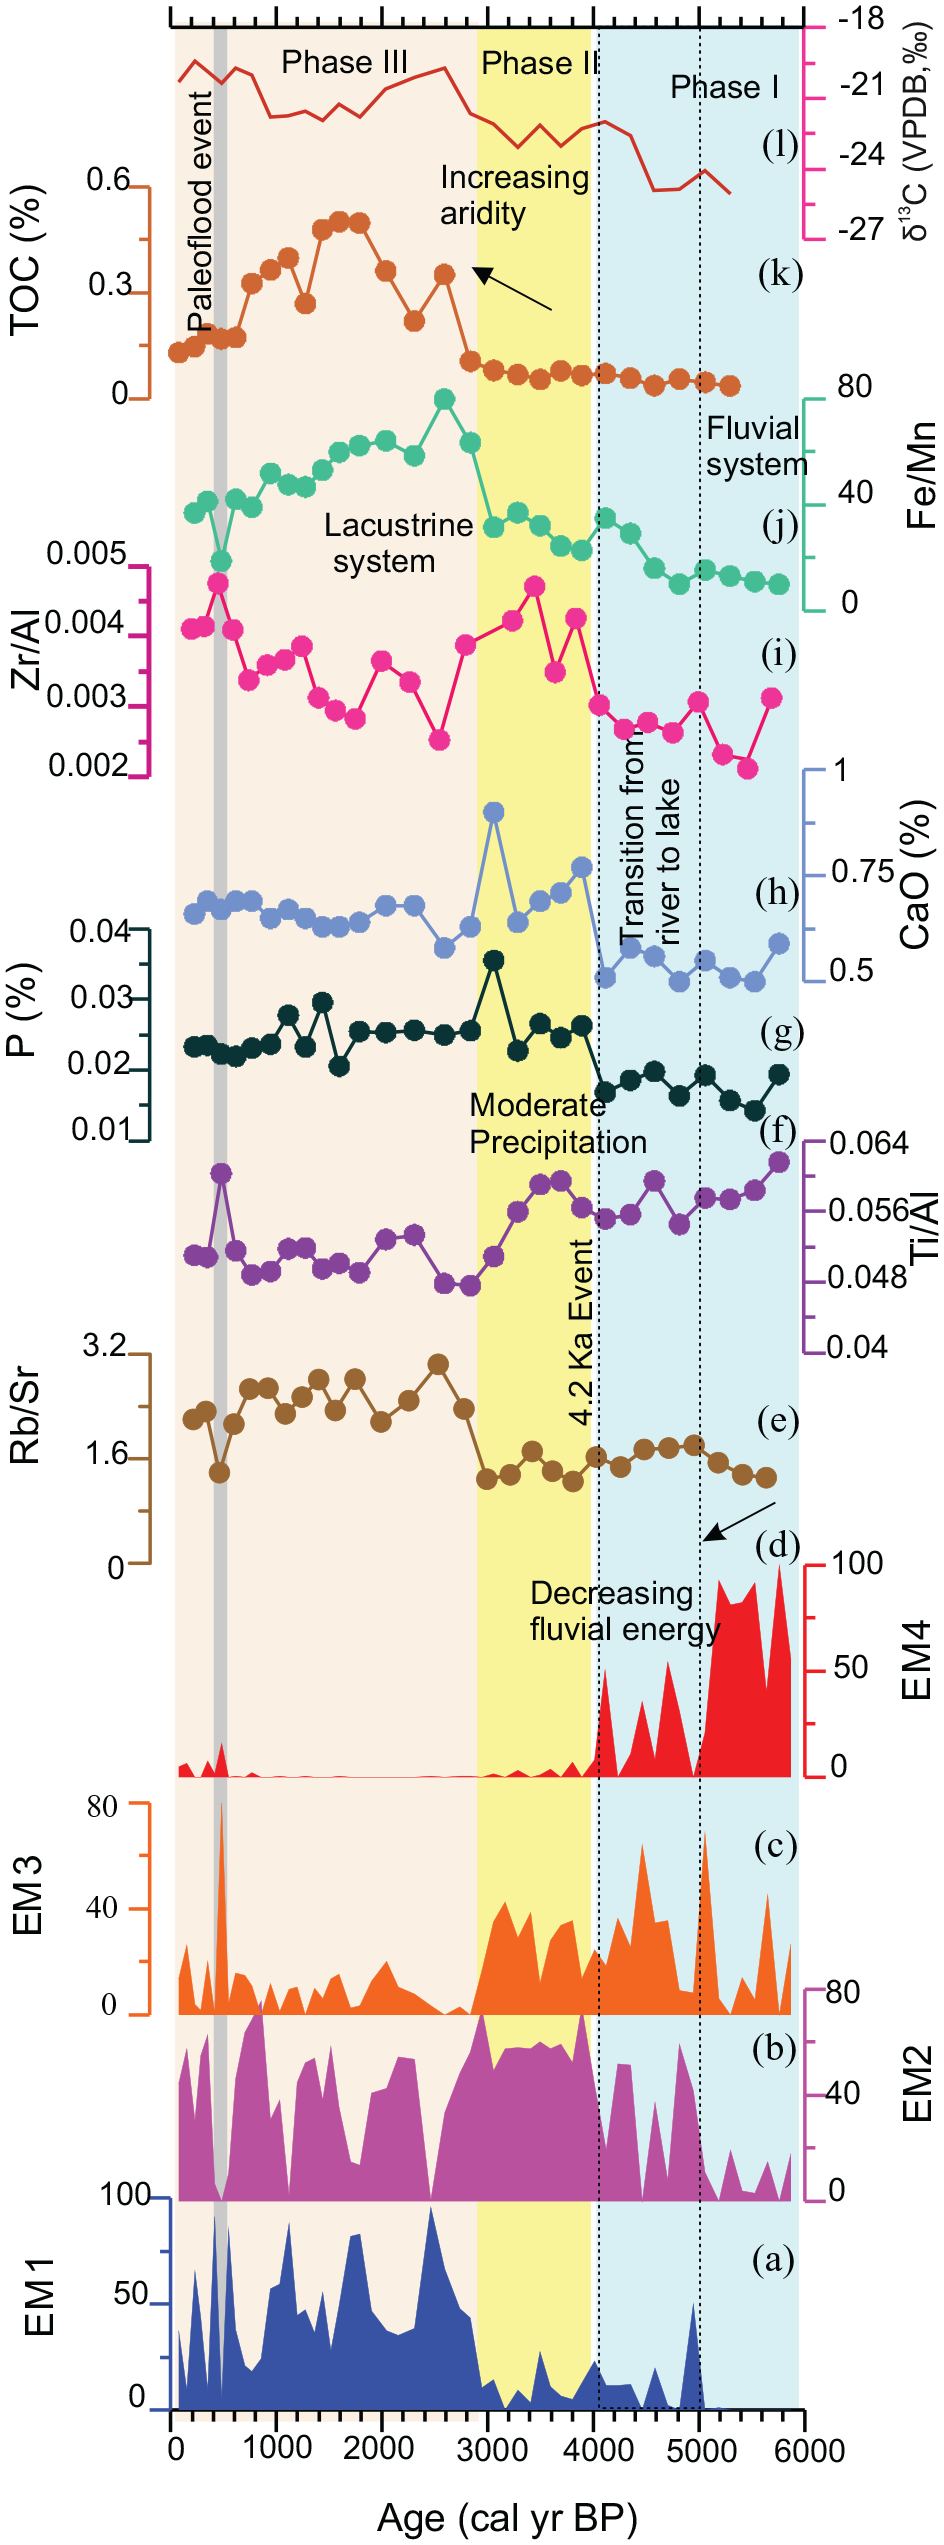
Proxy records of paleomonsoonal shifts from Chandrika Devi lake. (a) EM1, (b) EM2, (c) EM3, (d) EM4, (e) Rb/Sr ratio, (f) Ti/Al ratio, (g) P (%), (h) CaO (%), (k) TOC (%), (i) Zr/Al, (j) Fe/Mn and (l) δ13Corg (‰).
Geochemical analysis
The Rb/Sr, Ti/Al, Zr/Al, Fe/Mn ratios combined with CaO (%) and P (%) have been used to understand the geochemical conditions in the study lake. The low or high Rb/Sr ratio in the lake can be explained due to two different scenarios. (i) In hydrologically open lakes Sr, being comparatively more mobile than Rb, enters the lake sediments through streams and rivulets due to enhanced precipitation. Intense precipitation leads to the enrichment of ions like Na, Ti, K, Sr, in the lake water thereby decreasing the Rb/Sr ratio and vice versa, thus low Rb/Sr ratio indicates chemical weathering due to enhanced precipitation (An et al., 2018; Dutt et al., 2018; Jin et al., 2001, 2006; Xu et al., 2015). Such interpretations have been related to the lakes of tropical to subtropical climates (Minyuk et al., 2014; Sandeep et al., 2022). (ii) In a closed lake system, the interpretation of Rb/Sr ratio is opposite as in a closed lake, Rb being a comparatively heavier element than Sr leaches out into the lake water from surrounding catchment from what ?during intensive precipitation. The Rb/Sr ratio is thus considered sensitive to rainfall intensity and can be used as a reliable proxy for reconstructing the depositional condition of the lake (Bhushan et al., 2018; Chen et al., 1999; Xu et al., 2010). (Figure 4). The lake acts as open-phased fluvial system from ~5900 cal yr BP to 4100 cal yr BP, semi enclosed system from 4100 to 3000 cal yr BP, and a close-phased system from 3000 cal yr BP, where fluvial input is minimal, resulting in low transportation of Sr into the lake from the Gomti river thereby increasing the Rb/Sr ratio.
The Ti/Al ratio is used to discern the mode of transport, and track changes in continental weathering and erosion, fluvial source geochemistry as well as the degree of chemical weathering (Gebregiorgis et al., 2020; Tian et al., 2011). In the present study, the Ti/Al ratio is used to distinguish between fluvial and lacustrine environments (Sandeep et al., 2022) (Figure 4). The Fe/Mn ratio is used to understand the past oxygenation and to reconstruct the redox water conditions of the lake (Bhushan et al., 2018; Vegas-Vilarrúbia et al., 2018). Both Fe and Mn remain in solution under reducing conditions, but under anoxic conditions Mn is more readily dissolved in the solution as compared to Fe. Hence, a higher Fe/Mn ratio indicates the onset of the low oxygen condition in the lake (Naeher et al., 2013; Żarczyński et al., 2019; Figure 4). In the Chandrika Devi lake, Fe/Mn ratio increases gradually with the full development of the lake system (Figure 4). The Zr/Al ratio is mainly used as an aeolian proxy that detects changes in the mode of transportation (Bhushan et al., 2018) where increase in wind activity is related to a humid phase. CaO in a closed lake gets precipitated during extreme arid phases. Additionally, the P (%) also denotes the productivity of the lake as it increases due to the increase in the biogenic activity of the lake (Piovano et al., 2004) (Figure 4). The geochemical proxies in general follow grain size variations in the lake. In trench CDA, Ti/Al ratio remains higher during ~5900–3400 cal yrs BP, and decreases after 3400 cal yr BP. The CaO (%) and P (%) remain high from 4000 to 3000 cal yr BP. The Rb/Sr and Fe/Mn ratios increase after 3000 cal yr BP, whereas Zr/Al ratio starts increasing after 4000 cal yr BP, followed by a drop at ~3000 cal yr. The ratio increases again after ~2500 cal yr BP (Figure 4).
Stable carbon isotope (δ13Corg) and total organic carbon (TOC) analyses
A total of 28 samples have been analysed for TOC and δ 13Corg ratio. TOC (wt%), δ13Corg values indicate lake productivity (Sharma et al., 2004a), type of vegetation (C3 and C4) The δ13C values of organic matter have been used to understand the type of vegetation found in the catchment. The vegetation in the Ganga Basin is characterised by C3 and C4 plants (Agrawal et al., 2012). The δ13C value of C3 plants in the Central Ganga Basin is −28.9 ± 2.8‰ and for the C4 plants the value is −13.9 ± 1.3‰ (Basu et al., 2015). Therefore, relatively higher δ13C value of organic matter will suggest increase in C4 plants in the catchment and lowering of the δ13Corg value will suggest dominance in C3 plants. According to Singh et al. (2022), the δ13Corg value represents in-situ productivity and surrounding vegetation. TOC (Wt %) varies between 0.1 and 0.5, while the δ13Corg value varies from –26‰ to –18‰. From ~5900 to 4100 cal yr BP the δ13Corg value increases from ~ − 25‰ to – 23‰. From 4100 cal yr BP to 3000 cal yr BP, the δ13Corg value remains steady between – 23‰ and – 21‰. From 3000 cal yr BP to the Recent, the δ13Corg value varies from –22‰ to −19 ‰. The TOC (Wt%) also increases at ~3000 cal yr BP.
Correlation matrix
A correlation matrix is shown in Table 3, indicating correlations between end members, geochemical proxies, TOC (%) and δ13Corg value. EM1 shows a positive correlation with Rb/Sr, Fe/Mn and TOC (%) and a negative correlation with Ti/Al. This indicates the quiet water lacustrine phase. EM3 shows a positive correlation with Ti/Al indicating the detrital input into the lake through fluvial processes and catchment. EM4 shows a negative correlation with CaO and P, suggesting that CaO and P are derived from authigenic minerals that started settling during the lake formation (Piovano et al., 2004).
Correlation matrix between the End Members, elemental ratios, TOC and δ13Corg value (VPDB, ‰).
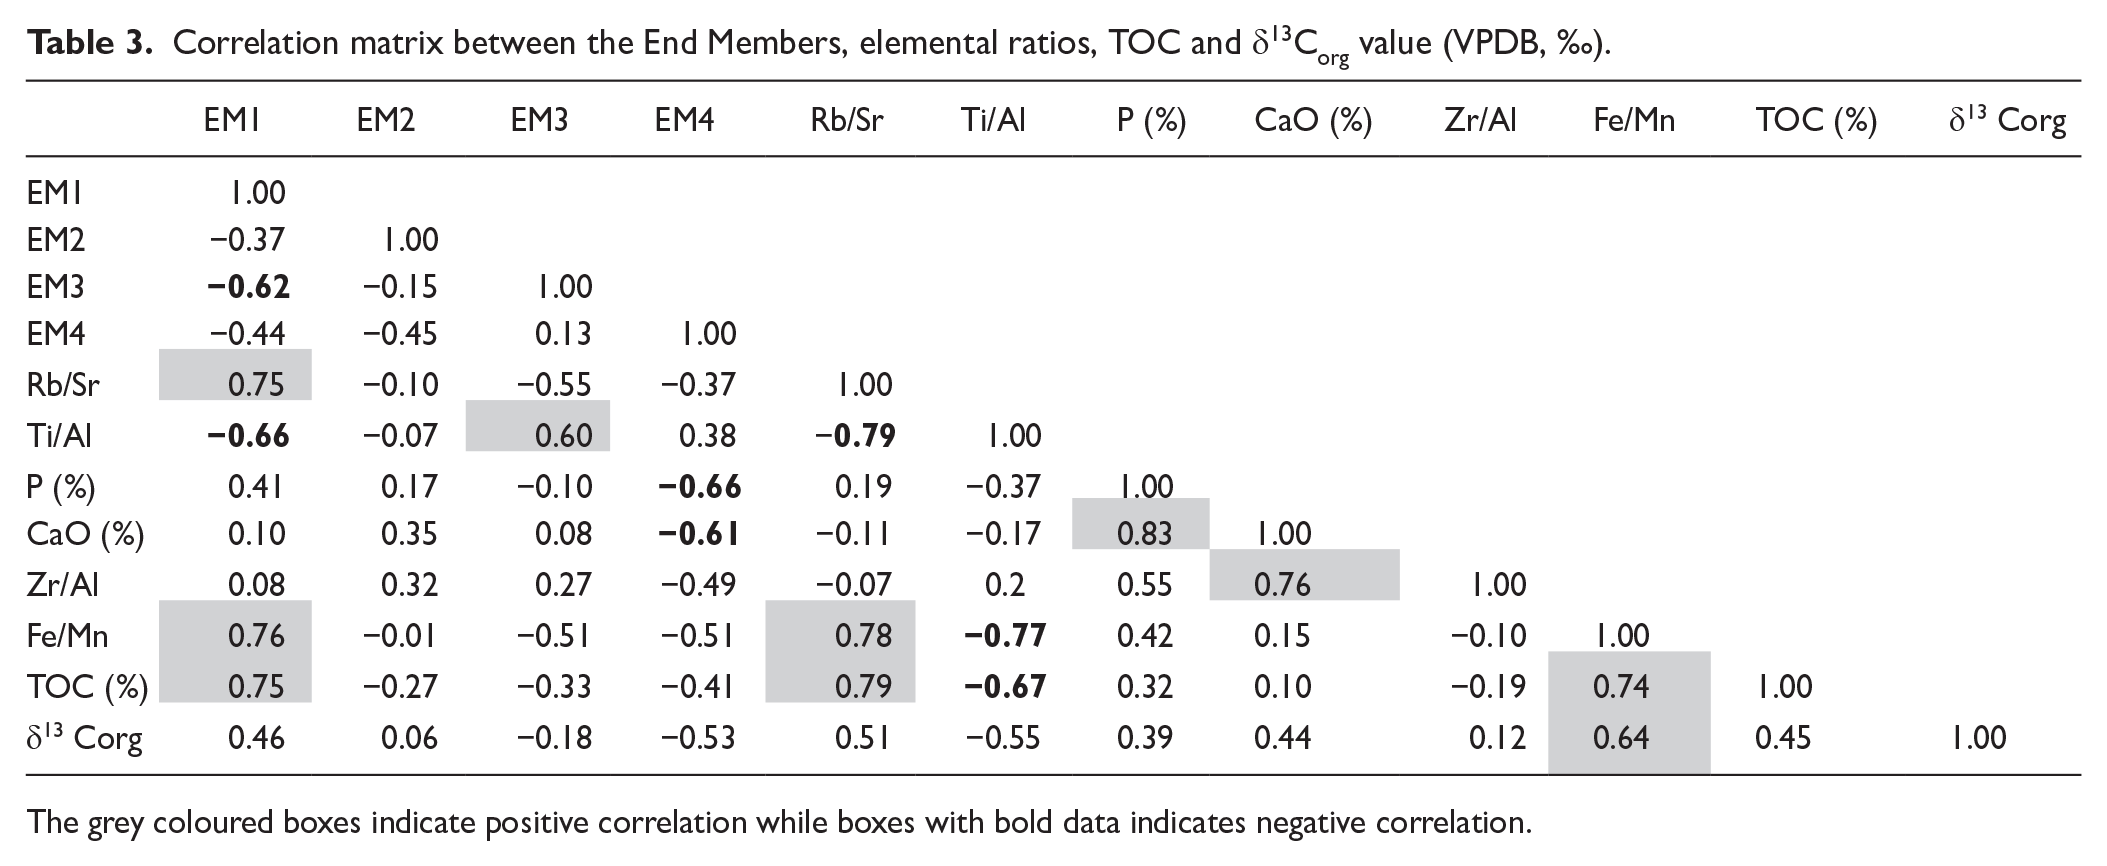
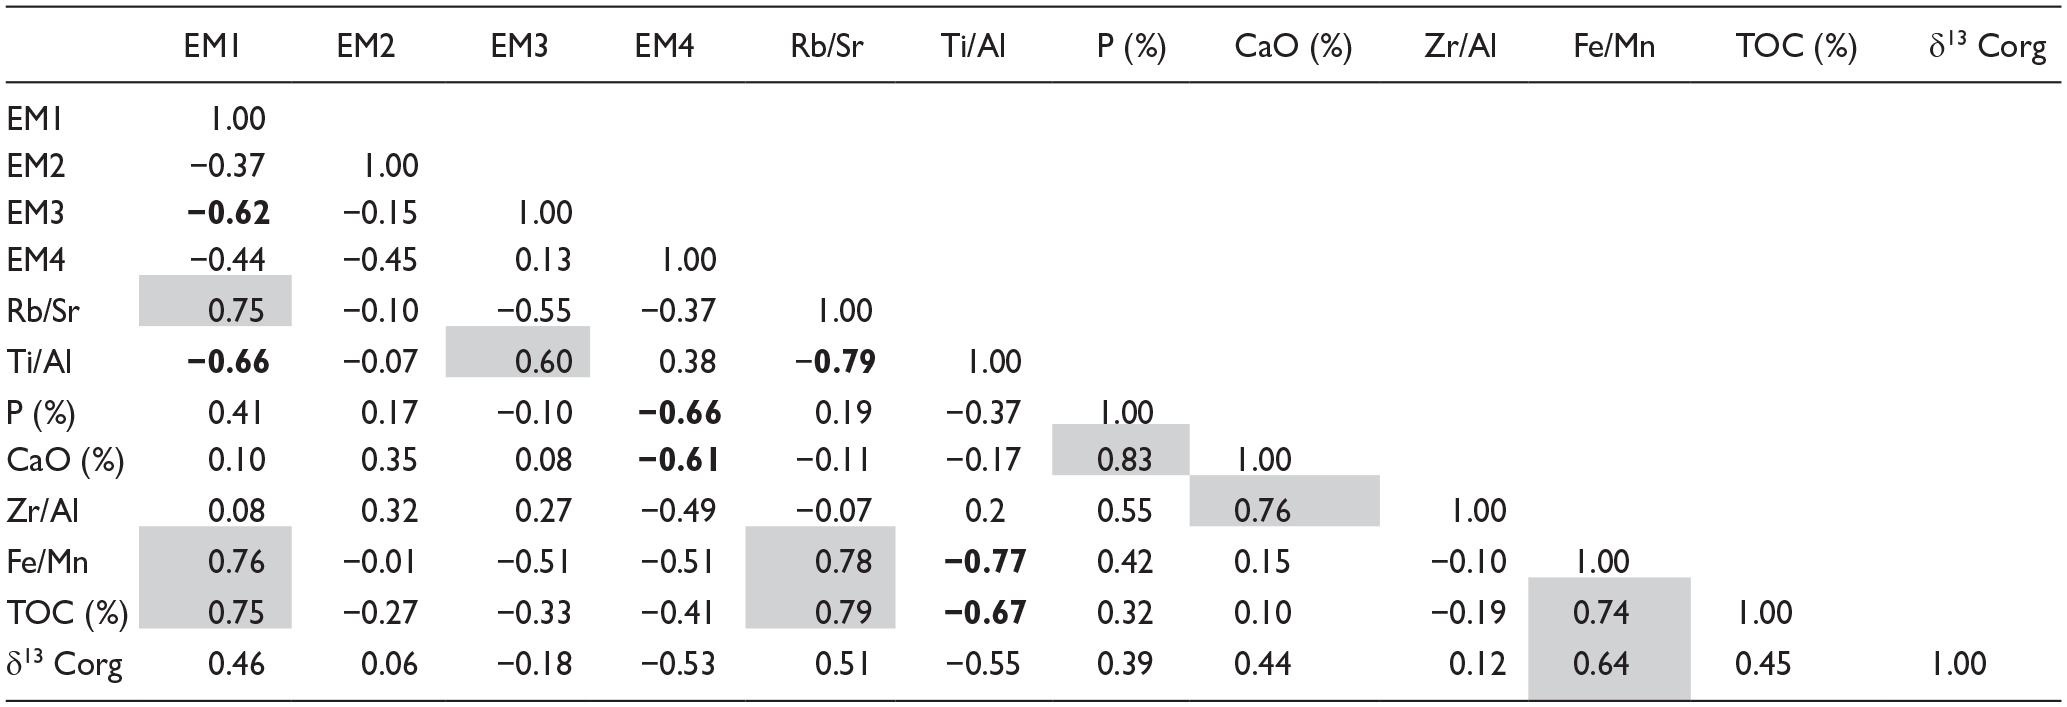
The grey coloured boxes indicate positive correlation while boxes with bold data indicates negative correlation.
Description of the palyno assemblages
Pollen are used to understand paleovegetation of the lake as well as the catchment. Variations in plant taxa include arboreal taxa (both moist and dry deciduous forest), non arboreals including cultural and aquatic taxa along with algae, spores and microcharcoals with ages and climatic implications are shown in Supplemental Table S2. The microcharcoal indicate catchment wide fire (Iglesias et al., 2015; Sharma et al., 2022). There is a distinct relationship between Holocene human population and fire activity as recorded in other parts of the world (Black et al., 2006). In the Chandrika Devi lake, there is a specific positive correlation between microcharcoal and cultural taxa (Cerealia, Caryophyllaceae, Artemisia, Urticaceae, etc.). Thus, microcharcoals indicate human presence in the surrounding catchment area associated with the deforestation or stubble burning caused by farming activities.
Based on recovered palynological assemblages, the entire pollen diagram is divided into six zones (Figure 5) in ascending order from bottom to top (CDA-I, CDA-II, CDA-III, CDA-IV, CD-A-V, CDA-VIa and CDA-VIb). The recovered pollen taxa (Figure 5) are categorised as trees, shrubs, herbs, aquatics, spores, algae and others are listed in the same order as the pollen spectra and pollen diagram (Supplemental Table S1).
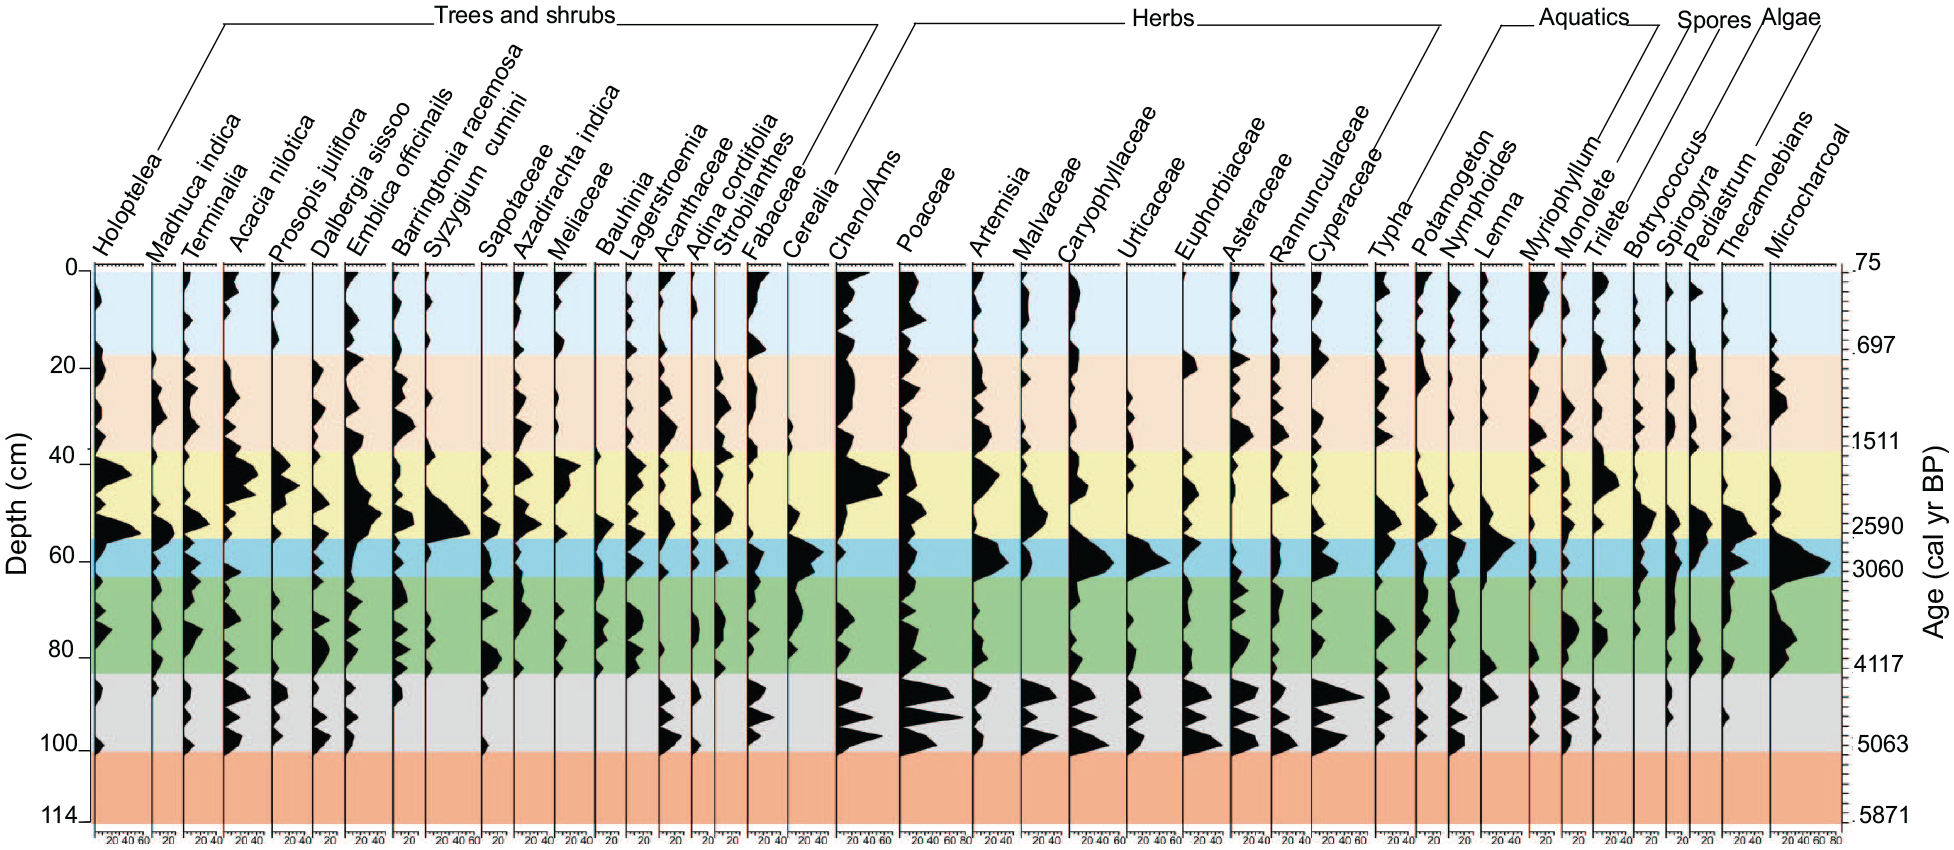
Pollen percentage diagram of the lake sediment profile from Chandrika Devi lake.
Pollen zone CDA-I (114–100 cm); (5871–5063 cal yr BP)
This zone is completely devoid of pollen and spores.
Pollen zone CDA-II (100–84 cm); (5063–4117 cal yr BP)
This zone is dominated by non-arboreal taxa that is, open vegetation chiefly constituted of grasses. Poaceae (53.4%), is recorded in abundance followed by Cyperaceae, Cheno/Ams, Euphorbiaceae. Other group members are recorded in moderate values as Caryophyllaceae, Malvaceae, Asteraceae. Amongst Arboreals taxa, Acacia (22.1%) is the dominant taxon followed by Dalbergia sissoo and Prosopis. Aquatics elements are also represented in moderate values, Nymphoides is recorded with highest value of 18% followed by Typha (11.3%). On the other hand, Potamogeton, Lemna, Myriophyllum are represented in low values.
Pollen zone CDA-III (84–64 cm); (4117–3060 cal yr BP)
This zone is characterised by the predominance of Arboreal taxa than non-Arboreal. Pollen of Barringtonia, Azadirachta, Terminalia, Sapotaceae are recorded in high abundances, followed by Dalbergia sissoo and Madhuca indica. Amongst non-Arboreals, pollen of Poaceae, Asteraceae, Euphorbiaceae and Cheno/Ams are represented in abundance, on the other hand, Cerelia pollen are also noticed in high values. Pollen of aquatic taxa are also recovered in high abundances, the most abundant being Potamogeton, Typha, Nymphoides. Amongst algae group, Spirogyra is dominated whereas Pediastrum and Botryococcus are also recorded in good values. Thecamoebians and Microcharcoal are reported in high percentages.
Pollen zone CDA-IV (64–56 cm); (3060–2590 cal yr BP)
This zone is characterised by high values of Arboreal taxa such as Emblica officinalis, Fabaceae, Lagerstroemia, Terminalia. Herbaceous flora was strongly represented by Cerelia, Caryophyllaceae, Urticaceae, Artemisia show constant presence. The aquatic elements such as Typha and Potamogeton show moderate frequencies. The algal remains viz., Spirogyra and Botryoccocus, Zygnema are recorded in good values. Microcharcoal occur in abundance in this zone. In this zone, agriculture activities are recorded prominent as occurrence of Cerealia and other culture taxa. This indicates humid and reduced precipitation during this period.
Pollen zone CDA-V (56–38 cm); (2590–1511 cal yr BP)
This zone is characterised by the predominance of arboreal taxa that is, trees and shrubs. The percentages of the pollen of moist deciduous and evergreen taxa such as Emblica officinalis, Holoptelea, Syzygium whereas other taxa such as Acacia is recorded in moderate values. Herbaceous pollen is represented primarily by Cheno/Ams, Poaceae and Malvaceae in abundance than the previous zone III. Decrease in culture pollen taxa are also noticed throughout this zone. Aquatic elements such as Potamogeton sp. and Typha angustifolia were recorded in high abundance. Amongst pteridophytic and algal spores, triletes, Botryococcus followed by Pediastrum are noticed in moderate values throughout this pollen zone. The overall pollen assemblages suggest warm and humid climatic conditions during this period.
Pollen zone CDA-VI
Based on noticeable changes in pollen assemblages, Pollen zone VI is divided into two subzones, VIa and VIb in ascending order.
Pollen zone CDA-VIb (38–18 cm); (1511–697 cal yr BP)
This zone is characterised by moderate percentages of non-arboreal taxa and tree and shrubs elements. Herbaceous taxa such as Cheno/Ams, Poaceae, Artemisia are in increasing trend especially Urticaceae are reported in abundance in this subzone. The arboreal taxa, such as Barringtonia, Emblica officinalis, Acacia, Acanthaceae and Terminalia demonstrated in good frequencies are well recorded. The fresh water taxon Typha sp. is characterised by high frequency. Monolete and trilete spores are better represented than the previous pollen zone. Algal spores such as Botryococcus, Spirogyra, Pediastrum also show moderate values, whereas, Myriophyllum is recorded in abundance. Microcharcoal more common than in the previous zone. Monolete and trilete spores also registered in appreciable proportions. The overall assemblages indicate reduced precipitation and initiation of shrinking lake.
Pollen zone CDA- VIa (18–0 cm); (697–75 cal yr BP)
A high diversity of non-arboreal pollen is noticeable in this zone. The most conspicuous feature of this subzone is reduction of algal taxa, dominance of grasses indicates transformation of lake into marshy lowland. Herbaceous pollen is represented primarily by Chenopodiaceae/Amaranthaceae followed by Poaceae. The aquatic taxa, such as Potamogeton sp., is recorded in good amount. A significant increase in Myriophyllum and Lemna sp. are recorded in this pollen subzone. Fern spores especially triletes demonstrate an increasing trend.
Discussion
Climatic changes since the middle Holocene
Based on the above-mentioned proxies, the Chandrika Devi lake provides a complete record from the middle Holocene to the Recent. The lake system is divided into three distinct phases on the basis of physical, geochemical and biological changes (Figure 4): (i) Phase I (5900–4100 cal yr BP), (ii) Phase II (4100–3000 cal yr BP), (iii) Phase III (3000–75 cal yr BP).
Phase I (5900–4100 cal yr BP)
Phase I is considered an open-phased fluvial system, when the lake was a part of the Gomti river. Being dependent on ground water recharge, Gomti river discharge is also dependent on ISM precipitation (Tangri et al., 2018) during the monsoon period, thus sedimentological changes during this period can be correlated with ISM variability. From 5900 to 5000 cal yr BP, EM4 is dominant and C3-type vegetation can be inferred from the δ13Corg value, indicating enhanced fluvial activity. This phase coincides with strong monsoon winds as shown by the abundant Globigerina bulloides percentage in the western Arabian Sea (Gupta et al., 2003, 2005; Figure 6). This is further corroborated by the surge in Himalayan rivers during the same time period (Bryson and Swain, 1981; Kale, 2007; Singh, 1996; Srivastava et al., 2003a). High EM4 indicates deposition of coarser grain size fraction like sand, which has very low pollen preservation, hence this time period also records a pollen barren zone. The δ13Corg value varies between ~ −25 and −22‰, indicating a shift in vegetation from C3- to C4-dominated grassland during ~5100–4400 cal yr BP, indicating the onset of aridity in the Central Ganga Basin at ~5000 cal yr BP (Figure 4).
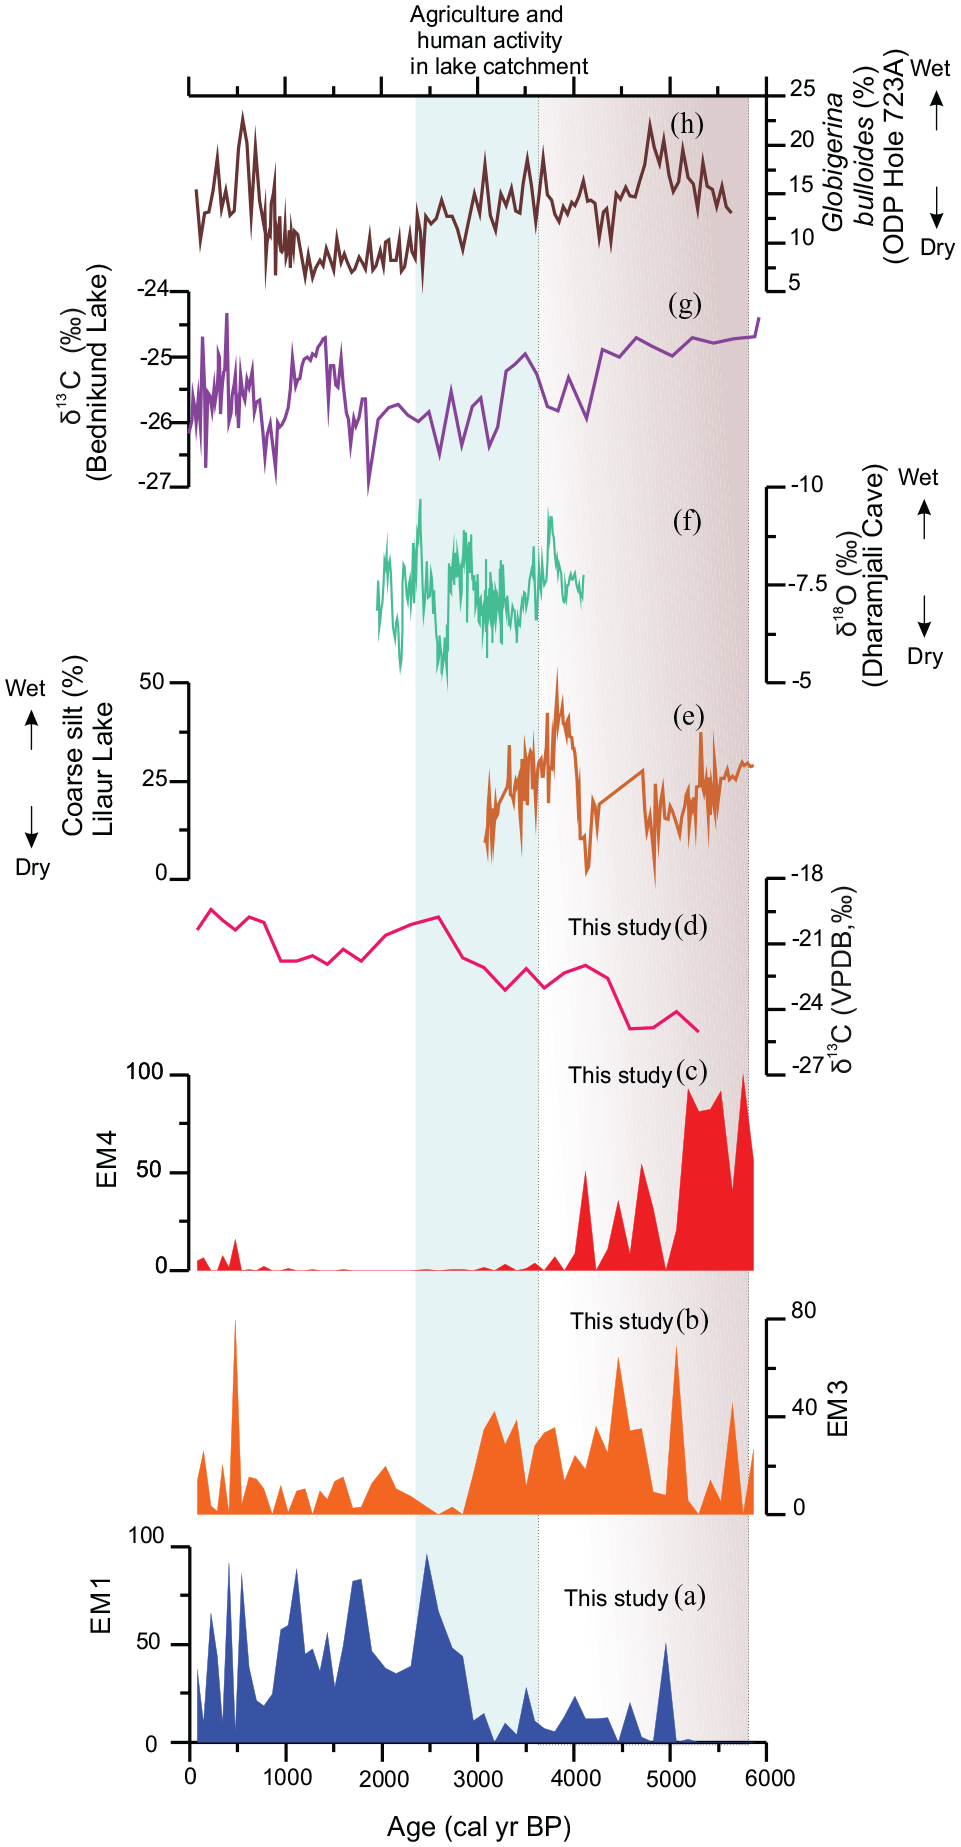
Indian Summer Monsoon (ISM) variability as recorded in sediments of the Chandrika Devi lake from ~ 5900 to 75 cal yr BP, using multiproxy records (a) EM1, (b) EM3, (c) EM4, (d) δ 13C (‰), (e) Coarse Silt (%) from Lilaur Lake (Singh et al., 2022), (f) δ18O (‰) record from the Dharamjali cave, Central Himalaya (Kotlia et al., 2018), (g) δ13C (‰) of lake sediments and soils from Bednikund lake, Central Himalaya (Rawat et al., 2021), (h) Globigerina bulloides percentages from Arabian Sea ODP Hole 723A (Gupta et al., 2005).
The geomorphological history of the Central Ganga Basin indicates that the Holocene aridity began at ~5600 cal yr BP, caused by a weak ISM and decrease in precipitation that led to the drying up of the large lakes and reduced water budget (Saxena and Singh, 2017; Singh et al., 2015; Srivastava et al., 2003a, 2003b). This arid phase continued up to 4100 cal yr BP, when transition from fluvial to a lacustrine system began leading to the formation of numerous lakes in the Ganga Basin including the Chandrika Devi lake. EM4 decreases to zero at ~4100 cal yr BP, and EM2, %CaO and %P increase rapidly during this period. The δ13Corg indicates C4-type grassland vegetation in this interval. The pollen sequence (CDA zone II) also indicates the presence of open grasslands during ~5060–41,200 cal yr BP dominated by Poaceae, Cyperacea (wetland taxa), Cheno/Ams, Euphorbiaceae, along with arboreal taxa like Acacia, which is majorly found in dry environments (Figure 5). Thus, the time period between 5000 and ~4100 cal yr BP can be considered transition from riverine to lacustrine environment in the Chandrika Devi lake.
At ~4100 cal yr BP the fluvial influence became nearly insignificant (EM4 = ~ 0, CaO, P, Cyperaceae increase significantly ). This event of transition from fluvial to lacustrine closely corresponds to the 4.2 ka event recorded across the northern hemisphere and a decrease in ISM wind intensity (Drysdale et al., 2006; Gupta et al., 2003; Overpeck et al., 1996; Staubwasser et al., 2003). The continental records from Tso Moriri lakealso show monsoon weakening at this time (Dutt et al., 2018). This period in the Central Ganga Basin has been characterised by decreasing pollen percentages in the lakes, characteristic of grassland vegetation as seen in the pollen records of Karela Jheel, Sanai Tal, Mesa Tal and ostracod and gastropod counts of Sanai and Misa Tal (Chauhan et al., 2015; Misra et al., 2019; Saxena et al., 2011; Sharma et al., 2006), decrease in coarse silt percentage in the Lilaur lake (Figure 6) (Singh et al., 2022) The phytolith records of Karela Jheel shows a decreasing lake level during this period (Tripathi et al., 2017 ).
Phase II (4100–3000 cal yr BP)
This phase can be considered as the beginning of a semi-enclosed lacustrine system following the ~4.2 ka arid event, characterised by high EM3, EM2, Zr/Al, decreasing Ti/Al, featured with fairly constant CaO (%) and P (%), along with dominantly C3-type vegetation. Arboreal moist deciduous taxa like Barringtonia dominate the pollen sequence, Azadirachta, Terminalia, Sapotaceae indicating a moderate warm phase up to ~3000 cal yr BP with moderate ISM precipitation. This is corroborated by high coarse silt fraction in the Lilaur lake from 3730 to 3070 cal yr BP (Singh et al., 2022) (Figure 4). In general, our data shows anti-correlation with the records from the Central Himalaya (Bedikund lake and Dharamjali cave) (Figure 6) indicating that westerlies may have been the main moisture source to the Central Himalayan lakes while ISM rainfall mainly contributed to the water budget in the Central Ganga Basin. These constituent ratios and abundances point to a peak in the arid phase in the Chandrika Devi lake during ~3200–3000 cal yr BP (Figure 4). This phase corresponds with increased ENSO activity in the Indo-Pacific region (Moy et al., 2002).
Phase III (3000 cal yr BP–75 cal yr BP)
Phase III can be considered a completely closed lacustrine system. The proxy fluctuations during this time period are direct indicators of ISM variability. This phase is characterised by fine fraction deposition (clay and silt) which is defined by EM1, high Rb/Sr, Fe/Mn ratios, and TOC (%). It explains the low energy condition of the lake due to weak ISM (Saxena and Singh, 2017; Singh et al., 2015, 2022). In general, the lake behaves as a small scale closed system where organic matter precipitation occurs during oxic conditions, and its preservation occurs in anoxic conditions. The close phase lacustrine activity began at ~3000 cal yr BP, characterised by the onset of anoxia. The δ13Corg value indicates C4-type vegetation dominated at ~3000 cal yr BP. The initiation of the close phase lacustrine environment in the Chandrika Devi lake is contemporaneous with the origin of the Hulas Khera archaeological site near Karela Jheel (~3200 cal yr BP) located to the south of Lucknow (Chakrabarti et al., 2000). The lakes of the Central Ganga Basin showed an increased rate of siltation during this period that may have been caused due either to monsoonal shifts or anthropogenic factors (Singh, 1996).
The cultural taxa dominate the pollen sequence during this time period indicating anthropogenic activity which continued upto 2590 cal yr BP (Figure 5). The phytolith records from Karela Jheel show presence of a dry lake since 2900 cal yr BP (Chauhan et al., 2015). From ~2500 cal yr BP till 1800 cal yr BP, increase in EM2, constant values of Rb/Sr, slight increase in Ti/Al, decreasing Fe/Mn and changes in δ13Corg value indicate a change from C4- to C3-dominated vegetation and return of a moist warm phase of the ISM. The pollen sequence is mainly dominated by both moist and dry deciduous taxa like Emblica officinalis, Holoptelea, Syzygium and Accacia. The aquatic taxa Potomegaton and Typha are abundant indicating a flourishing lake fuelled by ISM precipitation (Figure 4), followed by a period of weak monsoon (1550–1100 cal yr BP), during which the lake shows an increase in EM1, Fe/Mn and TOC (%). From 1500 cal yr BP onwards a persistent dry climate is seen as indicated by high EM1, low EM2, high Rb/Sr, low Ti/Al, and δ13Corg value indicating predominance of C4-type vegetation. This is corroborated by the presence of pollens of Chenopodiaceae/Amaranthaceae followed by Poaceae type grasses along with a significant amount of aquatic taxa. This suggests shrinking of lake and its subsequent transformation to a wetland like environment after 700 cal yr BP. At ~500 cal yr BP a heavy monsoon precipitation occurred and is recorded by high EM3, high Ti/Al, low Rb/Sr, and low TOC (Figure 4).
Geomorphic evolution of the Chandrika Devi Lake
The evolution of the lake from the river is a complex phenomenon. The Gomti river used to flow in a sinuous channel >6000 cal yr BP as shown from DEM images in Figure 7a. Intense precipitation during 9000–6000 cal yr BP led the river to flow in a short pathway through the present day paleochannel (Srivastava et al., 2003a., Singh et al., 2022). The river was active at the site from 5800 cal yr BP to 5000 cal yr BP (Figure 7b). With increase in aridity in the Central Ganga Basin along with neotectonic activity (8000–6000 cal yr BP), caused base level changes leading to the shifting of the river from its present paleochannel at ~5000 cal yr BP to its original channel. This led to the decrease in coarser sand fraction with simultaneous increase in finer sand fraction. This situation continued up to 4100 cal yr BP when the paleochannel became completely abandoned (Figure 7c). From 4100 cal yr BP onwards the lake started acting as a local sediment sink. During ~4100–3000 cal yr BP a moderately warm phase of monsoon was recorded in the lake as evidenced by sandy silt (EM3) dominance in the lake record. These are reworked sediments from the surrounding catchment that are deposited in the lake through sheet and rill erosion (Kumar et al., 1995). From 3000 cal yr BP deposition of sediments began in a quiet water lacustrine condition where finer sediments like very fine silt and clay could settle in the lake (Figure 7d).
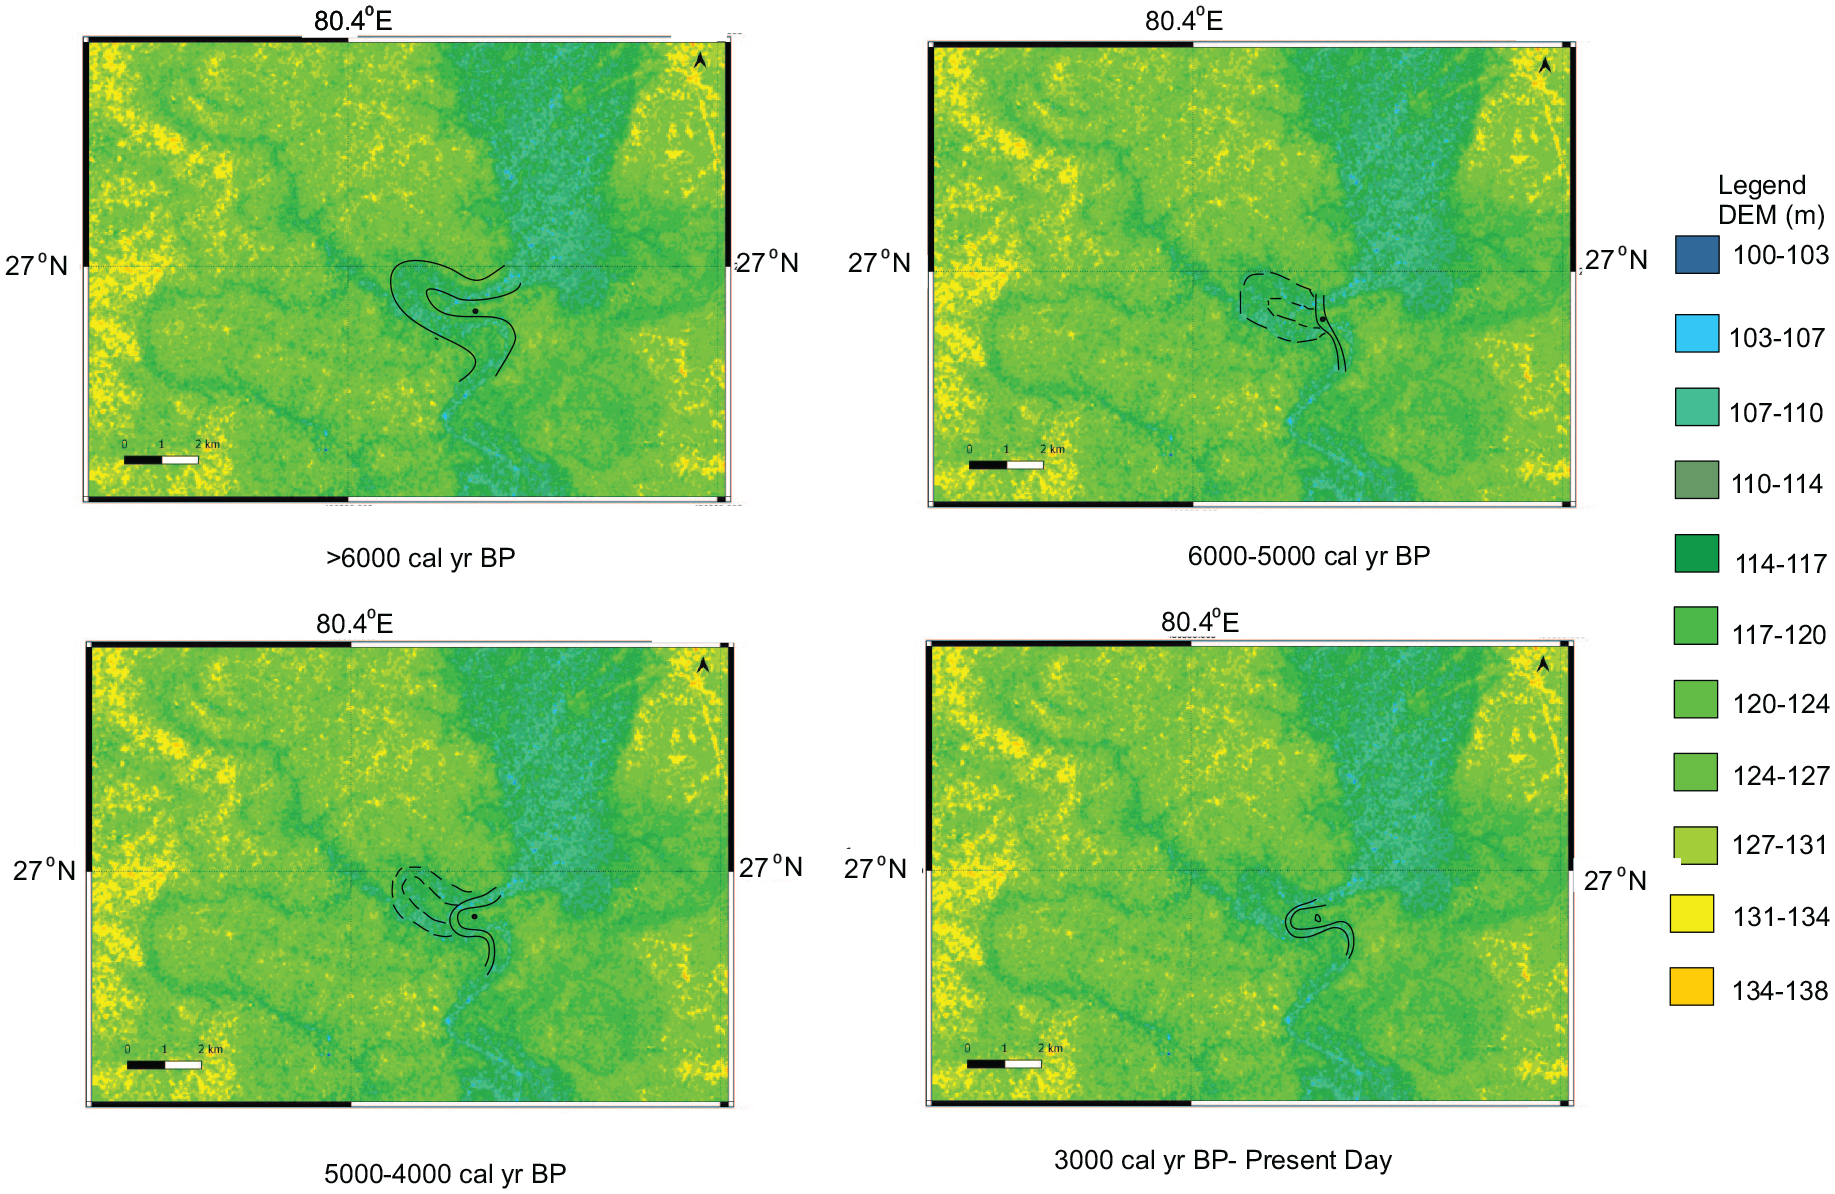
The geomorphological evolution of Chandrika Devi lake and its surrounding using the Digital Elevation Model (DEM) (a) The meandering river >6000 cal yr BP. (b) The river started flowing through the lake site by cutting off its meander (6000–5000) cal yr BP. (c) The river started going back to its initial channel leaving behind an abandoned paleochannel that became a lake ~4000 cal yr BP. (d) The river and the lake at present time.
Cultural changes in the Central Ganga Basin
The Central Ganga Basin is considered to be the cradle of Indian civilisation, following the expansion and migration of population from the plains of the Indus River. There have been numerous archaeological sites scattered all over the Ganga Basin (Gupta et al., 2006). As many as 70 Late Harappan sites, neolithic and chalcolithic sites are found all over the Ganga Basin (Sontakke and Sontakke, 2013). Hulas, Bargaon, Alamgirpur, Hetapatti, Jhunsi, Mahagara, Damdama, Lahuradewa, Mahadaha, Lal Quila, Atranjikheda, Malhar, Koldihwa, Tokwa, Hulaskhera are a few examples (Chauhan et al., 2015; Lukacs and Pal, 2003; Pandey, 1990; Pokharia, 2008; Pokharia et al., 2009; Pokharia, 2011; Pokharia et al., 2017; Sontakke and Sontakke, 2013; Tewari et al., 2006). The Late Harappan phase is also known as the deurbanization phase where urban settlements like Lothal, Kalibagnan, Mohenjodaro were abandoned in northwestern India and small-scale rural settlements were developed towards the eastern part of the Indian subcontinent especially in the Ganga Basin (Dutt et al., 2019; Gupta et al., 2006; Vahia and Yadav, 2011). The Late Harappan sites (encompassing 3900–3000 cal yr BP) initially concentrated in the upper part of the Ghagggar Hakra river, but later shifted towards Ganga-Yamuna doab and east due to decreasing precipitation in northwestern India (Giosan et al., 2012; Gupta et al., 2006., Dutt et al., 2019). Lakes became a source of freshwater for agriculture, irrigation, pasture and domestic purposes (Sharma, 1973). The high percentage of microcharcoal and agricultural taxa like Cerealia, Caryophyllaceae, etc. with the beginning of the semi enclosed lacustrine phase after ~4100 cal yr BP, suggests early human settlements in the Chandrika Devi lake region of the Central Ganga Basin during this time (Figure 5). The human induced forest fires may have been caused due to the clearing of the forest land for agricultural activity. since subsistence of population shifts from hunting-gathering to farming and pastoralism when the climate shifted from arid to a humid phase.
Even though Lucknow has a rich past, very little has been known about the ancient history of this region; the present study sheds light to this aspect. The archaeological mounds near Misa Taal in Lucknow show that human habitation took place in the region at least 2 millennia ago (Chauhan and Chatterjee, 2008). The neolithic site of Hulaskhera, located nearby, shows the beginning of civilisational structure ~3000 cal yr BP belonging to Northern Black Redware Culture (NBRW) (Chauhan et al., 2015). The human habitation and agricultural activity near Chandrika Devi lake suggests that the human settlements in the Lucknow region occurred about ~1000 years prior to NBRW. At ~3000 cal yr BP, with the beginning of full-fledged lacustrine activity in the Chandrika Devi lake, spikes in microcharcoal and cultural pollen taxa are seen (Figure 5). The archaeological site of Hulaskhera near Karela Jheel began to show human habitation ~3000 cal yr BP (Chauhan et al., 2015; Tripathi et al., 2017). Our record shows a spike in agricultural activity during the same time period, thus indicating that human settlements and agriculture started just after 4000 cal yr BP and expanded throughout Lucknow and its vicinity since ~ 3000 cal yr BP. The Hulaskhera site ceased to exist at ~700 AD (1250 cal yr BP). The Chandrika Devi lake also shows a gradual decline in precipitation pattern during the same time period.
Concluding remarks
Multi proxy record from Chandrika Devi lake sheds important light on fluctuating Indian summer monsoon (ISM) variability and its impact on human population, agricultural practices and vegetation in the study region for past ~6000 years. Based on the results, following conclusions can be drawn:
The lake was initially a part of the Gomti river at ~6000 years ago. The Gomti river was a very active fluvial system from ~5900 to 5000 cal yr BP. The transition from fluvial to lacustrine began ~5000 cal yr BP, as demonstrated by decrease in grain size model EM4, the dominance of C4-type vegetation in the lake profile and the presence of Poaceae type grassland pollen along with dry deciduous taxa like Acacia. This correlates with the beginning of aridity in the Central Ganga Basin at ~5000 cal yr BP, coinciding with the southward migration of the Inter Tropical Convergence Zone (ITCZ) by increased northward cross equatorial heat flux thereby causing a weak ISM.
The transition from a fluvial to lacustrine phase was completed by ~4100 cal yr BP as evidenced by the drop in EM4, increase in CaO, P, C4-type vegetation and presence of dry deciduous taxa and expansion of Pediastrum corresponding to the 4.2 ka arid event.
A moderate ISM precipitation is recorded in the lake from ~4100–3000 cal yr BP followed by a dry phase since ~3000 cal yr BP.
The lake profile records the agricultural pattern and population shift in the region. The beginning of agricultural activity and human settlements in the region can be dated at ~4100 cal yr BP, as indicated by the presence of Cerealia, Caryophyllaceae, Urticaceae, Artemisia and microcharcoal. This indicates a possible climate and population linkage whereby population shifts towards agriculture and pastoralism after a dry climatic phase followed by return of humid conditions. At ~3000 cal yr BP a spike in agricultural taxa and microcharcoals indicate spread of population in the entire region as the nearby archaeological sites like Hulaskhera shows signs of human settlements.
Supplemental Material
sj-pdf-1-hol-10.1177_09596836241247310 – Supplemental material for Palaeoclimatic shifts in the Central Ganga Basin during the Middle- to Late Holocene: Exploring the 4.2 ka arid event and its implications in northern India
Supplemental material, sj-pdf-1-hol-10.1177_09596836241247310 for Palaeoclimatic shifts in the Central Ganga Basin during the Middle- to Late Holocene: Exploring the 4.2 ka arid event and its implications in northern India by Sreya Sengupta, Anil K Gupta, Manoj Kumar Jaiswal, Pankaj Kumar, Prasanta Sanyal, Shilpa Pandey, Dhruv Sen Singh, Arun Kaushik, Anoop Kumar Singh, Biswajit Palar, Rajveer Sharma and Vartika Singh in The Holocene
Footnotes
Acknowledgements
AKG thanks the Science and Engineering Research Board, Department of Science and Technology, Government of India for the Sir J C Bose fellowship (JBR/2021/000019). SS thanks IIT Kharagpur for providing the fellowship. SP thanks the Director, BSIP, Lucknow for permission and support for palynological analysis. Authors would also like to thank the anonymous reviewers for their inputs.
Data availability
Data will be made available on request.
Funding
The author(s) disclosed receipt of the following financial support for the research, authorship, and/or publication of this article: This study was supported by the Science and Engineering Research Board, Department of Science and Technology, Government of India as Sir J C Bose fellowship to AKG (JBR/2021/000019). SS also thanks the financial support from the Ph.D. program of IIT Kharagpur.
Supplemental material
Supplemental material for this article is available online.
References
Supplementary Material
Please find the following supplemental material available below.
For Open Access articles published under a Creative Commons License, all supplemental material carries the same license as the article it is associated with.
For non-Open Access articles published, all supplemental material carries a non-exclusive license, and permission requests for re-use of supplemental material or any part of supplemental material shall be sent directly to the copyright owner as specified in the copyright notice associated with the article.