Phytoliths in bamboos from eastern and north-eastern India: Implications in distinguishing different ecoclimatic conditions and in deciphering Late Holocene climate variability
Available accessResearch articleFirst published online November, 2024
Phytoliths in bamboos from eastern and north-eastern India: Implications in distinguishing different ecoclimatic conditions and in deciphering Late Holocene climate variability
To develop a phytolith (biogenic silica) reference and to understand the eco-climatic indicative values of some grass silica short cells (GSSCs) occurring in the bamboos (Bambusoideae grasses), one of the chief floral components of eastern and north-eastern parts of India, we studied 44 modern bambusoid grasses and 26 surface soils from different eco-climatic zones covering both the plains and mountainous regions. Of the diverse phytoliths retrieved from the bamboos, Saddle tall and Saddle collapsed were the most abundant types (except in Yushania maling) and these types were also common in surface soil phytolith assemblages of the eastern and north-eastern parts of India. To assess the environmental sensitivity of most consistent morphotypes, we categorized two commonly occurring GSSC morphotypes namely Saddle tall into three groups based on their length and Saddle collapsed into two groups based on their length to width ratio respectively. Pearson’s correlation analysis, principal component analysis (PCA), and redundancy analysis (RDA) were used to understand if these morphotypes could distinguish different eco-climatic conditions. Variability of Saddle tall and Saddle collapsed types (both morphometric and abundance) in bamboos growing in these parts of India is a function of mean precipitation of the wettest quarter (MPWeQ) and mean temperature of the driest quarter (MTDQ). The present results served as a baseline for reevaluating the interpretations of a Late-Holocene fossil phytolith record from the eastern Himalaya further validating the potential of Saddle tall and Saddle collapsed types in reconstructing past climate variability in a wide geographical region.
Biogenic silica, also referred to as biogenic opal or amorphous opaline silica, is the silicon dioxide (SiO2) that originates through some biological processes and are one of most widespread biogenic minerals (Conley and Schelske, 2002). Different groups of organisms like diatoms (frustules), higher plants (phytoliths), radiolarians (scleracomas), and some sponges (spicules of the glass sponges) develop biogenic silica (Boardman et al., 1987; Clarke, 2003; Twiss et al., 1969). They often have unique shapes and their study can provide with valuable insight into past ecological and environment conditions. After radiolarians and diatoms, phytoliths are the most diversified form of biogenic silica (Biswas et al., 2016, 2021; Liu et al., 2021; Piperno, 2006). These microscopic opaline silica bodies are deposited in and between plant cells (Twiss et al., 1969). Though some trace elements may be present in phytoliths along with occluded carbon, the basic chemical composition is the same: SiO2, nH2O. Variation in the amount of water and occluded carbon incorporated in the amorphous silica matrix results in a broad particle density ranging from 1.50 to 2.30 g/cm3 (Jones and Beavers, 1963).
Among the different grass subfamilies, members of all the Bambusoideae subfamily (Bamboos) accumulate hydrated amorphous silica (SiO2.nH2O) in high amounts and thus, create an organic silicon pool which plays an important role in the global silicon cycle (Li et al., 2006). Bambusoideae are diverse and the only Poaceae subfamily containing both woody and herbaceous taxa (Soderstrom and Calderon, 1979). They are part of the BOP clade (Bambusoideae, Oryzoideae, and Pooideae) with 127 genera and 1700 species distributed worldwide (Bamboo Phylogeny Group (BPG), 2012; Clark and Oliviera, 2018; Grass Phylogeny Working Group II, 2012; Group et al., 2001; Soreng et al., 2015, 2022). Except for Antarctica and Europe, bamboos are found in every continent of the globe (Liese and Hamburg, 1987). But maximum diversity of species is seen in tropical forests of south and south-east Asia followed by South America and Africa (Bystriakova et al., 2003). The members of this subfamily are one of the dominant elements of tropical forests, but they are also present in other forest types extending from tropical to sub-alpine zones up to an elevation of 4000 m a.s.l. under suitable mean annual temperature (between MAT 5 and 25°C), mean annual precipitation (MAP between 1000 and 6350 mm), and soil pH (4.5–7) conditions (Clark et al., 2015; Tewari et al., 2019; Thokchom and Yadava, 2015).
In India approximately 29 genera and 148 species of Bambusoideae grasses are found including both the wild and cultivated types (Motomura et al., 2006). Most of the species are found in moist deciduous and semi-evergreen forests of north-east India and the tropical moist deciduous forests of east, north and southern India (Sharma and Nirmala, 2015). Among the 148 species, 90 species belonging to 17 genera grow naturally or are cultivated in the eastern and north-eastern parts of the country which is considered as a bamboo hotspot (National Bamboo Mission, 2008). Three tribes under Bambusoideae subfamily are found are found in India, among which tribes Bambuseae (tropical woody bamboo) and Olyreae (herbaceous bamboo) usually grow in tropical to sub-tropical forests in hot and humid environmental conditions and the tribe Arundinarieae (temperate bamboo) are found mostly in cool temperate regions (Zhang et al., 2020).
We have collected dominant Bambusoideae grasses and surface soil samples from both the Himalayan region and its peripheral plains of the eastern and north-eastern India to understand the relationship between phytoliths occurring in these grasses and climate parameters influencing the production pattern. We aim to assess whether surface soil phytolith spectra indicate the same climatic signal as phytoliths from modern grasses. Results of this study have been used as a baseline to reevaluate an earlier published regional fossil phytolith record (Ghosh et al., 2018) and to reconstruct past climate more precisely providing new insights into regional fossil phytolith data and strengthening the paleoclimatic reconstructions (Biswas et al., 2021; Ghosh et al., 2011, 2018). The objectives of the present study are: i. to develop a detailed phytolith reference collection of the eastern and north-eastern Indian Bambusoideae grasses, ii. to determine whether bamboos growing in different vegetation-climatic zones can be distinguished based on their phytolith spectra, and iii. to determine the most important climatic parameter(s) influencing the phytolith production of these grasses.
Materials and methods
Study area
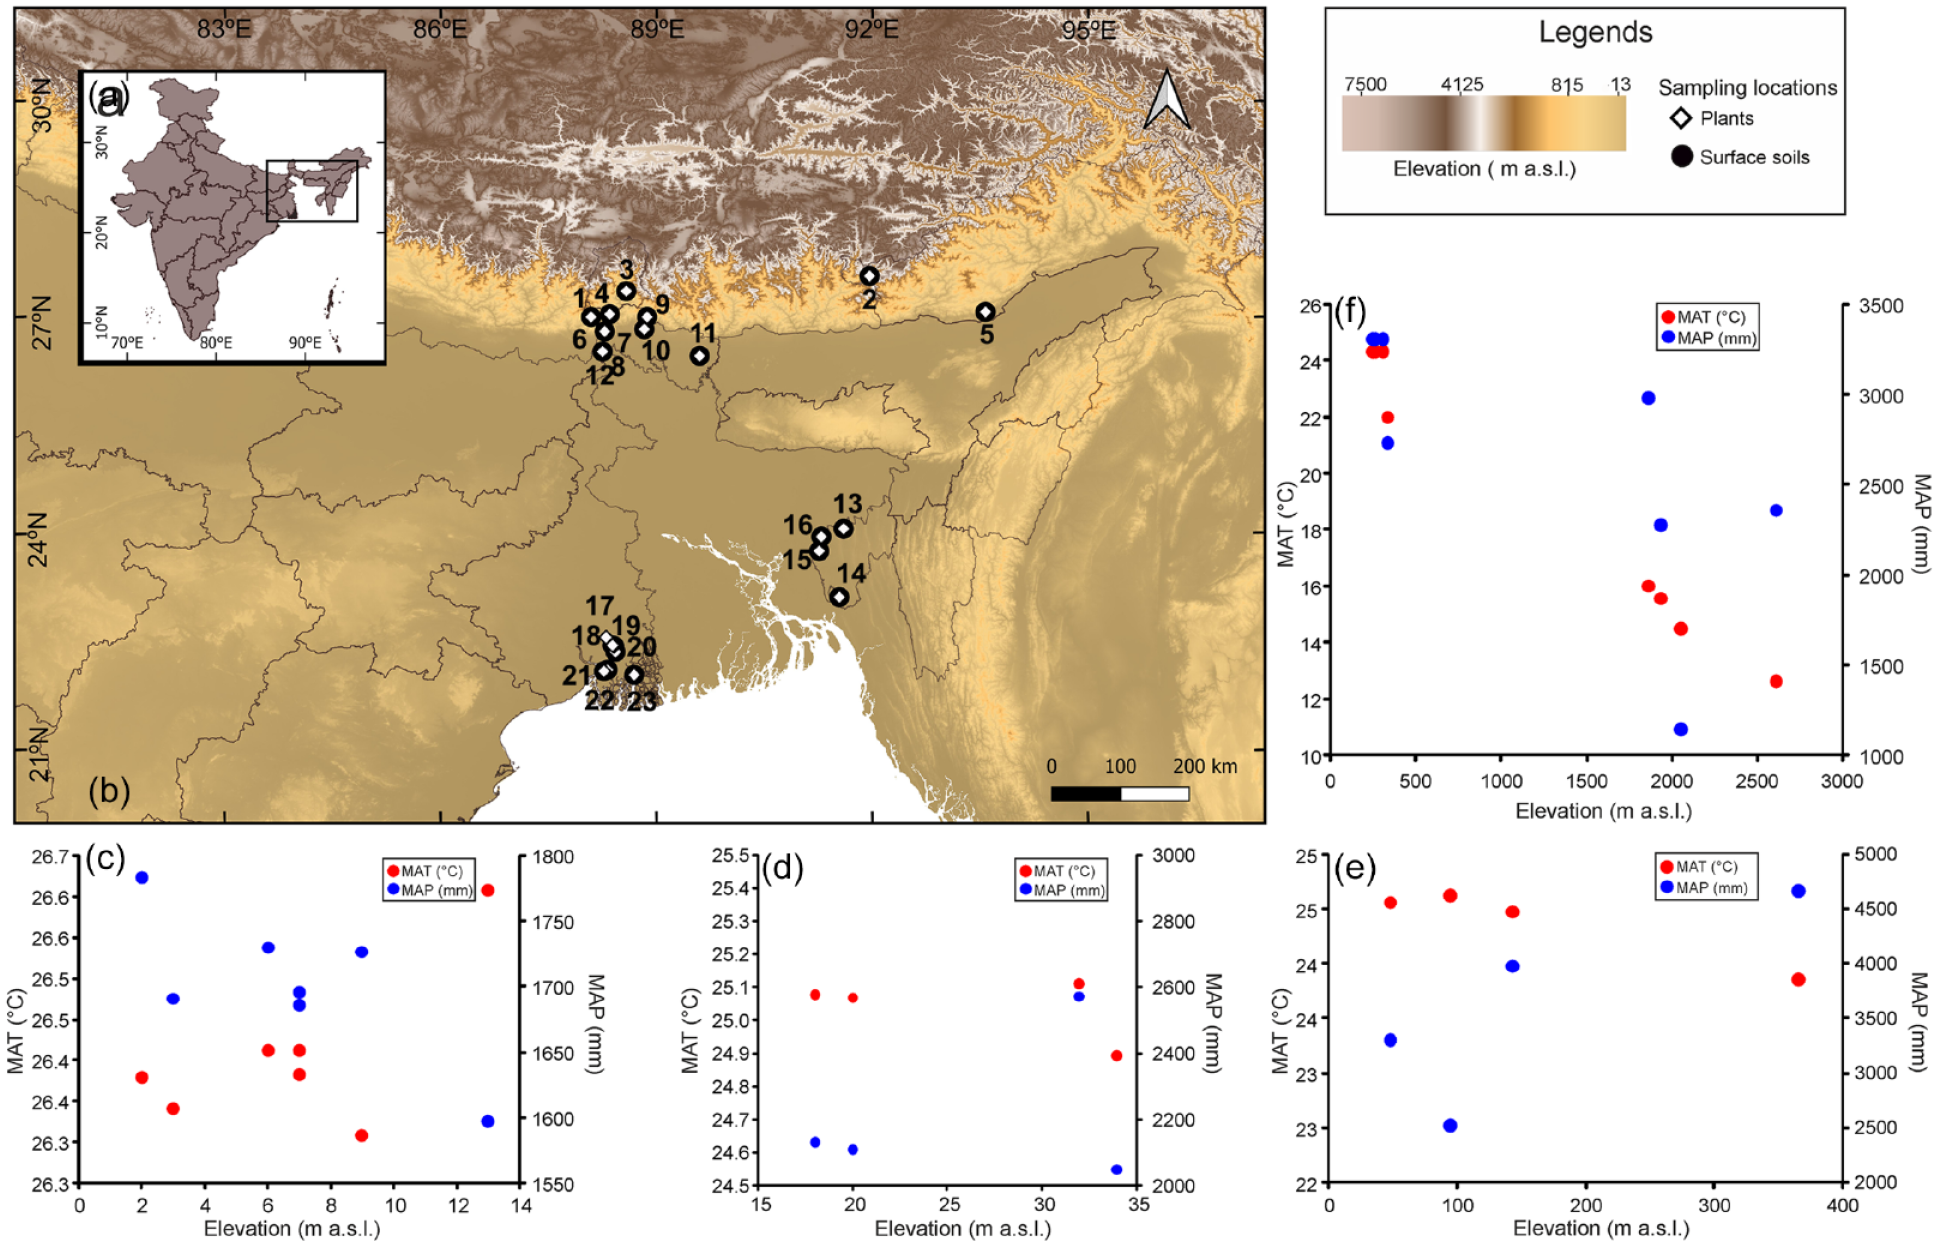
In India, 66% of the total bamboo diversity is concentrated in the eastern and north-eastern parts of the country (Adkoli, 2002). The eastern and north-eastern parts encompass some parts of the Himalayan Mountains (e.g. eastern Himalaya) as well as plains (e.g. Bengal Basin). We collected the leaves of the living bamboo grasses and associated surface soil/sediment samples from these eco-climatically different regions (Table 1, Figure 1).
Temperate forests and open grazing areas up to an elevation of 2800 m
2
Bambusa sp.
Bambuseae
Jang, Arunachal Pradesh
2064
27.58°N 91.96°E
14.5
1141
Various habitat
3
Thamnocalamus spathiflorus (Trin.) Munro
Arundinarieae
Pangthang, Sikkim
1941
27.37°N 88.58°E
15.6
2273
Forms thickets in damp areas in cedar, oak and fir forests; prefers growing on steeply sloping sites
4
Arundinaria racemosa Munro
Arundinarieae
Lamahatta, Darjeeling
1870
27.05°N 88.35°E
16.0
2978
Uncommon, undergrowth of coniferous forests
5
Bambusa longispiculata Gamble
Bambuseae
Ganga lake, Arunachal Pradesh
334
27.08°N 93.57°E
22.0
2730
In shaded places of the forest and along road side
6
Dendrocalamus strictus (Roxb.) Nees
Bambuseae
Bamonpokhri, Darjeeling
304
26.81°N 88.28°E
24.3
3304
In forest and forest edges; cultivated at an altitude of 1000 m
7
Bambusa nutans Wall. ex Munro
Bambuseae
Rungchung, Darjeeling
259
26.81°N 88.28°E
24.3
3304
In forest and forest edges; common, cultivated in the Tarai regions and in Darjeeling between 300–1500 m altitude
8
Dendrocalamus hamiltonii Nees & Arn. ex Munro
Bambuseae
Rakhtikhola, Darjeeling
254
26.81°N 88.28°E
24.3
3304
Usually found in forested area; often found on the bank of the streams in the North Bengal
Bengal Basin
9
Bambusa sp.
Bambuseae
Chapramari, Jalpaiguri (NBB)
367
27.01°N 88.87°E
23.9
4663
Various habitat
10
Bambusa sp.
Bambuseae
Murti river forest, Jalpaiguri (NBB)
144
26.84°N 88.83°E
24.5
3986
Various habitat
11
Bambusa sp.
Bambuseae
Charmile, Jalpaiguri (NBB)
48
26.47°N 89.60°E
24.6
3292
Various habitat
12
Bambusa sp.
Bambuseae
Bidhannagar, Jalpaiguri (NBB)
96
26.53°N 88.25°E
24.6
2515
Various habitat
13
Melocanna baccifera (Roxb.) Kurz
Bambuseae
Khowai, Tripura (EBB)
34
24.07°N 91.60°E
24.9
2051
Occurs in vast stands, usually on hilly ground, common in deciduous forest
14
Bambusa nutans Wall. ex Munro
Bambuseae
Haripur, Tripura (EBB)
32
23.12°N 91.54°E
25.1
2574
In the forest and forest edges
15
Bambusa balcooa Roxb.
Bambuseae
Haripur, Tripura (EBB)
32
23.12°N 91.54°E
25.1
2574
In forest and forest edges; often grow in moist soil
16
Bambusa vulgaris Schrad.
Bambuseae
Haripur, Tripura (EBB)
32
23.12°N 91.54°E
25.1
2574
Prefers lowland humid habitats, commonly cultivated as an ornamental plant
17
Bambusa cacharensis R.B. Majumdar
Bambuseae
Haripur, Tripura (EBB)
32
23.12°N 91.54°E
25.1
2574
Cosmopolitan
18
Bambusa jaintiana R.B. Majumdar
Bambuseae
Suryamaninagar, Tripura (EBB)
20
23.76°N 91.26°E
25.1
2108
Usually cultivated
19
Bambusa tulda Roxb.
Bambuseae
Suryamaninagar, Tripura (EBB)
20
23.76°N 91.26°E
25.1
2108
Often grows as undergrowth, scattered or in patches in the forest; Prefers moist environment with a lot of rainfall
20
Bambusa bambos (L.) Voss
Bambuseae
Suryamaninagar, Tripura (EBB)
20
23.76°N 91.26°E
25.1
2108
It prefers lowland humid habitats, but tolerates a wide range of climatic conditions and soil types. Commonly found along river banks, roadsides and open ground.
21
Bambusa polymorpha Munro
Bambuseae
Suryamaninagar, Tripura (EBB)
20
23.76°N 91.26°E
25.1
2108
Grows in semi-humid areas on deep, fertile, well-drained alluvial and loamy soil and occurs on low hill slopes along valleys, mixed with deciduous forests and among teak
22
Bambusa multiplex (Lour.) Raeusch. ex Schult.
Bambuseae
Suryamaninagar, Tripura (EBB)
20
23.76°N 91.26°E
25.1
2108
Cultivated up to 1500 m in open moist soil and in shady places
23, 24
Bambusa vulgaris Schrad.
Bambuseae
Suryamaninagar, Tripura (EBB; collected twice)
20
23.76°N 91.26°E
25.1
2108
It prefers lowland humid habitats, commonly cultivated as an ornamental plant; common in moist places
25
Dendrocalamus longispathus (Kurz) Kurz
Bambuseae
Suryamaninagar, Tripura (EBB)
20
23.76°N 91.26°E
25.1
2108
Usually found in deciduous forests
26
Dendrocalamus hamiltonii Nees & Arn. ex Munro
Bambuseae
Suryamaninagar
20
23.76°N 91.26°E
25.1
2108
Usually found in forested area
27
Gigantochloa nigrociliata (Buse) Kurz
Bambuseae
Suryamaninagar, Tripura (EBB)
20
23.76°N 91.26°E
25.1
2108
Found along streams and on lower slopes up to 600 m
28
Melocalamus compactiflorus (Kurz) Benth.
Bambuseae
Suryamaninagar, Tripura (EBB)
20
23.76°N 91.26°E
25.1
2108
Found in mixed deciduous forest up to 2000 m
29
Thyrsostachys oliveri Gamble
Bambuseae
Suryamaninagar, Tripura (EBB)
20
23.76°N 91.26°E
25.1
2108
At the edge of the deciduous forests in low hills or in open areas
30
Bambusa pallida Munro
Bambuseae
Bamuntia, Tripura (EBB)
20
23.76°N 91.26°E
25.1
2129
Usually cultivated
31
Dendrocalamus membranaceus Munro
Bambuseae
Shibpur, Deltaic Bengal (SBB)
13
22.56°N 88.30°E
26.6
1597
An undergrowth plant in dry/moist tropical and subtropical broadleaf forests, montane rain forest and semi-evergreen rain forest
32
Dinochloa andamanica Kurz
Bambuseae
Shibpur, Deltaic Bengal (SBB)
13
22.56°N 88.30°E
26.6
1597
Mostly occurs as impenetrable tangled thickets and often climbing on the tall trees
33, 34
Bambusa vulgaris Schrad.
Bambuseae
Shibpur, Deltaic Bengal (SBB; collected twice)
13
22.56°N 88.30°E
26.6
1597
It prefers lowland humid habitats, commonly cultivated as an ornamental plant; common in moist places
35
Cephalostachyum pergracile Munro
Bambuseae
Shibpur, Deltaic Bengal (SBB)
13
22.56°N 88.30°E
26.6
1597
Mixed deciduous forests, often growing with teak
36
Gigantochloa robusta Kurz
Bambuseae
Shibpur, Deltaic Bengal (SBB)
13
22.56°N 88.30°E
26.6
1597
Commonly cultivated
37
Bambusa oliveriana Gamble
Bambuseae
Shibpur, Deltaic Bengal (SBB)
13
22.56°N 88.30°E
26.6
1597
Commonly found in Mizoram
38
Thyrsostachys siamensis Gamble
Bambuseae
Shibpur, Deltaic Bengal (SBB)
13
22.56°N 88.30°E
26.6
1597
It prefers lowland humid habitats. Commonly cultivated as an ornamental plant
39
Bambusa vulgaris Schrad.
Bambuseae
Baruipur, Deltaic Bengal (SBB)
9
22.36°N 88.43°E
26.3
1727
Prefers lowland humid habitats, commonly cultivated as an ornamental plant
40
Bambusa tuldoides Munro
Bambuseae
Sonarpur, Deltaic Bengal (SBB)
7
22.44°N 88.41°E
26.4
1696
Ornamental bamboo
41
Dinochloa macclellandii (Munro) Kurz
Bambuseae
Narendrapur, Deltaic Bengal (SBB)
7
22.45°N 88.39°E
26.4
1686
Wet places, hillsides, roadsides
42
Dendrocalamus giganteus Munro
Bambuseae
Laxmikantapur, Deltaic Bengal (SBB)
6
22.11°N 88.32°E
26.4
1730
Large arboreal bamboo. Cultivated for various purposes
43
Bambusa vulgaris Schrad.
Bambuseae
Mollarchawk, Deltaic Bengal (SBB)
3
22.09°N 88.27°E
26.3
1691
Prefers lowland humid habitats, commonly cultivated as an ornamental plant
44
Bambusa tulda Roxb.
Bambuseae
Jharkhali, Deltaic Bengal (SBB)
2
22.04°N 88.69°E
26.4
1784
Often grows as undergrowth scattered or in patches in the forest; Prefers moist environment with a lot of rainfall
MAT: Mean Annual Temperature; MAP: Mean Annual Precipitation; NBB: northern part of Bengal Basin; EBB: eastern part of Bengal Basin; SBB: southern part of Bengal Basin.
Compilation showing (a) map of India with study area (marked with black box), (b) digital elevation map showing sampling locations from different parts of the Bengal Basin (BB) and eastern Himalaya [1 = Lamaydhura, 2 = Jang, 3 = Pangthang, 4 = Lamahatta, 5 = Ganga lake, 6 = Bamonpokhri, 7 = Rungchung, 8 = Rakhtikhola, 9 = Chapramari, 10 = Murti river forest, 11 = Charmile, 12 = Bidhannagar, 13 = Khowai, 14 = Haripur, 15 = Suryamaninagar, 16 = Bamuntia, 17 = Shibpur, 18 = Baruipur, 19 = Sonarpur, 20 = Narendrapur, 21 = Laxmikantapur, 22 = Mollarchawk, 23 = Jharkhali]; variations of mean annual temperature (MAT, marked with red dots) and mean annual precipitation (MAP, marked with blue dots) along elevation gradients (data from WorldClim2; 75) of (c) southern part of the BB, (d) eastern part of the BB, (e) northern part of the BB and (f) the eastern Himalaya [MAT and MAP data is given Table 1].
The eastern Himalaya (EH) extends from Kaligandaki valley in Nepal to northwestern Yunnan, China, and northern Mayanmar (Sharma et al., 2009). In India it covers the north-eastern states and the hilly terrains of West Bengal with a warm and humid tropical climate with moderate winters in the foothill regions of the eastern Himalaya with mean annual temperature (MAT) ranging between 20°C and 25°C. In the higher mountains, climatic conditions change to cool summers and chilly winters with MAT ranging between 0.5°C and 6°C. The eastern Himalaya receives heavy rainfall from the Bay of Bengal (BoB) branch of the Indian Summer Monsoon (ISM). The mean annual precipitation (MAP) ranges between 2000 and 5000 mm in the foothills and 500–1000 mm in the higher mountains (Fick and Hijmans, 2017).
The Bengal Basin (BB) is a peripheral foreland basin bounded in the west by the Chhota Nagpur Plateau and Rajmahal hills, in the north by the Himalayan foothills, in the northeast by the Meghalaya Plateau and in the east by Manipur-Tripura hills. It is one of the largest sedimentary basins of the world covering the states of West Bengal, Meghalaya, Assam, Tripura, and Nagaland (Banerji, 1984) supporting a warm, high rainfall tropical climate. The MAT ranges between c. 8°C and 31°C with rainfall deriving mainly from the BoB branch of the ISM. The western part of the basin is drier than its eastern part due to the orographic effect of the Chotanagpur plateau. However, because of presence of the Himalaya in the northern side, foothill regions receive high rainfall, between 2000 and 3000 mm (Dikshit and Dikshit, 2014; Ghosh et al., 2021). Forests in the northern and eastern part of the basin (NBB and EBB respectively) are tropical moist deciduous to semi-evergreen types and in the western part dry-deciduous forests prevail. The southern part of the BB (SBB) contains littoral and swampy forests (Champion and Seth, 1968). Detailed forest types for every sampling location along with the dominant bambusoideae grasses growing in the region are given in S 2.1.
Sample collection
In eastern and north-eastern India around 20 genera of Bambusoideae are found and we have studied 11 genera belonging to 44 taxa. Among the 11 genera, 3 genera (Yushania, Arundinaria and Thamnocalamus) belong to tribe Arundinarieae and 8 genera (Bambusa, Dendrocalamus, Melocanna, Gigantochloa, Melocalamus, Cephalostachyum, Thyrsostachys, and Dinochloa) belong to the tribe Bambuseae. Out of 44 taxa, 8 taxa were collected from the eastern Himalayan region: Darjeeling, Arunachal Pradesh, and Sikkim and 36 taxa from northern (Jalpaiguri, West Bengal), southern (i.e. deltaic Bengal), and eastern (Tripura) parts of Bengal. These samples were collected along an elevation gradient to account for the climatic variations experienced at different altitudes.
Additionally, 26 surface soil/sediment samples were also collected from undisturbed lake beds and forested areas where modern plant specimens were collected. While collecting the surface soil/sediment samples, litter was removed in order to avoid contamination. Details of sampling locations of both modern grasses and surface samples are presented in Table 1 and Supplemental Table S1.
We also recounted the phytolith data of an earlier published fossil phytolith record from the Sixth Mile sedimentary profile (SMP), eastern Himalaya (Darjeeling) focusing on subcategorization of Saddle tall and Saddle collapsed. The profiling was done from dried lake bed located in the temperate region of Darjeeling Himalaya inside an open wood (27°0145.24″N; 88°1918.71″E) which covers the depositional history of the last c. 2.4 ka (Ghosh et al., 2018). The profile was 70 cm deep comprising of alternative layers of compact blackish carbonaceous clay with fine silt and sand (10–30 cm and 60–70 cm) and grayish clayey silt with profuse sand fraction (40–60 cm).
Phytolith analyses and nomenclature
Phytolith extraction from modern plants and surface soils/sediments was done following the protocol of Pearsall (2000). The modern plant specimens were washed with distilled water to remove the debris, followed by drying at 60°C in hot air oven for 30–40 min. The dried samples were treated with Schulze`s solution (conc. HNO3 + NaClO3 in 3:1 ratio) until the reaction ceased. Then they were allowed to cool. The treated samples were centrifuged with distilled water at 3000 rpm for 15 min and the pellets were obtained. The pellets were made acid free by repeated washing with distilled water and the supernatant was decanted off. Finally, the pellets obtained were stored in storage vials for microscopic study.
For surface soils/sediments, 10 gm of every sample was crushed and homogenized with mortar and pestle. The crushed samples were then oxidized with freshly prepared conc. hydrochloric acid and nitric acid mixed in a ratio of 1:1 in water bath for 10 min. After boiling, the acid treated samples were cooled and centrifuged to remove the acids via centrifugation at 3000 rpm for 10–15 min. The pellets obtained were dried in hot air oven and then treated with 30% hydrogen peroxide to completely remove the organic matter followed by repeated centrifugation with distilled water at around 3000 rpm for 10–15 min. Then the pellets were again dried properly followed by density gradient separation by using cadmium iodide and potassium iodide (specific gravity 2.3). Finally, the samples were centrifuged at 3000 rpm for 10–15 min with distilled water to completely remove the heavy liquid and residues were collected. The residues containing phytoliths were collected and stored in vials for further study. Slides were prepared using polyvinyl alcohol (PVA) and mounted in DPX.
For each sample at least 350 phytoliths were counted. Light microscopic images were taken at 40× magnification using a Zeiss Axioscope 2 microscope. For important morphotypes scanning electron microscopy was done. Phytoliths were named and classified using the International Code of Phytolith Nomenclature (ICPN) 2.0 (International Committee for Phytolith Taxonomy, 2019).
Elemental analysis
Elemental analyses of biogenic silica from bamboo were carried out using Energy Dispersive X-ray Spectroscopy (EDX) at Center for Research in Nano Science and Nanotechnology (CRNN) of University of Calcutta, Kolkata (SEM-EDX: Carl Zeiss – Evo 40) to verify the chemical authenticity of the phytolith morphotypes.
Climate data
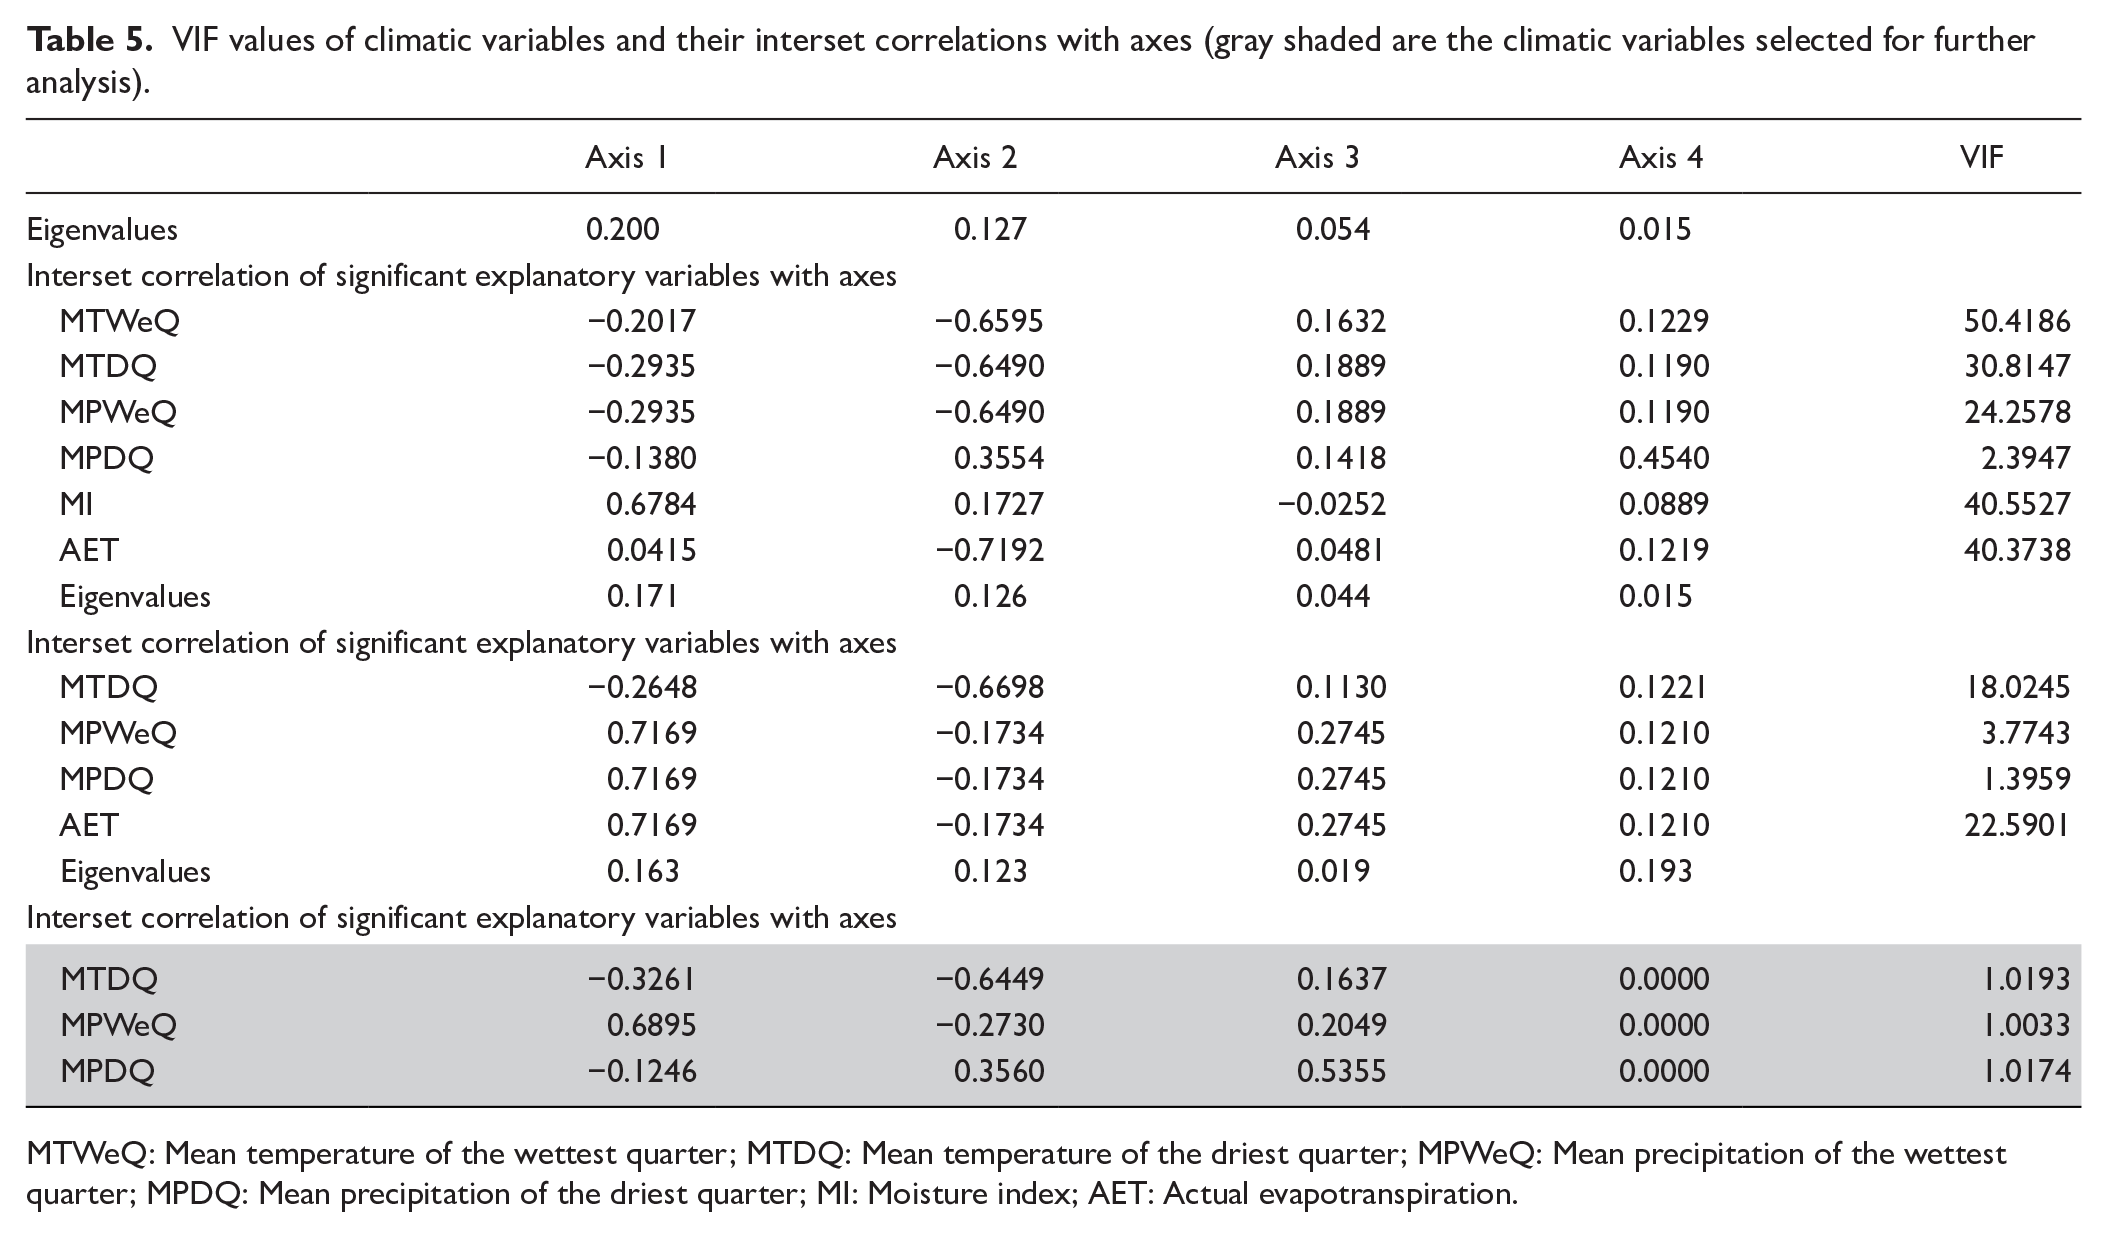
Because the IMD (Indian Meteorological Department) climatic dataset for all the sampling locations is not available, to understand modern climate and its variations within the studied region, we selected six bio-climatic variables viz., mean annual temperature (MAT), mean annual precipitation (MAP), mean temperature of the wettest quarter (MTWeQ), mean temperature of the driest quarter (MTDQ), mean precipitation of the wettest quarter (MPWeQ), and mean precipitation of the driest quarter (MPDQ) from the Worldclim Version 2 gridded dataset (Fick and Hijmans, 2017) which extends from the year 1970 to 2000 with 1 km2 spatial resolution. These bioclimatic variables are known to influence plant growth and distribution significantly. We also estimated the moisture index (MI), potential evapotranspiration (PET), and actual evapotranspiration (AET) at all locations using the formula MI = PET/MAP, where PET = MAT × 58.93 and AET = P/[0.9 + (P/L) 2]1/2 where L = 300 + 25T + 0.05T3, and P (mm) = mean annual precipitation and T (°C) = mean annual temperature (Bhattarai et al., 2004; Kluge et al., 2006; Turc, 1954). MI is inverted here for simplicity, where values <1 indicate a negative water balance, and values >1 indicate a positive water balance (Vetaas, 2000). The trends of MAT and MAP at all sites are shown in Figure 1c to f and Supplemental Table S1.
Numerical analyzes
In order to understand the relationship between phytolith morphotypes produced in Bambusoideae grasses and climatic variables (MAT, MAP, MTWeQ, MTDQ, MPWeQ, MPDQ, PET, and MI), Pearson’s correlation analysis was performed using the “corrplot” package in the RStudio v. 2022.2.1.461 (RStudio Team, 2022). Detrended correspondence analysis (DCA) was performed on the phytolith abundance data from both modern Bambusoideae grasses and modern soil/sediment samples. DCA is a multivariate method of indirect gradient analysis which arranges species (here phytoliths) and samples along environmental gradients. The gradient lengths along the first few DCA axes suggest whether a linearity (redundancy analysis, RDA) or unimodal based (canonical correspondence analysis, CCA) method would be suitable for understanding species-explanatory variable(s) interrelationships through direct gradient analysis. If the gradient length of the first axis >2 SD (standard deviation) then unimodal based methods would be suitable, but in case of gradient length <2 SD, a linearity-based method should be used.
In the present study, DCA results for modern bambusoid grasses indicate that the environmental gradient is long (>2 SD). The soil dataset’s DCA analysis, however, indicates that a linearity-based gradient analysis method (i.e. RDA; Kluge et al., 2006) would be appropriate for comprehending the impact of climatic drivers on the distribution of phytolith morphotypes in various sampling sites (Vetaas, 2006). So, RDA was applied to the dataset. The frequency of phytolith morphotypes were square root transformed and double centered and the variance inflation factor (VIF) was checked to reduce the collinearity among the climatic variables. The statistical program CANOCO version 4.5 (Lepš and Šmilauer, 2003; Ter Braak, 1986, 1988; Ter Braak and Smilauer, 2002; Ter Braak and Verdonschot, 1995) was used to perform both DCA and RDA.
Results
Phytolith spectra of modern bambusoid grasses
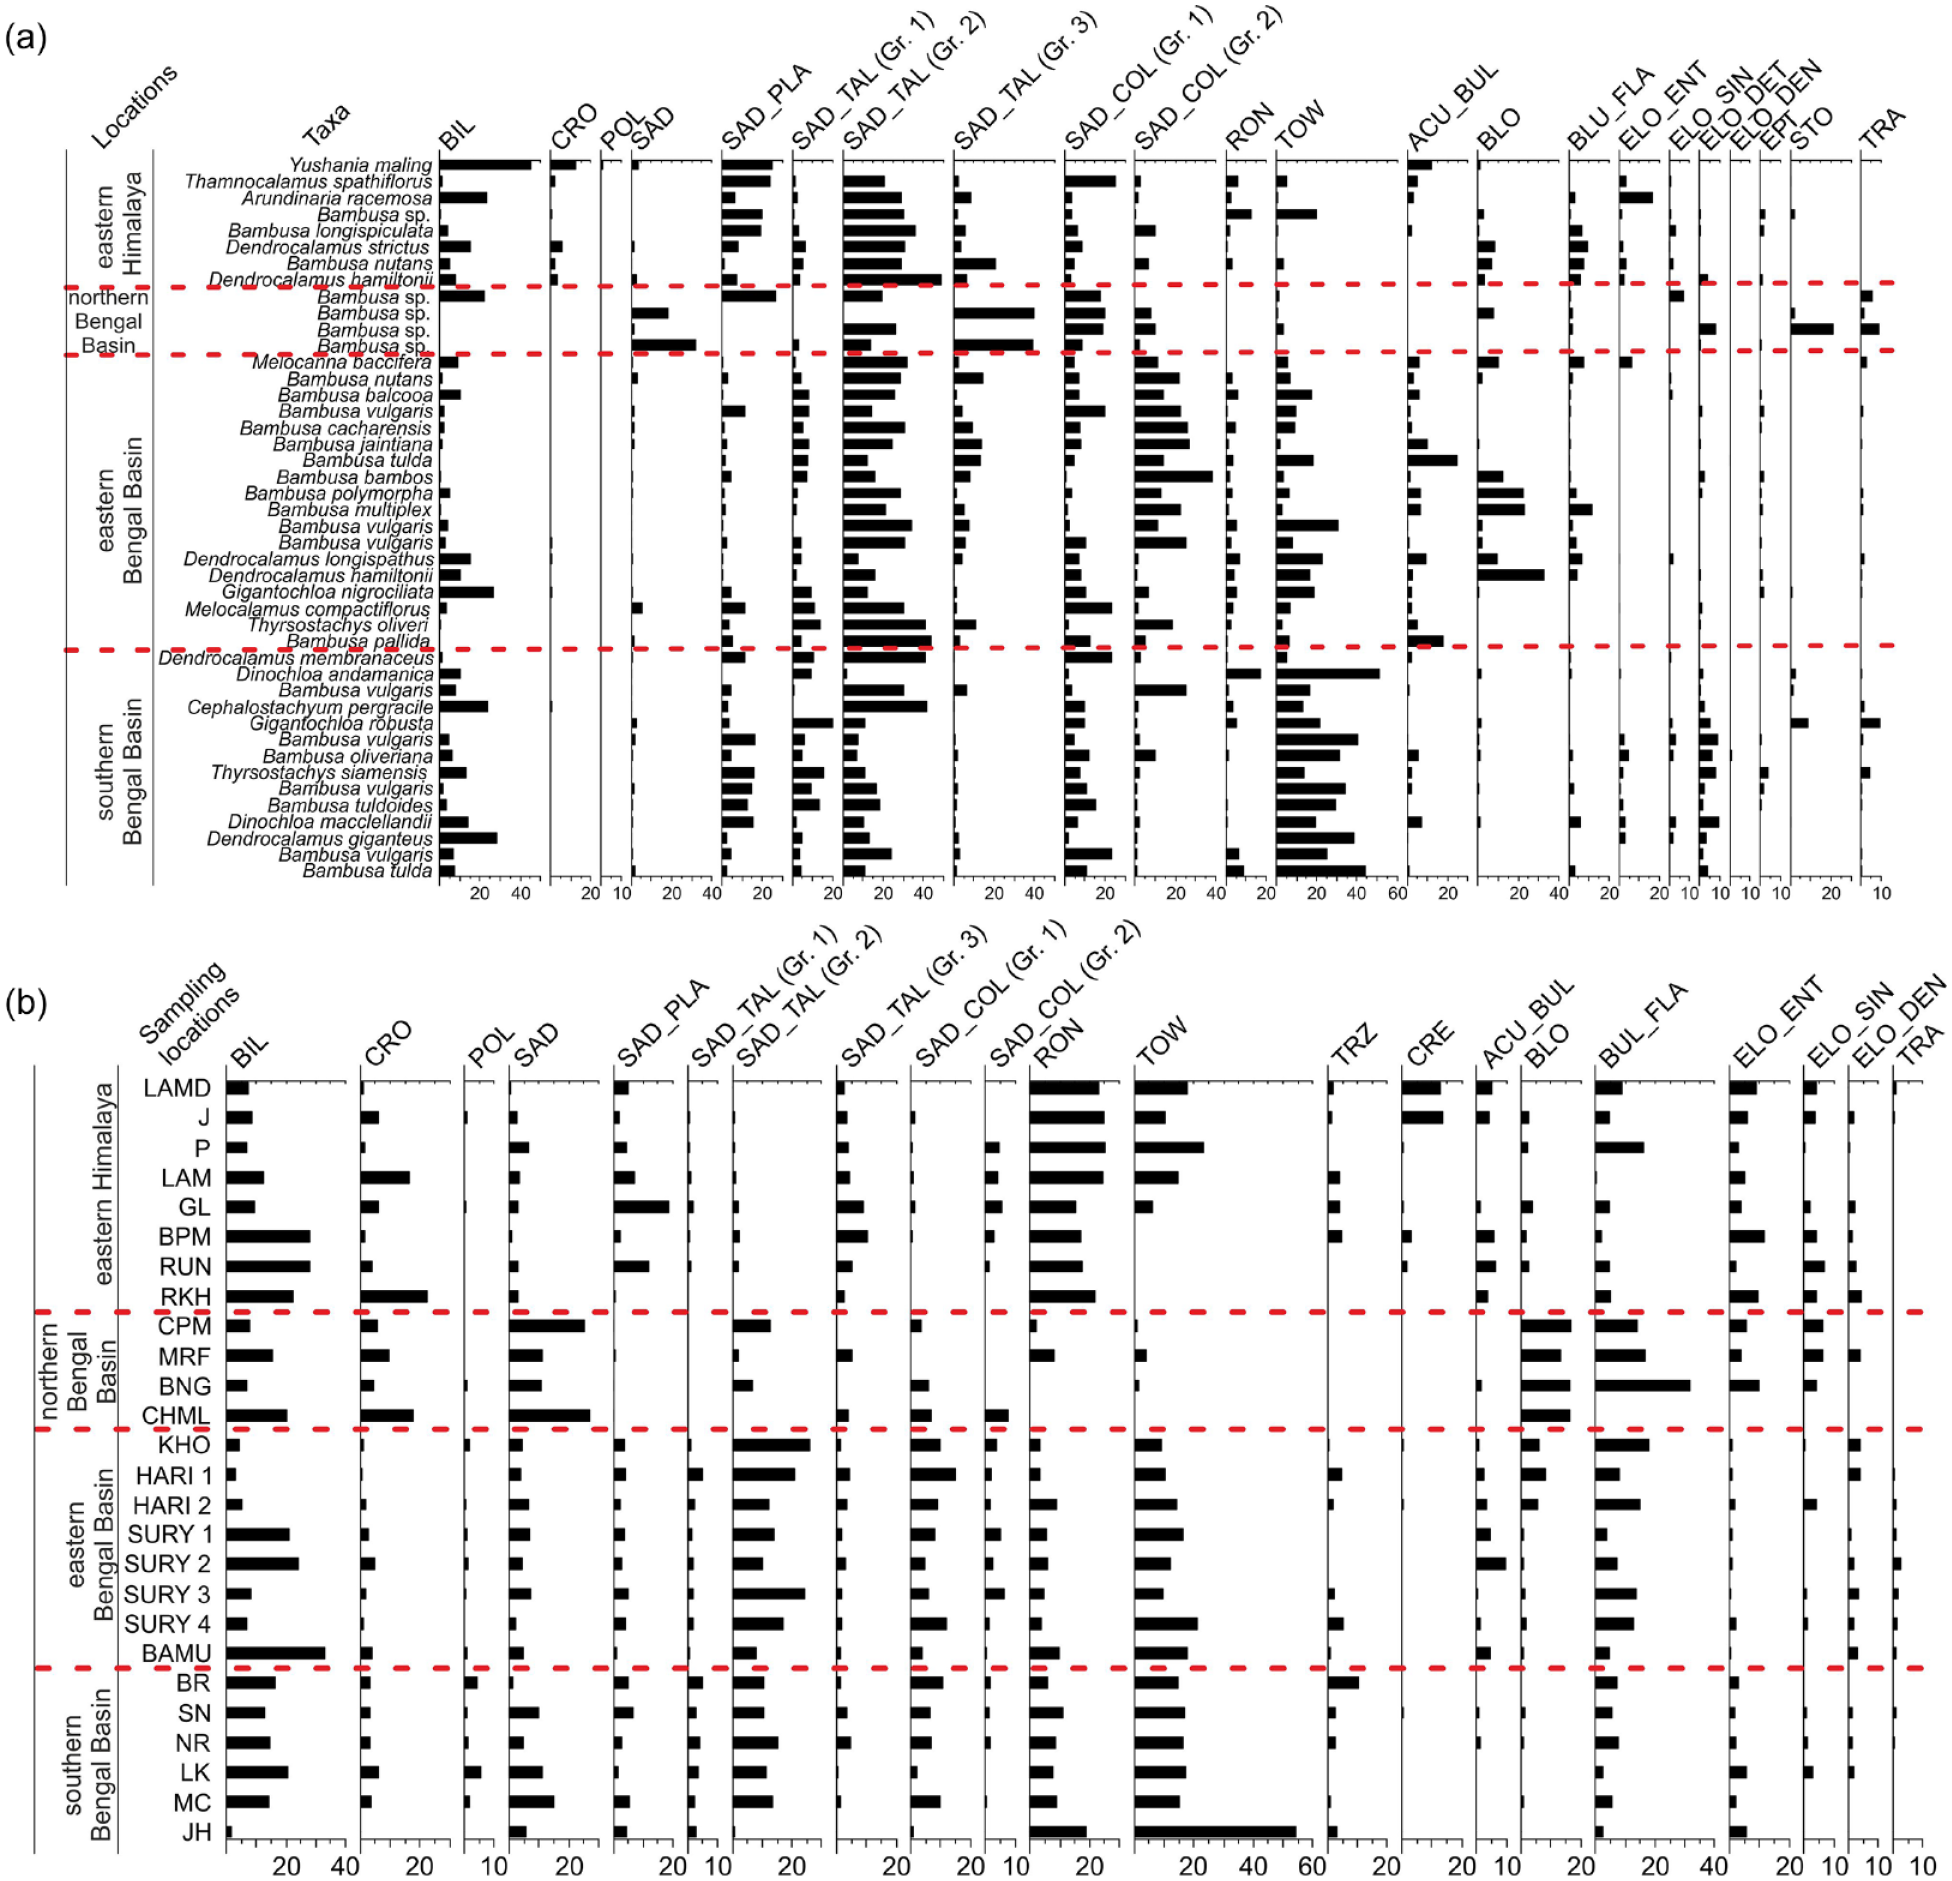
Nineteen phytolith morphotypes were retrieved from 44 bambusoid grasses (Table 2, Supplemental Figure S1). A list of the recovered phytoliths, their taxonomic association or identification, relevant references on which taxonomic identification was based, and their acronyms are presented in Table 2. Nine types (Bilobate, Cross, Polylobate, Saddle, Saddle plateaued, Saddle tall, Saddle collapsed, Rondel, and Tower) were grass silica short cell (GSSC) phytoliths having eco-climatic indicative values while the remaining morphotypes (Acute bulbosus, Blocky, Bulliform flabellate, Elongate types, Epidermis, Stomate, and Tracheary) found in all grass subfamilies and have low taxonomic/ecological significance.
Phytolith types retrieved from the modern Bambusoideae grasses from the eastern and north-eastern India, their taxonomic association and acronyms.
In the tribe Arundinarieae, the phytolith spectrum of the taxon Yushania maling was completely different compared to the other studied bambusoid grasses producing high frequencies of Bilobate followed by Saddle plateaued, Cross, Saddle, and Polylobate. However, in other studied bambusoid taxa, Polylobate was absent. In the other two taxa in this tribe, Thamnocalamus spathiflorus and Arundinaria racemosa frequencies of Saddle tall was highest. Apart from the Saddle tall type, significant frequencies of Saddle collapsed, Saddle plateaued, Bilobate, and Rondel were observed. In addition to these, Cross and Tower types were present in Thamnocalamus spathiflorus. Elongated morphotypes observed in this tribe were: Acute bulbosus, Blocky, Elongate entire, Elongate sinuate, and Stomate (Figure 2a; Supplemental Table S2). We studied eight genera (Bambusa, Dendrocalamus, Melocanna, Gigantochloa, Melocalamus, Thyrsostachys, Dinochloa, and Cephalostachyum) in the tribe Bambuseae, and found Bambusa contributed the highest number of species. Within the genus Bambusa, Saddle tall, Saddle collapsed, Saddle plateaued, Saddle, Bilobate, and Tower were present in almost all taxa. The abundance of Saddle tall and Saddle collapsed were highest followed by Saddle plateaued, Saddle, Bilobate, and Tower. Saddle plateaued types were absent in the three species of Bambusa collected from the NBB while, the Saddle was found absent in Bambusa sp. and B. longispiculata collected from EH, Bambusa sp. of NBB, and various other species of Bambusa of EEB and SBB. Similarly, Bilobate were absent in B. tulda from the EBB and Tower were absent in Bambusa sp. from the NBB. Furthermore, Cross and Rondel were produced only in a few Bambusa species and in extremely low frequencies (Figure 2a; Supplemental Table S2).
(a) Phytolith spectra (%) of modern bambusoid grasses collected from different locations of eastern and northeast India. The first three taxa belong to the tribe Arundinarieae and the rest taxa belong to tribe Bambuseae. (b) Phytolith assemblage (%) of surface soils/sediments collected from eastern and north-eastern India. Details of location codes are given in Supplemental Table S2. BIL: Bilobate; CRO: Cross; POL: Polylobate; SAD: Saddle; SAD_PLA: Saddle plateaued; SAD_TAL: Saddle tall; SAD_COL: Saddle collapsed; RON: Rondel; TOW: Tower; TRZ: Trapezoid; CRE: Crenate; ACU_BUL: Acute bulbosus; BLO: Blocky; BLU_FLA: Bulliform flabellate; ELO_ENT: Elongate entire; ELO_SIN: Elongate sinuate; ELO_DET: Elongate dentate; ELO_DEN: Elongate dendritic; EPI: Epidermis; STO: Stomate; TRA: Tracheary; NON_GRA: Non-grass types.
We studied five species of Dendrocalamus in the tribe Bambuseae Substantial frequencies of Saddle tall, Saddle collapsed, Bilobate, Saddle plateaued, and Tower types were observed in this genus. However, D. hamiltonii collected from EH did not produce any Tower and production of Cross was observed in three species (D. strictus of EH, D. hamiltonii of EH, and D. longispathus of EBB) in low frequencies. Some species also produced Rondel and Saddle types (Figure 2a; Supplemental Table S2).
Two species of Gigantochloa and Dinochloa were also studied from this tribe. In both Gigantochloa nigrociliata and G. robusta, high frequencies of Saddle tall was observed followed by Tower, Saddle collapsed, Rondel, and Saddle types. In addition, high abundance of Bilobate was seen only in G. nigrociliata. In Dinochloa andamanica and D. macclellandii, Tower had the highest frequency followed by Bilobate, Saddle tall, Saddle collapsed, and Saddle. An abundance of Rondel and Saddle plateaued was also seen in D. andamanica and in D. macclellandii respectively (Figure 2a; Supplemental Table S2). In Melocanna baccifera, Melocalamus compactiflorus, and Cephalostachyum pergracile, frequency of Saddle tall was highest followed by Saddle collapsed, Bilobate, Tower, Saddle plateaued, and Saddle. Of these three taxa, Rondel was found only in Melocalamus compactiflorus and Cephalostachyum pergracile. Other phytoliths observed in various frequencies in the tribe Bambuseae were Acute bulbosus, Blocky, Elongate types, Epidermis, Stomate, and Tracheary (Figure 2a; Supplemental Table S2). The details of Energy Dispersive X-ray (EDX) analysis of some phytolith morphotypes are given in Supplemental Table S3 and Figure S2.
Variability of grass phytolith assemblages in surface soils/sediments of the eastern and north-eastern India
Twenty-two phytolith morphotypes were recovered from the surface soils/sediments collected from the eastern and north-eastern India (Figure 2b; Supplemental Figure S3 and Table S4), including 11 GSSCs (such as, Bilobate, Cross, Polylobate, Saddle, Saddle plateaued, Saddle tall, Saddle collapsed, Rondel, Tower, Trapezoid, and Crenate) and 7 long cell phytoliths (Acute bulbosus, Blocky, Bulliform flabellate, Elongate entire, Elongate sinuate, Elongate dendritic, and Tracheary). The non-grass phytoliths recovered from the soil samples were grouped under one category and not analyzed in detail as it was beyond the scope of this study (Figure 2b). The frequency of Polylobate in all surface samples was low. Trapezoid and Crenate were recovered in samples from the EH; these morphotypes were not found in any of the studied bambusoid grasses growing in this region. The source of Crenate types may be Pooideae grasses growing in high altitude regions as Crenate is one of the dominant morphotypes produced in this subfamily (Biswas et al., 2016, 2021). Trapezoid is a redundant type found in multiple grass subfamilies, so it is difficult to identify the source of this morphotype in soil samples. Other GSSCs recovered from the surface samples of the EH are Rondel, Bilobate, Tower, Cross, Saddle tall, Saddle plateaued, Saddle, and Saddle collapsed. The frequencies of Rondel were the highest in the EH samples compared to other sites (Figure 2b). The frequencies of Cross, Saddle, Saddle tall, and Saddle collapsed increase and frequencies of Saddle plateaued, Rondel, and Tower decrease in surface samples of the NBB compared to the EH (Figure 2b). The frequencies of Bilobate remain unchanged again with respect to EH samples. The maximum frequencies of Cross and Saddle were found in samples from NBB compared to other locations (Figure 2b). In EBB surface samples, Saddle tall had the highest frequency followed by Tower, Bilobate, and Saddle collapsed. Other morphotypes included Cross, Saddle, Saddle plateaued, and Rondel (Figure 2b). In SBB surface samples, Tower had the highest frequency followed by Saddle tall (Figure 2b). Other phytolith morphotypes included Bilobate, Cross, Saddle, Saddle plateaued, Saddle collapsed, and Rondel (Figure 2b).
Saddle tall and Saddle collapsed sub-morphotypes in modern bamboo and surface samples
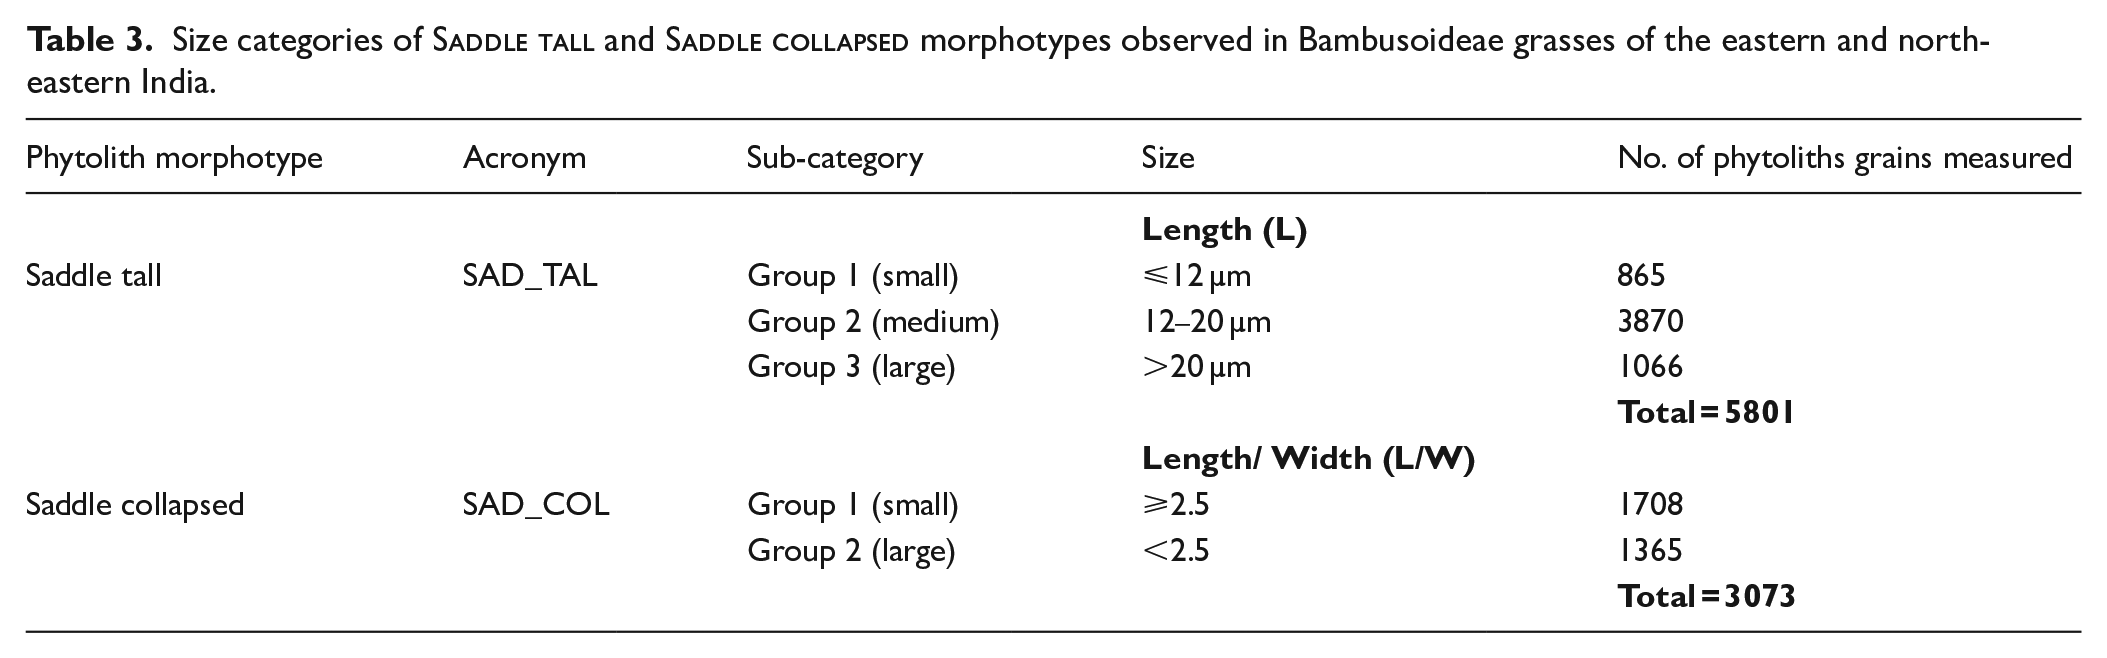
We observed that among all morphotypes recovered from modern Bambusoideae members, Saddle tall and Saddle collapsed are the dominant and consistent types except in Yushania maling. These two phytolith types show a wide range of size variability. To assess if this variability is linked to environmental parameters, we sub-categorized Saddle tall types based on their length (L), and Saddle collapsed types based on their length to width ratio (L/W). Thus, Saddle tall are grouped into three sub-types: Group 1 (L ⩽ 12 μm), Group 2 (L = 13–20 μm), and Group 3 (L > 20 μm). Saddle collapsed are grouped into two sub-types; Group 1 (L/W ⩾ 2.5) and Group 2 (L/W < 2.5). We do not consider the width of Saddle tall types because width remains mostly consistent irrespective of the length but in Saddle collapsed types, variation is seen in both length and width, so both are considered (Table 3). The frequency of Saddle tall (Group 1) varies between 0.3% (Bambusa vulgaris) and 20% (Gigantochloa robusta) but this sub-morphotype is absent in Yushania maling and three Bambusa spp. collected from the northern BB. Saddle tall (Group 2) is found in all bambusoid grasses (expect for Yushania maling and one Bambusa sp. collected from northern BB); abundance of this type varies between 2% (Dinochloa andamanica) to 49% (Dendrocalamus hamiltonii). The frequency of Saddle tall (Group 3) varies between 0.3% (Dendrocalamus membranaceus and D. hamiltonii) and 40.1% (Bambusa sp. of Jalpaiguri) but is absent in Dinochloa andamanica, Gigantochloa robusta, Yushania maling and Bambusa sp. Frequency of Saddle collapsed (Group 1) varies between 0.6% (Bambusa bambos) and 25% (Thamnocalamus spathiflorus) and Group 2 from 0.5% (Bambusa sp.) to 38% (Bambusa bambos). Saddle collapsed (Group 1) is absent in Yushania maling and Saddle collapsed (Group 2) is absent in Yushania maling as well as in Dendrocalamus strictus, D. hamiltonii, and Dinochloa andamanica (Figure 2).
Size categories of Saddle tall and Saddle collapsed morphotypes observed in Bambusoideae grasses of the eastern and north-eastern India.
Phytolith morphotype
Acronym
Sub-category
Size
No. of phytoliths grains measured
Length (L)
Saddle tall
SAD_TAL
Group 1 (small)
⩽12 µm
865
Group 2 (medium)
12–20 µm
3870
Group 3 (large)
>20 µm
1066
Total = 5801
Length/ Width (L/W)
Saddle collapsed
SAD_COL
Group 1 (small)
⩾2.5
1708
Group 2 (large)
<2.5
1365
Total = 3073
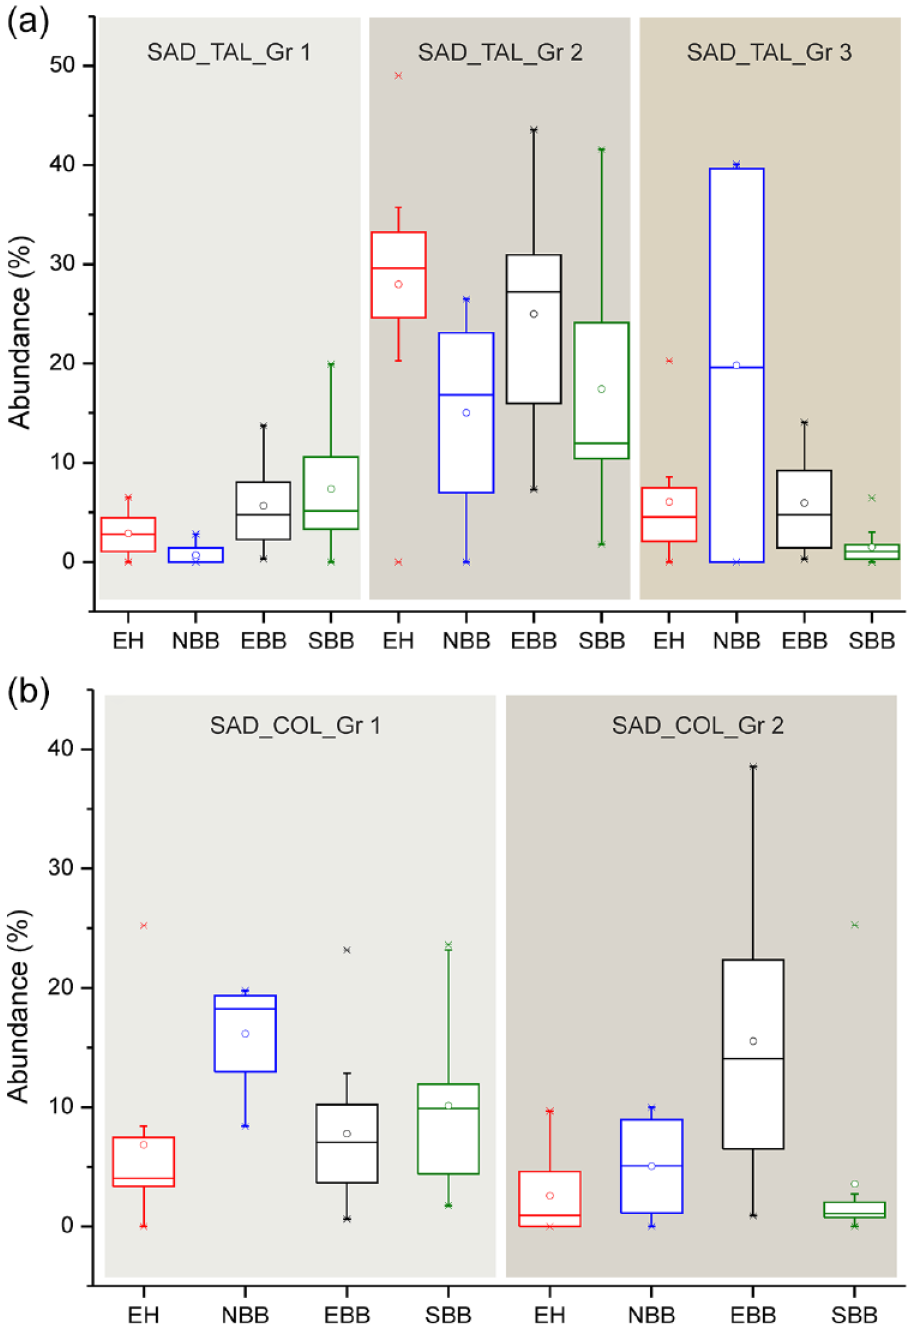
If we compare the abundance of different Saddle tall and Saddle collapsed types in modern bamboos from different zones of the studied region (Figure 3), it is noted that Saddle tall (Group 1) are retrieved in highest percentages in the SBB followed by EBB, EH, and NBB. Bambusoideae grasses of the EH show high percentages of Saddle tall (Group 2) followed by those from EBB, SBB, and NBB (Figure 3a). However, bamboos collected from the NBB produce highest percentages of Saddle tall (Group 3) followed by those from the EH, EBB, and SBB (Figure 3a). On the other hand, bamboo specimens from the NBB produce highest percentages of Saddle collapsed (Group 1) followed by those collected from the SBB, EBB, and EH (Figure 3b). The bamboos from the EBB produce highest percentages of Saddle collapsed (Group 2) followed by NBB, EH, and SBB (Figure 3b). Similar to modern grass data, the Saddle tall and Saddle collapsed types are also sub-categorized in the surface soil phytolith data based on the length and length/width ratio. Although all the three sub-types of Saddle tall are recovered in the surface samples of EH, but Group 3 is recovered in maximum frequencies compared to Group 1 and Group 2 (Figure 2b). In case of Saddle collapsed types, both the Group 1 and Group 2 are recovered in low frequencies (Figure 2b). Thus, it could be summarized that Saddle tall (Group 3) are mainly recovered from the EH samples whereas Saddle tall (Groups 1 and 2) and Saddle collapsed (Group 1) are prevalent in the surface samples from the EBB and SBB (Figure 2b). The frequencies of Saddle tall (Group 2) and Saddle collapsed (Group 1) increase and frequencies of Saddle tall (Group 3) are found to decrease in surface samples of the NBB compared to those from the EH (Figure 2b). Moreover, Saddle tall (Group 1) is found absent in the surface samples of the NBB and frequencies of Saddle collapsed (Group 2) remain unchanged again with respect to EH samples (Figure 2b). In surface samples of the EBB, Saddle tall (Group 2) is recovered in highest frequencies followed by Saddle collapsed (Group 1; Figure 2b). In the surface soil assemblages of the SBB, Saddle tall (Group 2) are recovered in higher percentages than Saddle tall (Group 1), and Saddle tall (Group 3). In these samples, Saddle collapsed (Group 1) are also found in higher frequencies than Saddle collapsed (Group 2) types (Figure 2b).
Box plots comparing the abundance of different categories of (a) Saddle tall (three types) and (b) Saddle collapsed (two types) recovered from modern Bambusoideae grasses collected from eastern and northeast India. The solid lines and dots represent the median and mean, respectively; and the upper and lower boundaries of the box represent Q3 and Q1, respectively. The stars are the outliers. EH: eastern Himalaya; NBB: northern part of the Bengal Basin; EBB: eastern part of the Bengal Basin; SBB: southern part of the Bengal Basin.
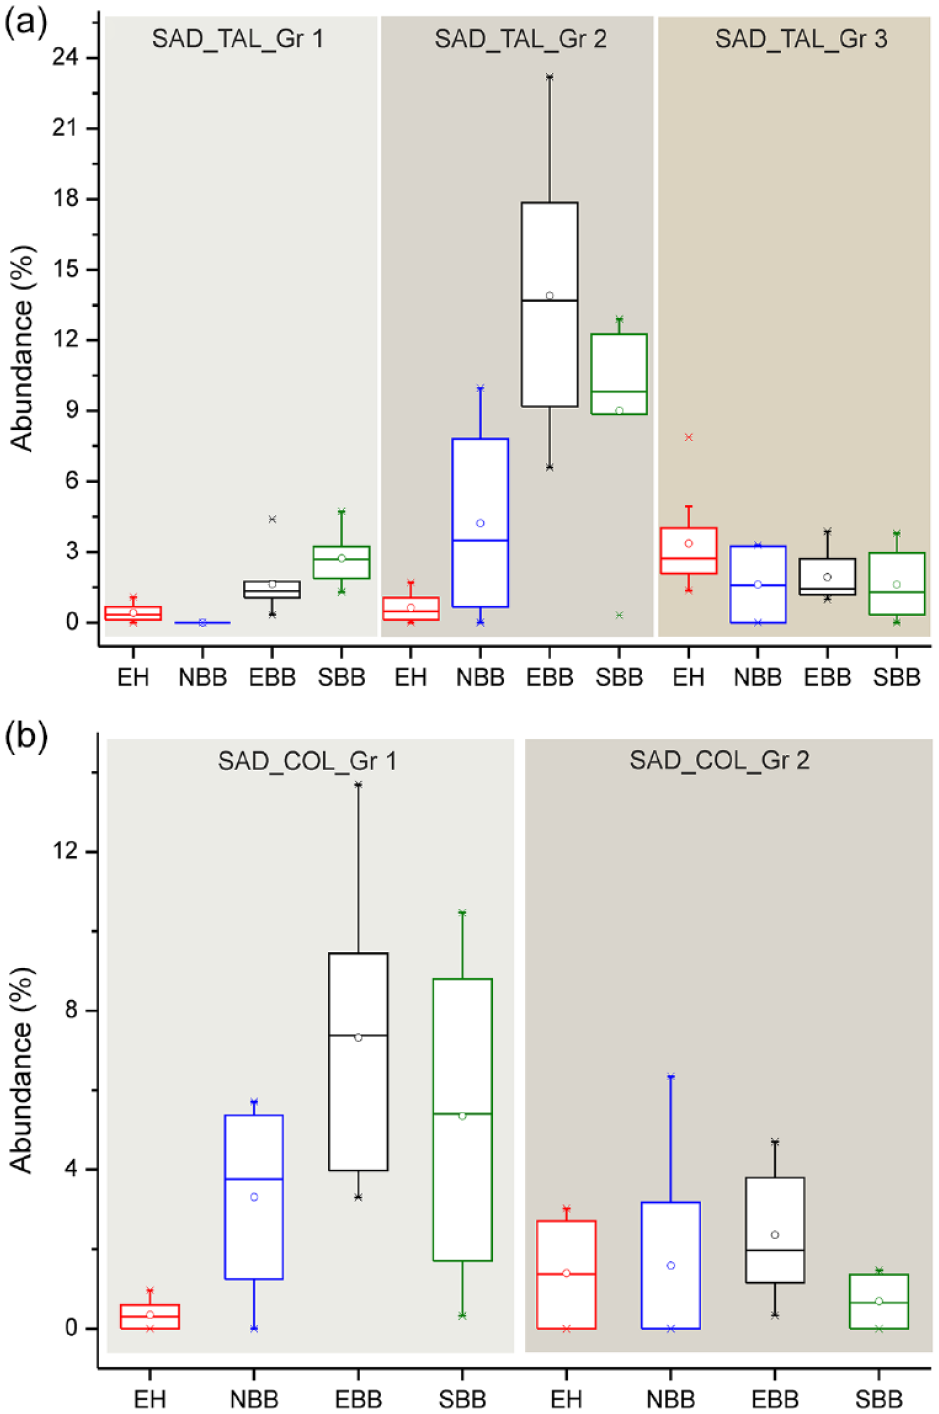
Among the surface soil GSSCs, Saddle tall (Group 1) are recovered in highest frequencies in the SBB samples followed by those from the EBB, EH, and NBB (Figure 4a). The highest abundance of Saddle tall (Group 2) is observed in the EBB surface soil/sediment samples followed by those from SBB, NBB, and EH (Figure 4a). However, highest frequency of Saddle tall (Group 3) is noticed in the EH surface soil spectra followed by those from the EBB, NBB, and SBB (Figure 4a). In contrast, highest frequency of Saddle collapsed (Group 1) is noticed in surface soil phytolith spectra of the EBB followed by SBB, NBB, and EH samples (Figure 4b). The highest abundance of Saddle collapsed (Group 2) is noticed in NBB surface soil samples followed by those from the EBB, EH, and SBB samples (Figure 4b).
Box plots comparing the abundance of different categories of (a) Saddle tall (three types) and (b) Saddle collapsed (two types) recovered from surface soil/sediment samples from different parts of the Bengal Basin and the eastern Himalaya. The solid lines and dots represent the median and mean, respectively; and the upper and lower boundaries of the box represent Q3 and Q1, respectively. The stars are outliers. [Here, EH: eastern Himalaya; NBB: northern part of the Bengal Basin; EBB: eastern part of the Bengal Basin; SBB: southern part of the Bengal Basin].
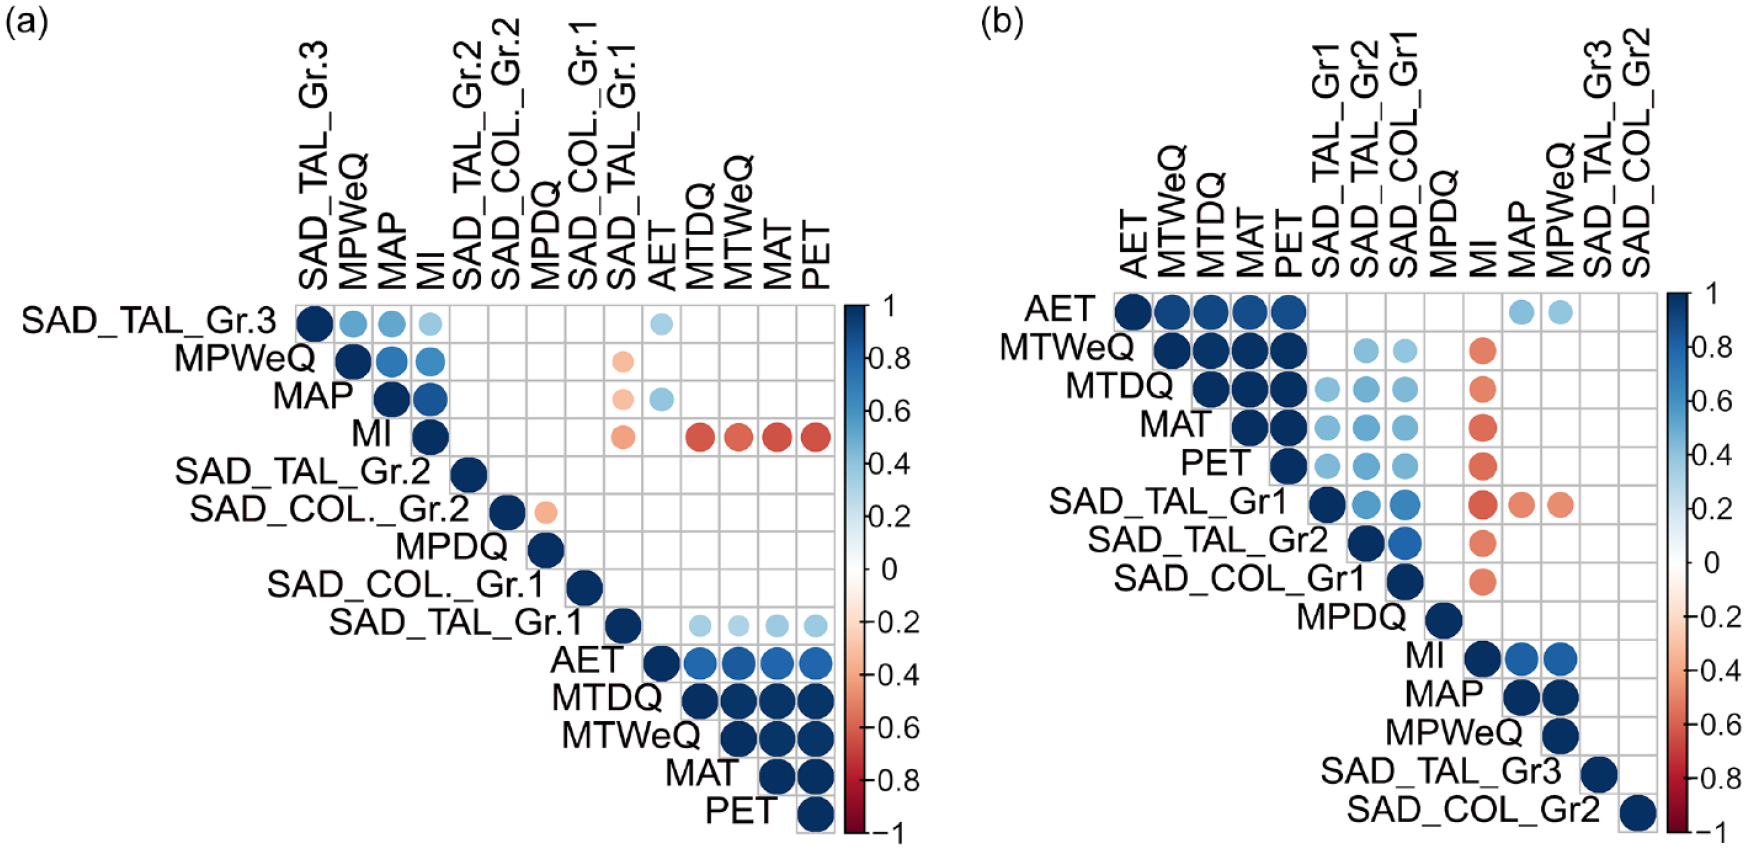
Correlation of Saddle tall and Saddle collapsed types with climatic parameters
Saddle tall and Saddle collapsed are the two most abundant and consistent morphotypes found in all bambusoid grasses. These broad morphotypes show weak correlation with climatic variables, but when categorized into groups, Saddle tall and Saddle collapsed categories show strong correlation with climatic variables (Figure 5a). Saddle tall (Group 1) shows positive correlation with MAT, MTWeQ, MTDQ, and PET and negative correlation with MAP, MPWeQ, and MI. However, Saddle tall (Group 3) shows positive correlation with MAP, MPWeQ, MI, and AET. Even though, Saddle tall (Group 2) has the highest frequency compared to Group 1 and Group 3, the group has no strong correlation with any of the climatic variables as they are abundantly present in all studied bamboos irrespective of their collection sites (Figure 5a). Among the two Saddle collapsed categories (Group 1 and 2), only Saddle collapsed (Group 2) shows significant negative correlation with MPDQ (Figure 5a). From surface soil phytolith assemblages, Saddle tall (Group 1) shows positive correlation with MAT, MTDQ, and PET, and negative correlation with MAP, MPWeQ, and MI, the same as observed in the modern bambusoid grass data (Figure 5b). Surprisingly, Saddle tall (Group 2) also exhibits positive correlation with MAT, MTWeQ, MTDQ, and PET, and negative correlation with MI, different from the modern grass dataset. However, Saddle tall (Group 3) has no significant correlation with any of the climate variables in the surface soil phytolith dataset.
Correlation matrix for climate variables and different categories of Saddle tall and Saddle collapsed recovered from (a) modern Bambusoideae grasses and (b) surface soil/sediment samples. Only variables with significant correlation (p < 0.05) are represented. Different shades of blue indicate a positive significant correlation and shades of red indicate a negative significant correlation among the variables.
Saddle collapsed (Group 1) is positively correlated with MAT, MTWeQ, MTDQ, and PET and negatively correlated with MI. Saddle collapsed (Group 2) has no correlation with any of the climate variables (Figure 5b). Combining modern grass and surface sample data, we infer that Saddle tall (Group 1) is found at sites with high MAT and PET, and low MAP, MPWeQ, and MI. In addition, Saddle tall (Group 2) and Saddle collapsed (Group 1) are primarily found at locations with high MAT, MTWeQ, MTDQ, PET, and low MI; MAP does not influence the production of this morphotype, but moisture Index (MI) plays a crucial role. The frequency of Saddle tall (Group 3) increases with MAP and MI (Figure 5).
Numerical analyzes
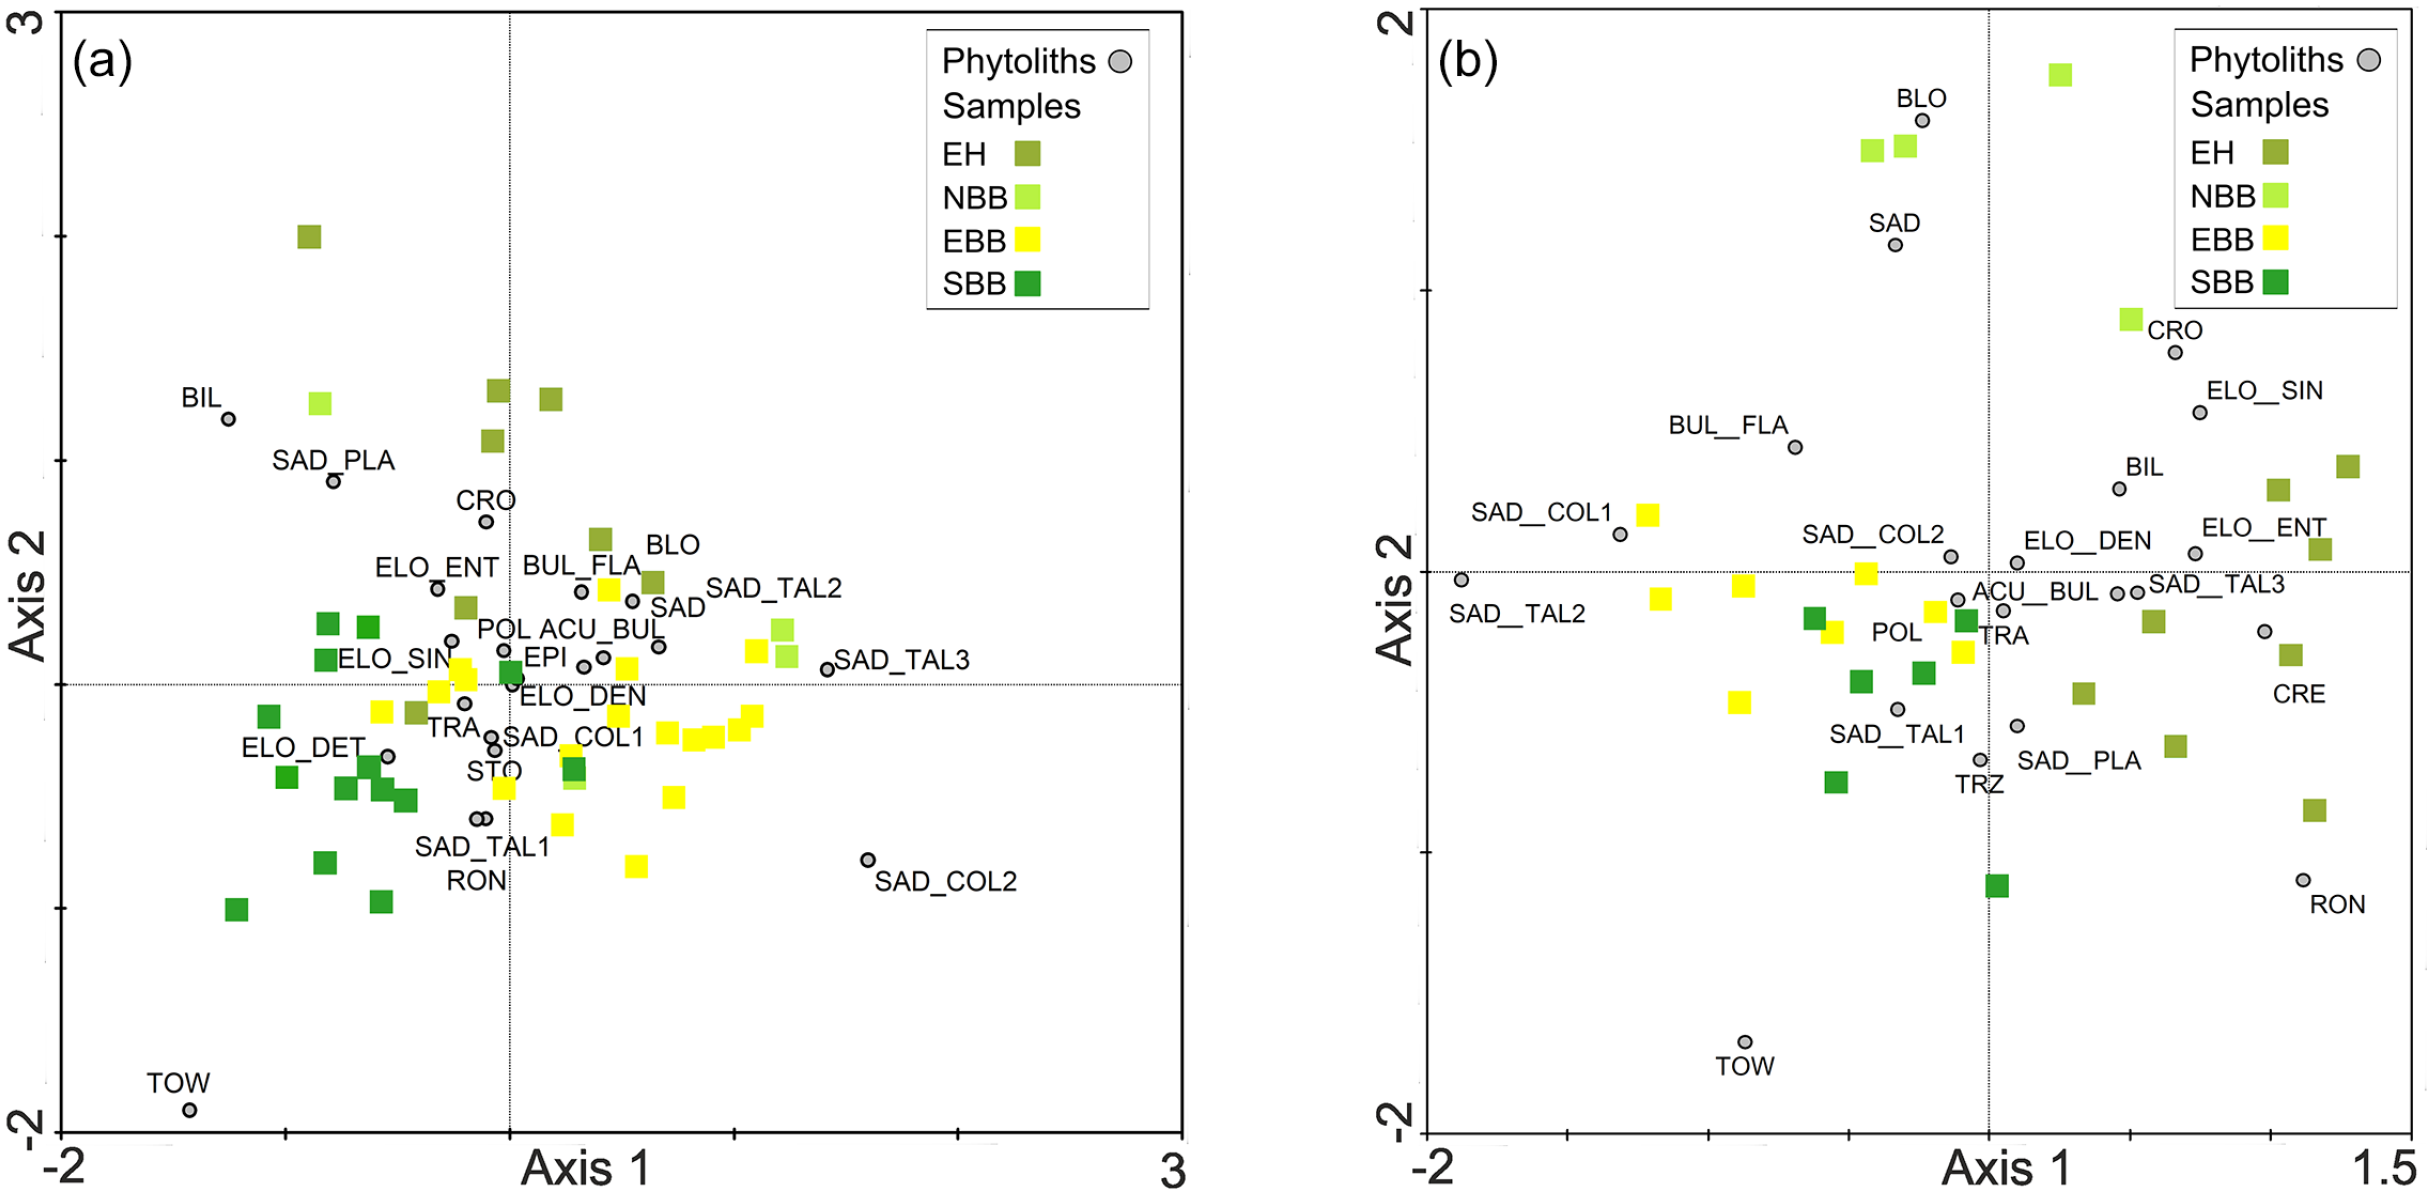
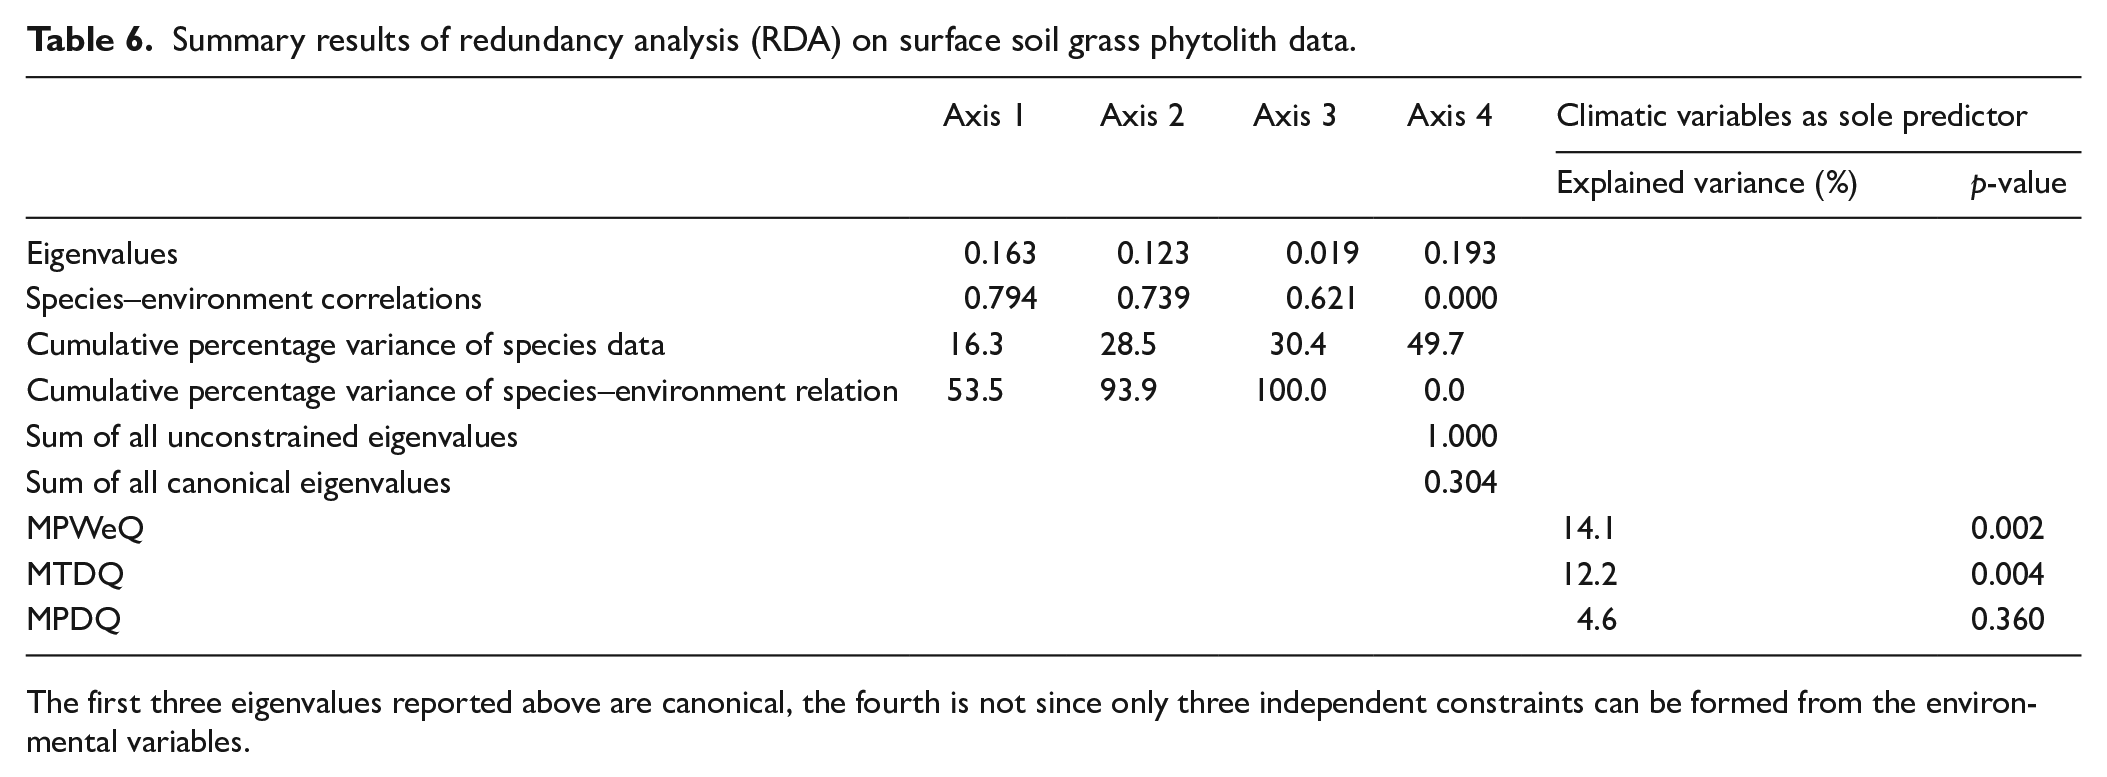
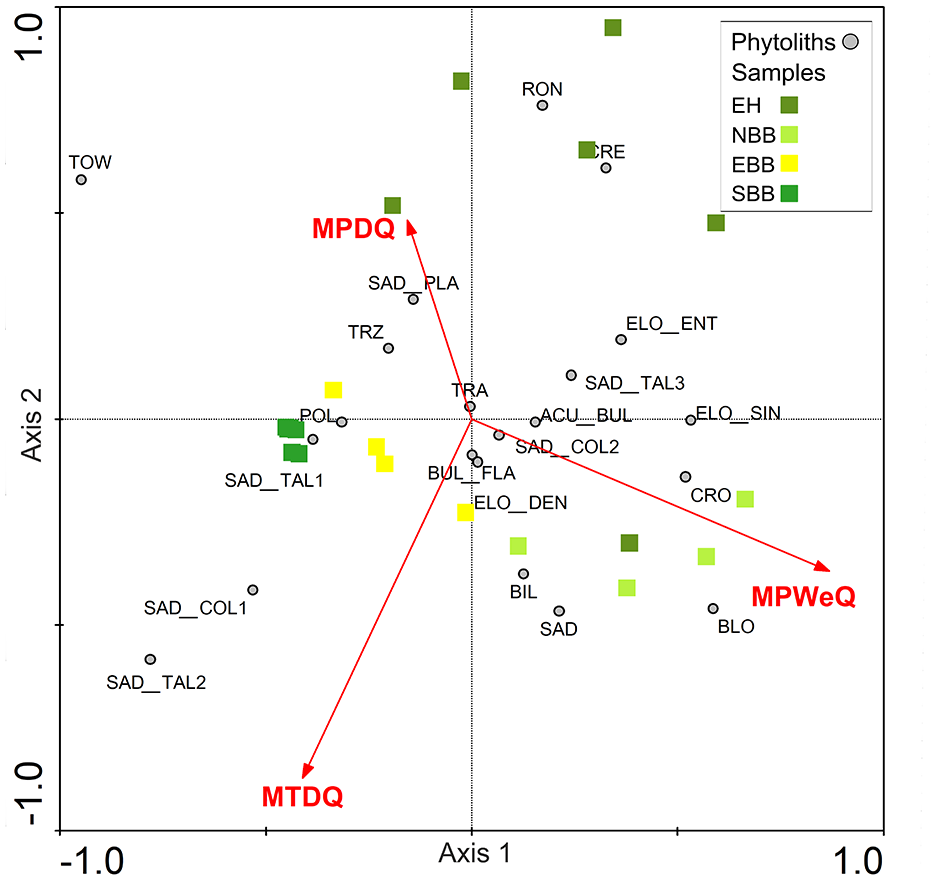
DCA is performed on abundance data of modern bambusoid grasses phytolith percentage combining all 22 phytolith morphotypes recovered from eastern and north-eastern India (Supplemental Table S5). DCA axis 1 has a relatively long >2 SD environmental gradient length. Together the first and second axes explain 28.5% of the total variance of phytolith assemblages; axis 1 explains 17.3% (Supplemental Table S5). Axes 1 and 2 of the DCA of phytolith morphotypes extracted from surface samples have <2 SD gradient lengths suggesting a linear relationship between the phytolith morphotypes and climate variables (Supplemental Table S5), occurring only when the regional climate has less extremes. The first two axes together account for 43.3% of the total variance of the phytolith assemblage data (Supplemental Table S5) and axis 1 explains 25.2%. In both modern grass and surface sample data, the first few DCA axes show gradient lengths ⩽2 SD which suggests a linearity-based direct gradient analysis would be suitable to understand the interrelationships of the phytolith types and climate variables. To test whether phytolith spectra of the modern bambusoid grasses and surface samples can distinguish sampling sites from different regions, principal component analysis (PCA) is also performed on the square-root transformed abundance data of phytoliths from modern grasses and surface soils/sediments (Table 4; Figure 6). The PCA ordination plot for modern bambusoid grasses shows that Saddle tall (Group 3) and Saddle collapsed (Group 2) have close association with samples collected from NBB and EBB, while Saddle tall (Group 1) demonstrates close association with samples collected from SBB (Figure 6a). Similarly, Saddle tall (Group 1) also shows close association with surface soil/sediment samples collected from SBB (Figure 6b). Saddle tall (Group 3) and Saddle collapsed (Group 2) are found to be associated with samples collected from the EH, and EBB (Figure 6b) respectively. Saddle tall (Group 2) and Saddle collapsed (Group 1) do not show close association with surface samples from any of these regions (Figure 6b). It is worth noting that, we have considered only the grass phytolith assemblages observed in the surface soil/sediment samples and omitted the non-grass types. However, in addition to the Saddle tall and Saddle collapsed types, grass phytolith spectra of surface soil/sediment samples also show morphotypes that are found in Bambusoideae as well as other grass subfamilies. We performed PCA on abundance data for these common morphotypes from both bambusoid grasses and surface soil/sediment samples; results demonstrated similar trends as earlier observed with the complete grass phytolith data from surface samples (Supplemental Figure S4). Based on DCA results, RDA, a linearity-based method of direct gradient analysis is employed on the surface soil phytolith dataset. The VIFs for each environmental variable (MAT, MAP, MTWeQ, MTDQ, MPWeQ, MPDQ, PET, MI, and AET) are also examined to eliminate the effects of high colinearity among the environmental variables. A VIF value >20 indicates high correlation with the other climate variables meaning that addition of this variable has very little influence on the phytolith data (Ter Braak and Prentice, 1988). Based on this, only MPWeQ, MTDQ, and MPDQ are selected for final RDA (Table 5). The first two axes in RDA plot capture 28.5% of total variation of phytolith data. The first axis is the most important, with an eigenvalue of 0.16. MPWeQ is associated with axis 1, MTDQ is associated with axis 2, and MPDQ does not show strong association with either axis 1 or 2. The ordination plot shows discrimination along the climate gradient with samples from EH and NBB clustered on the positive side of the plot between 0.0 and 1.0 loading and positively correlated with MPWeQ. Samples from EBB and SBB are clustered between 0 and −0.5 and show close associations with MTDQ and MPDQ. Saddle tall (Group 3) and Saddle collapsed (Group 2) are closely associated with samples from EH and NBB and also show positive correlation to MPWeQ and negative correlation with MPDQ and MTDQ. Saddle tall (Group 1 and 2) and Saddle collapsed (Group 1) remain associated with samples from SBB and EBB (Table 6; Figure 7).
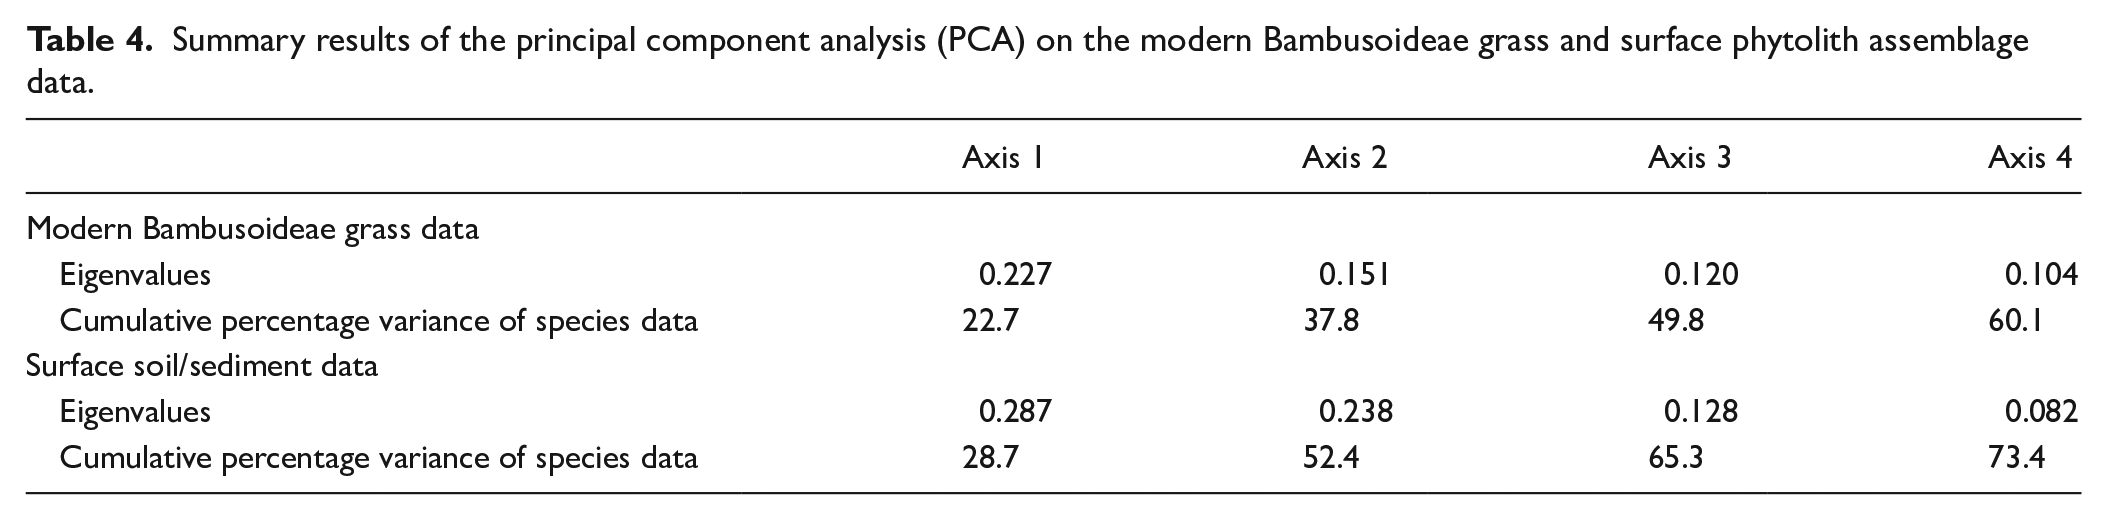
Summary results of the principal component analysis (PCA) on the modern Bambusoideae grass and surface phytolith assemblage data.
Axis 1
Axis 2
Axis 3
Axis 4
Modern Bambusoideae grass data
Eigenvalues
0.227
0.151
0.120
0.104
Cumulative percentage variance of species data
22.7
37.8
49.8
60.1
Surface soil/sediment data
Eigenvalues
0.287
0.238
0.128
0.082
Cumulative percentage variance of species data
28.7
52.4
65.3
73.4
PCA ordination plots showing summary results of analysis for the (a) Bambusoideae grasses and (b) surface soil/sediment samples.
VIF values of climatic variables and their interset correlations with axes (gray shaded are the climatic variables selected for further analysis).
MTWeQ: Mean temperature of the wettest quarter; MTDQ: Mean temperature of the driest quarter; MPWeQ: Mean precipitation of the wettest quarter; MPDQ: Mean precipitation of the driest quarter; MI: Moisture index; AET: Actual evapotranspiration.
Summary results of redundancy analysis (RDA) on surface soil grass phytolith data.
Axis 1
Axis 2
Axis 3
Axis 4
Climatic variables as sole predictor
Explained variance (%)
p-value
Eigenvalues
0.163
0.123
0.019
0.193
Species–environment correlations
0.794
0.739
0.621
0.000
Cumulative percentage variance of species data
16.3
28.5
30.4
49.7
Cumulative percentage variance of species–environment relation
53.5
93.9
100.0
0.0
Sum of all unconstrained eigenvalues
1.000
Sum of all canonical eigenvalues
0.304
MPWeQ
14.1
0.002
MTDQ
12.2
0.004
MPDQ
4.6
0.360
The first three eigenvalues reported above are canonical, the fourth is not since only three independent constraints can be formed from the environmental variables.
Ordination plot showing summary results of RDA on the surface soil grass phytolith data.
Saddle tall and Saddle collapsed types providing insights into the climate in the eastern Himalaya since the last 2.4 ka
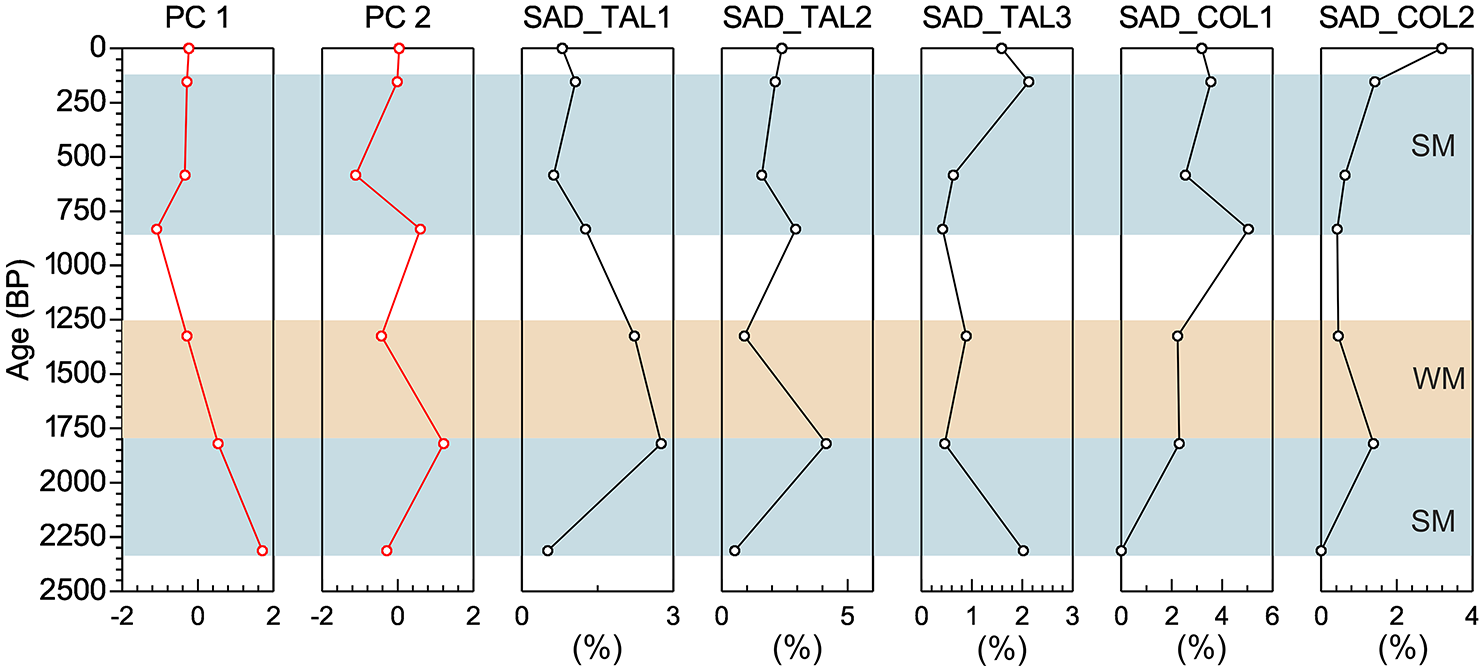
To assess the efficacy of using Saddle tall and Saddle collapsed phytolith types (occurring in most of Bambusoideae grasses) to reconstruct past climatic variability, we re-analyzed an earlier published fossil phytolith record from the Sixth Mile sedimentary profile (SMP), eastern Himalaya (Darjeeling) which covers the depositional history of the last c. 2.4 ka (Ghosh et al., 2018).
Variations in MAT, MAP, PET, and MI in this region since c. 2.4 ka have already been reconstructed previously by Ghosh et al. (2018; Supplemental Table S6). Ghosh et al. (2018) differentiated three zones in the SMP sedimentary record considering synchronous variations in phytolith, pollen, stable carbon isotopes, total organic carbon and grain size data. Variations in grass phytolith spectra have been previously discussed in Ghosh et al. (2018) and Biswas et al. (2021); these are presented in Supplemental Figure S5. In the earlier studies, no sub-categorization was done for Saddle tall and Saddle collapsed morphotypes, so; for this study we focus on variation of these sub-types with changing climatic conditions since c. 2.4 ka. Saddle tall and Saddle collapsed occurred in low frequencies throughout the profile but with substantial variation (Supplemental Figure S5 and Table S6). We performed PCA on this re-analyzed fossil phytolith data where Saddle tall and Saddle collapsed types are sub-categorized following the criteria adopted in this study. RDA results indicate that the first axis is the most dominant and represents the MPWeQ (mean precipitation of the wettest quarter or the summer monsoon precipitation) while, the second axis represents the MTDQ (mean temperature of the driest quarter i.e. the mean temperature of November-December-January-February). We compared sample scores of PCA1 and PCA2 of SMP phytolith data with different sub-categories of Saddle tall and Saddle collapsed types observed in these assemblages to understand the interrelationships of these climate variables with these morphotypes (Figure 8). Based on variation in phytolith spectra three zones have been distinguished in the SMP phytolith record.
Comparison of PCA axes 1 and 2 scores of the SMP grass phytolith data (Ghosh et al., 2018) with different categories of Saddle tall and Saddle collapsed morphotypes (SM: strong monsoon; WM: weak monsoon).
Zone I: between 70 and 60 cm depth (ca. 2.4–1.8 ka)
This zone is characterized by high percentages of Bilobate, Rondel, and Saddle plateaued types. Saddle tall (Group 1 and 2) occurred with similar frequencies (c. 1.3% each). Saddle collapsed (Group 1 and 2) is absent and Saddle tall (Group 3) are negligible in this zone (Supplemental Figures S5 and S8). During this time MAT was around 13.1ºC, MAP around 2672 mm, PET around 772 mm/year and MI around 3.5 (Supplemental Table S6).
Zone II: between 60 and 30 cm depth (ca.1.8–0.8 ka)
The frequency of Saddle tall (Group 2) increases (c. 2.7%) and that of Saddle tall (Group 1) is almost unchanged (c. 1.5%). Saddle tall (Group 3) occurred with very low frequency (c. 0.4%), while Saddle collapsed (Group 1 and 2) increase (c. 2.6% and c. 0.6% respectively) compared to Zone I. MAT and PET also gradually increase in this zone ranging between 14.4ºC and 16.7ºC and 850 to 985 mm/year and MAP and MI decreased ranging between 2058 to 2281 mm and 2.4 to 2.6 (Supplemental Figures S5 and S8; Supplemental Table S6).
Zone III: between 30 and 10 cm depth (ca. 0.8–0.1 ka and onward)
In this zone, the frequencies of Saddle tall (Group 1 and Group 2) decrease (c. 0.6% and c. 1.6% respectively) compared to previous zones and Saddle tall (Group 3) increases (c. 1.2%). Saddle collapsed (Group 1) remains unchanged (c. 2.4%), while Saddle collapsed (Group 2) increases (c. 1.4%). This zone is characterized by low MAT ranging between 11°C to 12°C and PET ranging between 650 and 750 mm/year, which is lower than Zones I and II. MAP and MI gradually rise to 2991 mm and 4.3, respectively, higher than the previous two zones (Supplemental Figures S5 and S8; Supplemental Table S6).
In summary, Saddle tall (Group 1 and 2) and Saddle collapsed (Group 1) increase with temperature parameters and decrease with precipitation and MI, while Saddle tall (Group 3) and Saddle collapsed (Group 2) increase with precipitation and MI and decrease with temperature and evapotranspiration.
Discussions
Phytolith assemblages of Bambusoideae grasses from eastern and north-east India: comparison with earlier records
Bambusoideae grasses produce diverse phytolith types, some of which also occur in other grass subfamilies. However, “Saddle collapsed” (Piperno, 1988; Piperno and Pearsall, 1998) and “Saddle tall” (Lu et al., 1995; Lu et al., 2006) are considered exclusive to this subfamily (Dickau et al., 2013) even though according to ICPN 1.0 (Madella et al., 2005), there is no evidence that any single phytolith morphotype or assemblage is diagnostic for the whole Bambusoideae subfamily. Bremond et al. (2008) agreed, especially for the tribe Bambuseae from the high elevation African bamboo inhabiting zones. In addition to the Saddle collapsed and Saddle tall types, a few other distinctive phytolith types are also produced in this subfamily, such as Chusquoid body (produced by Chusquea) and Polylobate trapeziform (occurring in members of the tribe Olyreae; Watling and Iriarte, 2013). Phytolith types such as, Cross, Bilobate, Tower, and Rondel/Trapeziform etc. occurring in Bambusoideae grasses are also produced in other grass subfamilies (Dickau et al., 2013 and references therein).
Phytoliths produced in Bambusoideae in eastern and north-eastern India can be grouped into two classes: short and long cell types. Long cell phytoliths are Acute bulbosus, Elongate types, Blocky, Bulliform flabellate, and vascular cells such as Tracheary and Stomate. Long cells occur in all grass subfamilies and have low taxonomic and ecological significance (Barboni et al., 2007; Piperno, 2006). Gu et al. (2016) studied three bambusoid genera from tropical southwest China and found Bulliform flabellate (cuneiform bulliform) in high frequencies, allowing them to distinguish the genus Dendrocalamopsis from Bambusa and Dendrocalamus based on the morphology of these bulliform cells. We studied Bambusa and Dendrocalamus, but Bulliform flabellate are not recovered in high frequencies from these genera or any other genera studied from this region. Thus, for the eastern and north-eastern parts of India which receive moderate to high rainfall (above 1000 mm), taxonomic and ecological implications of Bulliform flabellate produced in bambusoid grasses may be limited. As observed in the studied bamboos, representation of Bulliform flabellate is also poor in the surface soils/sediment phytolith spectra, perhaps because overall production of Bulliform flabellate in grass subfamilies growing in this region is low since these regions receive moderate to high rainfall and rainfall distribution is uniform (Biswas et al., 2016, 2021). Bulliform flabellate frequency is >10% in only six samples from NBB and EBB (Chapramari, Murti River Forest, Bidhan Nagar, Khowai, Haripur, and Suryamaninagar). Although Bulliform flabellate are produced in all grass subfamilies, its abundance is comparatively higher in Bambusoideae and Oryzoideae (Lu et al., 2002; Chen et al., 2020; Gu et al., 2013). Oryzoid Bulliform flabellate is used to distinguish domesticated rice from cultivated ones (Chen et al., 2020; Gu et al., 2013; Huan et al., 2015; Wang et al., 2019). Chen et al. (2020) distinguished grass subfamilies using morphometric differences in Bulliform flabellate types. According to Kellogg et al. (2020), Oryzoideae is a dominant subfamily in the tropical regions of eastern and north-eastern India. Therefore, the presence of Bulliform flabellate in our samples may also indicate Oryzoideae input, though a thorough morphometric analysis is necessary which is outside the purview of this study. Li et al. (2018) distinguished grassland from forested areas using Bulliform flabellate produced in Arundinoideae grasses; dominance of this type in surface soils may not always suggest their contribution by the bambusoid grasses only. High Bulliform flabellate production indicates high rate of transpiration or water stress condition (Bremond et al., 2005) and high content in surface soils/sediments indicates low AET/PET ratio, high transpiration or low moisture conditions (Bremond et al., 2005; Dey et al., 2015; Issaharou-Matchi et al., 2016; Messager et al., 2010). Thus, recovery of moderately high percentages of Bulliform flabellate from NBB surface samples may indicate that this area experienced higher transpiration rate compared to other areas.
We observed that production of Saddle tall (Group 1) is higher in Bambusoideae grasses growing in places where temperature of the dry months (MTDQ) is high and mean precipitation of the wettest quarter (MPWeQ) that is, summer monsoon precipitation, is comparatively low, such as in samples collected from the EBB and SBB (abundance is more in the deltaic Bengal). Saddle tall (Group 3) is abundant on sites where summer monsoonal rainfall is high and MTDQ is comparatively low that is, the Himalayan specimens. This result is supported by correlation analysis and PCA. The trend of Saddle tall (Group 1) seen in the studied grasses is also consistent with the surface sample data and also corroborates with the PCA/RDA results, also true for Saddle tall (Group 3). For example, samples from EH and NBB where summer monsoonal precipitation is high and driest months mean temperature is comparatively low, there are comparatively high percentages of Saddle tall (Group 3) in surface soil/sediment samples. However, this morphotype is not consistently present in all surface soils/sediments studied from this region. Two more sub-types, Saddle tall (Group 2) and Saddle collapsed (Group 1) recovered from surface phytolith spectra have similar trends as Saddle tall (Group 1), but their correlation with climatic variables remains weak, perhaps because of our relatively small sample size of modern grasses. For the entire studied region, MAT varies between 12.6°C and 26.4°C, lowest in the Himalayan region (EH) and highest in deltaic Bengal (SBB). MAP varies between 1597 and 4663 mm, highest in Jalpiaguri (NBB), while one sample collected from the rain-shadow area of the Arunachal Himalaya records a low MAP of 1141 mm. Our study area is tropical to subtropical and humid which is favorable for the growth and distribution of diverse grass subfamilies producing considerable amounts of Bilobate and Cross types. To understand the relationship of Bilobate and Cross with climatic variables for such a wide study area, we need to perform morphometric analysis on the “Bilobate” and “Cross” types produced by the members of dominant grass subfamilies growing in the region (Biswas et al., 2021), beyond the scope of this study. The Saddle plateaued morphotype is more abundant in EH bambusoid grasses as well as in surface samples. In addition, to Bambusoideae grasses, Saddle plateaued are chiefly produced in two other grasses, Phragmites of Arundinoideae and Isachne of Micrairoideae (Biswas et al., 2016, 2021). Both of these genera grow in regions with high soil available moisture, so this morphotype may act as an indicator of low to moderate warm and humid climatic conditions because this type is prevalent in grasses growing in the regions where water input through precipitation is higher than loss through evapotranspiration. Saddle and Rondel are only about 2% of the total phytolith assemblage in bambusoid grasses, so relatively high abundance of these morphotypes in surface or fossil soil spectra does not necessarily mean bambusoid grasses were present in surface vegetation. Further, Rondel is produced in all grass subfamilies, although this morphotype is usually recovered in high amounts from the regions with lower temperature perhaps explaining why higher frequency of Rondel is observed in EH surface soils. We observed that the Tower morphotype increases in sites with comparatively high temperature and lower precipitation both in living grasses and surface samples, even though previous work indicated these types have no ecological significance.
Implications of Saddle tall and Saddle collapsed types for reconstructing past climatic variability
As mentioned above, Ghosh et al. (2018) reconstructed Indian summer monsoonal (ISM) variability in the EH for the last c. 2.4 ka using multiple proxies. In this study we re-evaluated phytolith data from this record and used sub-types of Saddle tall and Saddle collapsed to understand if they are reliable in reconstructing past climate. We found that under the warm and strong monsoonal regime between ca. 2.4 and 1.8 ka in the SMP sedimentary record, Saddle tall (Group 1 and 2) are more abundant than Saddle collapsed (Group 2) and Saddle tall (Group 3), suggesting a warm climate with moderate summer monsoon precipitation. Low recovery of Saddle tall (Group 3) and Saddle collapsed (Group 2) types between ca. 1.8 and 0.8 ka compared to the earlier period indicates a weakening ISM, corroborating with the earlier published record. Subsequently, a cooler but strong monsoonal phase in the Darjeeling Himalaya c. 0.8 ka onward may be inferred from higher frequencies of Saddle tall (Group 3) and Saddle collapsed (Group 2) types over Saddle tall (Group 1 and 2) types. Our study shows that variability in temperature and rainfall regimes may induce considerable changes in distribution of bambusoid grasses in the eastern and northeastern India and even minor changes in the climate can be reflected by changes in phytolith spectra.
Conclusions
Grass phytoliths are excellent indicators of climate that can be used as a tool in ecological studies. The different environmental parameters influence the phytolith production in grasses. In eastern and north-eastern India phytolith production in Bambusoideae is influenced by the complex relationship between summer monsoonal precipitation (MPWeQ) and mean temperature of the driest quarter (MTDQ) of the year. Sub-categorization of two dominant phytolith morphotypes produced in Bambusoideae was crucial to improve their ecological indicative potential. Higher production of smaller Saddle tall phytoliths indicates high temperature conditions, while high production of large Saddle tall types and Saddle collapsed types with length/width ratio >2.5 is indicative of high summer monsoonal rainfall. Saddle tall and Saddle collapsed types reliably capture minor changes in environmental setting. The results of our study are in conformity with changes observed in a fossil phytolith record from the eastern Himalaya. Variability in size of Saddle tall and Saddle collapsed types produced in Bambusoideae grasses reflect differential grass-water requirement. A larger dataset with more modern bambusoid grasses could improve the correlation between the Saddle tall (Group 3) and Saddle collapsed (Group 2) types and climatic variables.
Supplemental Material
sj-doc-1-hol-10.1177_09596836241266399 – Supplemental material for Phytoliths in bamboos from eastern and north-eastern India: Implications in distinguishing different ecoclimatic conditions and in deciphering Late Holocene climate variability
Supplemental material, sj-doc-1-hol-10.1177_09596836241266399 for Phytoliths in bamboos from eastern and north-eastern India: Implications in distinguishing different ecoclimatic conditions and in deciphering Late Holocene climate variability by Oindrila Biswas, Madhab Naskar, Korobi Saikia, Badal Kumar Datta, Ashish Kumar Chowdhury, Dipak Kumar Paruya, Manjuree Karmakar, Ranita Biswas, Ruby Ghosh and Subir Bera in The Holocene
Footnotes
Acknowledgements
OB acknowledges the financial assistance of CSIR, New Delhi (Sanction No. 09/028(1034)/2018-EMR-I, dated: 16/04/2018) in the form of Senior Research Fellowship. MN thankfully acknowledges UGC for financial assistance (Approval Letter No. PSW-070/13-14 dt. 18/03/2014). KS acknowledge the Director, Birbal Sahni Institute of Palaeosciences, Lucknow for providing the infrastructural facilities to complete this work (No. BSIP/RDCC/Publication no. 24/2022-2023). SB, OB, MN, DKP, MK, and RB acknowledge Center of Advance Study (Phase-VII grant), Department of Botany, University of Calcutta for the infrastructural support. Authors are thankful to PCCF, Sikkim [Ref. No. 109 GOS/FEWMD/Pr. Dir. (REE)], Arunachal Pradesh (Ref No. CWL/G/13(95)/2011-12/Pt./2142, dates: 21/01/2015), West Bengal, and Tripura University for the collection of samples. Thanks, are also due to the authorities of Central National Herbarium, Botanical Survey of India for helping in identifying the bamboo samples and to Center for Research in Nano Science and Technology (CRNN), University of Calcutta for SEM images. Authors are thankful to Dr. Biswajit Mukherjee and Dr. Mahasin Ali Khan for their help during the collection of samples.
Credit authorship contribution statement
Oindrila Bisaws: Data curation; Investigation; Writing – Original draft.
Madhab Naskar: Data curation; Investigation; Writing – Original draft.
Korobi Saikia: Investigation; Writing – Original draft.
B.K. Datta: Sample collection.
A. K. Chowdhury: Sample collection.
Dipak Kumar Paruya: Sample collection.
Manjuree Karmakar: Investigation.
Ranita Biswas: Investigation.
Ruby Ghosh: Data curation; Investigation; Writing – Original draft.
Subir Bera: Conceptualization; supervision; writing – review and editing.
Funding
The author(s) disclosed receipt of the following financial support for the research, authorship, and/or publication of this article: Funding: This work was supported by the DST, SERB (Sanction No. EMR/2016/005209, dt 28/05/2018; File No. EMR/2016/006125, dt: 16.07.2018, and SERB/SR/SO/PS/94/2010, dt 28/05/2012).
ORCID iDs
A. K. Chowdhury
Subir Bera
Data availability statement
The data supporting the findings of this study are available in supplementary online material.
Supplemental material
Supplemental material for this article is available online.
References
1.
AdkoliNS (2002) Indian bamboos in early 21st century. In: KumarARaoIVRSastryC (eds) Bamboo for Sustainable Development, Proceedings of the Vth International Bamboo Congress and the VIth International Bamboo Workshop. San José, Costa Rica: VSP Publishers, pp.17–25.
2.
AlbertRMBamfordMK (2012) Vegetation during UMBI and deposition of Tuff IF at Olduvai Gorge, Tanzania (ca. 1.8 Ma) based on phytoliths and plant remains. Journal of Human Evolution63: 342–350.
3.
AlexandreAMeunierJDLézineAM, et al. (1997) Phytoliths: Indicators of grassland dynamics during the late Holocene in intertropical Africa. Palaeogeography Palaeoclimatology Palaeoecology136: 213–229.
4.
AnXLuHChuG (2015) Surface soil phytoliths as vegetation and altitude indicators: A study from the southern Himalaya. Scientific Reports5: 15523.
5.
Bamboo Phylogeny Group (BPG) (2012) An updated tribal and subtribal classification of the bamboos (Poaceae: Bambusoideae). In: GielisJPottersG (eds) Proceedings of the 9th World Bamboo Congress. Antwerp, Belgium: World Bamboo Organization, pp.3‒27.
6.
BanerjiRK (1984) Post-eocene biofacies, palaeoenvironments and palaeogeography of the Bengal Basin, India. Palaeogeography Palaeoclimatology Palaeoecology45: 49–73.
7.
BarboniDBonnefilleRAlexandreA, et al. (1999) Phytoliths as paleoenvironmental indicators, West Side Middle Awash Valley, Ethiopia. Palaeogeography Palaeoclimatology Palaeoecology152: 87–100.
8.
BarboniDBremondL (2009) Phytoliths of East African grasses: An assessment of their environmental and taxonomic significance based on floristic data. Review of Palaeobotany and Palynology158(1–2): 29–41.
9.
BarboniDBremondLBonnefilleR (2007) Comparative study of modern phytolith assemblages from inter-tropical Africa. Palaeogeography Palaeoclimatology Palaeoecology246: 454–470.
10.
BhattaraiKRVetaasORGrytnesJA (2004) Fern species richness along a central Himalayan elevational gradient, Nepal. Journal of Biogeography31(3): 389–400.
11.
BiswasOGhoshRAgrawalS, et al. (2021) A comprehensive calibrated phytolith based climatic index from the Himalaya and its application in palaeotemperature reconstruction. Science of the Total Environment750: 142280.
12.
BiswasOGhoshRParuyaDK, et al. (2016) Can grass phytoliths and indices be relied on during vegetation and climate interpretations in the eastern Himalayas? Studies from Darjeeling and Arunachal Pradesh, India. Quaternary Science Reviews134: 114–132.
BourelBNovelloA (2020) Bilobate phytolith size matters for taxonomical and ecological identification of Chad grasses: A case study on 15 species. Review of Palaeobotany and Palynology275: 104–114.
15.
BremondLAlexandreAPeyronO, et al. (2005) Grass water stress estimated from phytoliths in West Africa. Journal of Biogeography32(2): 311–327.
16.
BremondLAlexandreAWoollerMJ, et al. (2008) Phytolith indices as proxies of grass subfamilies on East African tropical mountains. Global and Planetary Change61: 209–224.
17.
BystriakovaNKaposVLysenkoI, et al. (2003) Distribution and conservation status of forest bamboo biodiversity in the Asia-Pacific region. Biodiversity and Conservation12: 1833–1841.
18.
ChabotYGarnierAGeriaIM (2018) Phytolith analysis from the archaeological site of Kota Cina (North Sumatra, Indonesia). Journal of Archaeological Science Reports20: 483–501.
19.
ChampionHGSethSK (1968) Revised Survey of Forest Types of India. New Delhi, India: Government of India Publication, p.404.
20.
ChenILiKTTsangCH (2020) Silicified bulliform cells of Poaceae: Morphological characteristics that distinguish subfamilies. Botanical Studies61: 5.
21.
ChowdheryHJGiriGSPalGD, et al. (2009) Materials for the Flora of Arunachal Pradesh, vol. 3. Kolkata: Botanical Survey of India.
22.
ClarkeJ (2003) The occurrence and significance of biogenic opal in the regolith. Earth-Science Reviews60: 175–194.
23.
ClarkLOlivieraR (2018) Diversity and Evolution of the New World Bamboos (Poaceae: Bambusoideae: Bambuseae, Olyreae). Keynote Lecture in the 11th World Bamboo Congress, Xalapa, Mexico.
24.
ClarkLGLondonoXRuiz-SanchezE (2015) Bamboo taxonomy and habitat. In: LieseWKohlM (eds) Bamboo-the Plant and Its Uses. Springer (eBook), pp.1–30.
25.
CoeHHGMacarioKGomesJG, et al. (2014) Understanding Holocene variations in the vegetation of Sao Joao River basin, southeastern coast of Brazil, using phytolith and carbon isotopic analyses. Palaeogeography Palaeoclimatology Palaeoecology415: 59–68.
26.
ConleyDJSchelskeCL (2002) Biogenic silica. In: SmolJPBirksHJBLastWM, et al (eds) Tracking Environmental Change Using Lake Sediments, vol. 3. Dordrecht: Springer, Developments in Paleoenvironmental Research, pp.281– 293.
27.
DeySBGhoshRShekharM, et al. (2015) What drives elevational pattern of phytolith diversity in Thysanolaena maxima (Roxb.) O. Ktze? A study from the Darjeeling Himalayas. Flora211: 51–61.
28.
DickauRWhitneyBSIriarteJ, et al. (2013) Differentiation of neotropical ecosystems by modern soil phytolith assemblages and its implications for palaeoenvironmental and archaeological reconstructions. Review of Palaeobotany and Palynology193: 15–37.
29.
DikshitKRDikshitJK (2014) North-East India: Land, People and Economy. Netherlands: Springer.
30.
FickSEHijmansRJ (2017) Worldclim 2: New 1-km spatial resolution climate surfaces for global land areas. International Journal of Climatology37: 4302–4315.
31.
FredlundGGTieszenLL (1997) Calibrating grass phytolith assemblages in climatic terms: Application to late Pleistocene assemblages from Kansas and Nebraska. Palaeogeography Palaeoclimatology Palaeoecology136(1–4): 199–211.
32.
FredlundGGTieszenLT (1994) Modern phytolith assemblages from the North American Great Plains. Journal of Biogeography21(3): 321–335.
33.
GarnierANeumannKEichhornB, et al. (2013) Phytolith taphonomy in the middle- to late-Holocene fluvial sediments of Ounjougou (Mali, West Africa). Holocene23(3): 416–431.
34.
GhoshRBiswasABruchAA, et al. (2021) Palaeoclimate estimates based on the late Miocene to early Pleistocene wood flora of the Bengal Basin: An insight into the climatic evolution of southern Asia. Palaeobiodiversity and Palaeoenvironments101: 141–162.
35.
GhoshRBiswasOParuyaDK, et al. (2018) Hydroclimatic variability and corresponding vegetation response in the Darjeeling Himalaya, India over the past ~2400 years. CATENA170: 84–99.
36.
GhoshRNaskarMBeraS (2011) Phytolith assemblages of grasses from the Sunderbans, India and their implications for the reconstruction of deltaic environments. Palaeogeography Palaeoclimatology Palaeoecology311: 93–102.
37.
Grass Phylogeny Working Group II (2012) New grass phylogeny resolves deep evolutionary relationships and discovers C4 origins. New Phytologist193: 304–312.
38.
GroupGPWBarkerNPClarkLG; Grass Phylogeny Working Group (GPWG),et al. (2001) Phylogeny and subfamilial classification of the grasses (Poaceae). Annals of the Missouri Botanical Garden88: 373–457.
39.
GuYLiuHWangH, et al. (2016) Phytoliths as a method of identification for three genera of woody bamboos (Bambusoideae) in tropical southwest China. Journal of Archaeological Science68: 46–53.
40.
GuYPearsallDMXieS, et al. (2008) Vegetation and fire history of a Chinese site in southern tropical Xishuangbanna derived from phytolith and charcoal records from Holocene sediments. Journal of Biogeography35(2): 325–341.
41.
GuYZhaoZPearsallDM (2013) Phytolith morphology research on wild and domesticated rice species in East Asia. Quaternary International287: 141–148.
42.
HajraPKVermaDM (1996) Flora of Sikkim, vol. I. Kolkata: Botanical Survey of India.
43.
HuanXLuHWangC, et al. (2015) Bulliform phytolith research in wild and domesticated rice paddy soil in South China. PLoS One10(10):e0141255.
44.
HwangSYoonSOLeeJY, et al. (2012) Phytolith analysis and reconstruction of palaeoenvironment at the Nabokri valley plain, Buyeo, Korea. Quaternary International254: 129–137.
45.
International Committee for Phytolith Taxonomy (ICPT), NeumannKStrömbergCBall (2019) International code for Phytolith Nomenclature (ICPN) 2.0. Annals of Botany124(2): 189–199.
46.
Issaharou-MatchiIBarboniDMeunierJD, et al. (2016) Intraspecific biogenic silica variations in the grass species Pennisetum pedicellatum along an evapotranspiration gradient in South Niger. Flora220: 84–93.
47.
JenkinsEJamjoumKNuimatS, et al. (2011) Irrigation and phytolith formation: An experimental study. In: MithenSBlackE (eds) Water, Life and Civilisation: Climate, Environment and Society in the Jordan Valley (International Hydrology Series). Cambridge: Cambridge University Press, pp.347–372.
48.
JieDGeYGuoJ (2010) Response of phytolith in Leymus chinensis to the simulation of global warming and nitrogen deposition on Songnen grassland, China. Environmental Sciences31(8): 1709–1715.
49.
JonesRLBeaversAH (1963) Some mineralogical and chemical properties of plant opal. Soil Science96: 375–379.
50.
KalliolaRLinnaAToiviainenL, et al. (2019) Phytolith assemblages in the leaves of Guadua bamboo in Amazonia. Journal of Bamboo and Rattan18(2): 31–43.
51.
KarmakarMBiswasRMukherjeeB, et al. (2024) Chloridoideae grass phytoliths can distinguish two different rainfall zones: A case study from northern parts of Western Ghats, India. Quaternary International681: 11–23.
52.
KelloggEAAbbottJRBawaKS, et al. (2020) Checklist of the grasses of India. PhytoKeys163: 1–560.
53.
KlugeJKesslerMDunnRR (2006) What drives elevational patterns of diversity? A test of geometric constraints, climate and species pool effects for pteridophytes on an elevational gradient in Costa Rica. Global Ecology and Biogeography15: 358–371.
54.
KondoRChildsCAtkinsonI (1994) Opal Phytoliths of New Zealand. Canterbury: Manaaki Whenua Press, p.85.
55.
LepšJŠmilauerP (2003) Multivariate Analysis of Ecological Data Using CANOCO. New York: Cambridge University Press.
56.
LiBSongZLiZ, et al. (2014) Phylogenetic variation of phytolith carbon sequestration in bamboos. Scientific Reports4(1): 4710.
57.
LiDWangZZhuZ, et al. (2006) Bambuseae (Poaceae). In: WuZYRavenPHHongDY (eds) Flora of China, vol. 22. Beijing and St. Louis: Science Press and Missouri Botanical Garden Press, pp.7–180.
58.
LiDHJieDMLiuLD, et al. (2018) Herbaceous phytoliths from forest and grassland in northeast China: Potential significance for determining past forest–grassland boundaries. Flora243: 19–31.
59.
LieseWHamburgFRG (1987) Research on Bamboo. Wood Science and Technology21: 189–209.
60.
LiQXuDLuH (2005) Morphology of phytolith in Bambusoideae (Poaceae) and its ecological significance. Quaternary Science25: 777–784.
61.
LiRCarterJAXieS, et al. (2010) Phytoliths and microcharcoal at Jinluojia archeological site in middle reaches of Yangtze River indicative of paleoclimate and human activity during the last 3000 years. Journal of Archaeological Science37(1): 124–132.
62.
LiRFanJCarterJ, et al. (2017) Monthly variations of phytoliths in the leaves of the bamboo Dendrocalamus ronganensis (Poaceae: Bambusoideae). Review of Palaeobotany and Palynology246: 62–69.
63.
LiRTanSQinX, et al. (2016) Studies on the phytolith variation in maize during growing season significance. Acta Micropalaeontologica Sinica33(2): 170–179.
64.
LiuLJieDLiuH, et al. (2013) Response of phytoliths in Phragmites communis to humidity in NE China. Quaternary International304: 193–199.
65.
LiuLJieDLiuH, et al. (2021) An evaluation of soil phytoliths for reconstructing plant communities and palaeoclimate in the northern temperate region. European Journal of Soil Science72: 900–917.
66.
LiZSongZLiB (2013) The production and accumulation of phytolith-occluded carbon in Baiyangdian reed wetland of China. Applied Geochemistry37: 117–124.
67.
LuHLiuKB (2003) Phytoliths of common grasses in the coastal environments of south-eastern USA. Estuarine Coastal and Shelf Science58: 587–600.
68.
LuHLiuZWuN, et al. (2002) Rice domestication and climatic change, phytolith evidence from East China. Boreas31: 378–385.
69.
LuHWuNNieZ (1995) Discovery of bamboo phytolith in the loess-paleosol sequences of Guanzhong Basin, Shaanxi Province. Chinese Science Bulletin40(5): 405–405.
70.
LuHYWuNQYangXD, et al. (2006) Phytoliths as quantitative indicators for the reconstruction of past environmental conditions in China I: Phytolith-based transfer functions. Quaternary Science Reviews25: 945–959.
71.
LulHYLiuKB (2005) Phytolith assemblages as indicators of coastal environmental changes and hurricane overwash deposition. Holocene15: 965–972.
72.
LuYWuNLiuK, et al. (2007) Phytoliths as quantitative indicators for the reconstruction of past environmental conditions in China II: Palaeoenvironmental reconstruction in the Loess Plateau. Quaternary Science Reviews26: 759–772.
73.
MadellaMAlexandreABallT (2005) International code for Phytolith Nomenclature 1.0. Annals of Botany96(2): 253–260.
74.
MadellaMJonesMKEchlinP, et al. (2009) Plant water availability and analytical microscopy of phytoliths: Implications for ancient irrigation in arid zones. Quaternary International193: 32–40.
75.
MercaderJAstudilloFBarkworthM, et al. (2010) Poaceae phytoliths from the Niassa Rift, Mozambique. Journal of Archaeological Science37: 1953–1967.
76.
MercaderJBennettTEsselmontC, et al. (2013) Phytoliths from middle stone age habitats in the Mozambican Rift (105-29 ka). Journal of Human Evolution64: 328–336.
77.
MessagerELordkipanidzeDDelhonC, et al. (2010) Palaeoecological implications of the lower Pleistocene phytolith record from the Dmanisi Site (Georgia). Palaeogeography Palaeoclimatology Palaeoecology288(1-4): 1–13.
78.
MitraSMukherjeeS (2007) Diversity and reassessment of bamboos in West Bengal. Journal of Economic and Taxonomic Botany31(1): 78–90.
79.
MonttiLHonaineMFOsterriethM, et al. (2009) Phytolith analysis of Chusquea ramosissima Lindm. (Poaceae: Bambusoideae) and associated soils. Quaternary International193: 80–89.
80.
MotomuraHFujiiTSuzukiM (2004) Silica deposition in relation to ageing of leaf tissues in Sasa veitchii (Carriere) Rehder (Poaceae: Bambusoideae). Annals of Botany93: 235–248.
81.
MotomuraHFujiiTSuzukiM (2006) Silica deposition in abaxial epidermis before the opening of leaf blades of Pleioblastus chino (Poaceae, Bambusoideae). Annals of Botany97: 513–519.
82.
MulhollandSC (1989) Phytolith shape frequencies in North Dakota grasses: A comparison to general patterns. Journal of Archaeological Science16: 489–511.
83.
MurungiMLMcGlynnGLejjuJB (2017) Alpine grassland palaeoecology of the Virunga Volcanoes, East Africa: A new phytolith record from Mt. Muhavura. Quaternary International434: 102–116.
84.
NaskarMBeraS (2018) Taxonomic assessment of opal phytoliths from grasses of deltaic West Bengal, India. Nordic Journal of Botany36: 1–42. DOI: 10.1111/njb.01695
85.
NaskarMBlinnikovMGhoshR, et al. (2021) A diagnostic phytolith morphotype found in Porteresia coarctata (Roxb.) Tateoka indicates coastal swampy mangrove environments: A case study from the Indian east coast. Flora282: 151884.
86.
NaskarMGhoshRDasS, et al. (2022) Grass phytoliths in surface sediments of the Sunderbans, India and their implications in reconstructing past deltaic environmental changes. Holocene32: 1193–1208.
87.
National Bamboo Mission (2008) One year of National Bamboo Mission in the states of NE Region, West Bengal, Orissa, Jharkhand, and Bihar. Guwahati: Cane and Bamboo Technology Centre (CBTC).
88.
NeumannKFahmyAGMüller-ScheeßelN, et al. (2017) Taxonomic, ecological and palaeoecological significance of leaf phytoliths in West African grasses. Quaternary International434: 15–32.
89.
NoguéSWhicherKBakerAG, et al. (2017) Phytolith analysis reveals the intensity of past land use change in the Western Ghats biodiversity hotspot. Quaternary International437: 82–89.
90.
ParrJSullivanLChenB, et al. (2010) Carbon bio-sequestration within the phytoliths of economic bamboo species. Global Change Biology16: 2661–2667.
91.
PearsallDM (ed.) (2000) Palaeoethnobotany: A Handbook of Procedures, 2nd edn.SanDiego: Academic Press.
92.
PipernoDR (1988) Phytolith Analysis: An Archaeological and Geological Perspective. San Diego: Academic Press.
93.
PipernoDR (2006) Phytoliths: A Comprehensive Guide for Archaeologists and Paleogeologists. New York: Altamira Press.
94.
PipernoDRPearsallDM (1998) The Silica Bodies of Tropical American Grasses: Morphology, Taxonomy, and Implications for Grass Systematics and Fossil Phytolith Identification. Smithsonian Contributions to Botany No. 85. Washington, D.C: Smithsonian Institution Press, p.40.
95.
PrasadVStrömbergCAAlimohammadianH, et al. (2005) Dinosaur coprolites and the early evolution of grasses and grazers. Science310(5751): 1177–1180.
96.
PrychidCJRudallPJGregoryM (2003) Systematics and biology of silica bodies in monocotyledons. Botanical Review69: 377–440.
97.
RajendiranSCoumarVKunduS, et al. (2012) Role of phytolith occluded carbon of crop plants for enhancing soil carbon sequestration in agro-ecosystems. Current Science103(8): 911–920.
98.
RosenAMWeinerS (1994) Identifying ancient irrigation: A new method using opaline phytoliths from emmer wheat. Journal of Archaeological Science21(1): 125–132.
99.
RovnerI (1983) Plant opal phytolith analysis: Major advances in archaeobotanical research. In: Schiffer B (eds) Advances in Archaeological Method and Theory. Academic Press, pp.225–266.
100.
RStudio Team (2022) RStudio: Integrated Development Environment for R. RStudio. Boston, MA: PBC. Available at: http://www.rstudio.com/.
101.
SangenMNeumannKEisenbergJ (2011) Climate-induced fluvial dynamics in tropical Africa around the last glacial maximum?Quaternary Research76: 417–429.
102.
SharmaEChettriNTse-RingK, et al. (2009) Climate Change Impacts and Vulnerability in the Eastern Himalayas. Kathmandu: ICIMOD.
103.
SharmaMNirmalaC (2015) Bamboo diversity of India: an update. In: Proceedings of the 10th World Bamboo Congress; Damyang, Korea. Plymouth, MA: World Bamboo Organization.
104.
SoderstromTRCalderonCE (1979) A commentary on the bamboos (Poaceae: Bambusoideae). Biotropica11(3): 161–172.
105.
SolomonovaMYBlinnikovMSSilantyevaMM, et al. (2019) Influence of moisture and temperature regimes on the phytolith assemblage composition of mountain ecosystems of the mid latitudes: A case study from the Altay Mountains. Frontiers in Ecology and Evolution7: 1–22. DOI: 10.3389/fevo.2019.00002
106.
SongZWangHStrongPJ, et al. (2014) Phytolith carbon sequestration in china’s croplands. European Journal of Agronomy53: 10–15.
107.
SorengRPetersonPRomaschenkoK, et al. (2015) A worldwide phylogenetic classification of the Poaceae (Gramineae). Journal of Systematics and Evolution53(2): 117–137.
108.
SorengRJPetersonPMZuloagaFO, et al. (2022) A worldwide phylogenetic classification of the Poaceae (Gramineae)III: An update. Journal of Systematics and Evolution60(3): 476–521.
109.
StrömbergC (2003) The origin and spread of grass-dominated ecosystems during the Tertiary of North America and how it relates to the evolution of hypsodonty in Equids. PhD thesis, University of California, Berkeley, USA.
110.
StrömbergC (2004) Using phytolith assemblages to reconstruct the origin and spread of grass dominated habitats in the Great Plains during the late Eocene to early Miocene. Palaeogeography Palaeoclimatology Palaeoecology207(3–4): 239–275.
111.
TaoXWenMLiR, et al. (2020) Phytolith sizes and assemblages differentiate genera and ecotypes of woody bamboos in subtropical southwest China. Review of Palaeobotany and Palynology272. DOI: 10.1016/j.revpalbo.2019.104129
112.
Ter BraakC (1988) Canoco-a FORTRAN Program for Canonical Community Ordination by (Partial) (Detrended) (Canonical) Correspondence Analysis, Principal Components Analysis and Redundancy Analysis (Version 2.1). Technical Report, LWA-88-02, GLW, Wageningen. p. 95.
113.
Ter BraakCJF (1986) Canonical correspondence analysis: A new eigenvector technique for multivariate direct gradient analysis. Ecology67: 1167–1179.
114.
Ter BraakCJFSmilauerP (2002) CANOCO 4.5. Biometris. Wageningen: Wageningen University and Research Center, p.500.
115.
Ter BraakCJFVerdonschotPFM (1995) Canonical correspondence analysis and related multivariate methods in aquatic ecology. Aquatic Sciences57: 255–289.
116.
Ter BraakCPrenticeIC (1988) A theory of gradient analysis. Advances in Ecological Research. Academic Press8: 271–317.
117.
TewariSNegiHKaushalR (2019) Status of bamboo in India. International Journal of Economic Plants6(1): 030–039.
118.
ThokchomAYadavaP (2015) Bamboo and its role in climate change. Current Science108(5): 762–763.
119.
TraoréDDGuYLiuH, et al. (2015) Vegetation types and climate conditions reflected by the modern phytolith assemblages in the subalpine Dalaoling Forest Reserve, central China. Frontiers in Earth Science9: 268–275.
120.
TurcL (1954) Le bilan d’eau des sols: Relation entre les precipitation: l’evaporationet l’ecoulement. Annales Agronomiques5: 491–596.
121.
TwissPC (1992) Predicted world distribution of C3 and C4 grass phytoliths. In: RappGMulhollandSC (eds) Phytolith Systematics, Advances in Archaeological and Museum Science, vol. 1. Springer, Boston, MA, pp.113–128.
122.
TwissPCSuessESmithRM (1969) Morphological classification of grass phytoliths. Soil Science Society of America Proceedings33: 109–115.
123.
VetaasOR (2000) Comparing species temperature response curves: Population density versus second-hand data. Journal of Vegetation Science11: 659–666.
124.
VetaasOR (2006) Biological relativity to water energy dynamics: A potential unifying theory?Journal of Biogeography33: 1866–1867.
125.
WangCLuHZhangJ, et al. (2019) Bulliform phytolith size of rice and its correlation with hydrothermal environment: A preliminary morphological study on species in southern China. Frontiers in Plant Science10: 1037.
126.
WatlingJIriarteJ (2013) Phytoliths from the coastal savannas of French Guiana. Quaternary International287: 162–180.
127.
WatlingJIriarteJWhitneyBS, et al. (2016) Differentiation of neotropical ecosystems by modern soil phytolith assemblages and its implications for palaeoenvironmental and archaeological reconstructions II: Southwestern Amazonian forests. Review of Palaeobotany and Palynology226: 30–43.
128.
WatlingKMParrJFRintoulL, et al. (2011) Raman, infrared and XPS study of bamboo phytoliths after chemical digestion. Spectrochimica Acta80(1): 106–111.
129.
WoodburnTLJohnsonWCMasonJA, et al. (2017) Vegetation dynamics during the P leistocene–Holocene transition in the central Great Plains, USA. Holocene27(1): 155–163.
130.
ZhangYXGuoCLiDZ (2020) A new subtribal classification of Arundinarieae (Poaceae, Bambusoideae) with the description of a new genus. Plant Diversity42: 127–134.
131.
ZhanHJuanLZhao-huiN, et al. (2019) Silicon variation and phytolith morphology in different organs of Dendrocalamus brandisii (Munro) Kurz (Bambusoideae). Brazilian Journal of Botany42: 529–541.
132.
ZhouLLiRVachulaRS, et al. (2022) Phytolith morphology and assemblage variations in a bamboo forest plant–soil system. Review of Palaeobotany and Palynology300. DOI: 10.1016/j.revpalbo.2022.104640
Supplementary Material
Please find the following supplemental material available below.
For Open Access articles published under a Creative Commons License, all supplemental material carries the same license as the article it is associated with.
For non-Open Access articles published, all supplemental material carries a non-exclusive license, and permission requests for re-use of supplemental material or any part of supplemental material shall be sent directly to the copyright owner as specified in the copyright notice associated with the article.