
Abstract
The Bay of Brest (BB) is a shallow estuarine environment in NW France. This semi-enclosed basin of 180 km² is subject to multiple hydrodynamic factors including the dual influence of oceanic currents and fluvial discharges (Aulne and Elorn main rivers) and resulting in complex hydro-climatic and hydro-sedimentary processes. This study investigates with palynological data (continental: pollen grains and marine: dinoflagellate cysts) two kinds of different materials: (i) modern surface sediments collected over the whole BB as well as (ii) three new BB sediment cores (core ‘F’ from the mouth of the Aulne river and cores PALM-KS05 and PALM-KS06 from the Brest harbour). While modern data are analysed from a statistical point of view to highlight the influence of hydrodynamic forcing on the modern distribution of palynomorphs, the cores allow for spatial comparisons of palynological data on three windows over the Early (~9.5 and ~8.5 ka BP), Middle (~4.4–4.3 ka BP interval) and Late (~1–0.9 ka BP interval) Holocene. For each time intervals, two cores located along a transect from west (more pronounced oceanic influence) to east (more intense fluvial influence from the Aulne river) are compared, located on either side of a limit that we referred to as the river-induced palynological signal (RIPS) limit. These different comparisons reveal a high degree of spatial homogeneity in BB pollen records over time, with exceptions for environments east of the RIPS limit, for which rainfall-induced fluvial discharges have a stronger impact especially considering riparian taxa (i.e. Alnus). This is intended to improve understanding of the palynological signals recorded at different BB coring sites, a first step of crucial relevance before the establishment of a palynological stack covering the Holocene from several cores collected in different shallow bays of the BB (see Valero et al., submitted – PART II).
Introduction
The Bay of Brest (BB) is a shallow (8 m deep on average) macro-estuarine environment in north-western France (Figure 1). This semi-enclosed basin is subject to macro-tidal dynamics and to the fluvial influences of the Aulne and Elorn rivers, whose combined drain watersheds extend over 2600 km² (Figure 1).
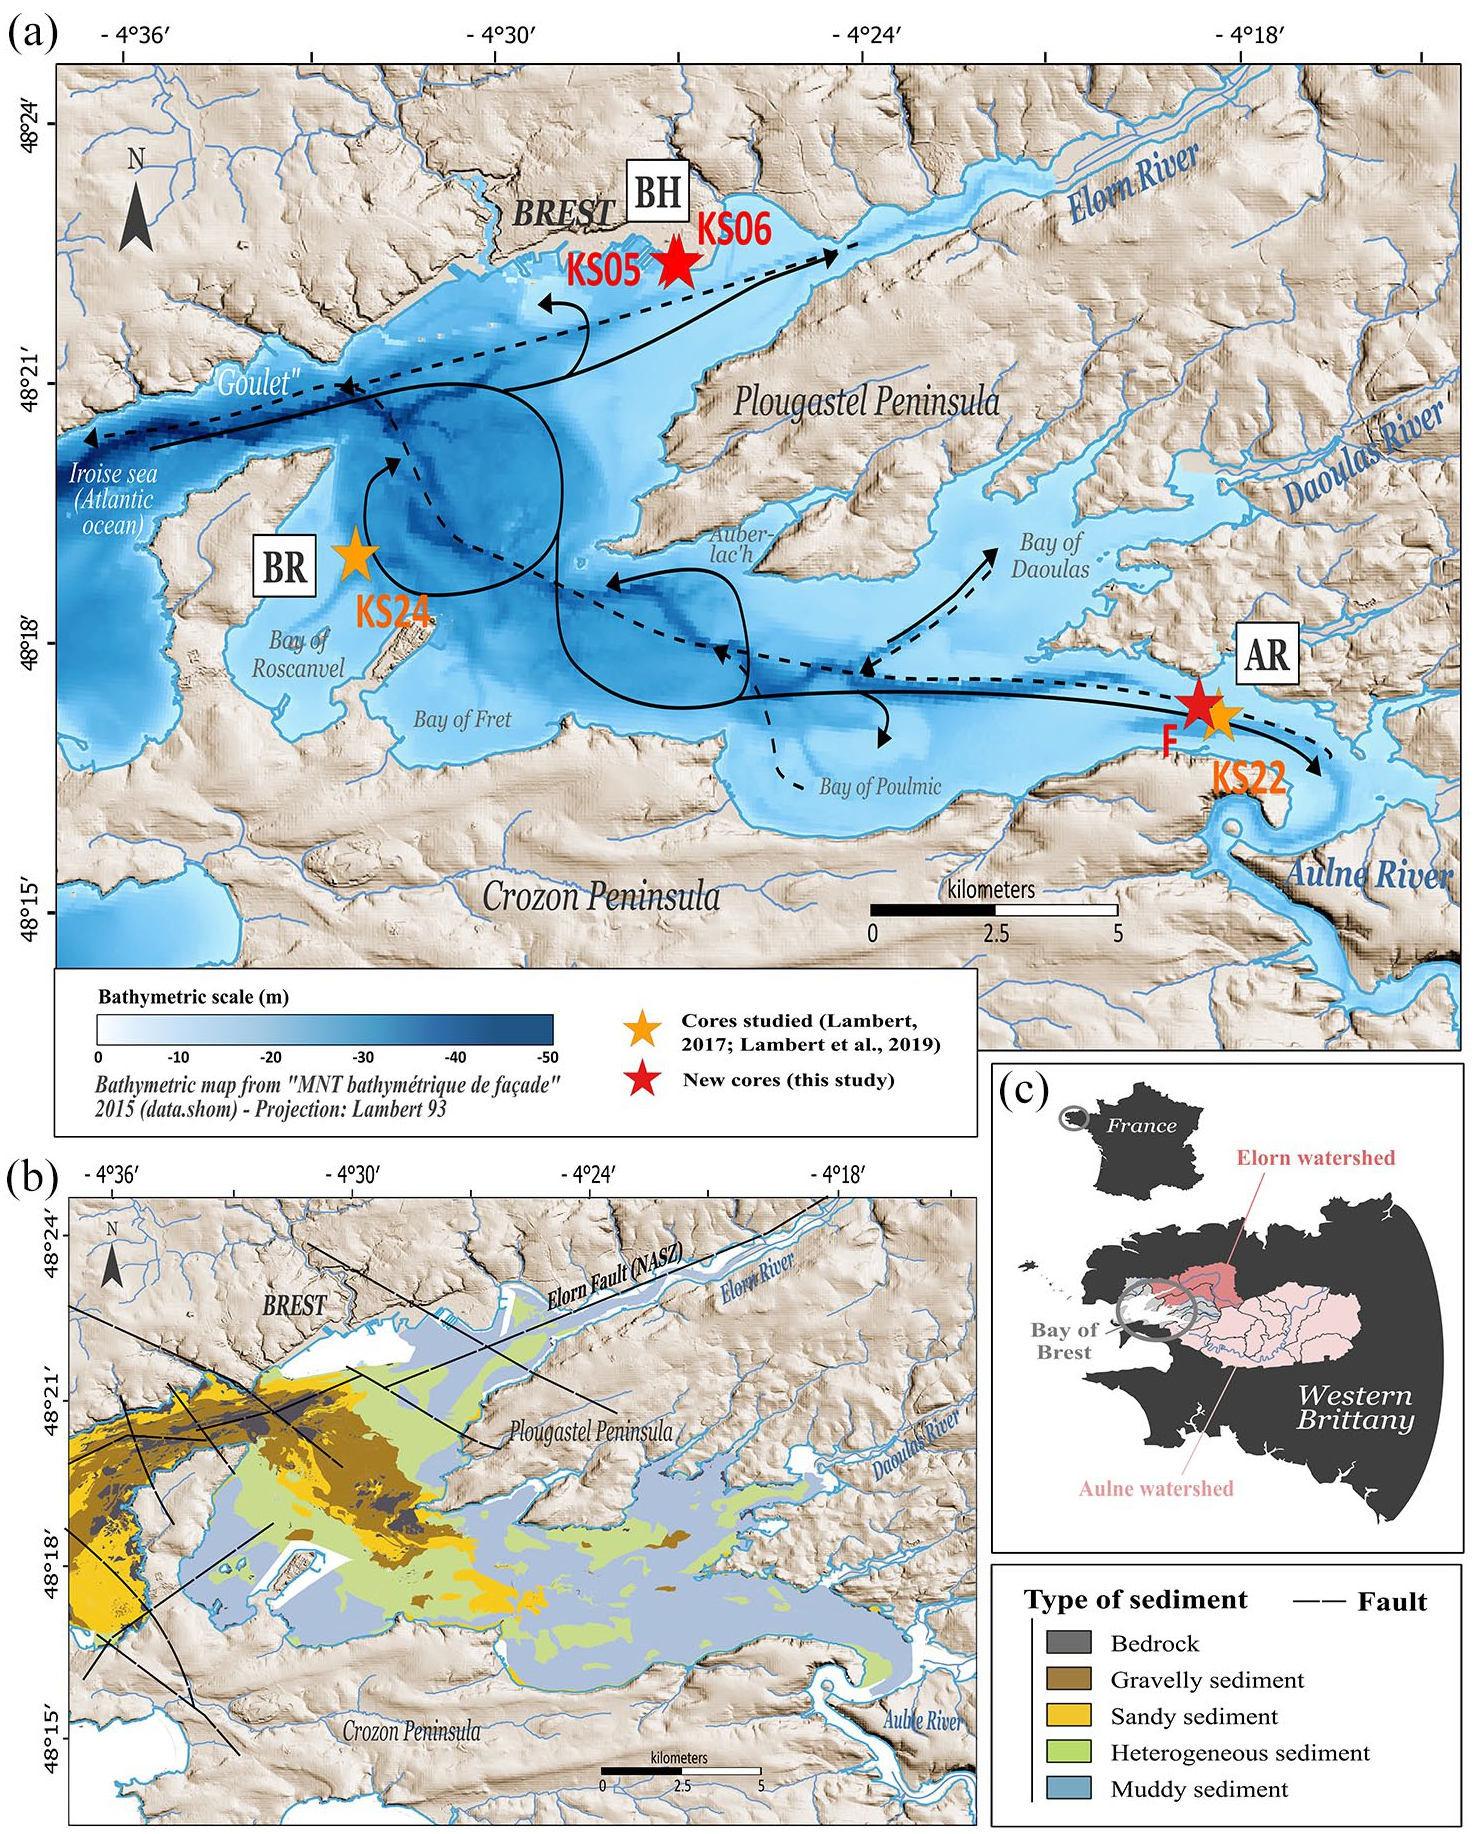
(a) Location of the five cores selected for this study in the Bay of Brest: two cores previously analysed (core SRQ3-KS22: Lambert, 2017; core SRQ3-KS24: Lambert et al., 2019) shown with orange stars, and three new cores presented in this study (cores PALM-KS05, PALM-KS06 and ‘F’) shown with red stars. The cores are distributed over three sites: Bay of Roscanvel (BR), Brest harbour (BH) and mouth of the Aulne river (AR). Tidal currents (corresponding to a coefficient 95 at the Brest harbour; adapted from Guérin (2004) are also displayed with their circulation during flow (solid line) and ebb (dashed line). (b) Nature of surface sediments (data simplified from Gregoire et al., 2016) and the main fault system (NASZ for North Armorican Shear Zone) of the BB bedrock (from Gregoire et al., 2017). Both maps (a) and (b) used the elevation from the IGN (Institut Géographique National) database BDALTIV2 associated with the Lambert 93 projection. (c) Bay of Brest watersheds are shown distinguishing those of the Aulne (pale pink) and Elorn (dark pink) rivers.
Despite complex hydro-climatic and hydro-sedimentary processes (e.g. Gregoire et al., 2016; Lambert et al., 2017), the shallow bays of the BB, characterized by lower hydrodynamics and sedimentation rates of up to 0.2 cm yr−1 (Gregoire et al., 2016), were identified as ideal locations for discussing Holocene paleoenvironmental changes at a high temporal resolution on different time windows (see Lambert et al., 2019, 2020, who documented the ~9–5 ka BP interval and the last 2.5 kyrs, respectively). The BB therefore appears suitable to reconstruct the interactions between climate, environment and human dynamics across the Holocene.
However, because the shallow BB has been subject to the Holocene relative sea-level rise, that progressively flooded paleoriver terraces (Gregoire et al., 2017), several sediment cores are required to reconstruct the long-term environmental trajectory of BB paleoenvironments across the Holocene. It is therefore crucial, before building a Holocene palynological stack (see Valero et al., submitted – PART II), to check if a paleoreconstruction based on a composite sequence from BB different cores is relevant. Indeed, if there are too many spatial variabilities and inconsistencies in the distribution of palynomorphs both today and in the past, there is little point in compiling data from sediment sequences taken from different coring sites.
This study therefore aims at discussing: (i) the present-day distribution of palynomorph deposits (i.e. organic microfossils mainly including pollen, spores, and cysts of dinoflagellates or dinocysts) in the BB thanks to new statistical analyses (hierarchical clustering analyses, diversity indexes, pollen ratios) conducted on modern data from Lambert et al. (2017) and (ii) the spatial comparisons of the palynological data for three time intervals over the Early (~9.5 and ~8.5 ka BP), Middle (~4.4–4.3 ka BP interval) and Late (~1–0.9 ka BP interval) Holocene, across a west (stronger oceanic influence) to east (stronger fluvial discharge influence) gradient in the BB. For the latter point, three BB cores (‘F’, PALM-KS05 and PALM-KS06) were examined by performing new palynological (pollen and dinoflagellate cyst) analyses, which were considered in addition to previously published data acquired on two other BB cores (core SRQ3-KS22: Lambert, 2017 and core SRQ3-KS24: Lambert et al., 2019).
The Bay of Brest (NW France) environmental context
Geomorphological and sedimentological contexts
Located in western Brittany (NW France; Figure 1a), the present-day morphology of the BB is the result of geological tectonics controlled by a fault system (the Elorn Fault, satellite of the NASZ for North Armorican Shear Zone) aligned with the Elorn estuary (N70°) that divides the study area into two regional geological parts. In the southern part, the basement of the BB is mostly composed of Brioverian to Palaeozoic sedimentary rocks, whereas in the northern part it is formed by granitic and metamorphic Hercynian rocks and Brioverian sedimentary succession (Authemayou et al., 2019; Babin et al., 1969; Ballèvre et al., 2009, 2013).
The BB is a semi-enclosed bay of 180 km² connected to the Atlantic Ocean through a 1.8 km wide strait named the Goulet (Figure 1a). It is a shallow basin (depth range between 0 and 57 m with an average depth of 8 m and ~60% surface < 10 m deep), surrounded by 250 km of coastline characterized by numerous coves and bays, which represent 40% of its surface (Gregoire et al., 2016). The BB is mainly fed by the Aulne (south) and the Elorn (north) rivers (Figure 1a and c), bordered on both sides by intertidal flats and extended by two paleovalleys. The latter incise the BB bedrock and are therefore among the deepest parts of the basin (15–30 m deep), merging to form a large valley reaching 57 m deep in the Goulet (Gregoire et al., 2016). Sediment accumulation in the BB subtidal areas is complex and fragmented depositional settings originate from their initial paleotopography submitted to the Holocene sea-level rise (Gregoire et al., 2017). Modern BB sedimentation (Figure 1b) is mainly driven by macrotidal hydrodynamics (maximum tidal range of 8 m; Troadec et al., 1997), leading to a granulometric gradient characterized by coarse bio-lithoclastic sediments within the paleovalleys and in the straits at the seaward end of the bay, and bioclastic muddy sediments in the shallower parts (Gregoire et al., 2016). The tidal influence, combined with fluvial hydrodynamics, also explain decreasing sedimentation rates from upstream of the rivers (~0.5 cm yr−1) to the inner part of the BB (<0.1 cm yr−1; Gregoire et al., 2017).
Eighty-five percent of the total freshwater inputs come from the Aulne and Elorn rivers, draining 2650 km² of BB watersheds (Delmas and Tréguer, 1983; Figure 1c). Major runoff that flows into the BB is driven by the Aulne (i.e. annual flow of ~28 m3 s−1 for the Aulne vs ~7 m3 s−1 for the Elorn; sedimentary contribution of 7000 t yr−1 for the Aulne; Gregoire et al., 2016; Guillaume Olivier et al., 2021). Both the Aulne and Elorn river mouths display muddy plugs, essentially formed by sediment resuspension by tidal currents. The stratification of the BB water masses is variable in time and space depending on the combination of river flow and superimposed tidal forcing (Pommepuy, 1977; Pommepuy et al., 1979). Recent numerical modelling (Poppeschi et al., 2021) also demonstrated that the stratification can be highly affected by the neap-spring tidal cycle under different environmental conditions. Changes in wind directions, as well as decrease in intensity, contribute to the extent of the river plume and influence the modelled surface currents. The seasonal circulation of surface layers is thus affected by an increase in river flow and by winds, especially during the winter season.
Climatic context
Western Brittany is subject to a temperate oceanic climate regime characterized by a low seasonal thermal amplitude, with mean annual temperatures of about 10–11°C (Belleguic et al., 2012). Its location in the axis of the Atlantic westerlies explains the recurrence of storms and rainy conditions, triggering an annual cumulative precipitation value ranging from 800 to 1000 mm recorded in the BB (Belleguic et al., 2012; Troadec et al., 1997). Windy conditions have mainly a south-west origin and are prevalent during the fall and winter seasons, when wind speed exceeds 100 km h−1 (~5–15 days per year; Troadec et al., 1997). The climate of Brittany is driven by the combined influences of atmospheric (North Atlantic Oscillation, NAO) and oceanic (Atlantic Multidecadal Oscillation, AMO; Sub-Polar Gyre, SPG) modes (Delmas and Tréguer, 1983; Ruprich-Robert and Cassou, 2014; Tréguer et al., 2014; Van Vliet-Lanoë et al., 2014). The efficiency of heat transport to high latitudes in the North Atlantic through the Atlantic Meridional Overturning Circulation (AMOC) controls a large part of the climate variability reconstructed on the European continent (Knight et al., 2006; McCarthy et al., 2015; Ruprich-Robert and Cassou, 2014) and therefore on BB watersheds (Lambert et al., 2018).
Material and methods
General information on study sediment cores
In this study, we used five different cores collected in the Bay of Roscanvel (BR), Brest harbour (BH), and at the mouth of the Aulne river (AR) (Figure 1a; Table 1). Two of the five cores were previously studied: (i) core SRQ3-KS22 (AR; Lambert, 2017) and (ii) core SRQ3-KS24 (BR; Lambert et al., 2019). In this study, three cores (‘F’, PALM-KS05 and PALM-KS06) were subject to new palynological analyses.
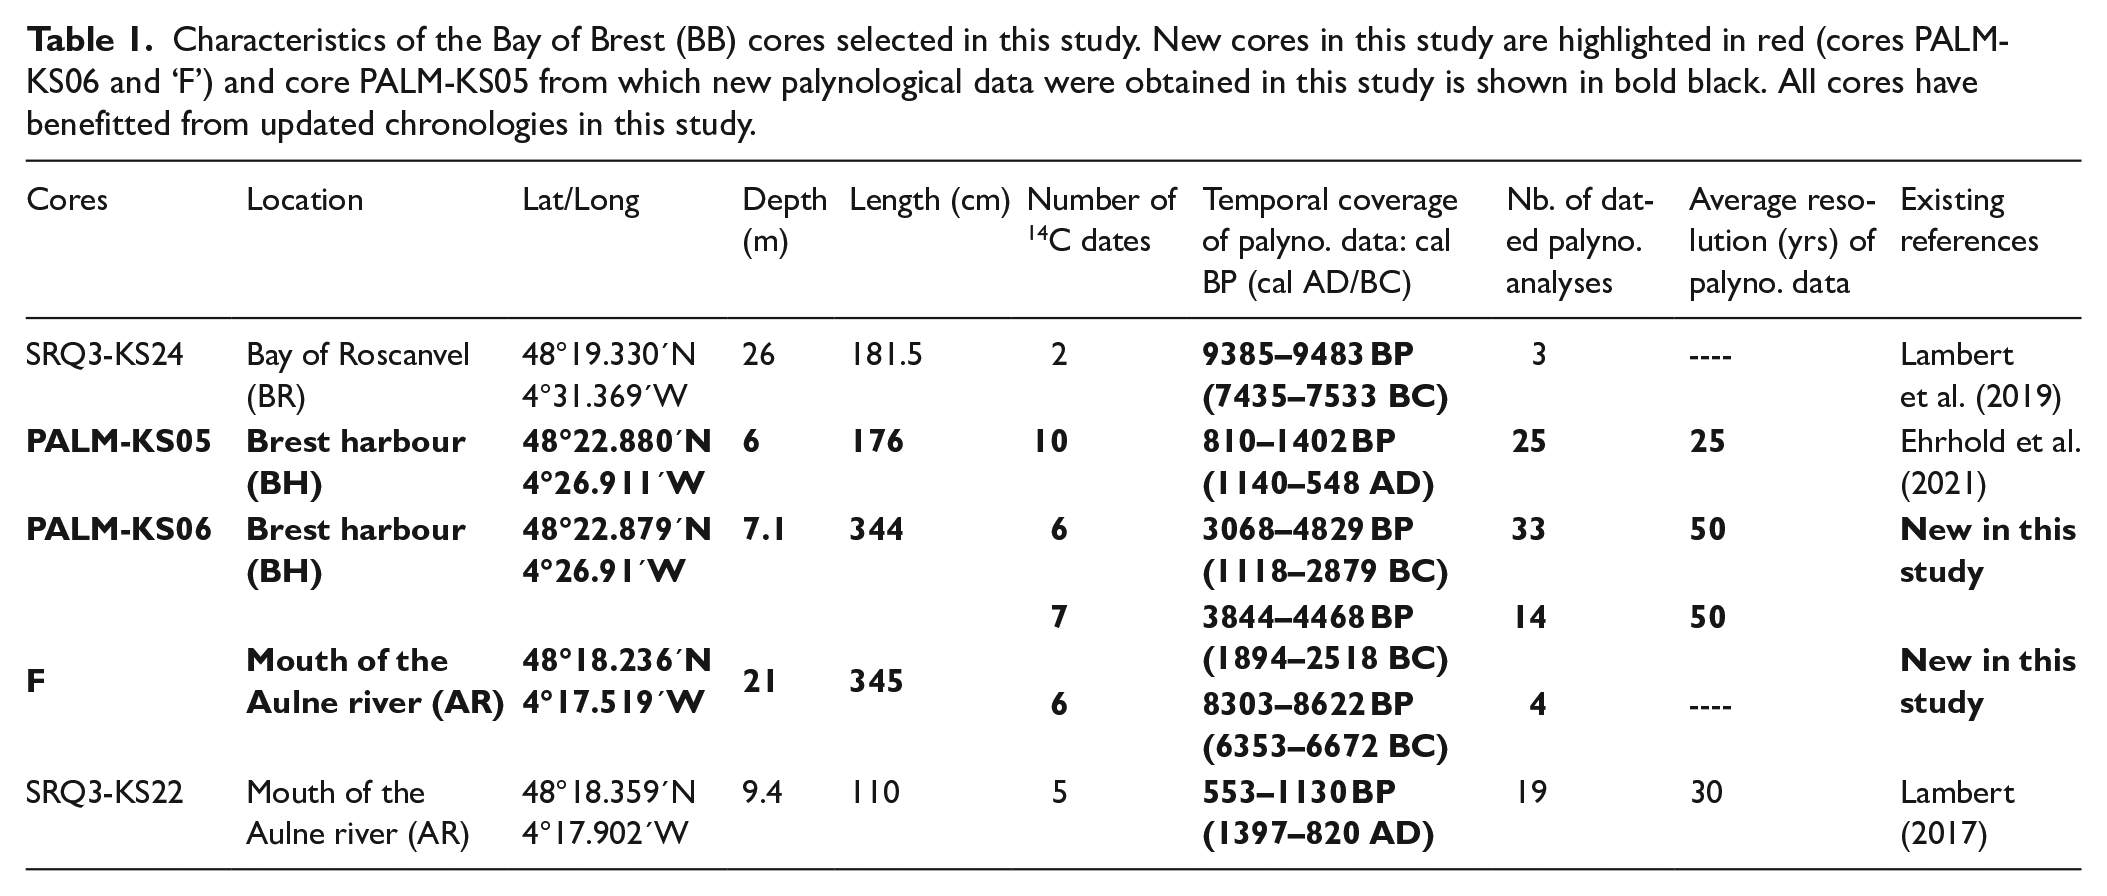
Characteristics of the Bay of Brest (BB) cores selected in this study. New cores in this study are highlighted in red (cores PALM-KS06 and ‘F’) and core PALM-KS05 from which new palynological data were obtained in this study is shown in bold black. All cores have benefitted from updated chronologies in this study.
Core ‘F’ (AR) was retrieved using a vibrocorer on the R/V Côtes de la Manche during the ‘Défis Golfe de Gascogne’ programme in 2003 (Ifremer and UMR 6839 LEMAR-IUEM). Cores SRQ3-KS24 (BR) and SRQ3-KS22 (AR) were recovered with a gravity corer by the R/V Thalia during the ‘SERABEQ 3’ cruise in 2015 (Ifremer). Finally, cores PALM-KS05 and PALM-KS06 (BH) were collected with a gravity corer onboard the R/V Thalia during the PALMIRA cruise in 2017 (Ifremer-DYNECO-PELAGOS).
Chronological framework
For the three newly investigated cores for palynological analyses, ‘F’, PALM-KS05 and PALM-KS06: 13 new AMS-14C dates were acquired on core ‘F’ (one for reservoir age issues and 12 for the age-depth model establishment), and two new AMS-14C dates were acquired on core PALM-KS06, in addition to the four dates already available for the latter sediment sequence (cf. Siano et al., 2021). Also, 10 AMS-14C dates were already acquired on core PALM-KS05 (Ehrhold et al., 2021), five on core SRQ3-KS22 (Lambert, 2017) and two on core SRQ3-KS24 (Lambert et al., 2019).
All AMS-14C dates (Table 2) were calibrated with CALIB 8.1 (Stuiver and Reimer, 1993) software using the IntCal20 calibration curve (Reimer et al., 2020). We considered no reservoir age for AMS-14C dates older than 7 ka BP due to the negligible difference between AMS-14C acquired on charcoal and marine carbonate in the lower section of core ‘F’ at 293.5 cm (Table 2). An age reservoir of 365 yrs, previously calculated in the BB (Lambert et al., 2019), was removed from AMS-14C dates before calibration for the time interval encompassing the last 7 kyrs. Age-depth relationships were then established using the rbacon package (Blaauw and Christen, 2011) in R version 4.3.0 (R Development Core Team, 2022; http://www.r-project.org/ ) (cf. Figure 2 with age-depth models of cores ‘F’, PALM-KS05 and PALM-KS06 and the SEANOE repository for all age-depth models: https://doi.org/10.17882/99422).
In black: new AMS-14C dates for cores ‘F’ and PALM-KS06. In grey: dates previously published for cores: PALM-KS06 (Siano et al., 2021), PALM-KS05 (Ehrhold et al., 2021), SRQ3-KS22 (Lambert, 2017) and SRQ3-KS24 (Lambert et al., 2019). For each core in this study, radiocarbon dates are given in calibrated ages according to the age-depth model relationships which can be found in the SEANOE repository with also the 2σ uncertainties of the age estimates (https://doi.org/10.17882/99422). For the calibration of radiocarbon dates, no reservoir age was considered for AMS-14C dates older than 7 ka BP and an age reservoir of 365 yrs was considered for the others. In red: the 293.5 cm level on core ‘F’ was dated on a coal fragment as well as on two carbonate samples (a bivalve and a gastropod) in order to accurately estimate the reservoir age in the Bay of Brest before the RSL stabilization (i.e. before ~7–6 ka BP).
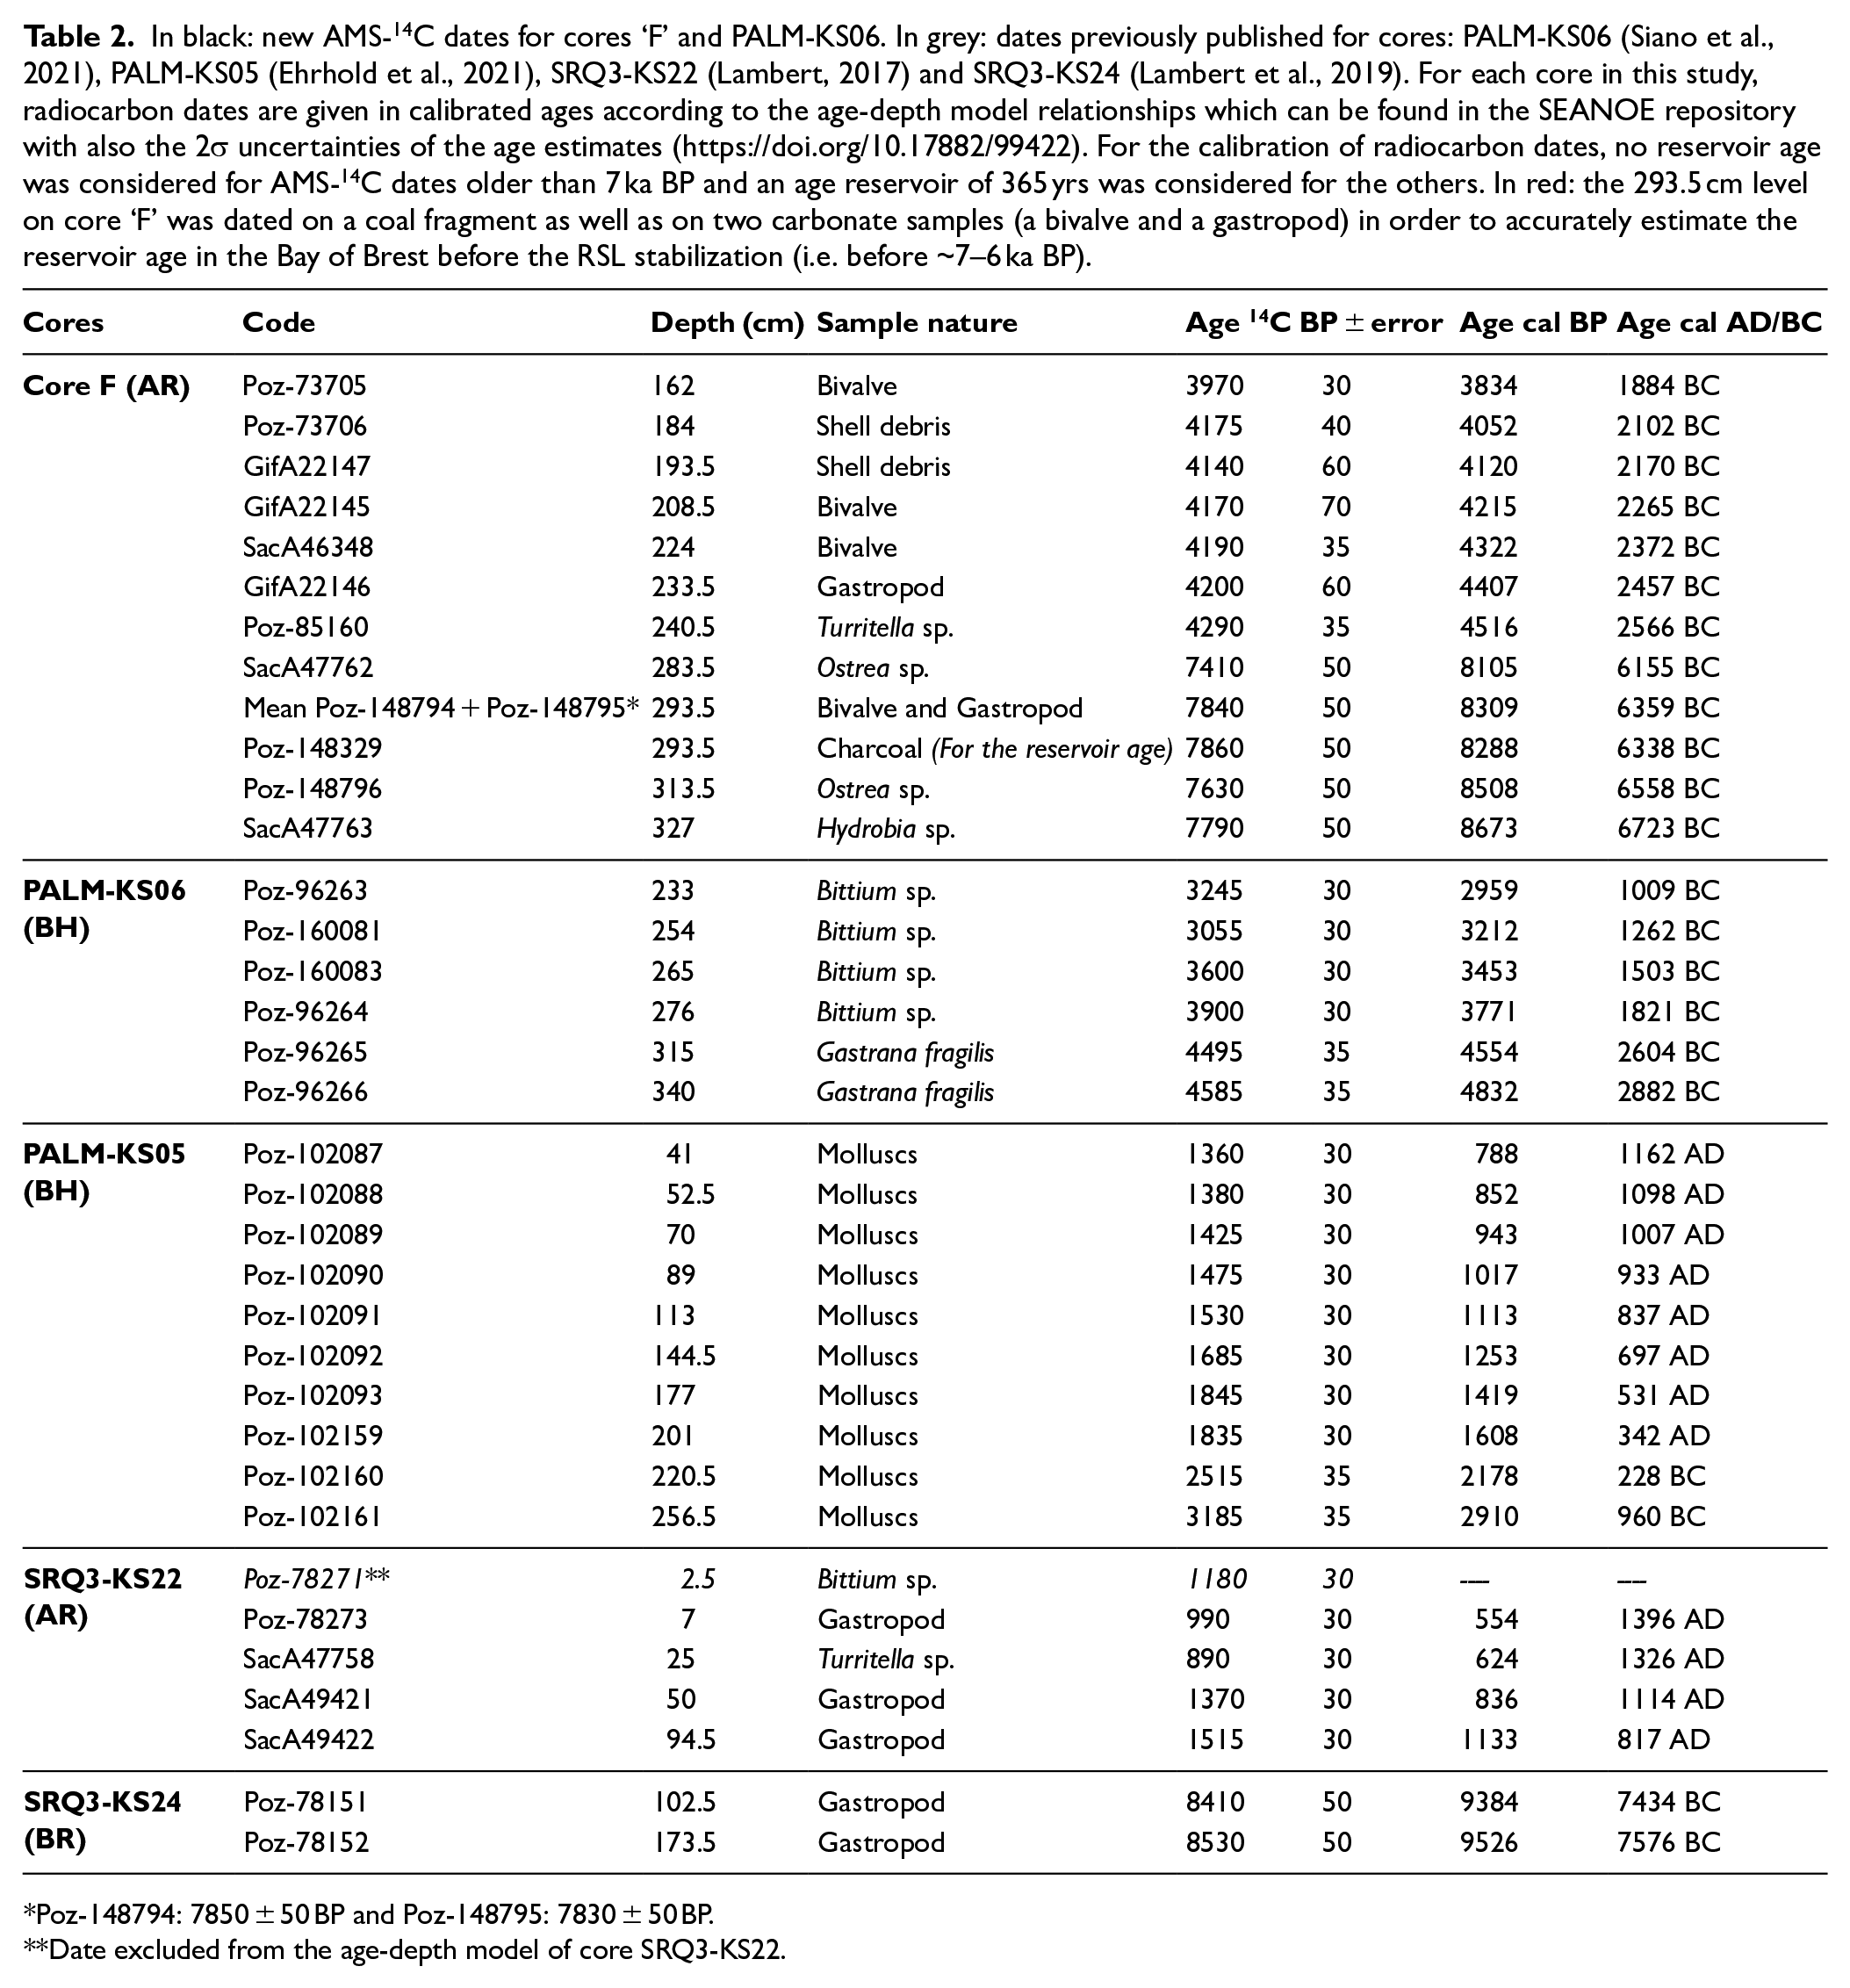
Poz-148794: 7850 ± 50 BP and Poz-148795: 7830 ± 50 BP.
Date excluded from the age-depth model of core SRQ3-KS22.
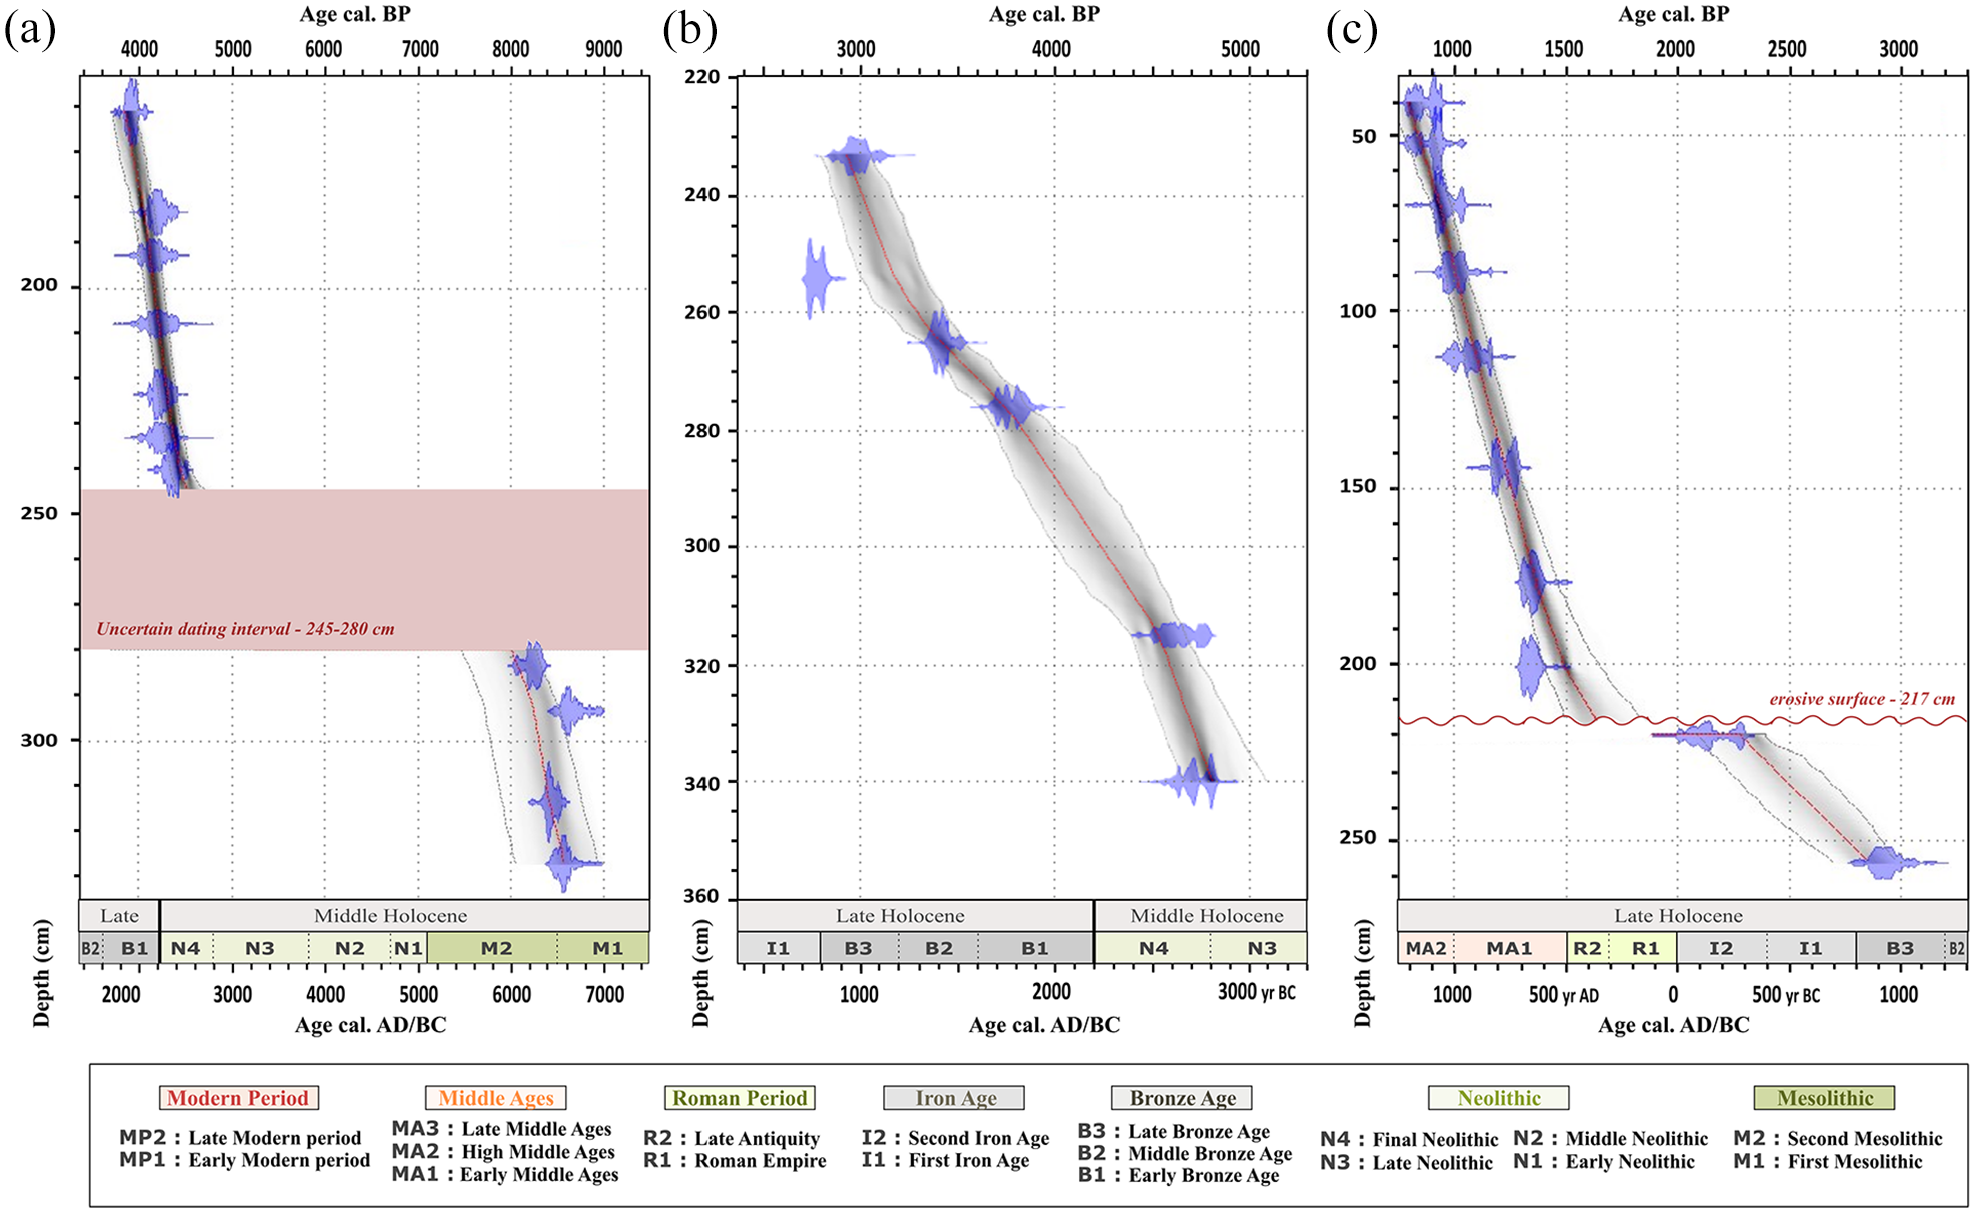
Age-depth models of studied cores: (a) ‘F’, (b) PALM-KS06 and (c) PALM-KS05 with calibrated distributions of the individual dates (blue). For core ‘F’, no dating has been performed in the 280–245 cm interval due to the coarse nature of sediments (cf. Figure 3a). For core PALM-KS05, the synthetic lithological description published in Ehrhold et al. (2021) shows a clear transition in sedimentary facies at 217 cm. For both cores ‘F’ and PALM-KS05, we processed their age-depth models by gathering two independent well-dated sections disconnected by a hiatus of ~3.6 and ~0.5 kyrs, respectively. The age-depth models are expressed along cultural subdivisions for western Brittany (Gorczyńska et al., 2022) and stratigraphical subdivisions (Walker et al., 2019).
Sedimentological analyses
For cores ‘F’ (AR) and PALM-KS06 (BH), grain-size analyses on the total and CaCO3-free (after HCl 37% treatment) sediment fractions were performed on a MalvernTM Mastersizer 2000 laser particle size analyser (IUEM, Plouzané). Since carbonate shell debris represent a major component of the BB sediments, grain-size values of decarbonated sediments are used to improve the granulometry assessments of terrigenous detrital sediments. Grain-size statistics, including median grain size (D50) values and volumetric percentages of sands, silts and clays, were obtained using GRADISTAT v 8.0 software (Blott and Pye, 2001). In addition, total organic carbon (% TOC) and calcimetry (% CaCO3) data were acquired (IUEM, Plouzané) with the standard loss on ignition (LOI) method (Heiri et al., 2001). Sediments were dried at 105°C for 16 h to remove all moisture before burning. After a first weighing, samples were burned at 550°C for 4 h and weighed to calculate the TOC content and then burned at 950°C for 2 h and weighed a final time to calculate the carbonate content. Regarding core PALM-KS05, sedimentological analyses and X-ray radiography were previously carried out and presented in Ehrhold et al. (2021).
Palynological analyses
Palynological treatment and counting protocols for holocene sediments
For modern surface samples, see Lambert et al. (2017) for details on treatment and counting protocols.
For sediment cores, a total of 76 samples (18 for core ‘F’, 33 for core PALM-KS06, 25 for core PALM-KS05) were analysed in this study. For both dinocyst and pollen extraction, palynological treatments were carried out at the Geo-Ocean Laboratory (IUEM, Plouzané) following the protocol of de Vernal et al. (1999). The mineral fraction was removed using chemical (cold HCl 37% and cold HF 48 and 60%) and physical (sieving through a single-use 10 μm nylon mesh screen) treatments in order to concentrate palynomorphs. The final residue was mounted with glycerine between a slide and coverslip. Pollen and dinocysts were determined using an optical Leica DMC 2500 microscope at 630× magnification. Palynomorph identifications followed Rochon et al. (1999) and Van Nieuwenhove et al. (2020) for dinocysts, and Beug (1961) and Reille (1992) for pollen grains. Dinocyst and pollen percentages were calculated independently on a sum of total dinocysts and on a main pollen sum excluding Alnus, respectively. Absolute concentrations (number of palynomorphs per cm3 of dry sediment) were obtained using the Lycopodium spore method (Mertens et al., 2009).
The number of pollen grains counted was pushed as much as possible to reach robust palynological data. A minimum of 100 pollen grains and 50 dinocysts were counted for all analysed samples except for the lower section of core ‘F’ (AR area) where dinocysts are very rare (mean of 6 cysts/sample). For the upper section of core ‘F’, we counted 300 pollen grains including Alnus for all samples and 200 grains were even reached without Alnus. Regarding the Brest harbour (BH) area (cores PALM-KS05 and PALM-KS06), that presents a strong dilution of palynomorphs due to the slightly coarser sediments, we managed to reach 100 pollen grains excluding Alnus for 52 out of 58 samples and a minimum of 80 pollen grains for the remaining 6 samples.
Statistical analysis on modern and holocene palynological data
For a better understanding of the overall distribution of palynomorphs in modern BB sediments, we conducted a new statistical analysis on the modern palynological data obtained from the top 5 cm of 41 interface cores, for which detailed palynological results were previously described in Lambert et al. (2017). Given the scarcity of dinocysts in the surface sediments (i.e. 11 cysts/sample on average), we only established the ratio of dinocyst to pollen counts to identify whether marine or fluvial influence was higher at the different sampling locations. An ascendant hierarchical clustering was performed using R version 4.3.0 (R Development Core Team, 2022) on the pollen data, considering: (i) the surface samples distributed throughout the BB (n = 41) and (ii) the percentages of major pollen taxa (n = 10, i.e. respecting the arbitrary rule: if mean > 1.5% and max > 5% at least once in the BB dataset).
For sediment cores, palynological diagrams (featuring pollen and dinocyst data) on core ‘F’ (AR) and cores PALM-KS05 and PALM-KS06 (BH) were generated using the Psimpoll programme (Bennett, 1992), which also allows the definition of palynozones based on a CONISS statistical analysis (Grimm, 1987).
For all palynological data (pollen and dinocysts), diversity indexes (number of different taxa per sample and dominance index) were calculated using the Past version 1.75b programme (Hammer et al., 2001).
Results on the Bay of Brest sediment cores
Sedimentological analyses
Aulne river mouth record (core ‘F’)
The studied section of core ‘F’ (i.e. Figure 3a) consists of a silty-clayey material (i.e. the average D50 value on decarbonated sediment is of 26 μm) with generally less than 30% of sand regarding the total sediment fraction, and numerous beds of shell debris. In the lower section of the core (328–293 cm), sediments are finer (i.e. average D50 value of 19 µm on decarbonated sediments) than in the upper section (238–153 cm), which is characterized by a larger proportion of fine to medium sands (~15%). Between ca. 270 and 245 cm, coarse shell beds are found in a largely reworked interval where no analysis had previously been carried out (see red band on Figure 3a). Below this interval, sediments are rich in shell debris and oysters and characterized by lower TOC (~5%) and higher CaCO3 (~5.3%) values while, above this interval, sediments are characterized by higher TOC (~7%) and lower CaCO3 (~3.5%) values.
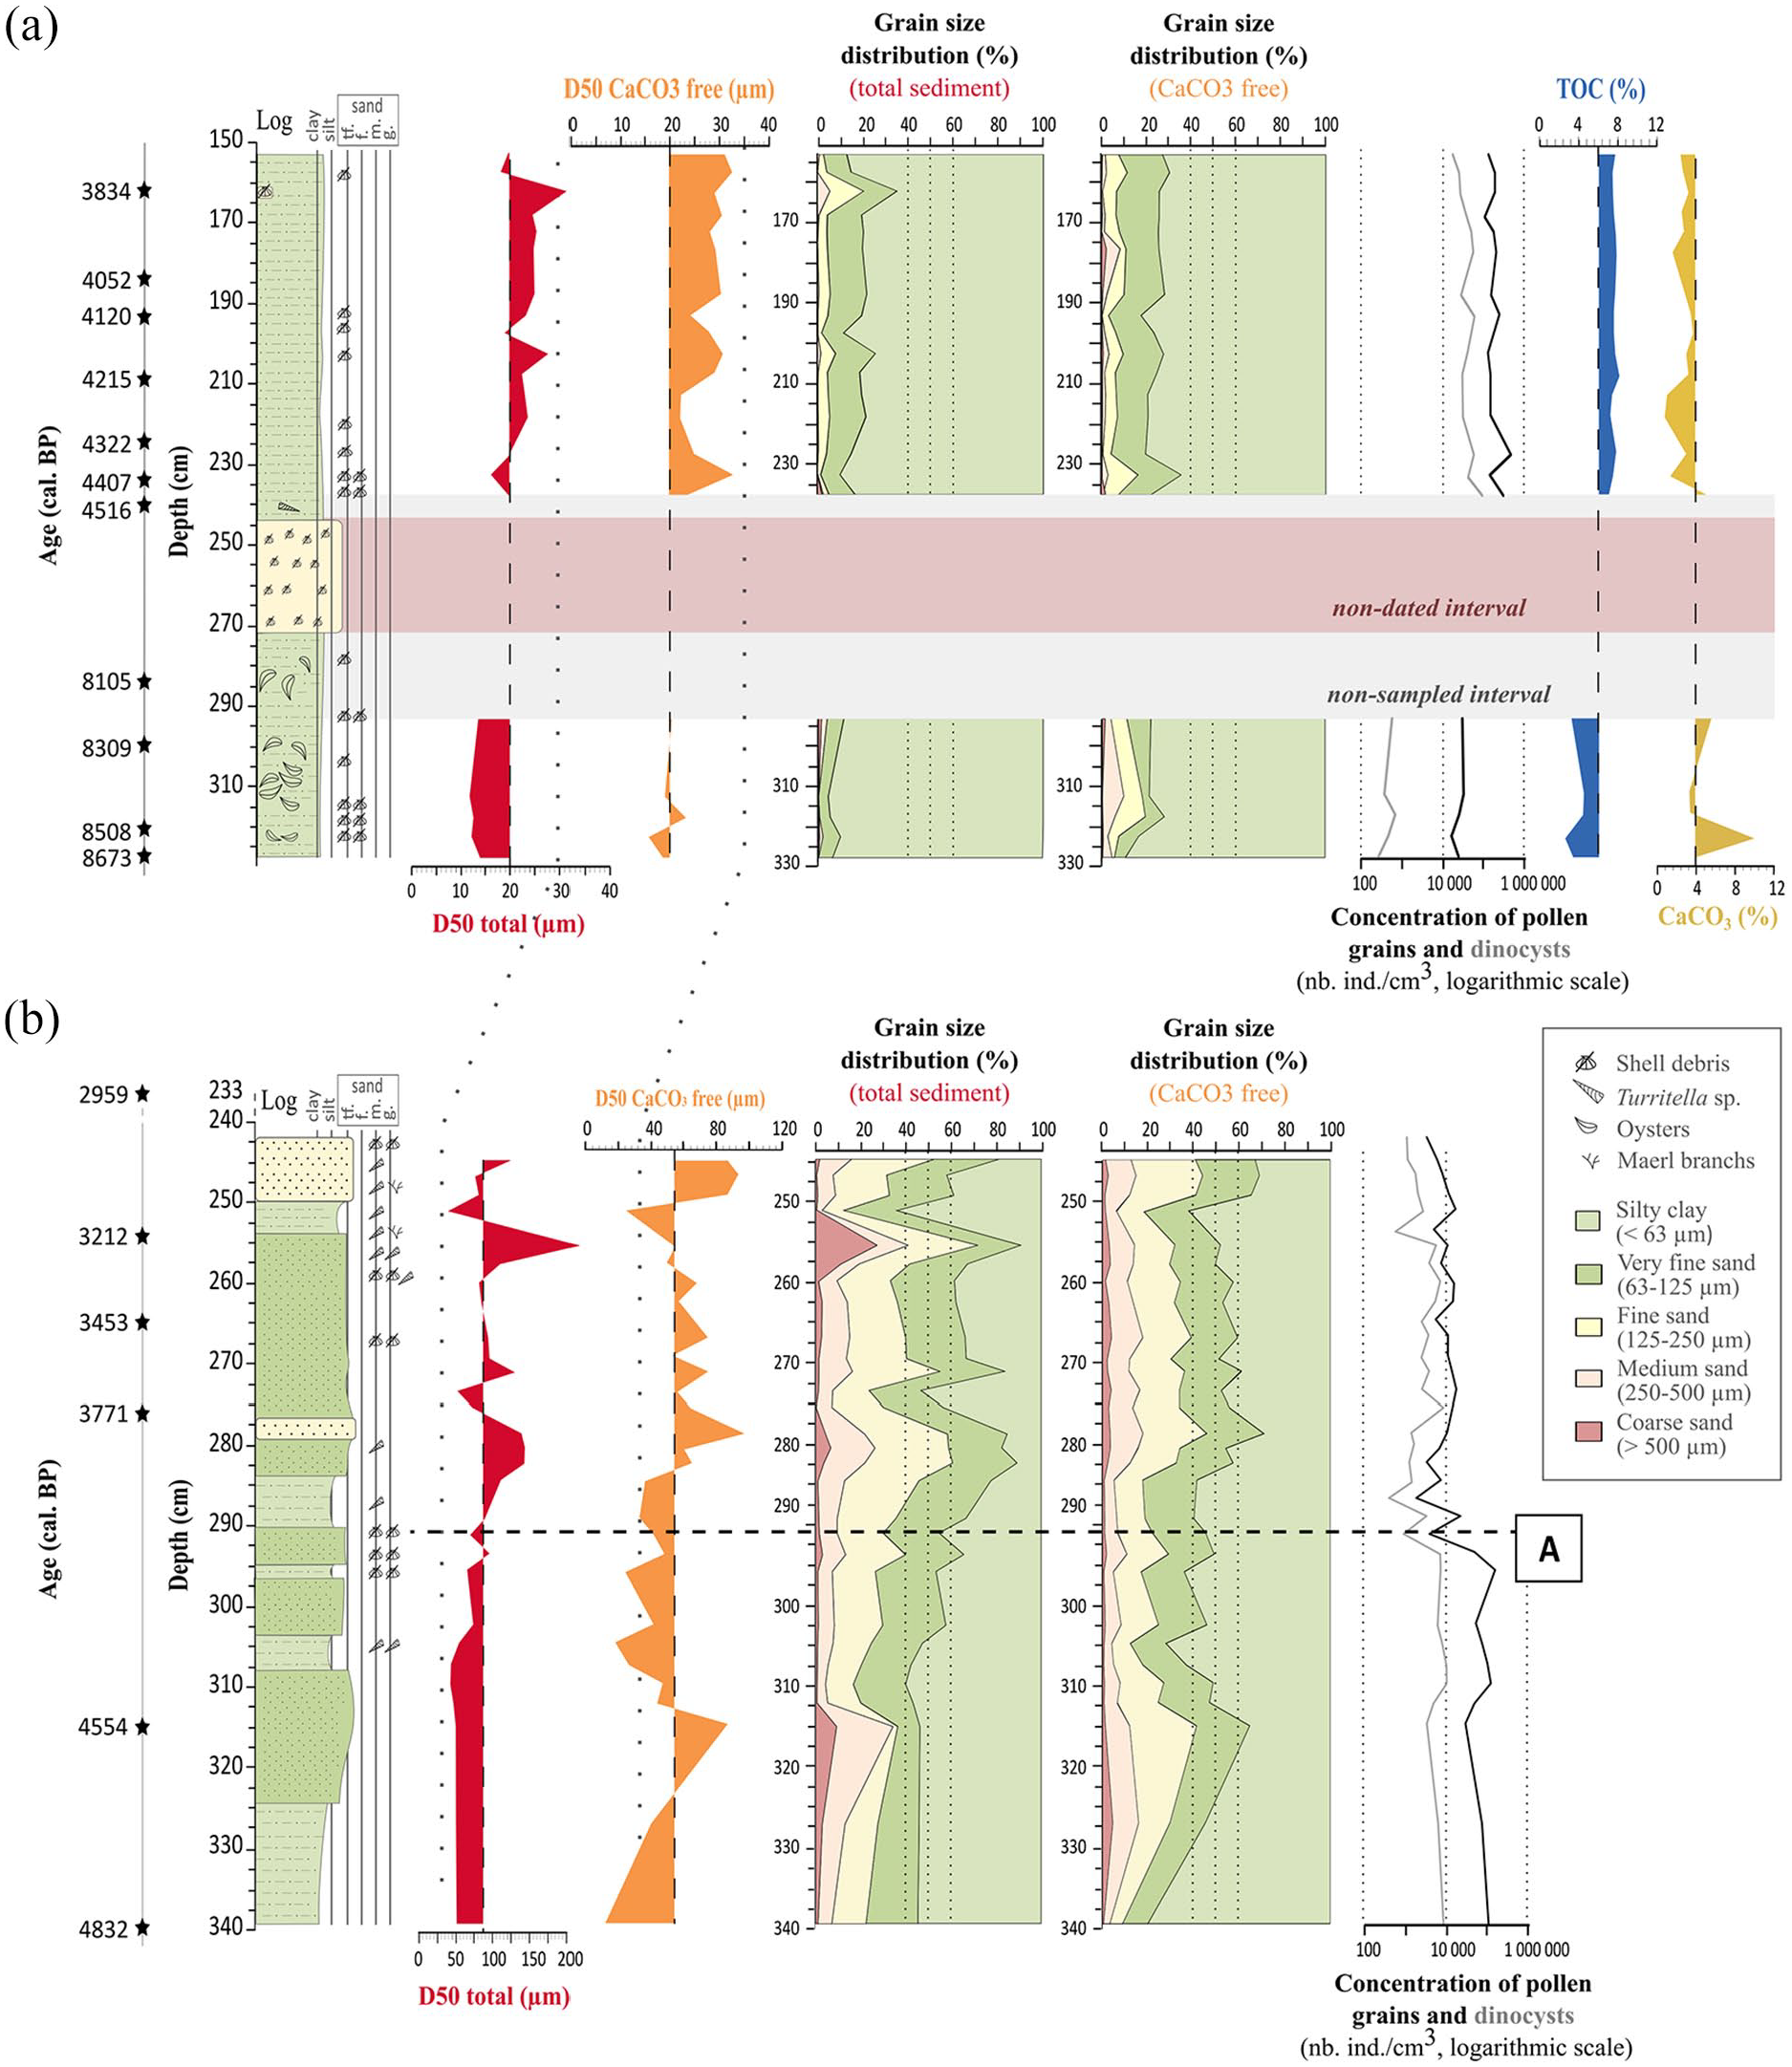
Sedimentological data for cores: (a) ‘F’ and (b) PALM-KS06, including the sedimentary log and observational descriptions, the median grain-size values (D50) on total and decarbonated (CaCO3 free) sediments, grain-size distributions for total and decarbonated sediments, and concentrations of pollen grains and dinocysts. Total organic carbon (TOC) and calcimetry (CaCO3) measurements are also plotted for core ‘F’. Limit A for core PALM-KS06 highlights a major change in grain size data and palynomorph concentrations.
Brest Harbour records (cores PALM-KS05 and PALM-KS06)
Core PALM-KS06 (Figure 3b) was primarily collected for a palaeogenetic study (Siano et al., 2021). As such, it was immediately sliced into centimetric sections after coring. A sedimentological description of this core was reconstructed here based on the grain-size analysis combined with a precise description of the remaining bulk sediments under a binocular microscope (Figure 3b). The lower part of the core (340–310 cm) is characterized by sandy-silty sediments with gradually increasing grain-size values (i.e. D50 values on decarbonated sediments from ~35 to 100 µm). Between 310 and 285 cm, the sediments consist of a succession of sandy-silty and very fine-sand layers (40–50% of sand) with shell debris. In this latter interval, D50 values on total sediments rise from 40 to 70 µm at ~290 cm (referred to as limit A in Figure 3b), due to the increase in the sandy component. Finally, the top of the core corresponds to a fine-sand layer (representing ~40% of the grain-size distribution based on decarbonated sediments) with a large proportion of shell debris and Turritella sp.
Core PALM-KS05 was already described in Ehrhold et al. (2021). This core is mainly characterized by sandy-silty sediments punctuated by multi-centimetre layers of coralline algae, locally termed maerl, organized in bed-like morphologies (i.e. rhodolith beds). The base of the core (263–215 cm) is much coarser, however, with a 37 cm sequence of coarse shelly sediments over a sandy base of about 10 cm (Ehrhold et al., 2021). An erosive event/surface is reflected in this core by a non-coherent contact at 217 cm (also figured out in the age-depth model: Figure 2c), between coarse shelly sediments and a layer identified as the first maerl occurrence in Ehrhold et al. (2021). This transition also corresponds to a change in sedimentation rates with values of ~0.4 mm yr−1 at the base of the core that increase to ~3.8 mm yr−1 on the upper part of the sequence.
Palynological analyses
In this section, only palynological data acquired on the new studied cores (cores ‘F’, PALM-KS05 and PALM-KS06) are described. For data acquired on the 41 modern surface samples that are discussed in this manuscript through a new statistical approach (cf. Section 5.1), please refer to Lambert et al. (2017) for the complete description of data (i.e. diversity, percentages, absolute concentrations, pollen spectrum).
Dinocyst analyses
Dinocyst taxa were grouped by their ecological affinities according to Penaud et al. (2020): estuarine (Lingulodinium machaerophorum), coastal (cysts of Pentapharsodinium dalei, Polysphaeridium zoharyi, Spiniferites belerius, Spiniferites bentorii, Spiniferites lazus, Spiniferites membranaceus), and Iroise Sea (Achomosphera sp., Operculodinium centrocarpum, Spiniferites delicatus, Spiniferites elongatus, Spiniferites ramosus), as well as strict heterotrophic taxa (Brigantedinium sp., Echinidinium sp., Lejeunecysta sp., cysts of Protoperidinium nudum, Selenopemphix nephroides, Selenopemphix quanta, Stelladinium sp., Trinovantedinium applanatum, Xandarodinium xanthum).
Aulne river mouth record
Dinocyst analyses on core ‘F’ (Figure 4a) are separately discussed for the two temporal windows delimited by the 270–245 cm interval (grey band in Figure 3a).
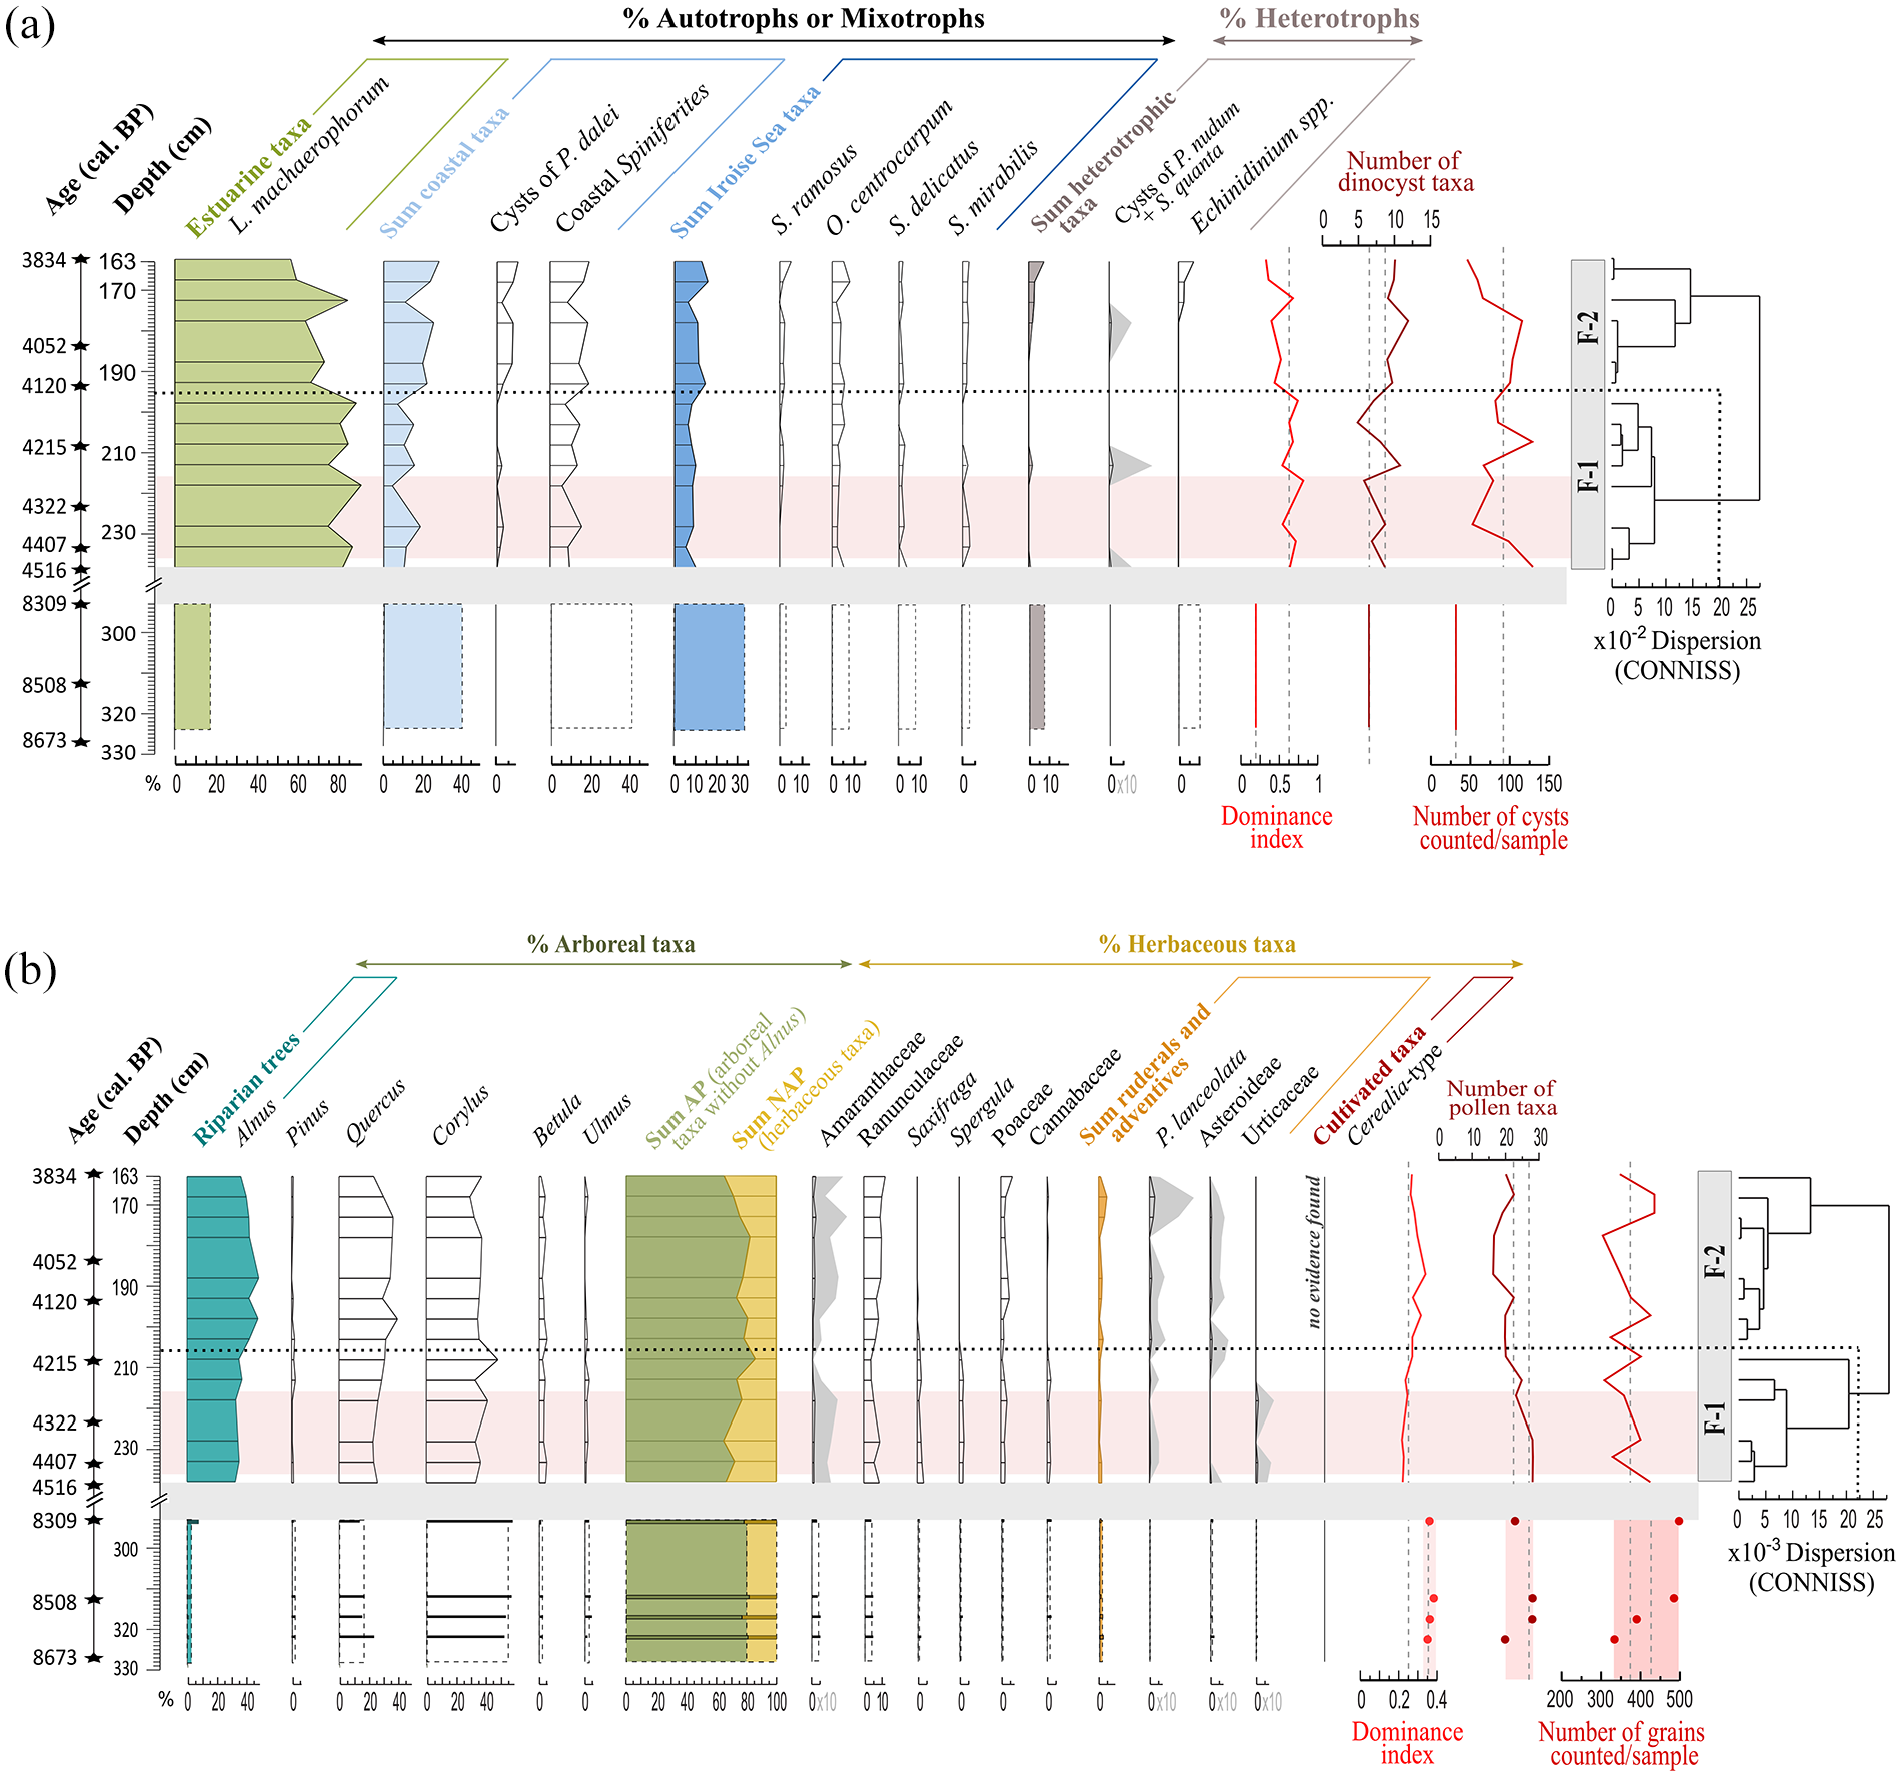
Core ‘F’ – Palynological results plotted against depth (cm) for: (a) Dinocyst and (b) Pollen assemblages. Major taxa percentages (>1.5%) are calculated on a total dinocyst sum without any exclusion, as well as on a total pollen sum excluding Alnus. For pollen and dinocysts, a CONISS clustering allows highlighting main palynozones on the upper section (238–163 cm, 14 samples). Diversity indexes (i.e. dominance index, number of different taxa per sample) and the number of palynomorphs counted per level are also presented. The same pink band (233–218 cm; 4.4–4.3 ka BP, 3 points) highlights an interval within which data have been averaged for a spatial comparison (Figure 9). On the lower section (323–293 cm, four samples), dinocyst data have been summed to create one gathered sample while pollen data are presented individually with histograms. These pollen data have also been averaged (dotted vertical lines) for spatial comparison in Figure 8.
The number of dinocyst specimens counted per sample in the lower section (i.e. 8.6–8.3 ka BP; 323–293 cm) was low (less than 10 cysts). Their total quantities (26 cysts in the four samples) were thus summed (Figure 3a) to give a qualitative description of the assemblage composition even if it is not statistically robust from a quantitative point of view. This section is characterized by a low dinocyst diversity (7 taxa). The dominance of coastal taxa (~40%), represented by S. membranaceus and S. bentorii, accompanied by Iroise Sea taxa (~30%) such as O. centrocarpum, Achomosphera sp. and S. delicatus, attests to a prevalent tidal influence at that time. Heterotrophic taxa (<5%) are here only represented by Brigantedinium sp. and the estuarine taxon L. machaerophorum only represent ~20% of the assemblage.
The 14 samples of the upper section (i.e. 4.4–3.8 ka BP, 238–163 cm; Figure 4a) are addressed through a classical palynological diagram. In general, this section is characterized by a slightly higher diversity (12 taxa). At that time, the assemblage is largely dominated by the estuarine taxon L. machaerophorum (mean of 74%) indicating prevailing estuarine conditions with important fluvial discharges at the coring site. The previously described coastal and Iroise Sea taxa of the lower section (323–293 cm) now show low mean values of 16% (including S. membranaceus 8%, S. belerius 3%, cysts of P. dalei 2%) and 9% (including O. centrocarpum 4% and S. delicatus 2%), respectively.
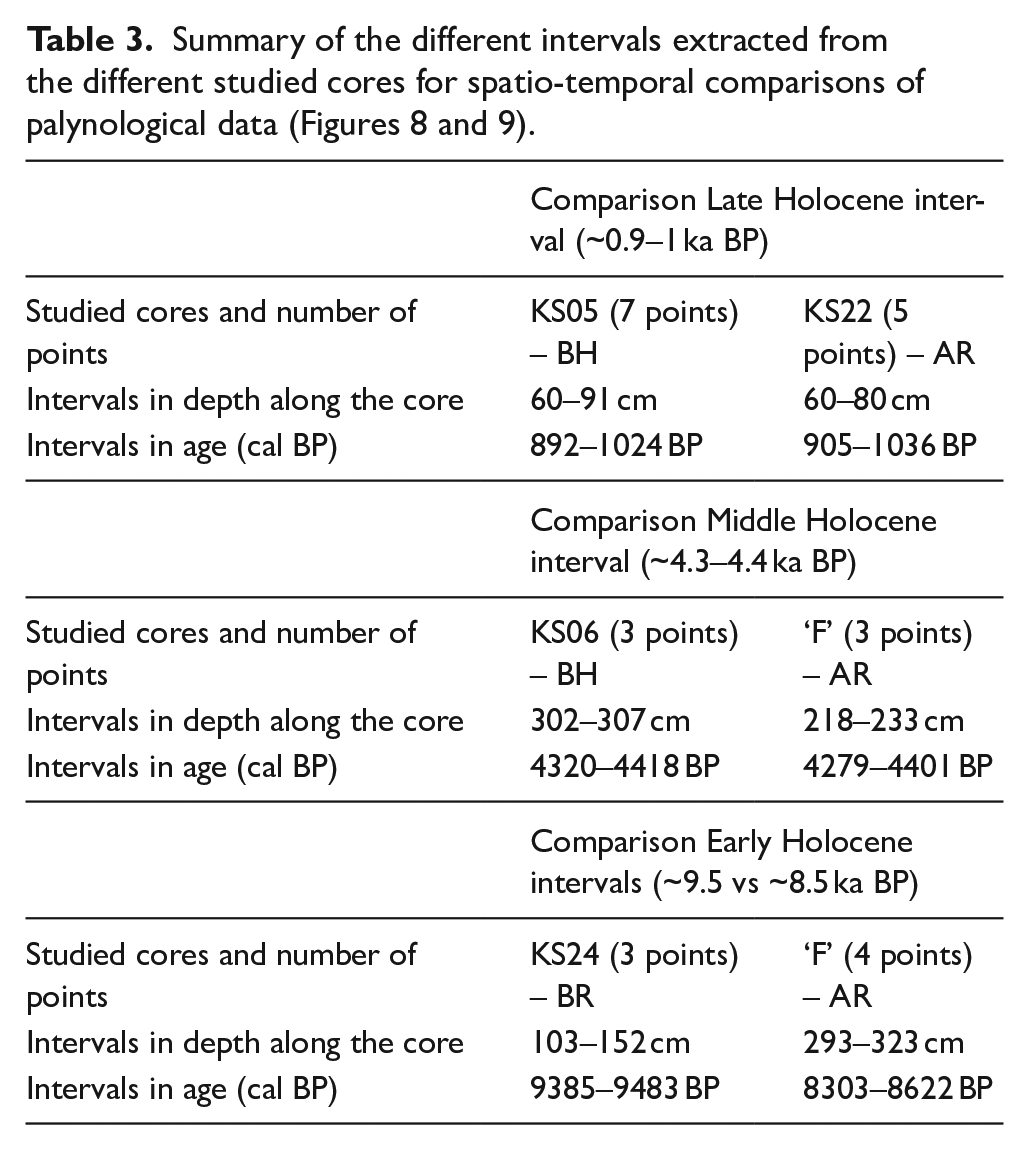
The CONISS performed on the upper section (Figure 4a) allowed us to select three levels on a same palynozone and across a 100 yr-long interval for subsequent spatial comparison on a specific Middle Holocene interval (Table 3): ~4.4–4.3 ka BP (233–218 cm). Also, the four levels of the lower section will be gathered for a spatial comparison on a specific Early Holocene interval (Table 3): ~8.6–8.3 ka BP (323–293 cm).
Brest harbour records
Dinocyst analyses on core PALM-KS06 (33 samples), carried out on the 340–242 cm interval (4.8–3 ka BP; Figure 5a), cover the Neolithic-Bronze Age transition never investigated before in BB, and dinocyst analyses on core PALM-KS05 (30 samples), carried out on the 177–45 cm interval (1.4–0.8 ka BP; Figure 6a), cover a Late Holocene interval previously investigated but in a different BB sector (South of the Plougastel peninsula; Lambert et al., 2020). In both cores PALM-KS06 and PALM-KS05 (BH), 13 different taxa were identified in total with averages of 8 and 10 different taxa per sample, respectively. Total dinocyst concentrations are characterized by similar average values of ~5500 and 6000 cysts/cm3, respectively.
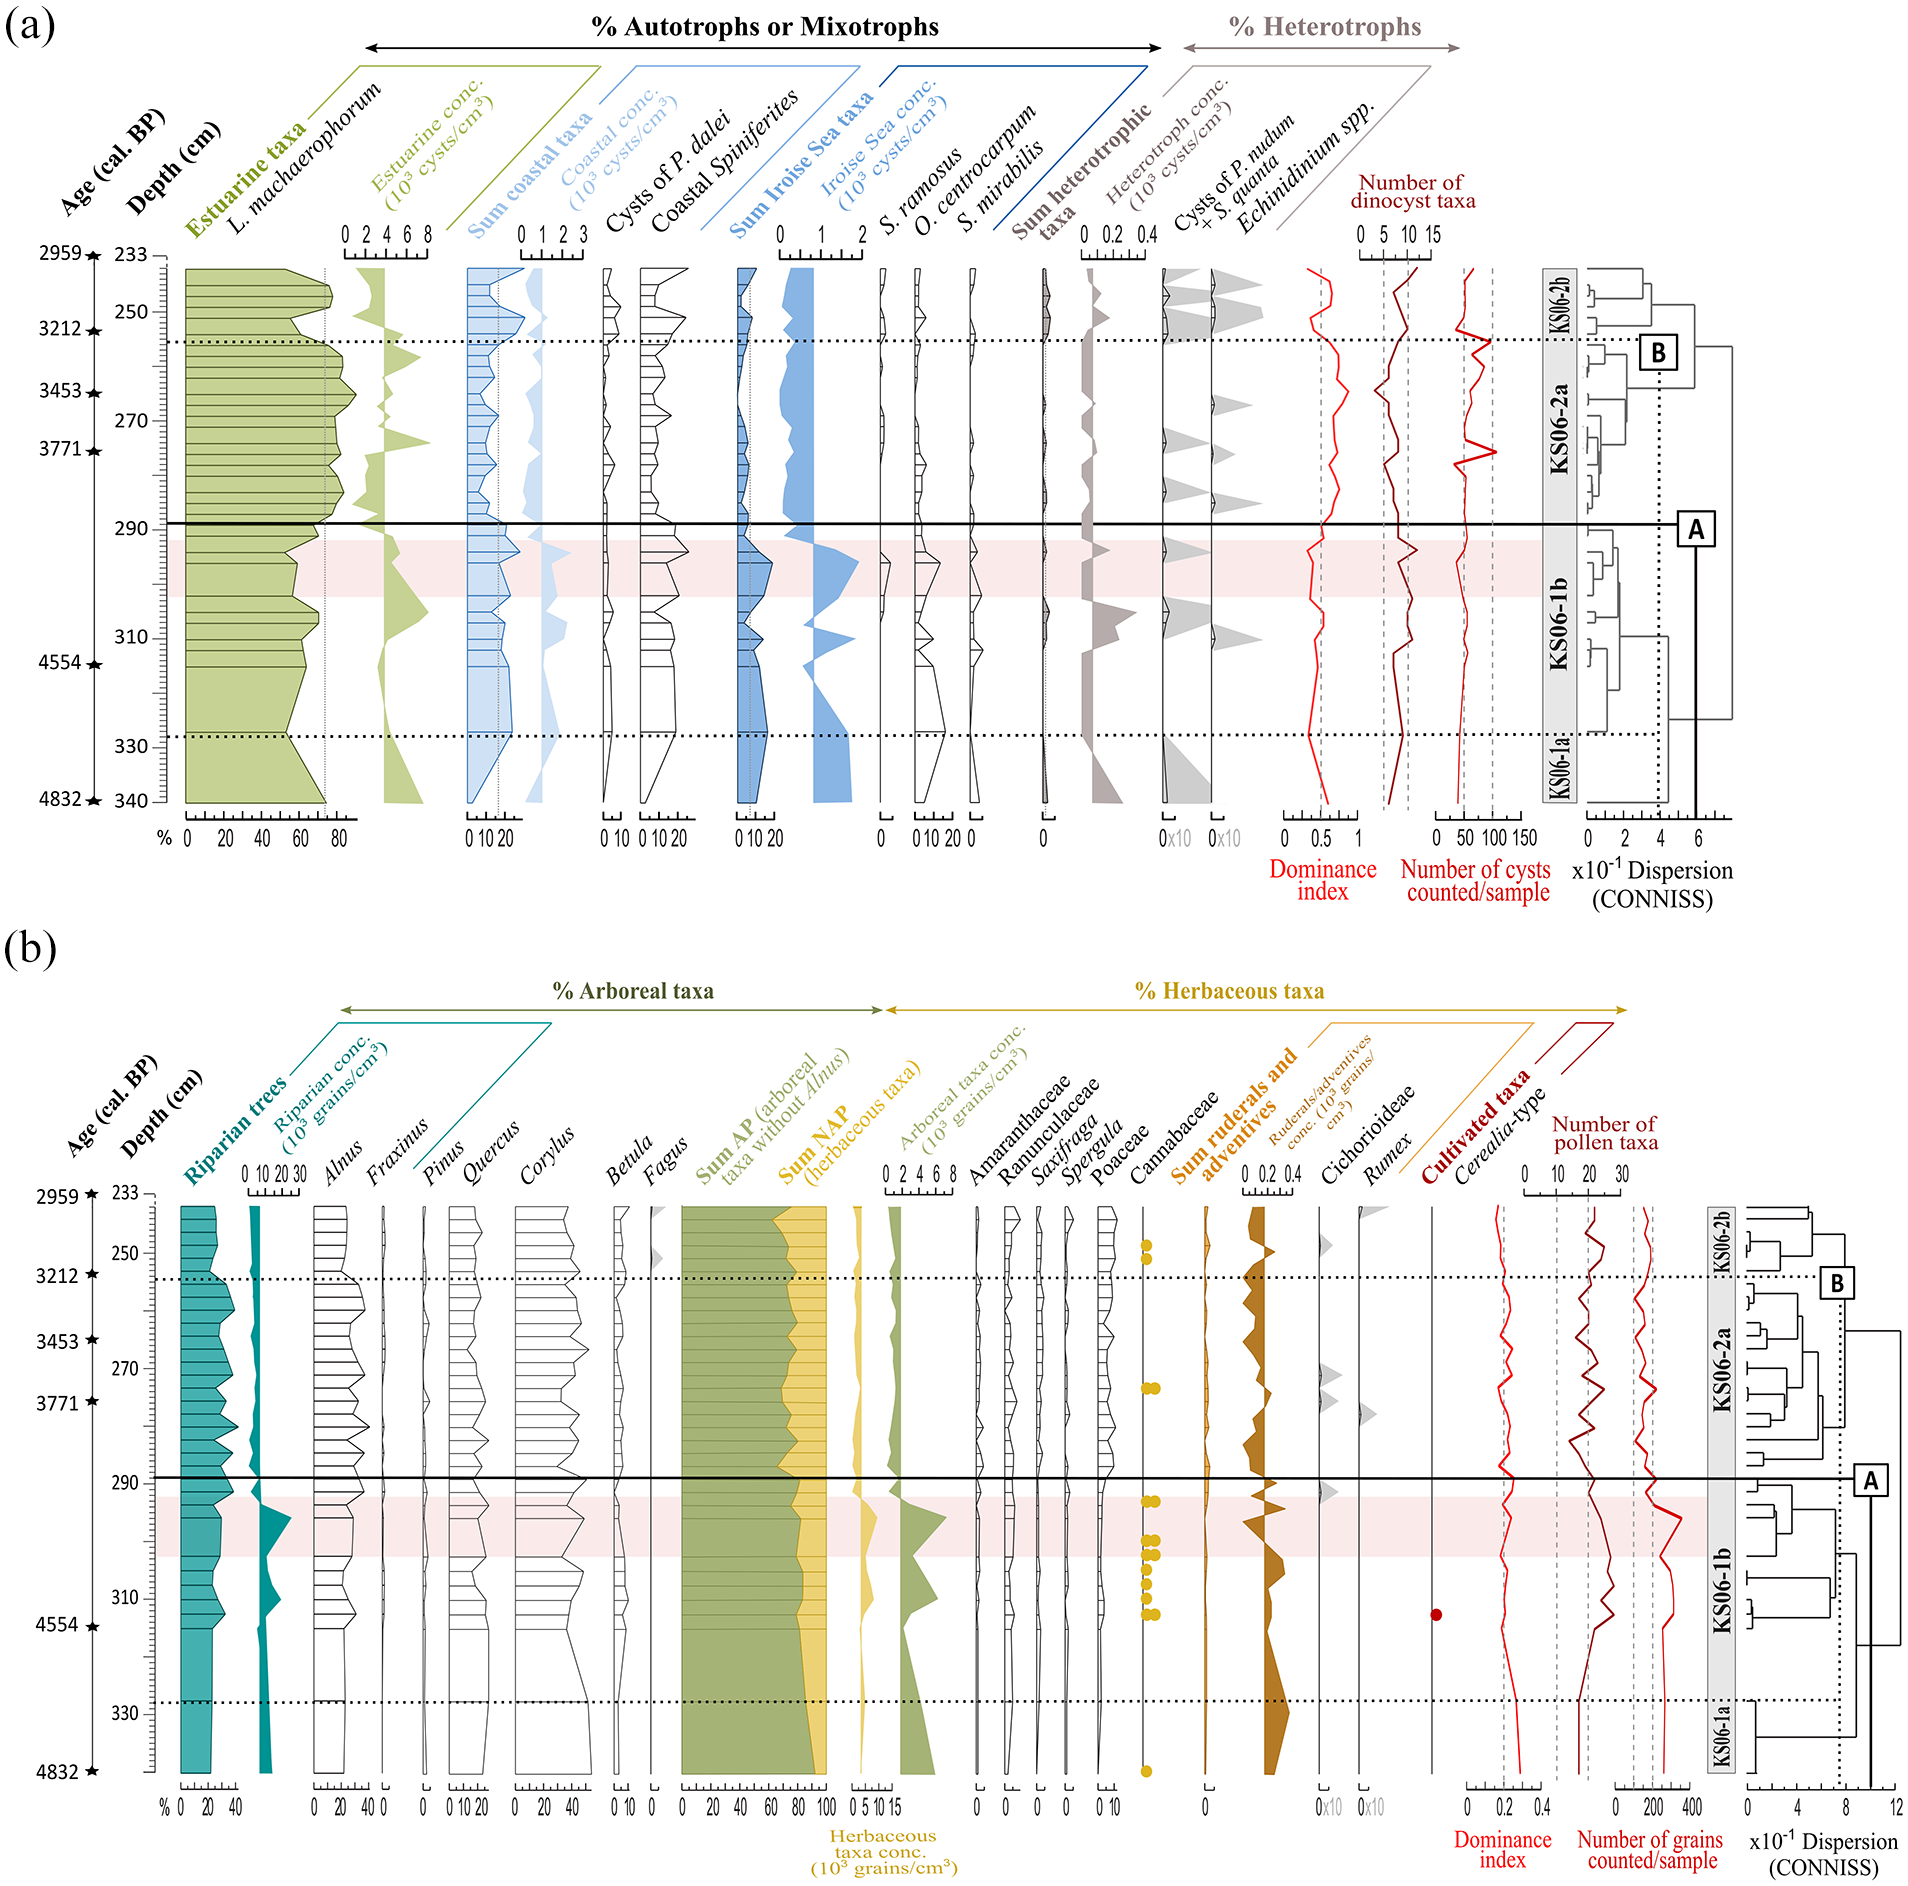
Core PALM-KS06 – Palynological results plotted against depth (cm) for: (a) Dinocyst and (b) Pollen assemblages. Major taxa percentages (>1.5%) are calculated on a total dinocyst sum without any exclusion, as well as on a total pollen sum excluding Alnus. For cultivated taxa, each point corresponds to a single grain (i.e. occurrence). For pollen and dinocysts, a CONISS clustering allows highlighting main palynozones. Diversity indexes (i.e. dominance index, number of different taxa per sample) and the number of palynomorphs counted per level are also presented. The same pink band (307–302 cm; 4.4–4.3 ka BP, 3 points) highlights an interval for which data have been averaged for a spatial comparison (Figure 9).
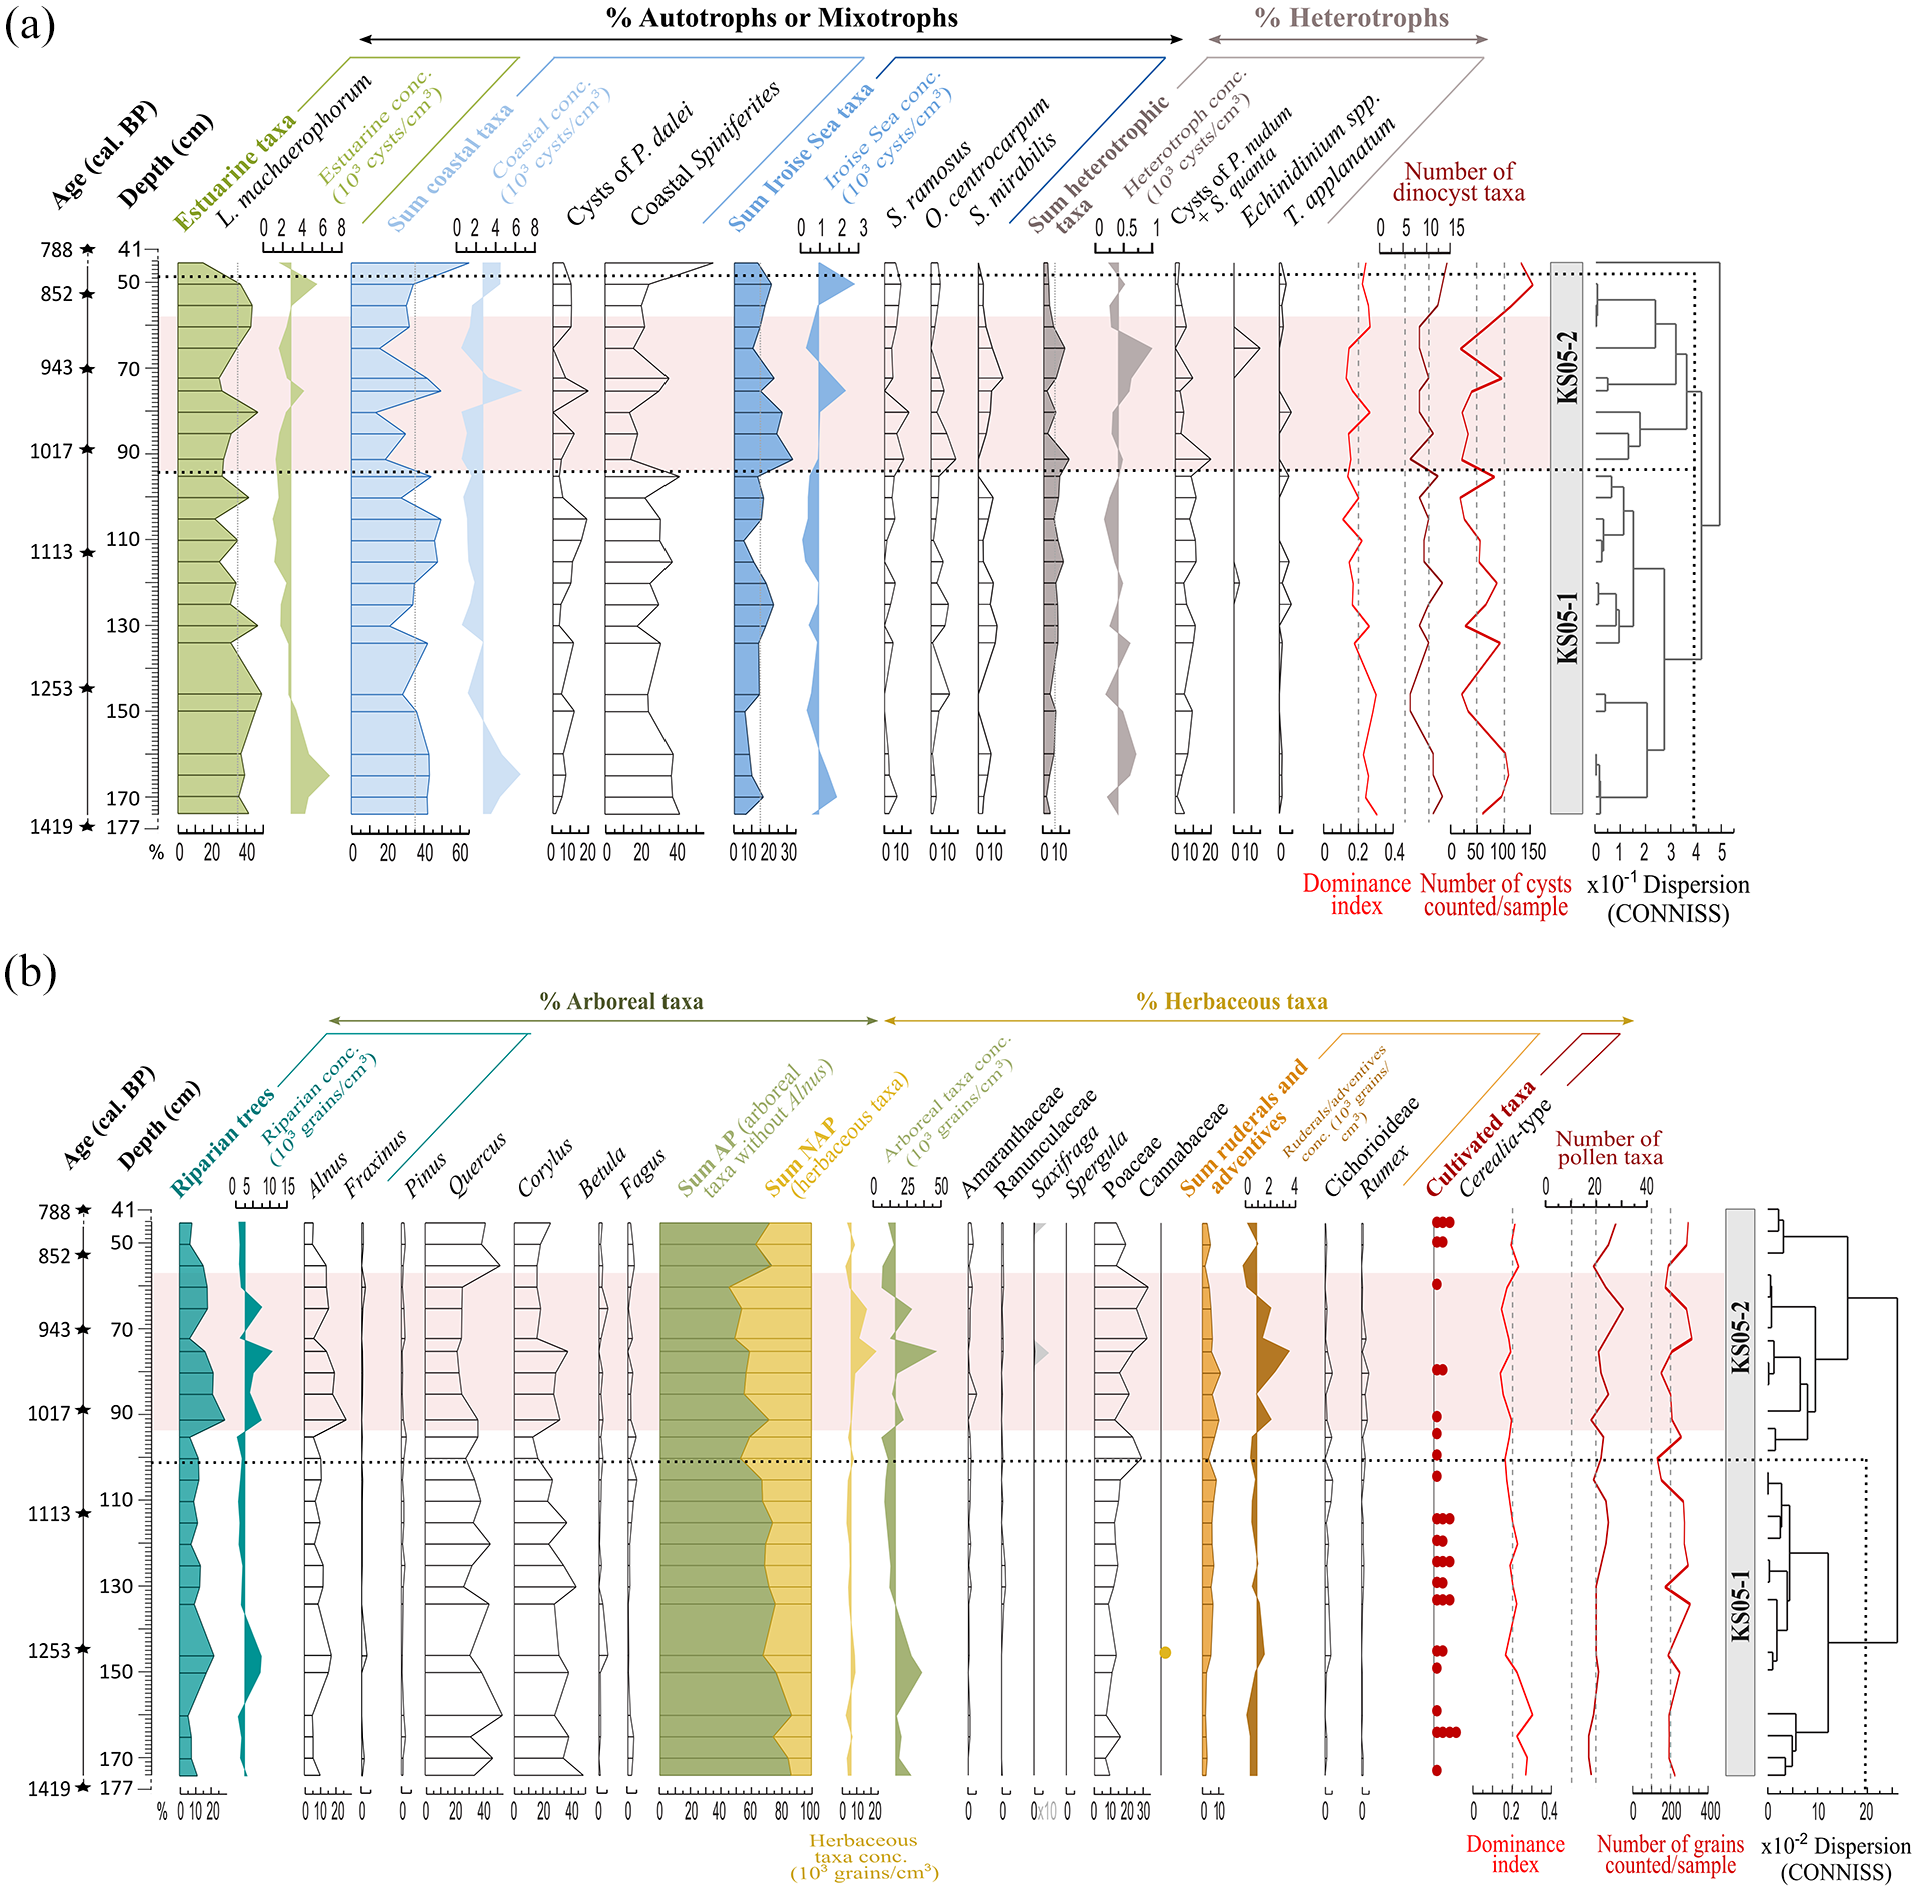
Core PALM-KS05 - Palynological results plotted against depth (cm) for: (a) Dinocyst and (b) Pollen assemblages. Major taxa percentages (>1.5%) are calculated on a total dinocyst sum without any exclusion, as well as on a total pollen sum excluding Alnus. For cultivated taxa, each point corresponds to a single grain (i.e. occurrence). For pollen and dinocysts, a CONISS clustering allows highlighting main palynozones. Diversity indexes (i.e. dominance index, number of different taxa per sample) and the number of palynomorphs counted per level are also presented. The same pink band (91–60 cm; 1–0.9 ka BP, 7 points) highlights an interval for which data have been averaged for a spatial comparison (Figure 9).
Regarding core PALM-KS06 (Figure 5a), it is characterized in general by the dominance of the estuarine taxon L. machaerophorum (mean of 75% of the assemblage, dominance index of 0.6) and very low percentages of heterotrophic taxa (maximum of 4%). The CONISS analysis performed on dinocyst percentages led to the establishment of two main palynozones delimited at ~290 cm and referred to as limit A such as for sedimentological analyses (cf. Figure 3b). The transition between dinocyst zones KS06-1 and KS06-2 is marked by a significant drop in total dinocyst concentrations (~8000 and ~4000 cysts/cm3, respectively) that can be explained by the major change in total grain-size values (cf. D50 on the total sediment fraction) with coarser sediments characterizing the sequence above limit A (Figure 3b). Dinocyst zone KS06-1 corresponds to lower percentages of L. machaerophorum (65%) as well as higher percentages and concentrations of coastal (17% and 1400 cysts/cm3) and Iroise Sea (16% and 1200 cysts/cm3) taxa than the palynozone KS06-2. Within zone KS06-1, subzone KS06-1a is not described as it is based on a single point. Dinocyst zone KS06-2 is then characterized by higher percentages of L. machaerophorum (i.e. 80%) and lower values of coastal and Iroise Sea taxa (14% for 570 cysts/cm3 and 5% for 170 cysts/cm3, respectively). Within zone KS06-2, subzones KS06-2a versus KS06-2b are characterized by a decrease in L. machaerophorum percentages (84% vs 68%) and concentrations (4000 vs 1660 cysts/cm3).
Regarding core PALM-KS05 (Figure 6a), it is characterized by the co-dominance (35% in average) of the estuarine taxon L. machaerophorum and of coastal dinocyst taxa (mainly represented by coastal Spiniferites species). The CONISS analysis performed on dinocyst percentages led to the establishment of 3 palynozones delimited at ~94 and ~48 cm. Dinocyst zone KS05-1 shows relatively stable percentages of estuarine and coastal dinocyst taxa (both at 39% in average), and a gradual increase in heterotrophic taxa (mostly represented by cysts of P. nudum and S. quanta) along the sequence (from 4% to 13% in this interval). In zone KS05-1, higher dinocyst concentrations are noted between 170 and 165 cm and likely correspond to an interval with finer sedimentation (cf. 175–155 cm in Ehrhold et al., 2021). Dinocyst zone KS05-2 corresponds to decreasing percentages of coastal Spiniferites (mean of 21%) and heterotrophic taxa (from 19% to 3% in this interval) and increasing values of Iroise sea taxa (mean of 21%). Finally, a last dinocyst zone is not described as it is based on a single point.
Thanks to the CONISS analyses, we selected levels for spatial comparisons with AR dinocyst data across two 100 yr-long intervals (cf. Table 3; pink bands in Figures 5a and 6a): 307–302 cm (3 levels) on core PALM-KS06 for the ~4.4–4.3 ka BP interval (Middle Holocene; subsequently compared with core ‘F’ data; cf. Section 4.2.1), and 91–60 cm (7 levels) on core PALM-KS05 for the ~1–0.9 ka BP interval (Late Holocene; subsequently compared with core SRQ3-KS22 data; Lambert, 2017).
Pollen analyses
Pollen taxa were grouped according to their ecological affinities defined by Quéré et al. (2008) and previous studies on BB paleoenvironments (Lambert et al., 2018, 2019, 2020): riparian taxa (Alnus, Salix, Fraxinus), arboreal taxa (AP) without Alnus (Pinus, Abies, Taxus, Quercus, Corylus, Hedera, Betula, Fagus, Carpinus, Tilia, Ulmus, Ilex, Populus, Acer, Castanea), ruderal-adventitious taxa (Centaurea, Mercurialis, Rumex, Urticaceae, Asteroideae, Cichorioideae, Plantago lanceolata), cultivated taxa (Cerealia-type and Fagopyrum) and aquatic taxa (Myriophyllum, Sparganium, Typha and Potamogeton).
Aulne river mouth record
As for dinocysts, pollen analyses on core ‘F’ (Figure 4b) are separately discussed for the two temporal windows delimited by the ~290–240 cm interval (Figure 3a). Here, pollen counts were well more than 300 grains and even reached 200 grains without considering Alnus in the main sum. A pollen diagram was therefore feasible throughout the studied sequence.
For the description of pollen data, and given the high stability of the reconstructed signals, the four samples of the lower section (8.6–8.3 ka BP; 323–293 cm) were averaged on one hand, and the 14 samples of the upper section (4.4–3.8 ka; 238–163 cm) were averaged in the other hand. It is worth noting that the diversity is quite identical between both upper (28 different taxa) and lower (27 taxa) sections.
In the lower section (323–293 cm), arboreal taxa percentages are extremely high (mean of 80%) and Corylus largely dominates (55%) over Quercus (17%), while Alnus is extremely low (2.5%). Among herbaceous taxa (17%), Amaranthaceae (4%) and Ranunculaceae (4%) dominate over Poaceae (1%). In the upper section (238–163 cm), arboreal taxa percentages are still high but less than in the lower section (72%) and values are more equitable between Quercus (29%) and Corylus (35%). Compared to the lower section, Alnus percentages strongly increase in the upper section (39%), likely testifying of a stabilization of riverine banks allowing for the riparian forest development at that time. Among herbaceous taxa (21%), Ranunculaceae (8%) and Poaceae (3%) dominates over Plantago lanceolata (2%) and Amaranthaceae (1%). The transition between higher Amaranthaceae in the lower section (here likely related to salt marshes during this interval of lower sea-level) and higher Poaceae in the upper one (here likely related to the landscape opening) testifies of contrasted environments under different natural versus anthropic forcings. Finally, we also note constant occurrences of ruderal-adventitious taxa along the studied core (~1%).
The CONISS performed on the upper section allowed us to select three levels on a same pollen palynozone and across a 100 yr-long interval, as for dinocysts, for subsequent spatial comparison on a specific Middle Holocene interval (Table 3): ~4.4–4.3 ka BP (233–218 cm). Also, as for dinocysts, the 4 levels included in the lower section will be here averaged for a spatial comparison on a specific Early Holocene interval (Table 3).
Brest harbour records
As for dinocysts, pollen analyses (33 samples) on core PALM-KS06 were carried out on the 340–242 cm interval (4.8–3 ka BP; Figure 5b), and pollen analyses on core PALM-KS05 (25 samples) were carried out on the 174–45 cm interval (1.4–0.8 ka BP; Figure 6b). A total of 31 different taxa were identified in both cores PALM-KS06 and PALM-KS05 (BH), with respective averages of 21 and 22 different taxa per sample. Total pollen concentrations are characterized by respective mean values of ~22,600, 23 and 300 grains/cm3.
Regarding core PALM-KS06 (Figure 5b), it is characterized in general by high percentages of tree taxa (73%), especially Corylus and Quercus, while herbaceous taxa (especially Poaceae taxa) represent 23% on average. Percentages and concentrations of agro-pastoral pollen taxa remain low throughout the sequence, with 1% and 138 grains/cm3 of ruderal-adventitious taxa, and only one occurrence of Cerealia-type (312 cm). The CONISS analysis performed on pollen percentages led to the establishment of two main palynozones delimited at ~289 cm (Figure 5b), here again referred to as limit A (cf. Figures 3b and 5a). This limit is marked by a significant drop in total pollen concentrations (~45,500, 10 and 500 grains/cm3, respectively) that can be explained, as for dinocysts, by the change in total grain-size values with coarser sediments characterizing the sediment sequence above limit A (Figure 3b). The transition between pollen zones KS06-2a and KS06-2b (limit B, ~255 cm) is less clear and is mainly driven by a fall in riparian taxa percentages (33% in subzone KS06-2a and 25% in subzone KS06-2b). In pollen zone KS06-1, arboreal taxa percentages are declining steadily (from 87% to 71% in this interval), before a relative stabilization around ~70% in pollen zone KS06-2 (71% in subzone KS06-2a and 68% in subzone KS06-2b). In parallel, Poaceae percentages generally increase in pollen zone KS06-2 (8% vs 2% in zone KS06-1).
Regarding core PALM-KS05 (Figure 6b), the CONISS analysis performed on pollen percentages led to the establishment of two main palynozones delimited at ~100 cm. Pollen zone KS05-1 is characterized by higher percentages of trees (mainly Quercus and Corylus), that gradually tend to decrease (from 79% to 67% in the interval). In this first palynozone, we also detect regular occurrences of large pollen grains of Poaceae that could be attributed to Cerealia pollen types (i.e. mean of two grains per sample). Pollen zone KS05-2 displays a slowdown in the decrease of arboreal taxa percentages that stabilize around ~60% and higher values of Poaceae (mean of 23%).
Thanks to the CONISS analyses, we selected the same levels as for dinocysts for the spatial comparisons with AR pollen data across two 100 yr-long intervals (cf. Table 3). All selected levels (highlighted with pink bands in Figures 5b and 6b) are found within homogeneous palynozones regarding pollen assemblages.
Discussion
Spatial study on modern sediments
Many studies have discussed the influence of a proximal (coastal area)/distal (marine environment) gradient on pollen taxa that are under- (e.g. riparian woodland taxa) or over- (e.g. Pinus, Quercus) represented in marine sediments (and conversely close to river mouths when the fluvial impact increases) since the pioneer works of Turon (1984) subsequently followed by Beaudouin et al. (2007), or recently by David et al. (2022).
In this study, the hierarchical clustering based on palynological data from the n = 41 surface sediments distinguishes two main groups of samples (A and B; Figure 7a), each subdivided into two sub-groups (A1-A2 and B1-B2; Figure 7a). First, a relatively dispersed distribution pattern of the four sub-groups of samples can be observed (Figure 7c). This can be attributed to the tidal forcing, which results in a strong mixing of water masses and, therefore, also of the organic particles and terrestrial sediments transferred to the BB (Pommepuy et al., 1979).
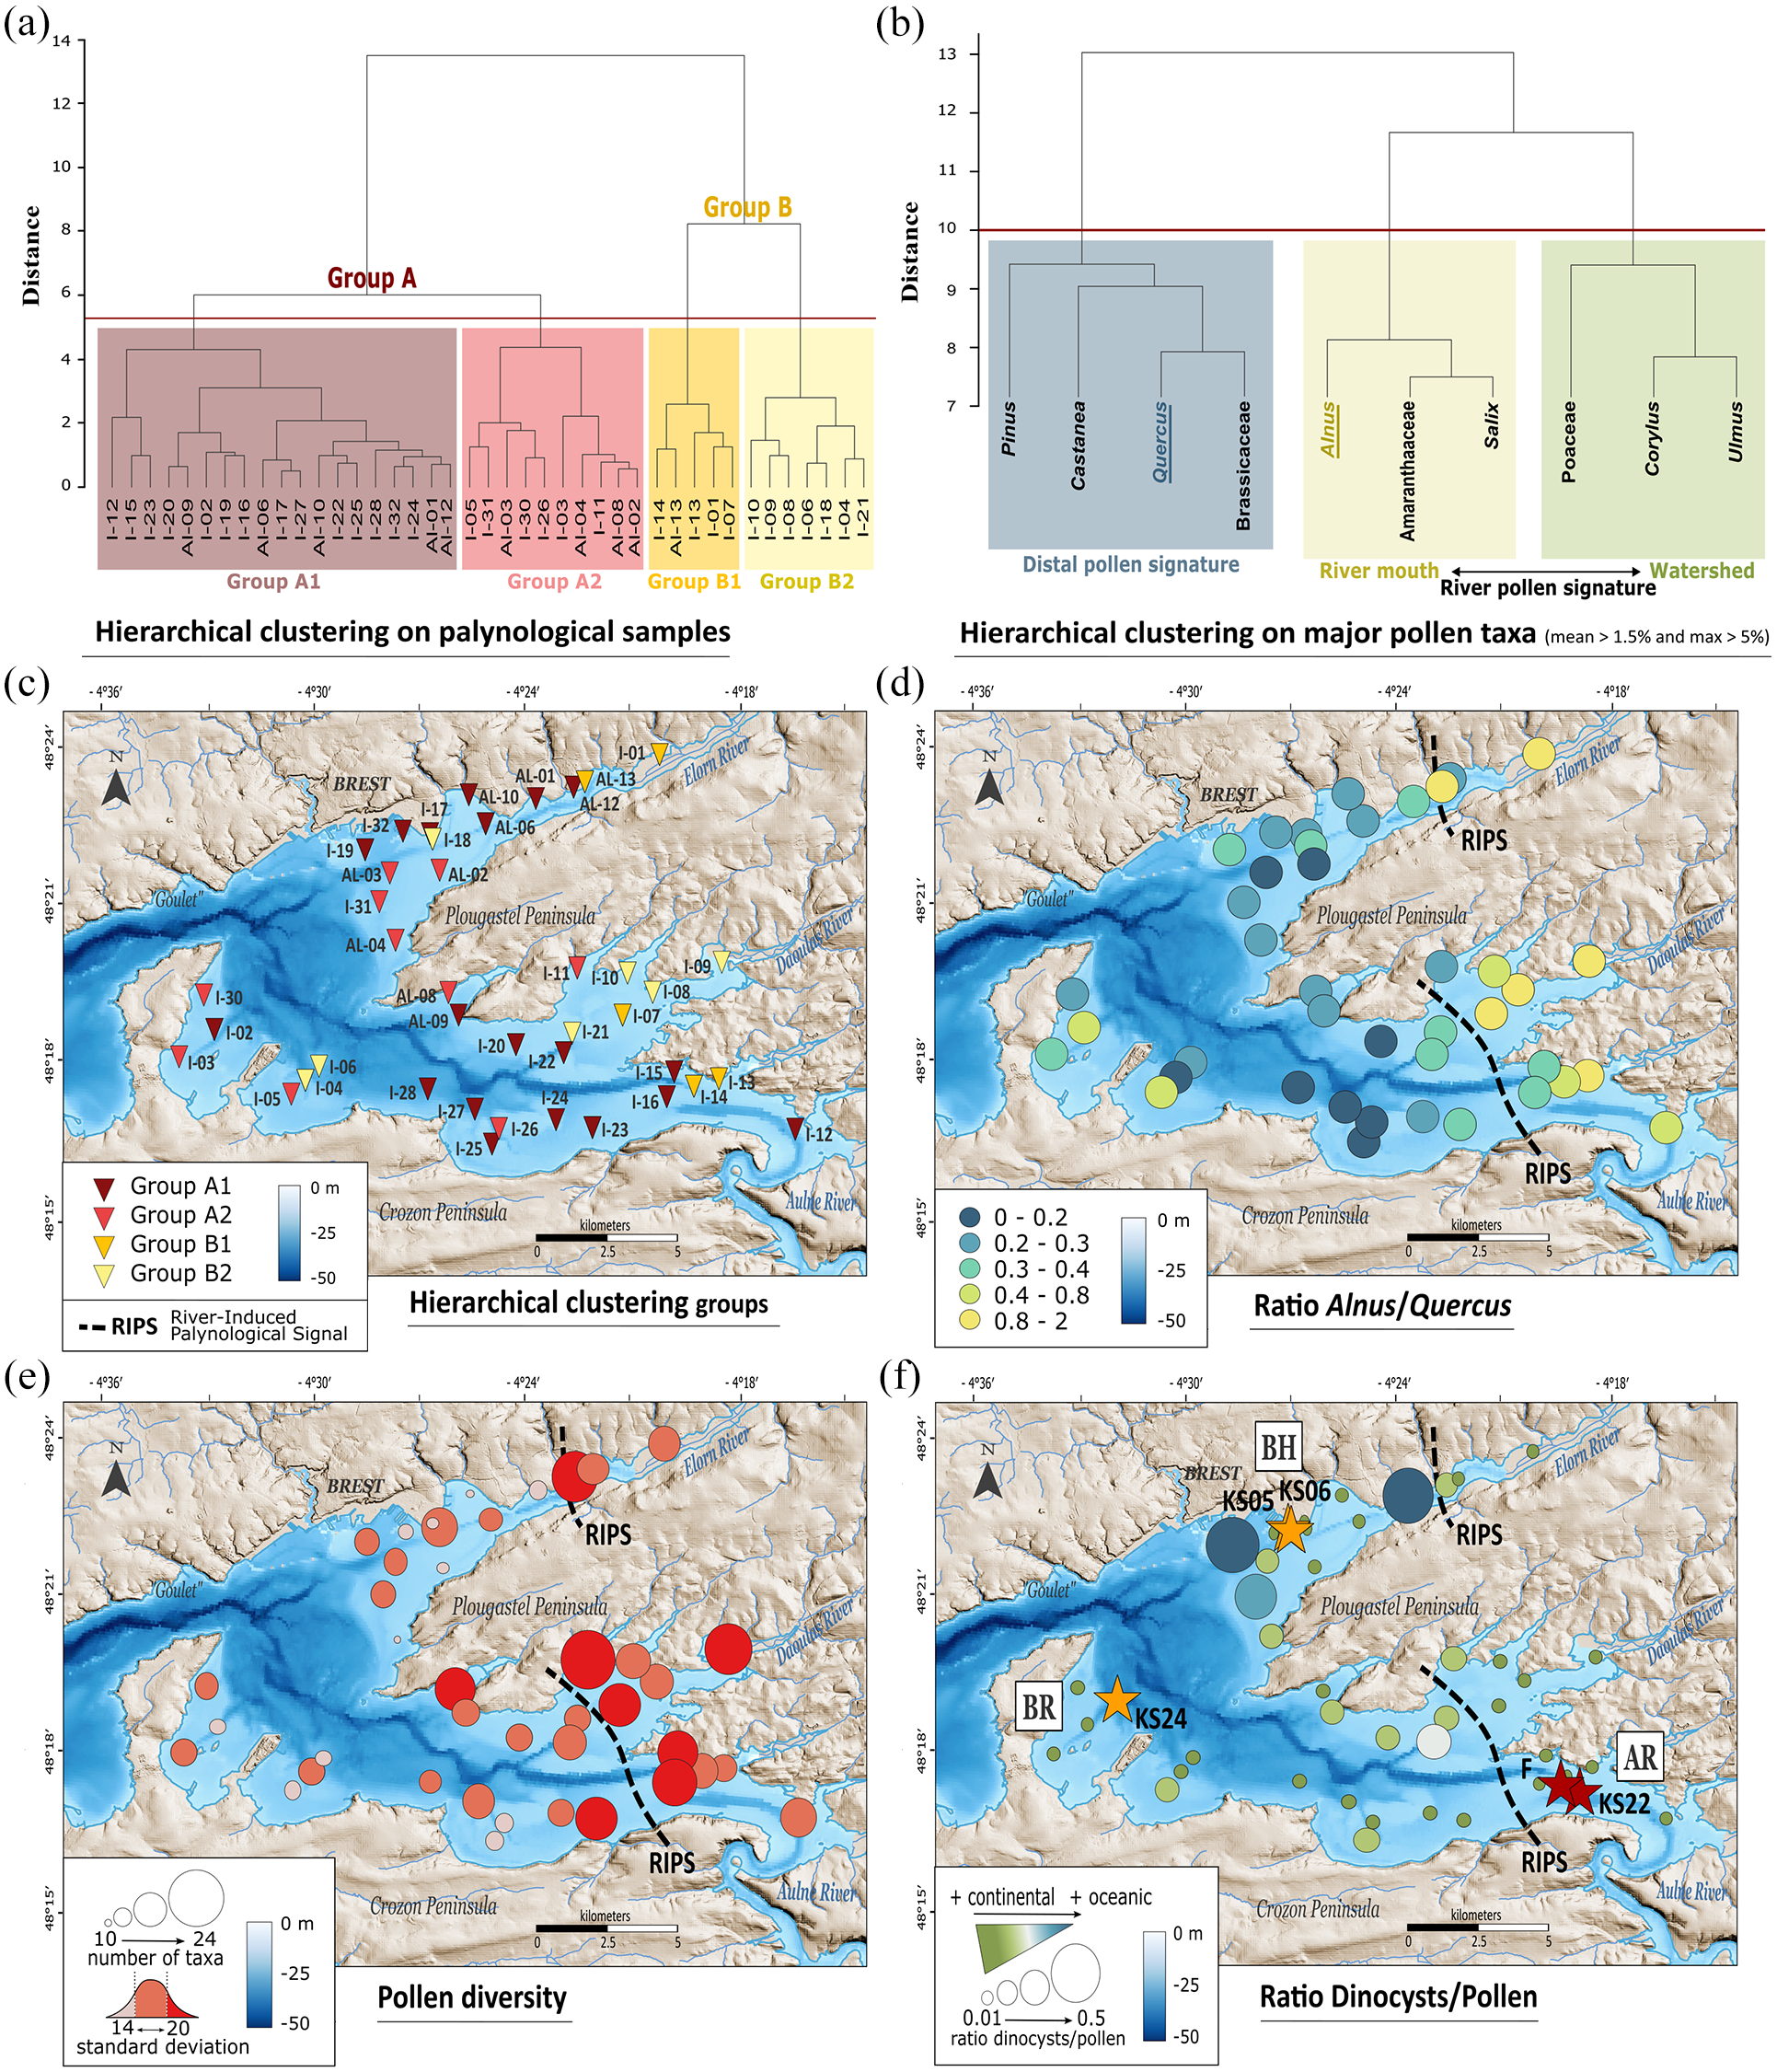
Statistical analysis of palynological data from 41 modern samples across the Bay of Brest (data from Lambert et al., 2017). The hierarchical clustering analyses (Ward’s method) were performed on (a) palynological samples and (b) percentages of major pollen taxa, following the rule: mean > 1.5% and max > 5% at least once in the dataset. (c) Distribution map of the 4 groups identified with the hierarchical clustering performed on palynological samples. (d) Ratio of two statistically distant taxa: Alnus (stronger pollen signal of river influence)/Quercus (stronger pollen signal of oceanic influence). (e) Distribution of pollen diversity. (f) Dinocyst (marine bioindicator)/Pollen (terrestrial bioindicator) ratio. The cores are divided into three coring sites: Bay of Roscanvel (BR), Brest harbour (BH) and mouth of the Aulne river (AR). Black dashed lines represent the limits of the river-induced palynological signal (RIPS). Cores identified with orange stars are located west of the RIPS limits and cores identified with red stars are located east of the RIPS limits.
However, despite a general homogenization of pollen signatures across the BB, samples from group B appear closer to the river mouths (Elorn and Aulne rivers, and Bay of Daoulas) compared with those from group A. For this reason, we have defined BB limits for the river-induced palynological signal (here referred to as RIPS limits). Other complementary palynological information (Figure 7d–f) support this interpretation. The proximal areas of the BB (i.e. upstream areas east of the RIPS limits) display higher Alnus to Quercus ratios than distal areas (i.e. downstream areas west of the RIPS limits; Figure 7d). Indeed, Alnus is associated with Salix and Amaranthaceae in the hierarchical clustering based on percentages of the major pollen taxa (Figure 7b). This is consistent with the fact that riparian pollen taxa (especially Alnus) have previously been associated with enhanced fluvial discharges in modern (Lambert et al., 2017) and Holocene paleoenvironmental (Lambert et al., 2019, 2020) studies. Also, the more proximal areas, located east of the RIPS limits, are logically characterized by a greater pollen diversity (>20 taxa identified per sample) due to their direct connection with continental pollen sources (Figure 7e). The downstream areas, located west of the RIPS limits are more influenced by oceanic and tidal currents but less by the prevalent ‘river mouth signal’. These areas are characterized by higher values of Quercus (see Figure 7d) and Pinus occurrences, as previously discussed in Lambert et al. (2017), as well as higher dinocyst to pollen ratios (Figure 7f), especially in the axis of the Goulet towards the Elorn river.
In order to perform a Holocene palynological stack from different BB sediment sequences, we will therefore focus the discussion on cores collected west of the RIPS limits (cf. Valero et al., submitted – PART II), including newly studied cores PALM-KS05 and PALM-KS06 and excluding cores ‘F’ and SRQ3-KS22, in order to minimize potential site effects in the building of the composite sequence.
West to east palynological signals across the Early holocene
Palynological data acquired on core ‘F’ in the Aulne river sector (AR, east of the RIPS limit; 8.6–8.3 ka BP interval, four samples; this study) are compared with those of core SRQ3-KS24 (BR, west of the RIPS limit; 9.5–9.4 ka BP interval, three samples; Lambert et al., 2019) (Figure 8). During the Early Holocene, also corresponding to the Mesolithic cultural subdivision, the landscape was characterized by a wooded landscape largely dominated by hazelnut trees (David, 2014; Gaudin, 2004; Lambert et al., 2019; Marguerie, 1991; Morzadec-Kerfourn, 1974). Considering the relative stability of the regional pollen signature at that time, we here compared two time windows separated by a ~1000-year gap to highlight the impact of the relative sea-level rise on the BB coastal environments.
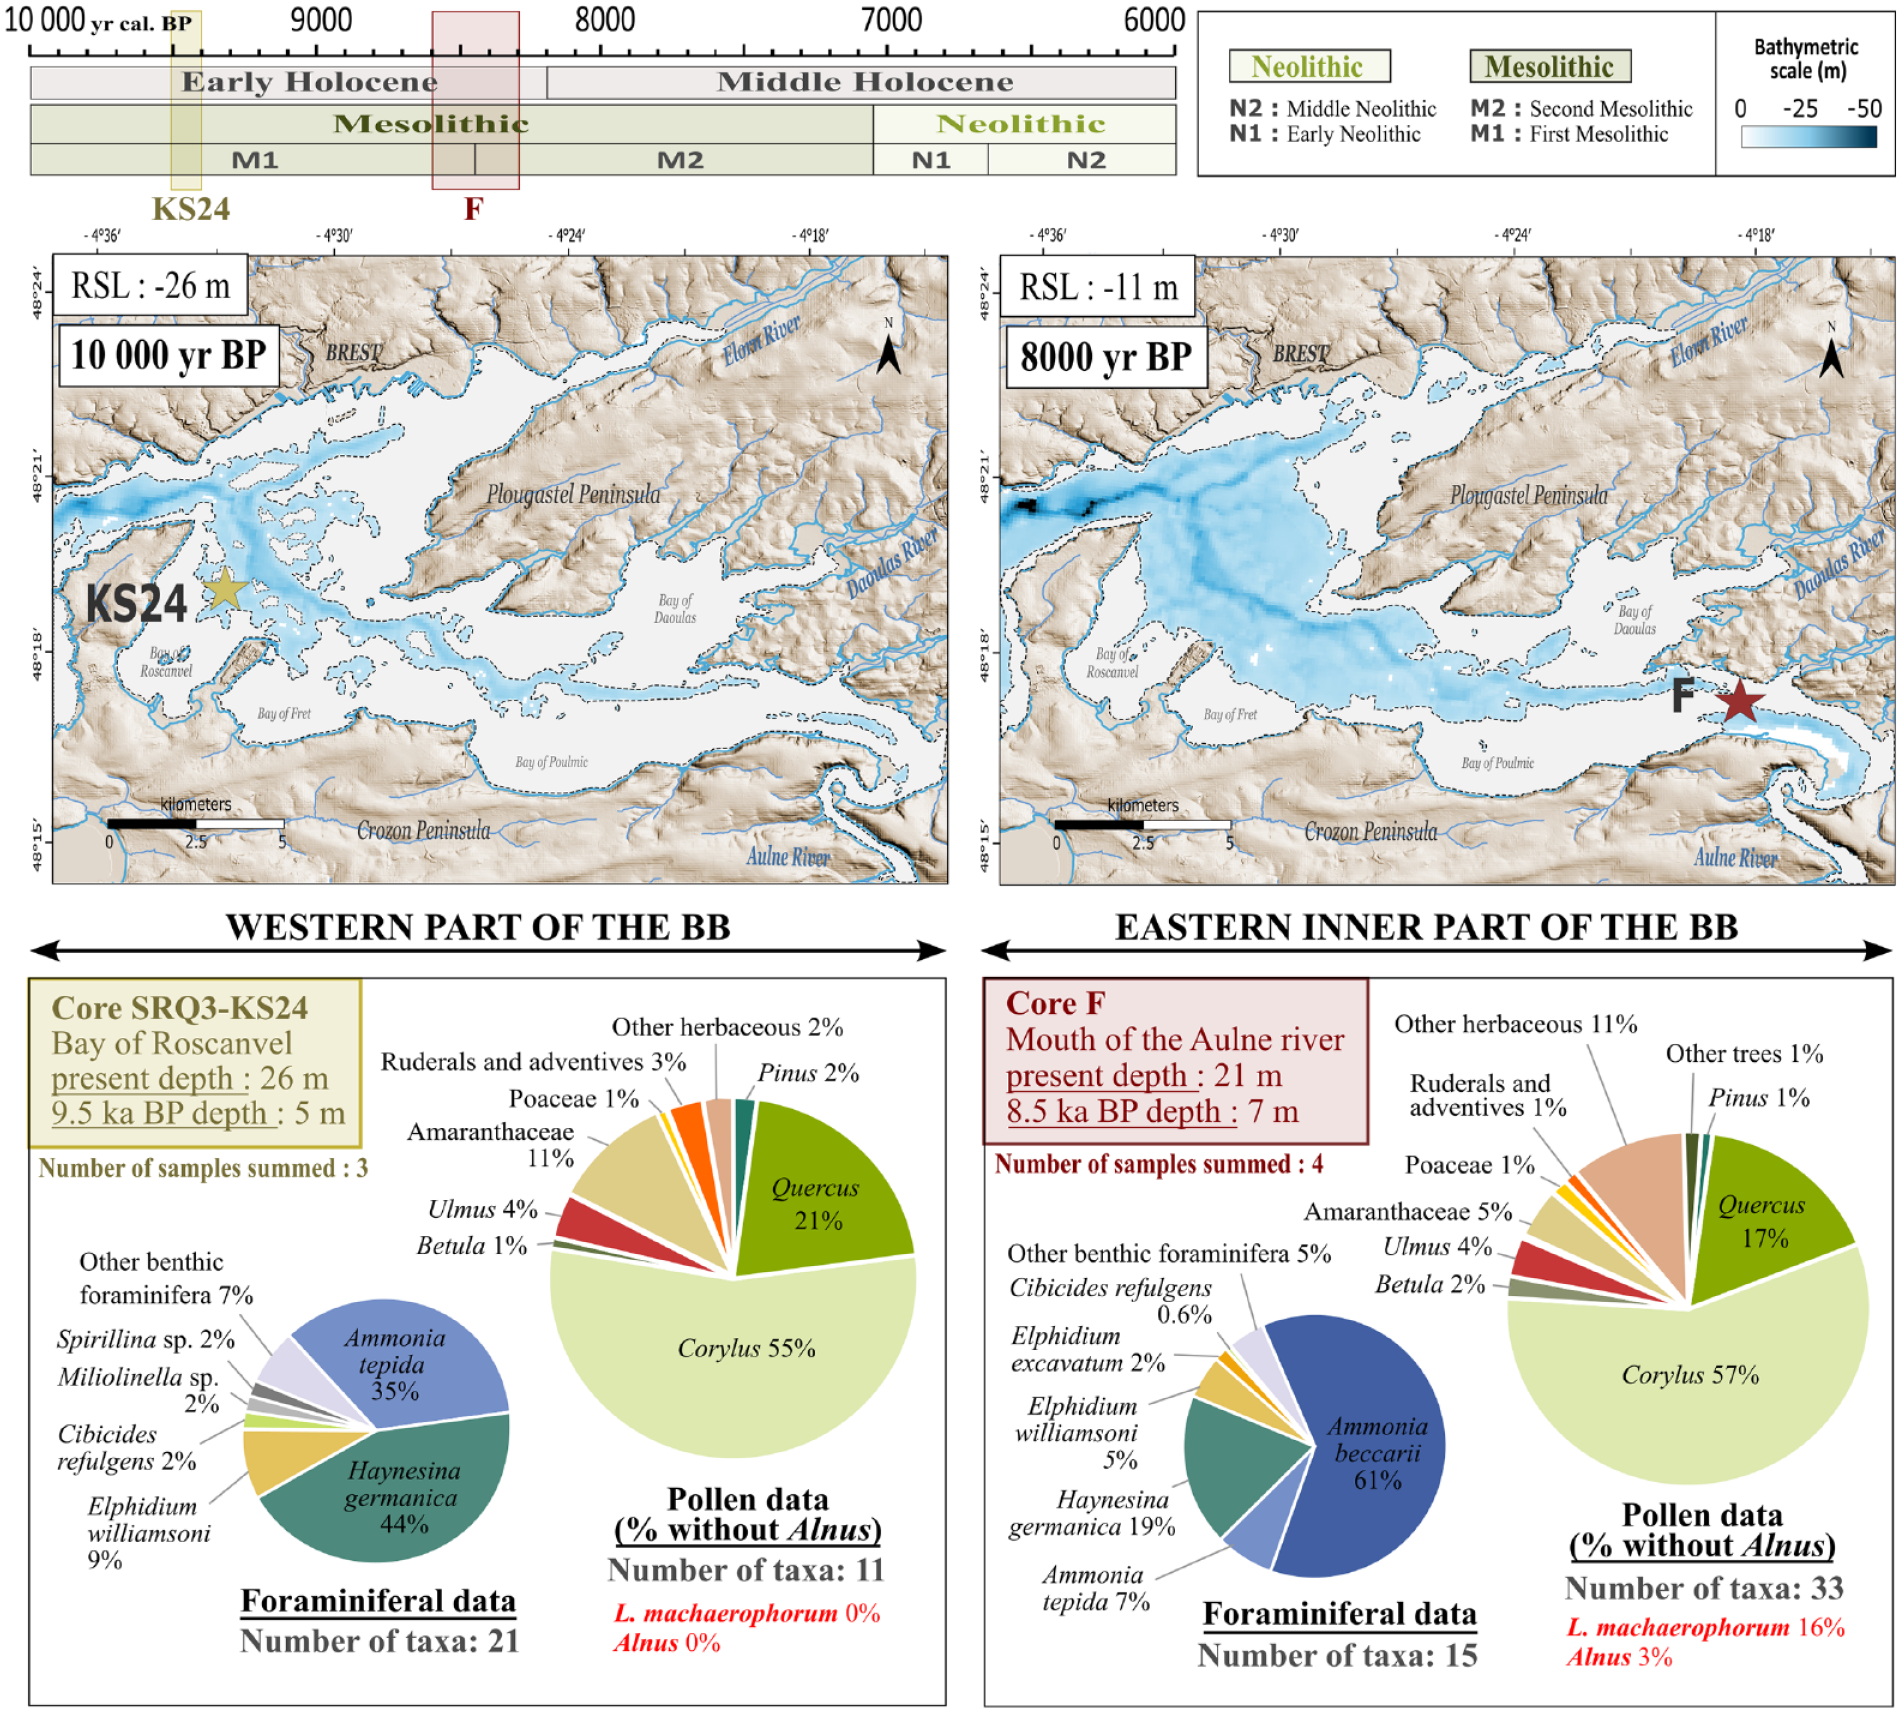
Averaged percentages of pollen and benthic foraminifera data between western (core SRQ3-KS24; BR) and eastern inner (core ‘F’; AR) parts of the Bay of Brest (BB) for two Early Holocene windows, respectively centred on ~9.5 (9.5–9.4) ka BP and ~8.5 (8.6–8.3) ka BP. Background maps represent the respective paleobathymetries at 10 and 8 ka BP taking into account sea-level variations and sediment infill in the BB. For each of these age, paleobathymetries were reconstructed by subtracting the thickness of sedimentary units that had not yet been deposited from the present-day seafloor depth map (from Gregoire et al., 2017’s interpretation), and corrected from sea-level variations (from García-Artola et al., 2018 with respective sea-levels of −26 and −11 m relative to present-day), using Global Mapping Tool software (GMT; Wessel et al., 2019).
In our records, the predominance of tree pollen taxa percentages (>80%), especially Corylus (~56%), Quercus (~19%), Ulmus (4%) and Betula (~1.5%), as well as the very low proportion of Alnus (0% around 9.5 ka BP; 3% around 8.5 ka BP), suggest that the vegetation cover around the BB was largely dominated by mixed temperate forests with very little riparian forest development. However, slight differences between pollen assemblages can be highlighted across the two temporal windows compared here, particularly regarding the diversity of pollen taxa (11 taxa at ~9.5 ka BP in BR vs 33 taxa at ~8.5 ka BP in AR) as well as the Amaranthaceae taxa percentages (11% at ~9.5 ka BP in BR vs 5% at ~8.5 ka BP in AR). To accurately interpret the Amaranthaceae offset at both coring sites, benthic foraminiferal assemblage data were also used in the description of each shallow-water environment. In core SRQ3-KS24 (BR), the foraminiferal assemblage is characteristic of intertidal sheltered mudflat environments (i.e. Ammonia tepida and Elphidium williamsoni) and continental organic matter inputs (Haynesina germanica) (Lambert et al., 2019). This assemblage proliferates in western European estuarine environments (Debenay et al., 2006; Horton, 1999; Mojtahid et al., 2016) and suggests that the tidal currents have low impact with marine influence still confined to the axis of the Aulne river paleochannel (Gregoire et al., 2017). In core ‘F’ (AR), the benthic foraminiferal assemblage is characterized by a large dominance of the epifaunal species Ammonia beccarii (61%) attesting to less continental organic inputs due to river discharges but marked tidal dynamics up to the proximal areas of the BB. This enhanced foraminiferal-based marine signature on the distal core SRQ3-KS24 (~9.5 ka BP) relative to the proximal core ‘F’ (~8.5 ka BP) could be due to the earlier flooding of the most distal site. Additionally, the rapid sea-level rise between 10 and 8 ka BP (i.e. from −26 to −11 m compared with the present level; García-Artola et al., 2018) also probably contributed to a reduction in salt marsh areas and thus to a slight decline in Amaranthaceae occurrences. In addition, the past geomorphological configurations of the two studied sites are also important to consider. The SRQ3-KS24 coring site (BR) was located in an environment surrounded by a large foreshore, while the ‘F’ coring site (AR) was located in a more confined area of the inner BB (Figure 8). Since Amaranthaceae pollen grains are subject to very little transport (Morzadec-Kerfourn, 1974), their lower occurrences in the AR sector at ~8.5 ka BP may also reflect a lower recruitment surface in the inner BB (Figure 8), independently from the transgression cause initially hypothesized. Also, the greater pollen diversity at the AR coring site may be due to its direct and stronger connection with the Aulne watershed (i.e. a greater diversity of species will sediment close to pollen continental sources; Beaudouin et al., 2007). In any case, from west to east, a good coherence of major pollen signals confirms that the general evolution of pollen assemblages is similar, with perhaps slight differences for Amaranthaceae, even in a major transgressive context (~15 m of sea level rise between 10 and 8 ka BP), in geographically contrasted sectors of the BB, and across an interval when human impact is still moderate on the landscape (i.e. Mesolithic cultural subdivision).
North-west to south-east palynological signals across the Middle and Late Holocene
Palynological data acquired on cores PALM-KS05 and PALM-KS06 (BH; this study) were compared with those of cores ‘F’ (AR; this study) and SRQ3-KS22 (AR; Lambert, 2017) on two 100-year snapshots of the Middle (~4.4–4.3 ka BP interval) and Late (1–0.9 ka BP interval) Holocene (Figure 9).
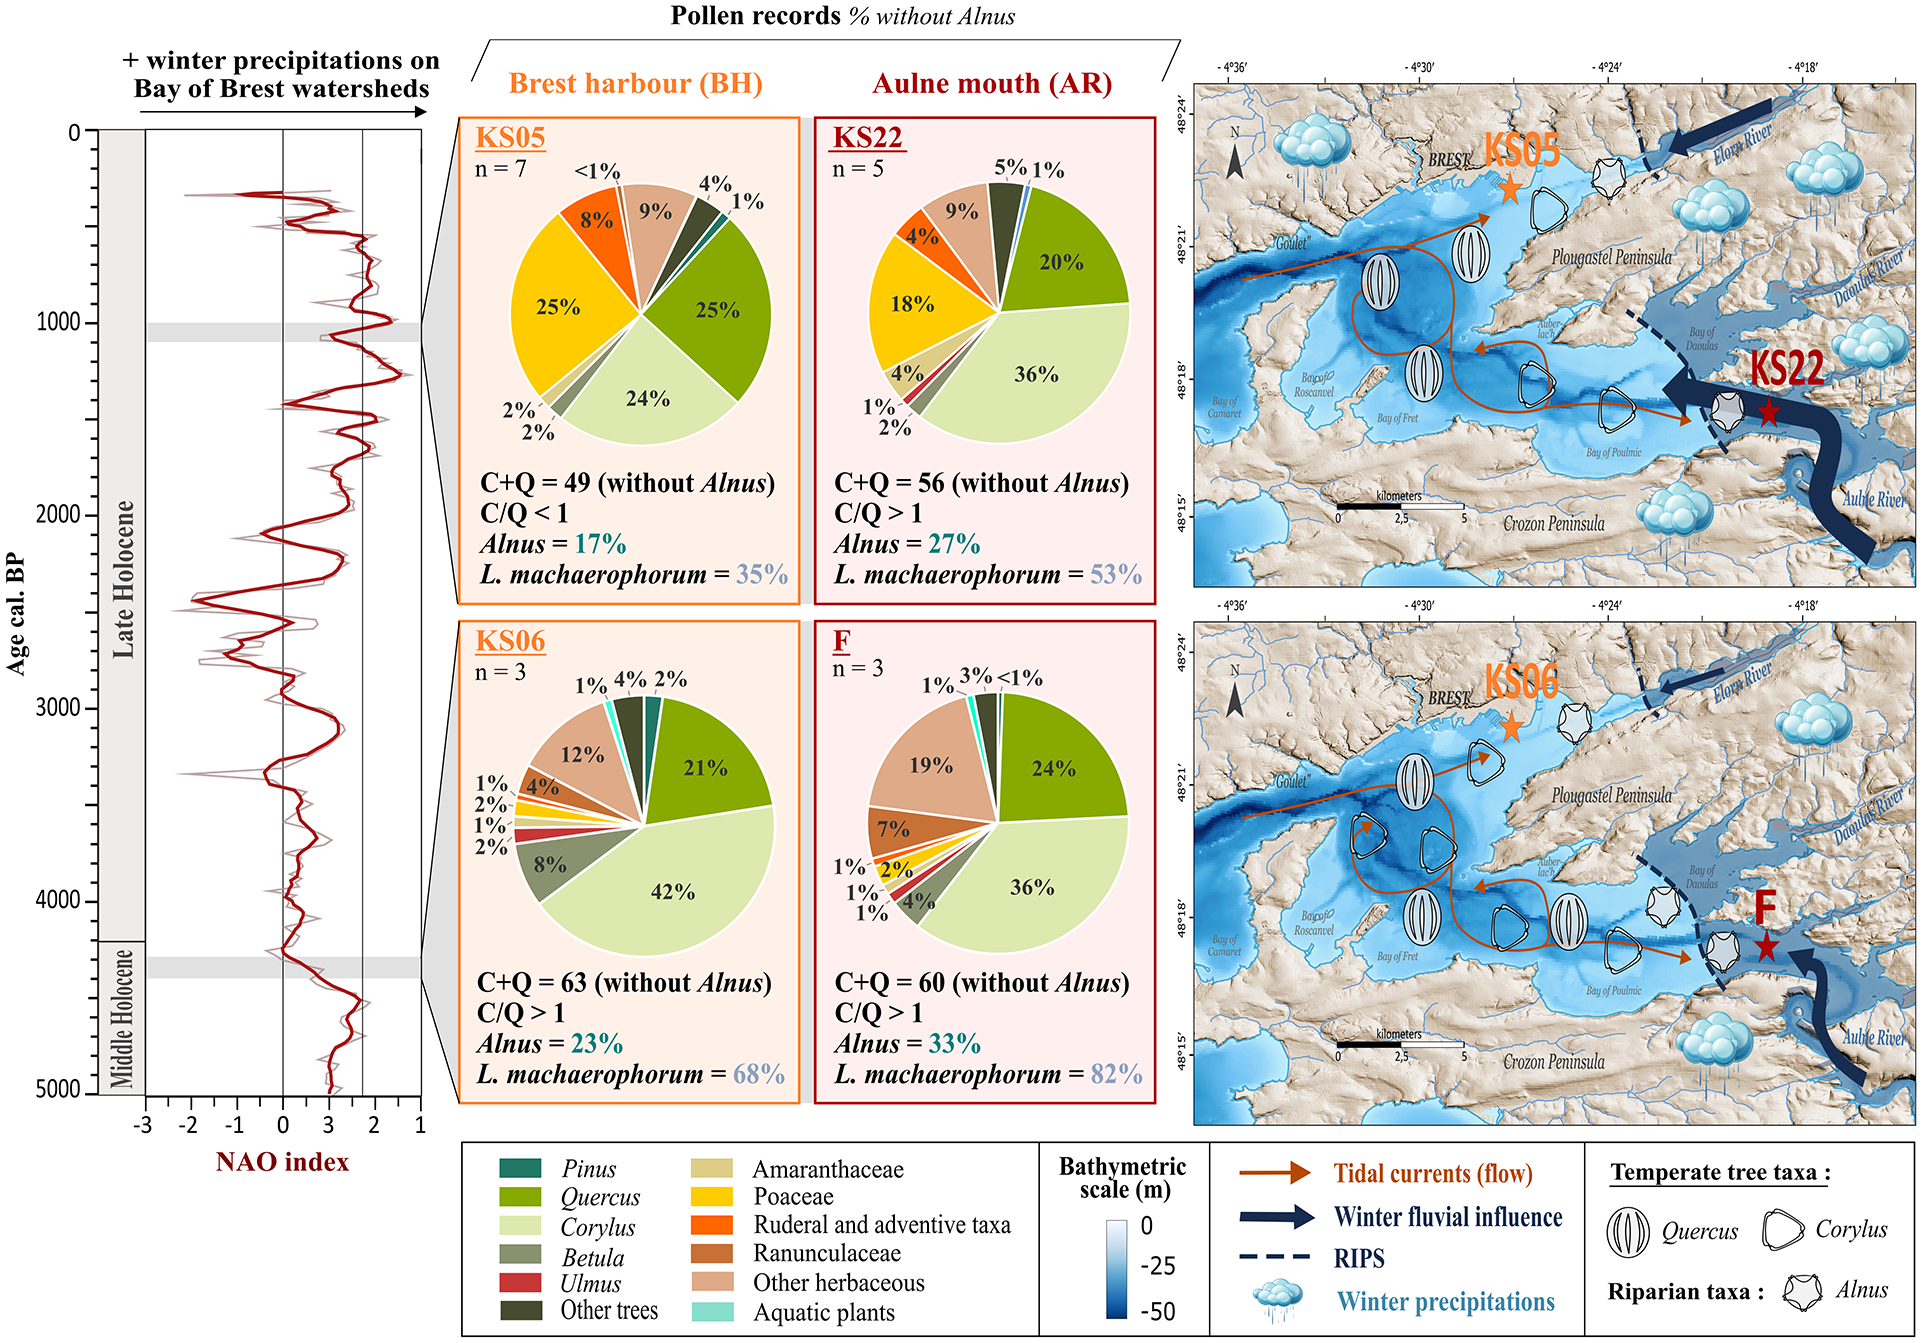
Averaged pollen data percentages between two Bay of Brest (BB) sites (BH area: cores PALM-KS05 and PALM-KS06; AR area: cores ‘F’ and SRQ3-KS22) for two 100-year time intervals over the Middle Holocene (4.4–4.3 ka BP) and the Late Holocene (1–0.9 ka BP). Precipitation regimes through time within the BB catchments are derived from the North Atlantic Oscillation (NAO) index (Olsen et al., 2012). At the right side of the Figure, the two maps illustrate the proportion of the main pollen temperate tree taxa (Alnus, Corylus and Quercus) for each time window according to our pollen results: the number of palynomorphs represented in both maps is based on an arbitrary initial value of three grains of Corylus for the interval 4.3–4.4 ka BP. Blue dashed lines represent the river-induced palynological signal (RIPS) limits (cf. Figure 7).
Following the major inflexion of sea level rise at ~6 ka BP (García-Artola et al., 2018) and the reduced accommodation space highlighted on the Armorican shelf (David et al., 2022) and in the BB (Gregoire et al., 2017), the stabilization of fluvial environments favoured the development of alluvial plains and allowed riparian taxa to progressively colonize riverbanks (Penaud et al., 2020). This is reflected by Alnus taxa percentages reaching 33% in the upper section of core ‘F’ (AR; ~4.4–3.8), a value significantly higher than that (3%) observed in the lower section (~8.6–8.3) (see Section 4.3.1; Figure 4). Interestingly, percentages of Alnus and L. machaerophorum always appear more pronounced at AR than at BH studied sites, whatever the Middle or Late Holocene intervals compared (Figure 9). This significant difference between estuarine palynomorph occurrences from east (i.e. Aulne river influence stronger than tidal one) to west (i.e. tidal influence stronger than Aulne river one) may reflect the decreasing gradient of fluvial influence through the BB, such as observed today in palynological data from modern surface sediments (see Section 5.1; Figure 7; Lambert et al., 2017). In addition, comparing the four configurations, the contemporaneous records are quite similar for both AR and BH sectors (cores ‘F’ vs PALM-KS06 and cores SRQ3-KS 22 vs PALM-KS05) whatever the time interval considered (~4.4–4.3 ka BP and 1–0.9 ka BP, respectively). Indeed, in both cases, from 4.4 to 1 ka BP, Poaceae percentages strongly increased (from 2% up to ~20%), together with the ruderal and adventitious taxa, highlighting the landscape impact of anthropization (cf. Valero et al., submitted – PART II).
However, slight spatial differences can be highlighted. On one hand, on the 100-year long ~4.4–4.3 ka BP interval, the differences among pollen taxa percentages (Alnus being excluded from the main pollen sum) reconstructed between AR and BH areas are low (mean difference of 2.2%, standard deviation of 2.3%), with similar dominance of Corylus (~40%) and Quercus (~20%) at both south-eastern and north-western sites and a prevalence of Corylus (C) over Quercus (Q) in both cases (C/Q ratio > 1). On the other hand, on the 100-year long 1–0.9 ka BP interval, percentages of Corylus are still higher than those of Quercus at AR studied site (C/Q ratio > 1), whereas the C/Q ratio is less than 1 at BH one. Two main hypotheses can be put forward for the Late Holocene interval. First, if we consider the climatic context in which these spatial comparisons took place (Olsen et al., 2012; Figure 9), and assuming similar vegetation changes in BB catchment areas under different contexts of anthropization though time, these intervals correspond to contrasted NAO-like configurations. The latter tend towards recurrent conditions of NAO- conditions during the ~4.4–4.3 ka BP interval (i.e. lower winter precipitation over the BB) and towards recurrent conditions of NAO+ during the 1–0.9 ka BP interval (i.e. higher winter precipitation over the BB). These NAO configurations are well-known to impact fluvial discharges (Hurrell et al., 1995; Hurrell and Deser, 2009) as recorded in the BB on the period 1998–2013 (Tréguer et al., 2014). Considering that Corylus percentages are higher close to the AR area in modern surface sediments (Lambert et al., 2017; Figure 7) and that the Corylus signal has also been mentioned to decrease with distance from the coast, boosting the deciduous Quercus expression in marine sediments offshore (David et al., 2022), we suggest that the C/Q ratio may be partly explained by the balance between Aulne river floods (in the south-east part of the BB) and oceanic currents (mainly in the north-east part of the BB and the BH sector: see oceanic vs terrestrial indicators in Figure 7f). Corylus could therefore appear as a second-order complementary paleofluvial discharge proxy to Alnus (Lambert et al., 2020), whose signature could be modulated by the winter rainfall pattern. Furthermore, Corylus and Alnus pollinations generally take place during late winter (January to March; Bégeot, 1998; Olsen et al., 2000; Rodriguez-Rajo et al., 2004), while Quercus pollination generally takes place during spring (March to May; Rodríguez-Rajo et al., 2005). A stronger fluvial influence due to enhanced winter precipitation would therefore foster the Corylus, Alnus and L. machaerophorum percentages close to river mouths and hence also the east to west fluvial gradient in the BB. Inversely, we can expect that a higher homogenization of BB water masses by tidal currents would occur in a context of reduced winter floods, thereby mixing pollen grains carried to the BB throughout the year. Our first hypothesis therefore relies on a balance between tidal and fluvial impacts, averaged over multiple years at the scale of our palynological observations. A second hypothesis, superimposed on this climatic model, could be a differential impact of human occupation (urbanization, land use) and/or exploitation of Corylus between the Aulne and Elorn catchment areas through time, as shown by more ruderal and adventitious taxa, higher Poaceae and less arboreal pollen (mainly supported by less Corylus) in core PALM-KS05 (BH area; Elorn watershed) compared to core SRQ3-KS22 (AR area; Aulne watershed) during the late Holocene interval. However, the whole set of data obtained (Figures 7 –9) rather seems to support a high degree of homogeneity of the palynological data across the BB for each time period concerned, modulated by the impact of precipitation regimes which, in turn, likely alters the impact of fluvial discharges. Based on this information, for further paleoenvironmental compilation of Holocene palynological data, we recommend to best constrain the estuarine environment subject to multiple influences so as not to mix site effects that could disrupt the reading of the temporal dynamics of the reconstructed signals. For this reason, only cores located to the west of the RIPS limits in the BB will be compiled in the Holocene study (Valero et al., submitted – PART II), as recommended in Sections 5.1 and 5.2.
Conclusion
The present study focuses on the Bay of Brest (BB), a macro-tidal estuarine area of north-western France characterized by the dual influence of both oceanic currents and fluvial discharges, resulting in complex hydro-climatic and hydro-sedimentary processes varying through time. Spatial comparisons based on modern BB sediments as well as on palynological data for different time windows over the Early (~9.5 and ~8.5 ka BP), Middle (~4.4–4.3 ka BP interval) and Late (~1–0.9 ka BP interval) Holocene have highlighted a good coherence of palynological assemblages in geographically contrasting BB sectors through time. Considering the overall spatial homogeneity of the BB palynological records, it appears that: (i) the BB is a sedimentary basin suitable for reconstructing paleoenvironments, (ii) special caution must be taken with regard to river mouth environments where some palynological signals are prevalent (Alnus and Corylus for pollen, L. machaerophorum for dinocysts). On the strength of these recommendations, an unprecedented palynological reconstruction of Holocene BB paleoenvironments has been reconstructed over the last 7 kyrs with a mean resolution of 35 years (Valero et al., submitted – PART II).
Footnotes
Acknowledgements
The authors are grateful to the LTSER France ‘Zone Atelier Brest-Iroise’ (CNRS-INEE) and ArMeRIE programmes funded by the University of Brest (UBO) for their fruitful interdisciplinary exchanges about human ecodynamics. We thank the UMS 2572 LMC14 (Saclay, Artemis facilities) and Poznan laboratory for carbon dating, and the Ifremer projects PALMIRA (cores PALM-KS05 and KS06) and SERABEQ (cores SRQ3-KS22 and SRQ3-KS24) for cores availability. The authors are grateful to the sedimentological analytic platform (PAS) and CREAM (Ifremer-GEO-OCEAN) for analysis and core conservation, and to the LEMAR (Laboratoire des Sciences de l’Environnement Marin, IUEM, Plouzané) for access to the ‘F’ core (Ifremer programme ‘Défis Golfe de Gascogne’, 2003). Finally, we would like to thank the Bureau de Traduction de l’Université (Translation Bureau) of the University of Brest for improving the English of this article.
Author contribution(s)
Funding
The author(s) disclosed receipt of the following financial support for the research, authorship, and/or publication of this article: This work is part of a PhD thesis (by Clara Valero) financed by the ISblue project: Interdisciplinary graduate school for the blue planet (ANR-17-EURE-0015) and supported by the ISblue Flagship Project SEALEX (‘The Sea as a socio-ecological experiment’). Both were co-funded by a grant from the French government under the programme ‘Investissements d’Avenir’ as part of France 2030. This study was supported by the French National Centre for Scientific Research CNRS and is a contribution to the 2015–2016 INSU project EC2CO-LEFE ‘CAMOMI’: Convergences/Approches croisées des signaux MOléculaires et MIcropaléontologiques pour décrypter les forçages anthropiques et climatiques en milieu côtier (Rade de Brest)’ and the 2014-2015 UBO-BQR project: ‘PARADE: Signature PAléoenvironnementale des séquences Holocène en RADE de Brest : forçages climatiques et anthropiques’.