
Abstract
The post-glacial (Bølling-Allerød) sedimentary archive preserved in the Eastern Great Rann of Kachchh (EGRK) is used to reconstruct the pattern of Indian Summer Monsoon (ISM) variability, landform evolution, and the impact on the Indus Valley Civilization (IVC). Employing the sedimentology, geochemistry, and chronology supported by statistical analysis, four major phases of strengthened and weakened monsoon conditions are inferred. The pattern of geochemical variability during Phase-I (13.6 ka and 12.7 ka) indicates a relatively wetter condition (improved ISM); following this, during phase-II (11.9 ka and 11.1 ka), the ISM strength weakened. However, the ISM began to restrengthen during the phase-III (11 ka and >5 ka), with fluctuations. The phase-IV (<5 ka) is represented by a gradual decline in the ISM strength. The sediment isotopic analysis (Sr and Nd) reveals that the Indus River was the major contributor (~48%), followed by the contribution from local reworking of Mesozoic lithology from Khadir Island (~35%). The northern Thar Dune field contribution by ephemeral streams was around 14%, whereas the influence of Luni River at Trangadi Bet was insignificant (~3%). The study observed that around 7 ka, hydrological conditions dwindled, which persisted during the IVC, dated to 5.5 ka–3.8 ka in the region. However, despite dwindling freshwater from the branch off northwest-southeast trending paleochannel (via Indus), it has been hypothesized that the IVC in the EGRK (at Dholavira on Khadir Island) was sustained by the ephemeral monsoon-fed channels.
Keywords
Introduction
The low-lying salt-encrusted Eastern Great Rann of Kachchh (EGRK), spread over an area of ~15,000 km2 (Glennie and Evans, 1976; Ngangom et al., 2017), is punctuated by the rocky islands, comprised of Mesozoic and Tertiary rocks intruded by alkali basaltic plugs (Biswas, 1987). The tectonic events associated with the breakup of Gondwana land during the Late Triassic played a crucial role in the evolution of the Kachchh Rift Basin (KRB), which led to the development of horst and graben structures. The Rann (EGRK) occupies the grabens, whereas the rocky islands represent the horsts (Biswas, 1987). The tectonically active nature of the terrain is due to the structural configuration that evolved through time. However, geological and geophysical studies indicate that compared to the WGRK, the EGRK is considered tectonically more stable (Rajendran et al., 2008; Rajendran and Rajendran, 2003b).
Geomorphologically, the EGRK is bounded by the Thar Desert to the north, featuring both stabilized and active sand dunes, the Nagar Parkar uplift to the east, and the Indus floodplain to the west (Figure 1). Structurally, the EGRK is separated from the WGRK by north-south trending sub-surface Median High (MH; Biswas, 1987) which is implicated for the restriction of the eastward marine ingression from the Kori Creek during the monsoon (Figure 1). Therefore, the flooding of the EGRK essentially occurs during the monsoon and is caused by the south-draining ephemeral streams emerging from the Thar Desert and the Luni River located in the east (Glennie and Evans, 1976). The Kachchh region and the neighboring Sindh Province were inhabited by the Bronze Age Indus Valley Civilization (IVC), dated to around 5.5 ka and continued until around 3.8 ka (Bisht, 1994; Dales, 1966; Sengupta et al., 2020). Historical accounts indicate that during Alexander’s military campaign (around 325 BC), the Great Rann was navigable, whereas during the Arab invasion around 700 AD, Nagar town, currently located around 100 km northeast of Khadir Island, was a flourishing sea harbor (Sivewright, 1907).
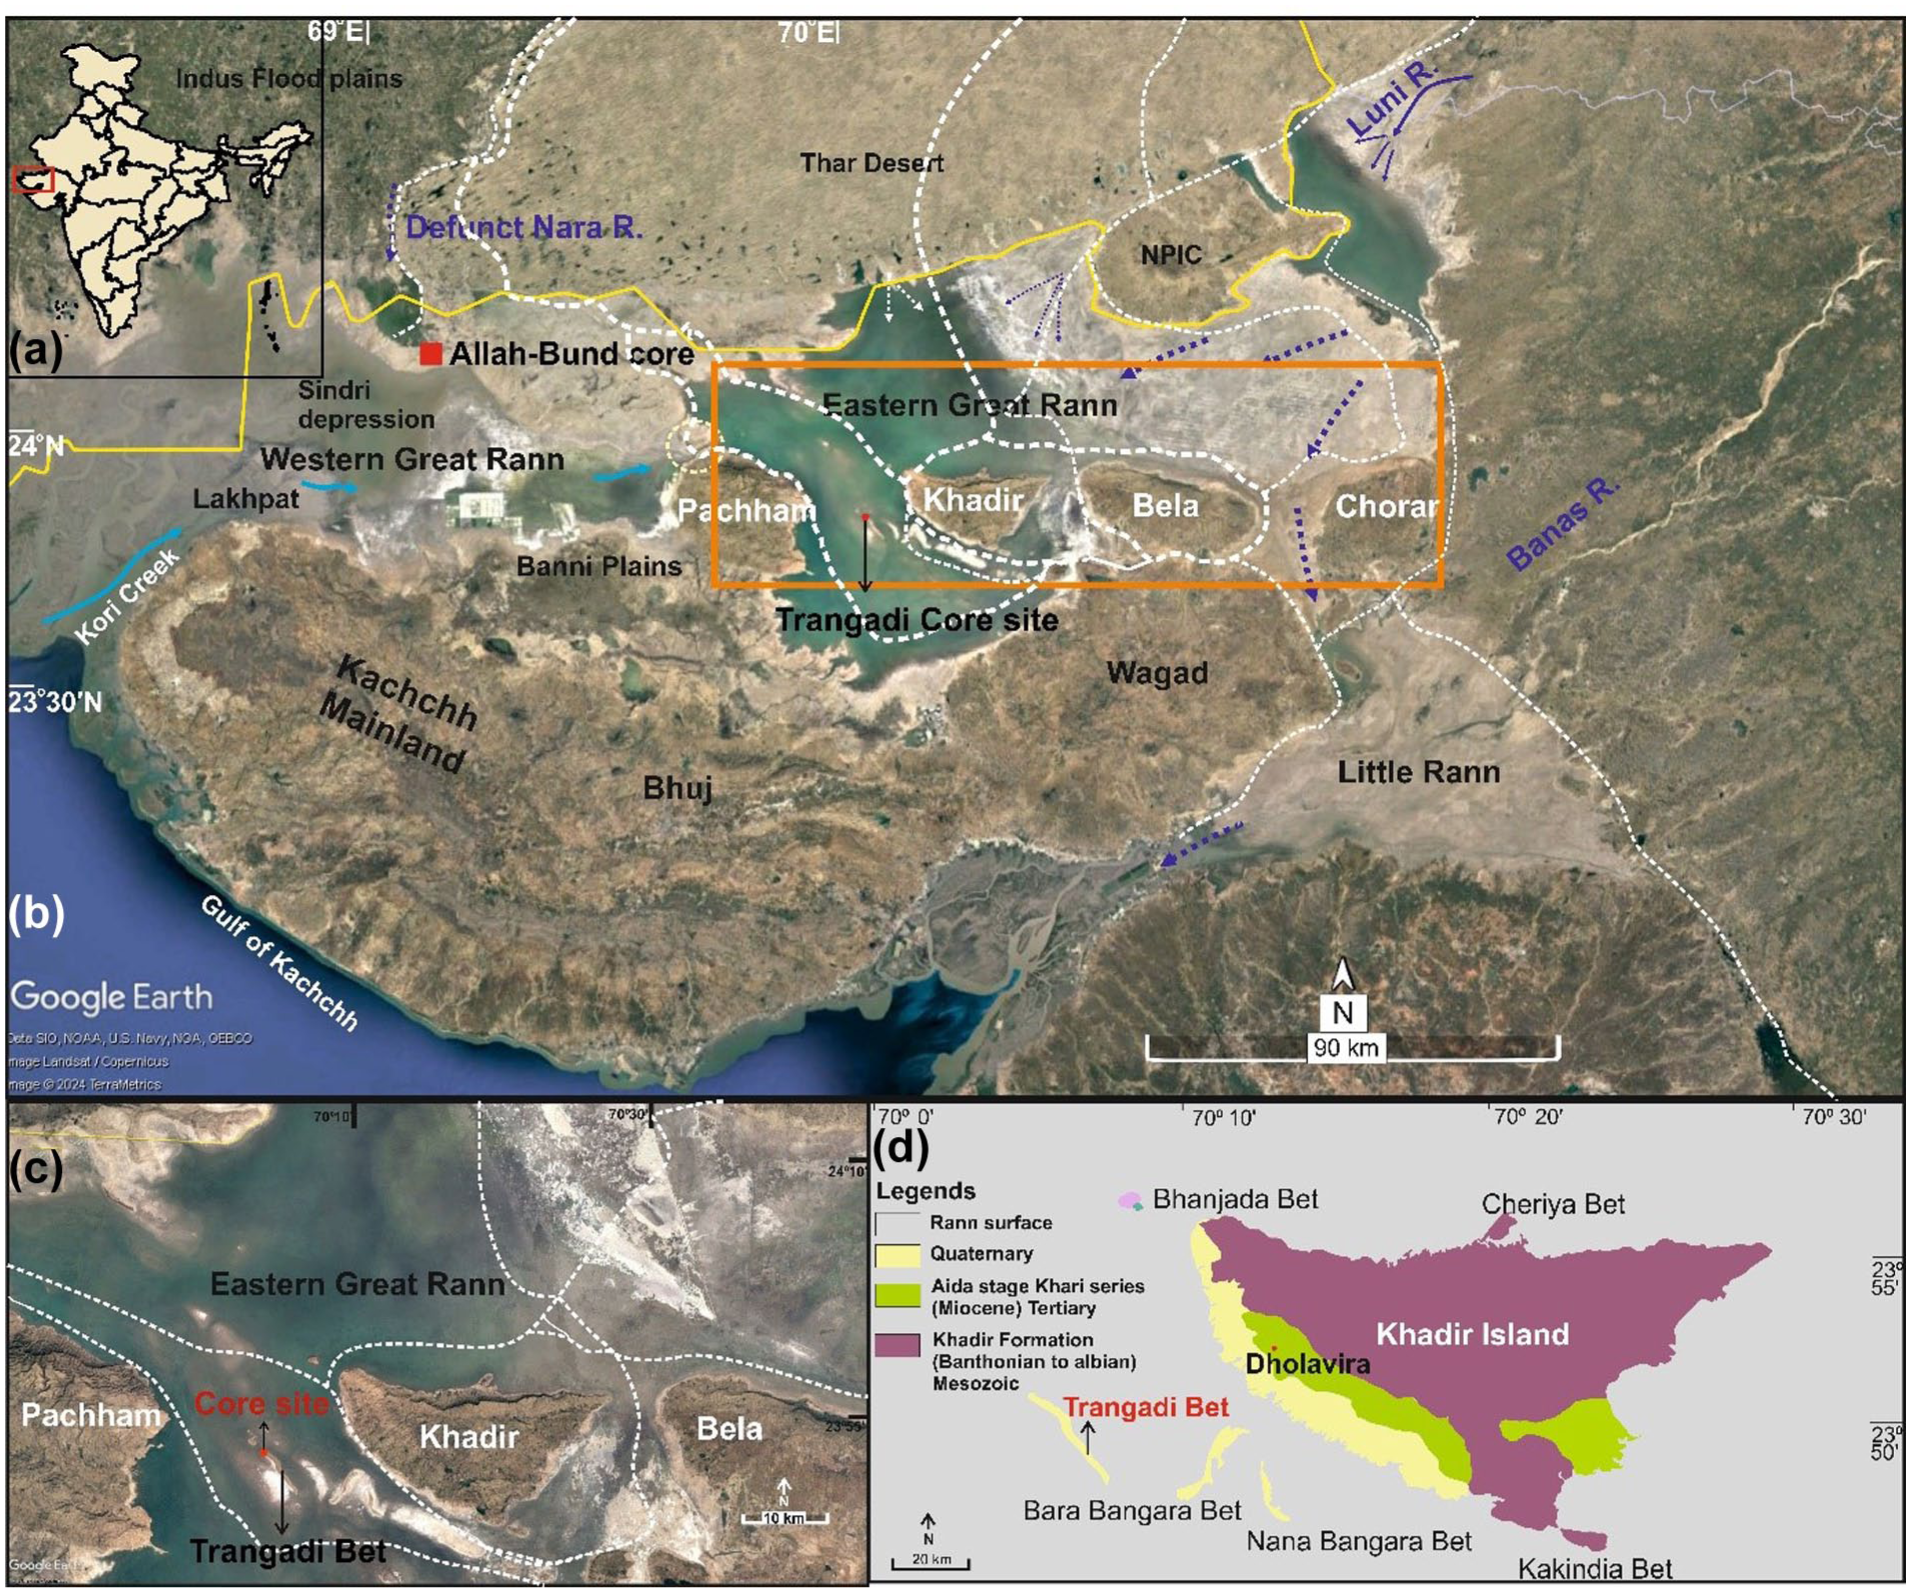
(a) The location of the study area is shown in a red rectangle, and (b) Google Earth imagery shows the Eastern Great Rann of Kachchh (EGRK) marked by an orange rectangle. The geomorphic expression of the Median High, which separates the WGRK from EGRK, is shown by a white circle, which marks the northern limit of present-day tidal surges entering from the Kori Creek terminates (marked by blue solid arrows). The violet and white dashed arrows show the direction of the flow of the monsoon streams. White dashed lines are the paleochannels (modified after Ngangom et al., 2017). (c) The closeup of the western part of the EGRK, along with the location of the Trangadi Bet sediment core. (d) Geological map of the EGRK (modified after Biswas and Deshpande, 1970).
In the Kachchh peninsula, around 19 IVC sites so far identified are in areas where no major river exists, including the famous Dholavira Harapan site located on Khadir Island. Unlike the WGRK, where a major perennial Nara River sustained the growth of early Iron Age to medieval civilization (Sarkar et al., 2020; Tyagi et al., 2012), no such major river is reported from the EGRK, particularly in the vicinity of the IVC sites. Although, satellite remote sensing studies have shown the relics of the fluvial channels during prehistoric times (Deo et al., 2011; Rajani and Rajawat, 2011). More recently, the presence of finning upward sequences toward the western fringe of Khadir Island indicates the presence of localized fluvial activity during the Mid- to Late-Holocene (Ngangom et al., 2017). This is intriguing considering the fact that riverine and trade-oriented Bronze Age IVC was believed to have flourished during 4.6–3.9 ka (Kenoyer, 2008; Possehl, 2002), and their decline was implicated in the drying up of the major river channels.
The Bølling-Allerød (B-A) interstadial marked the first major regionally significant warm period, characterized by a rapid rise in temperatures preceding the Holocene Climatic Optimum. In the Indian context, this period witnessed a post-glacial strengthening of the Indian Summer Monsoon (ISM) with a brief weakening centered around the Younger Dryas (YD) cooling event (Dutt et al., 2015; Gupta et al., 2013). It was observed that during the B-A interstadial till the early Holocene, a strengthened fluvial system existed, which is manifested by the regional floodplain aggradation and pedogenesis (Wolf et al., 2014). However, after the early Holocene (11–9 ka), the ISM became unstable and hence fluctuated significantly (Dutt et al., 2015; Gupta et al., 2013) and was manifested in the pattern of fluvial aggradation in western India (Juyal et al., 2006 and references therein). Considering the geomorphological, sedimentological, climatic, and geoarchaeological significance of the EGRK, the objectives of the present study are (i) to ascertain the influence of the ISM in the pattern of sedimentation in the EGRK since the Bølling-Allerød interstadial and (ii) to assess the temporal changes in the land-sea configuration with the emphasis on the presence of the IVC.
Study area
The study area called Trangadi Bet (N 23°49ʹ00ʺ and E 70°07ʹ00ʺ) is a NW–SE trending, approximately 7 km long and half a kilometer wide linear sandy ridge located ~3 m above the Rann surface. Toward the northeast of Trangadi Bet lies the Mesozoic and Tertiary sedimentary rocks dominated Khadir Island and toward the north lies a volcanic plug called the Bhanjada Bet (Biswas, 1987; Ngangom et al., 2017; Figure 1). Besides this, discontinuous crudely laminated alluvial patches are preserved toward the western fringe of Khadir Island and east of Bhanjada Bet (Ngangom et al., 2017).
Methodology
A 35 m long sediment core was raised at Trangadi Bet in a high-quality PVC pipe and was stored in sub-zero temperatures in the core laboratory of the Department of Earth and Environmental Science, KSKV Kachchh University, Bhuj-Gujarat. The sediment core was split open and examined for physical parameters like sedimentary structures, texture, and color variations. For multiproxy analyses, the sampling was carried out at 20 cm intervals.
Accelerated mass spectrometer (AMS) radiocarbon dating
Five AMS radiocarbon ages were obtained on the bulk organic matter and shell fragments collected at different depths (Figure 2). The sediment samples were powdered, oven-dried, homogenized, and treated with 1N Hydrochloric acid (HCl) at 80°C to remove inorganic carbon (carbonates). The decarbonated samples were packed in tin foil and placed into the autosampler of the Elementar Vario MICRO cube elemental analyzer. The CO2 produced by the combustion of the sample in the presence of oxygen in the elemental analyzer is inserted into an automated graphitization equipment (AGE). The sample CO2 underwent a graphitization procedure in the presence of iron as a catalyst and hydrogen at 650°C (Nemec et al., 2010 ; Wacker et al., 2010). The graphite is then pressed into aluminum target holders with a copper pin and analyzed for 14C in an Accelerator Mass Spectrometer in the Accelerator Unit for Radioisotope Studies (AURiS) at the Physical Research Laboratory, Ahmedabad. The ages obtained were calibrated using calib 8.2 and converted to calendar years using Intcal20 calibration (Reimer et al., 2020), while the age of the shell was calibrated using Marine20 (Heaton et al., 2020) calibration curve with a reservoir age correction ΔR = 64 ± 39 (Bhatnagar et al., 2024; Dutta et al., 2001; Southon et al., 2002; von Rad et al., 1999).
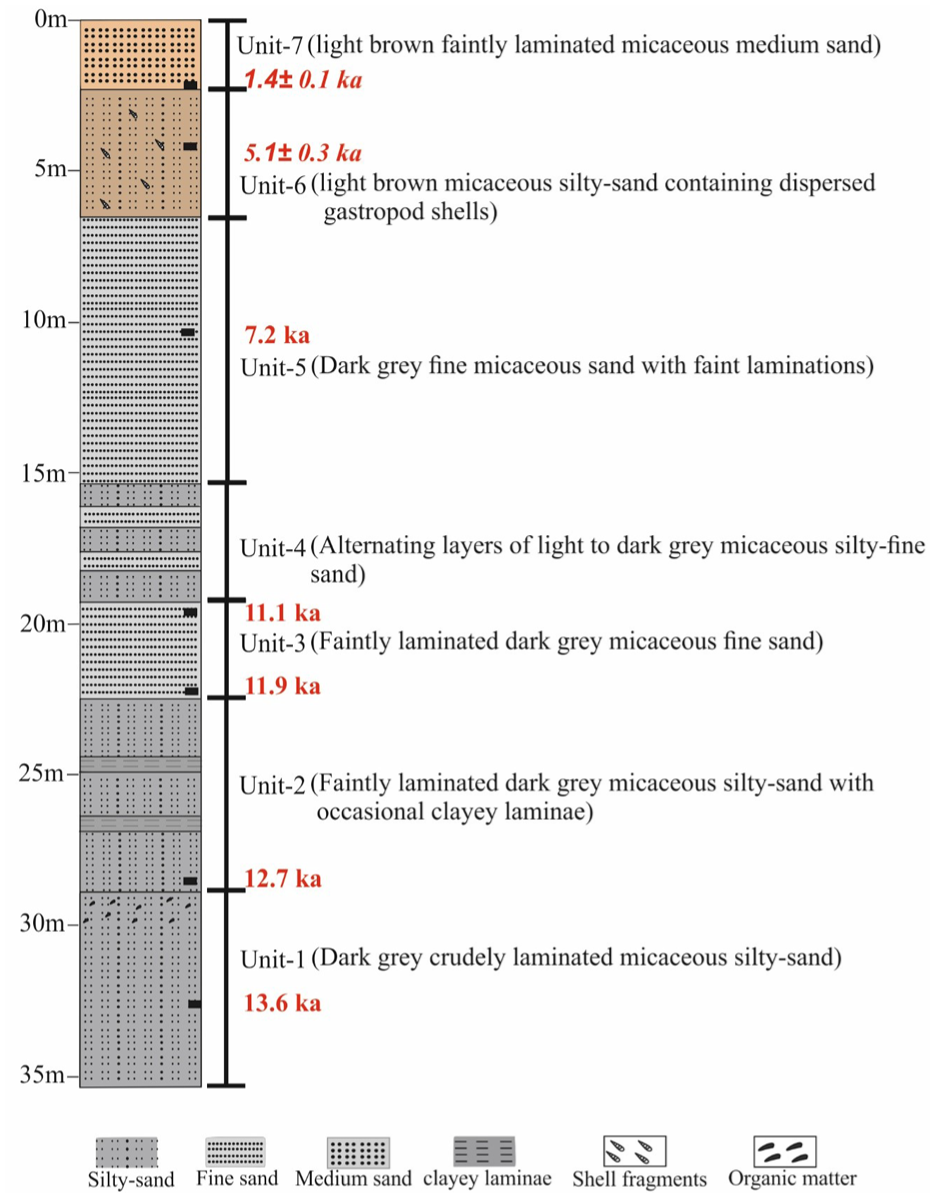
Lithostratigraphy and chronology of the Trangadi Bet sediment core. Based on sediment characteristics and grain size, the 35.3 m sediment core is divided into seven units. Chronology is based on the five AMS radiocarbon ages obtained on bulk organic matter and shell fragments. The uppermost ages (in italics) are taken from Ngangom et al. (2017).
Elemental analysis
For major elements, 39 samples were analyzed, whereas 41 samples were analyzed for trace elements. Around 2 g of the decarbonated sample was mixed with 0.5 g of wax binder to obtain a homogeneous mixture. The mixture was then transferred to 37 mm standard aluminum cups and subjected to a pressure of 150 kN for 2 min using hydraulic pressure. The pressed pellets were then run in the XRF machine. The analysis was done using the powder-pressed X-ray fluorescence (XRF) spectrometry (Axios, from Panalytical Limited) at the Physical Research Laboratory, Ahmedabad. The analytical precision at 2σ for major oxides and trace elements is better than 5% (Shukla, 2011).
Statistical treatment of geochemical data
Multivariate analysis of variance (MANOVA) and analysis of variances (ANOVA)
Multivariate statistical analysis (using the Python statsmodels package) of the major oxides along with the elemental ratios of the sediment helps in identifying the sediment provenance (lithology) and weathering pattern (Drew et al., 2010). The MANOVA was employed on 10 major oxides that were used as the dependent variables, while the identified phases served as the independent factor. The phases were defined based on depth measurements using a predetermined criterion, and the significance level was set at α = 0.05 (95% confidence interval). Additionally, one-way Analysis of Variances (ANOVAs) were conducted for each proxy to identify their significance across the discerned phases.
Source provenance estimation using Bayesian approach
Mixing models with two, three, and four end-members were fitted by exploring all possible fractional combinations of the probable sources that might have contributed to Trangadi Bet sedimentation (e.g. Indus Delta/Flood Plains/Shelf, Thar Desert Bakhasar, and Khadir Island). The observed 87Sr/86Sr and εNd data were assumed to be normally distributed. For a selected set of sources, the log-likelihoods were evaluated for each possible fractional combination of the sources, with an assumption that all such combinations were equally likely. The posterior probability distribution of the fractions for a given set of sources then becomes equivalent to the normalized log-likelihood distribution. The combination with the highest posterior probability – the Maximum A Posteriori (MAP) estimate – was the most likely combination for that set of selected sources. Furthermore, we assessed the plausibility of each candidate source combination using an evidence score obtained by integrating the posterior probability distribution within a 95% confidence interval around the MAP estimate. A higher evidence score indicated that the candidate sources yield predictions more consistent with the observed geochemical data.
Total Organic carbon (TOC)
Nearly 10–20 mg of 46 decarbonated samples were packed in tin foils and placed in a combustion tube through an autosampler of FISONS NA1500 NC Elemental Analyzer. Calibration was achieved through a three-point calibration sequence utilizing a low organic soil standard (LOSS) with known carbon (1.65%) and nitrogen (0.14%) and DEER River Black Shale standard, which has 2.53% C and 0.12% N as a reference material. Analytical precision of carbon was 4% and 6% for nitrogen, ensuring the reliability of the TOC data obtained (Bhushan et al., 2001).
Radiogenic isotopes (Sr & Nd)
The isotopic measurements were performed on decarbonated silicate fractions. The sediments were combusted at 650°C to oxidize organic matter. The decarbonated and organic matter-free sediment samples were then dissolved using the conventional HF-HNO3-HCl silicate dissolving technique. Sr separation was done by conventional cation exchange column chemistry, and Nd was separated from other REEs using Ln-specific resin from Eichrom with dilute HCl as elutant (Shukla, 2011). 87Sr/86Sr and 143Nd/144Nd were measured using Neptune/Neptune Plus from ThermoFisher Scientific, Multi Collector Inductively Coupled Plasma Mass Spectrometry (MC-ICP-MS) at Physical Research Laboratory, Ahmedabad.
Mass fractionation corrections for Sr and Nd were done by normalizing 86Sr/88Sr to 0.1194 and 146Nd/144Nd to 0.7219. The Nd isotopic data is expressed in terms of standard εNd notation, where εNd = [(143Nd/144Nd)/(143Nd/144Nd) CHUR-1] × 104 where 143Nd/144Nd is the measured Nd isotopic composition of the sample and 143Nd/144NdCHUR is the present-day 143Nd/144Nd value of CHUR (Chondritic Uniform Reservoir) which is 0.512638 (Jacobsen and Wasserburg, 1980). 87Sr/86Sr and 143Nd/144Nd for BHVO-2 measured gave values of 0.70346 ± 0.00003 and 0.512967 ± 0.000008 (n = 15) respectively, which are consistent with the reported values of 0.70344 ± 0.00003 and 0.51296 ± 0.00010 within 2σ (Raczek et al., 2001).
Results
Core stratigraphy
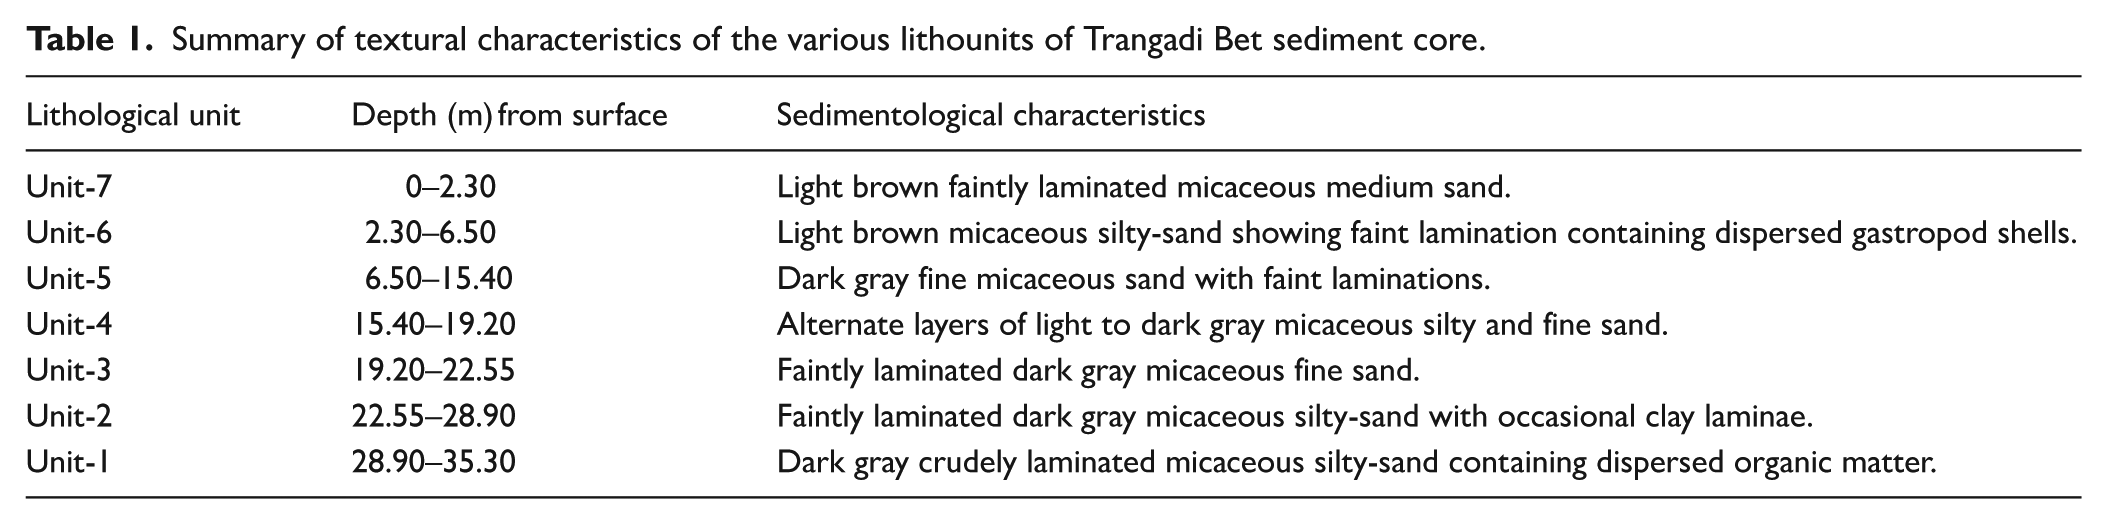
Visual observations of the split core sediment show fining upward, well-sorted, and finely textured characteristics. This allows us to discern seven litho-units detailed in Table 1 and Figure 2.
Summary of textural characteristics of the various lithounits of Trangadi Bet sediment core.
AMS radiocarbon ages and chronology
A total of five AMS radiocarbon dates were obtained from the Trangadi Bet sediment core, spanning depths from 10.3 to 32.8 m (Table 2). The shallowest date, obtained from shell fragments at a depth of 10.3 m, yielded a radiocarbon age of 6920 ± 25 years BP, with a calibrated 2-sigma age range of 6984–7332 cal years BP and a median calibrated age of 7174 cal years BP. Organic-rich sediment samples from progressively deeper intervals provided a consistent chronological framework. At 19.5 m depth, the calibrated age range was 10,812–11,229 cal years BP (median: 11,137 cal years BP). A deeper sample at 22.2 m yielded a calibrated range of 11,652–11,997 cal years BP with a median age of 11,864 cal years BP. Another sample collected at 28.6 m, dated to 12,700–12,815 cal years BP (median: 12,741 cal years BP). The bottommost sample at 32.8 m gave a calibrated age range of 13,187–14,052 cal years BP, with a median age of 13,621 cal years BP. These dates indicate that the sedimentary succession at Trangadi Bet preserves a near-continuous depositional record spanning from the late Pleistocene through the Mid-Holocene. The upper two OSL ages for Unit-6 at a depth of ~4 m and Unit-7 at a depth of ~2 m are the published ages from the equivalent units from the alluvium succession preserved along the northwestern fringe of Khadir Island (Ngangom et al., 2017; Table 2).
Showing 14C AMS radiocarbon ages obtained at various depths from Trangadi Bet sediment core.
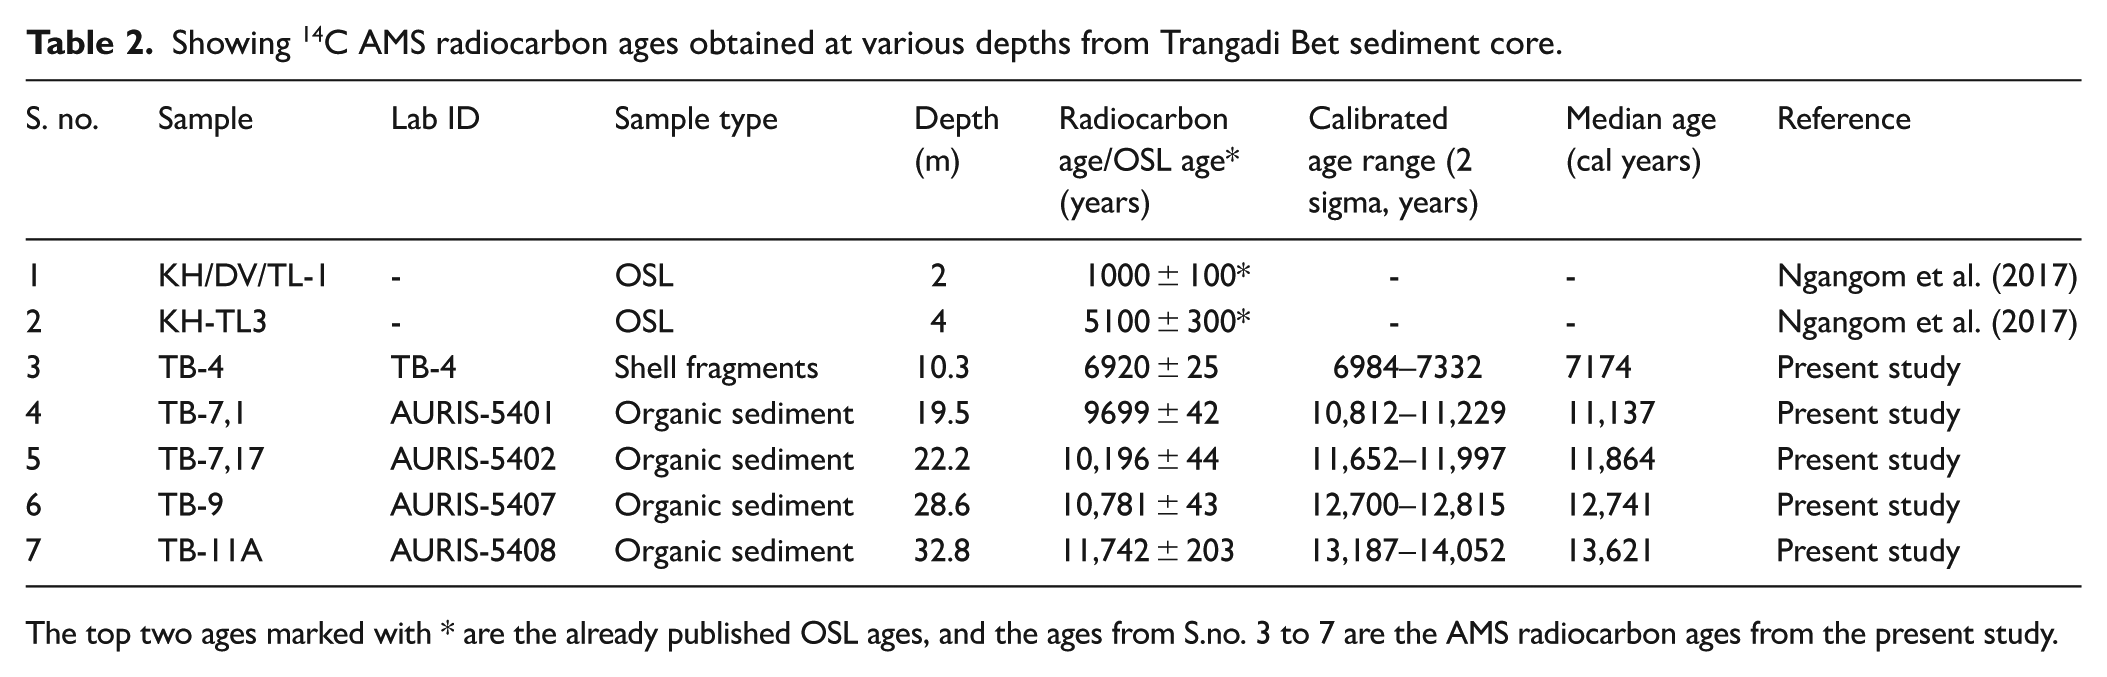
The top two ages marked with * are the already published OSL ages, and the ages from S.no. 3 to 7 are the AMS radiocarbon ages from the present study.
Geochemistry and Total organic carbon
Major element concentration variability is employed for reconstructing hydrological changes and temporal changes in the sediment transport pathways with the onset of the B-A interstadial (Engstrom and Wright, 1984; Lisitzin, 1996; Peterson et al., 2000). The major and trace elemental ratios were used instead of absolute concentration because the former is unaffected by the sedimentation rates, enhancing resistance to potential artifacts and better reflecting erosion and weathering intensities. The Chemical Index of Alteration (CIA) is generally employed to infer the weathering in the river catchment (Chen et al., 1999; Nesbitt and Young, 1982) and is calculated using the molecular proportion of major element oxides. As shown below, CaO* denotes the contribution from silicates; therefore, a carbonate-free fraction of samples was used for the measurement.

Furthermore, the Rb/Sr ratio is used along with CIA as it indicates relative changes in chemical weathering (Bhushan et al., 2018; Chen et al., 1999).
Total organic carbon (TOC) in a fluvial setting (notably the floodplain setting) is used as a biomass productivity proxy associated with the extent of ambient climatic conditions (increased precipitation; Beuning et al., 1997; Talbot and Livingstone, 1989). TOC varies from 0.15% to 0.57%.
Thus, the pattern of down core variability in sedimentation, major and trace elements, and TOC allowed us to identify four broad phases (Figure 3). The consistently significant p-values (p < 0.05) for all MANOVA tests also suggest that the major oxides differ appreciably among the identified phases (Supplemental Table 1, available online). These phases are further validated by the univariate ANOVAs performed for the selected major oxides, elements, and TOC, which display statistically significant differences in the geochemical proxies during the four major phases (Supplemental Table 2, available online) which are discussed below.
Phase-I (depth 35.3–23 m): This phase is dated to 13.6 ka and 12.7 ka and comprises unit-1 and 2 (Figure 2). Texturally, this phase is marked by the presence of micaceous silty-sand along with a few clay laminae in the upper unit. The detrital proxies (Mg/Al, K/Al), the weathering proxies (CIA and Rb/Sr), and the TOC show an increasing trend with fluctuations. Correspondingly, the geochemical proxy indicative of dry conditions (Si/Al and Ca/Al) shows an overall decreasing trend (Figure 3). Broadly, Phase-I represents a relatively wetter condition (improved hydrology).
Phase-II (depth 23–19 m): This phase is bracketed between 11.9 ka and 11.1 ka (unit-3) and is dominated by micaceous fine sand (Figure 2). The detrital proxies (Mg/Al, K/Al, CIA, and Rb/Sr) along with the TOC show an appreciable decrease whereas marginal increase in Si/Al and Ca/Al ratios indicate relative increase in aridity (Figure 3). Climatically, it can be suggested that Phase-II was relatively dry (weakened hydrological condition).
Phase-III (depth 19–5 m): This phase is dated around 11 ka and >5 ka (unit-4 and 5 and part of unit-6). Texturally, the sediments are dominated by micaceous silty-sand (Figure 2). The detrital proxies (Mg/Al, K/Al) and TOC show marginal increments with fluctuations. The weathering proxies (CIA and Rb/Sr) also indicate an overall increase with fluctuations, whereas the Si/Al and Ca/ Al ratios show a decreasing trend (Figure 3). Thus, the Phase-III can be interpreted as an overall strengthening in hydrological conditions.
Phase-IV (depth 5–0 m): This phase comprises part of unit-6 and unit-7. Texturally, it is dominated by micaceous silty-sand; however, toward the upper 2 m of the core, micaceous medium sand dominates (Figure 2). Overall geochemical proxies (Mg/Al, K/Al, CIA, Rb/Sr) show a decreasing trend with fluctuations. The TOC also decreases in this phase, whereas the Si/Al and Ca/Al show an increasing trend (Figure 3). Thus, it can be suggested that Phase-IV indicates a prevalence of dry conditions.
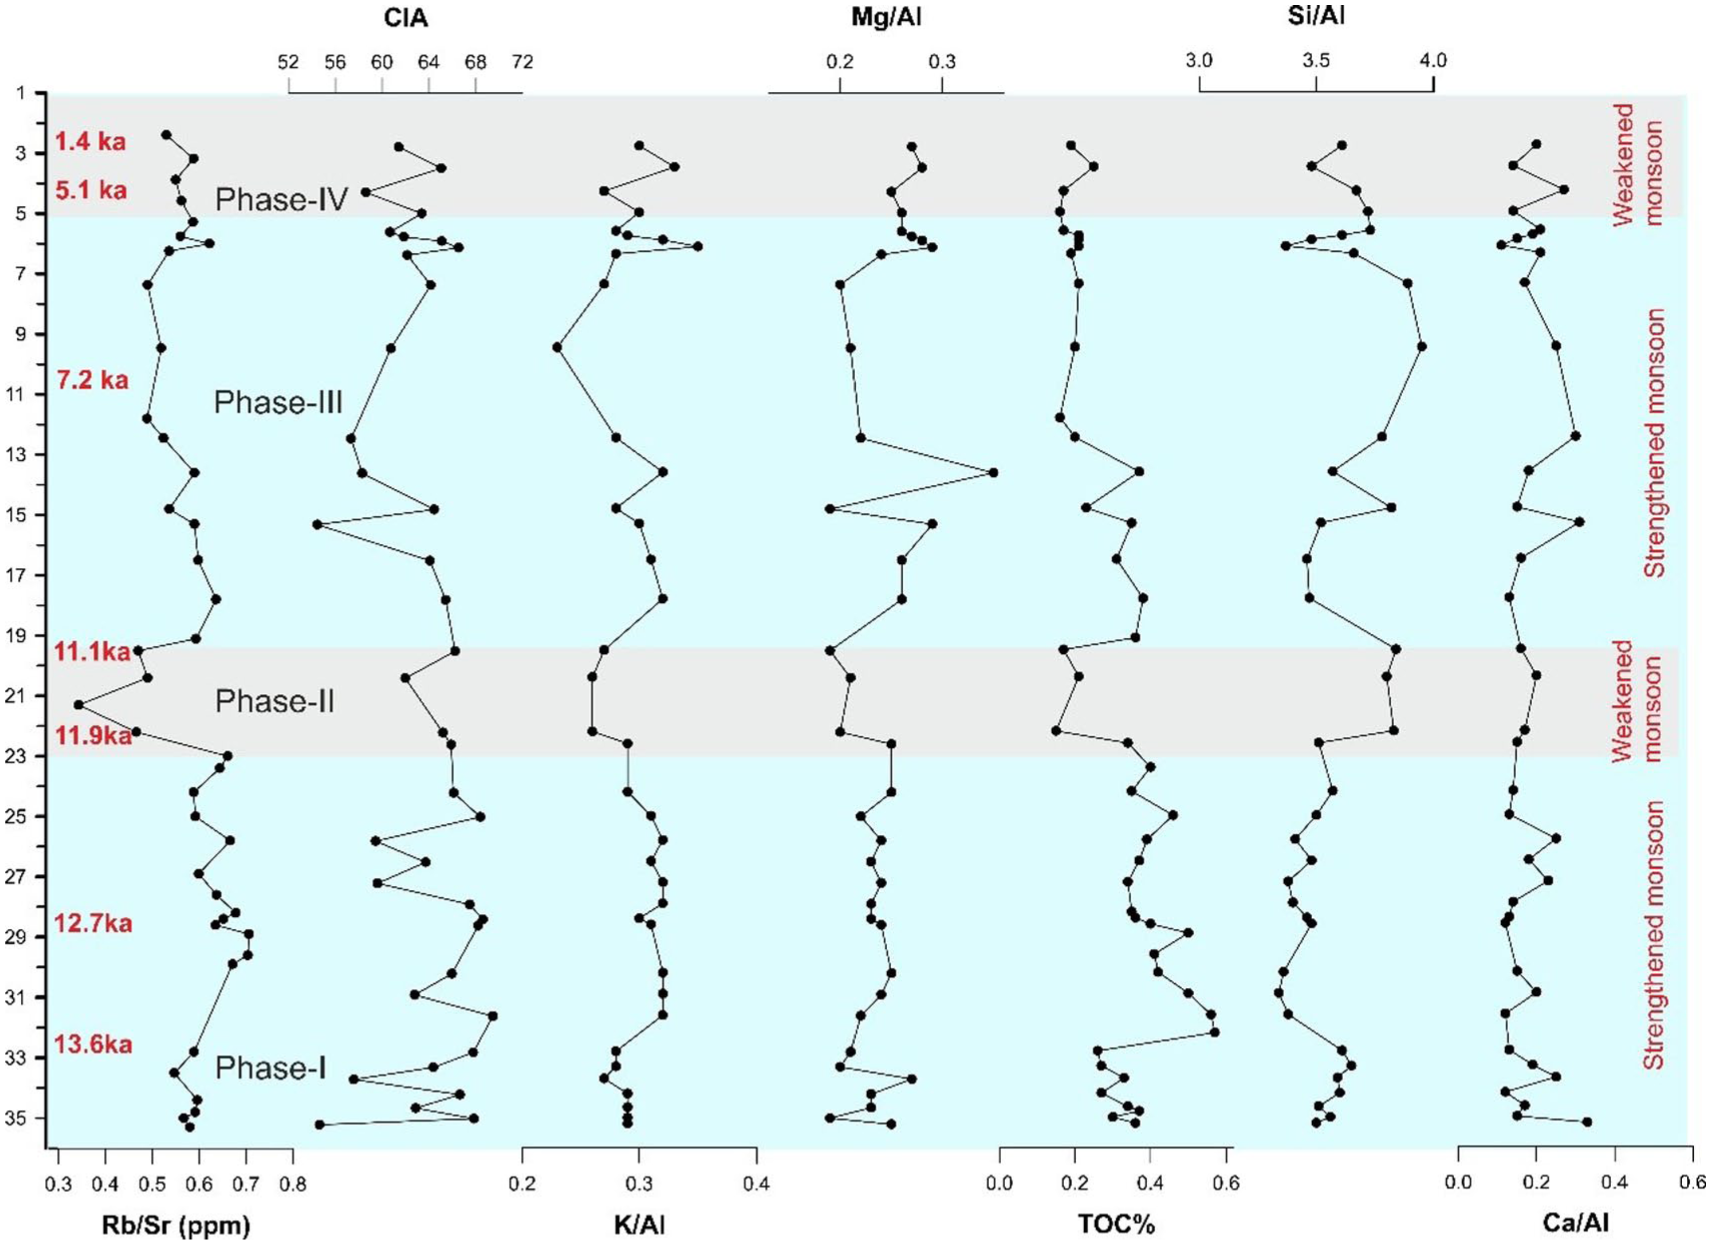
The chronologically constrained down core variations of the geochemical proxies and TOC. Based on the changes in elemental ratios and TOC, four broad climatic phases (supported by MANOVA and ANOVA) representing variable hydrological conditions since the Bølling-Allerød interstadial are discerned.
Further, these oxides were systematically mapped onto a triangular diagram, with Al2O3, CaO*, and Na2O forming the apex (as per Nesbitt and Young, 1982, 1984, Figure 4) to assess the extent of post-deposition weathering and, importantly, to identify the sediment source (provenance). It is noteworthy that the weathering process induces a selective depletion of mobile elements (specifically CaO and Na2O). The average sediment samples from the Trangadi sediment core are plotted in the zone of incipient (initial stages of weathering) to intermediate weathering (Figure 4). The weathering trend aligns parallel to the Al2O3-CaO* + Na2O axis, which can be ascribed to the heightened mobility of Na and Ca during the weathering process in contrast to the comparatively less mobile Al. We observed a notable degree of overlap with some variability of the Trangadi sediment core data with that of the Indus Delta sediment data obtained by Clift et al. (2010; Figure 4).
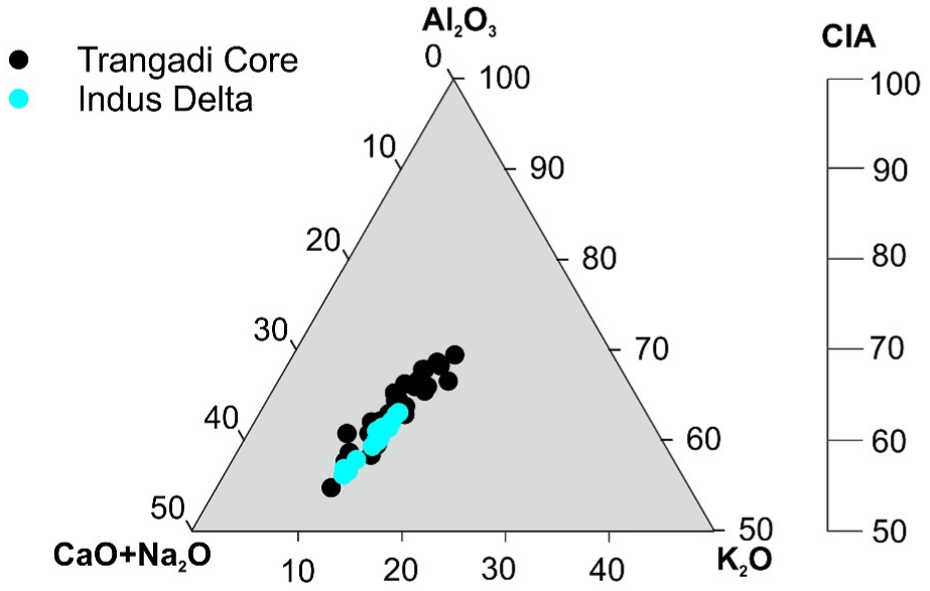
A–CN–K ternary plot (Nesbitt and Young, 1982) showing the major element composition of Trangadi Bet sediment core (black circle) plotted along with the Indus sediments data obtained by Clift et al. (2010) shown by blue circle. As can be seen, the weathering trend of the Trangadi Bet sediment core broadly follows the weathering trend of the Indus sediments.
Sr-Nd isotopes
As discussed earlier, the EGRK is located between three major geomorphic landforms: the Indus flood plain in the west, Thar dune fields in the northwest, and the Aravalli upland drained by the Luni River in the east (Figure 1). Therefore, it is reasonable to assume that these geomorphic landforms were the likely contributors of the sediment in the EGRK since the Bølling-Allerød interstadial including the Trangadi Bet. To ascertain the temporal changes (if any) in the sedimentation, we used the conservative Sr-Nd isotopic systematics which is being successfully employed in the Great Rann sediments (Bhatnagar et al., 2024; Chatterjee and Ray, 2017; Khonde et al., 2017). The use of Sr-Nd as a tracer relies on the premise that the lithologically different sediment sources possess distinctive Sr-Nd isotopic compositions, which remain unchanged during weathering and transport processes (Goldstein et al., 1984; Lupker et al., 2012; Najman and Garzanti, 2000). For example, Sr-Nd as a sediment tracer in the Indus Delta sediments shows climatically modulated post-glacial to early Holocene changes in the sediment provenance, switching the dominance from the Karakoram (Indus) in the northwest to the western Himalayan rivers in the southeast (Clift et al., 2008, 2010). A recent study from the relict Nara River sediment core (WGRK) depicted a change in the sediment provenance from the Ghaggar-Hakra-Nara channel since the terminal part of the last glacial maxima (LGM) to the Indus-derived sediments during the early Holocene (Bhatnagar et al., 2024). Similarly, Khonde et al. (2017) suggested the existence of a sub-Himalayan Saraswati-like River contributing sediments into the Rann until the early Holocene.
Table 3 provides the isotopic compositions of 87Sr/86Sr and εNd isotopic data from different geomorphic and geographic locations which are around the present study site. A total of 41 samples were analyzed from the Trangadi Bet sediment core, revealing a range of 87Sr/86Sr between 0.71743 and 0.72187 and εNd varying between −14.1 and −11.7.
87Sr/86Sr and epsilon Nd isotopic composition of the potential sources.
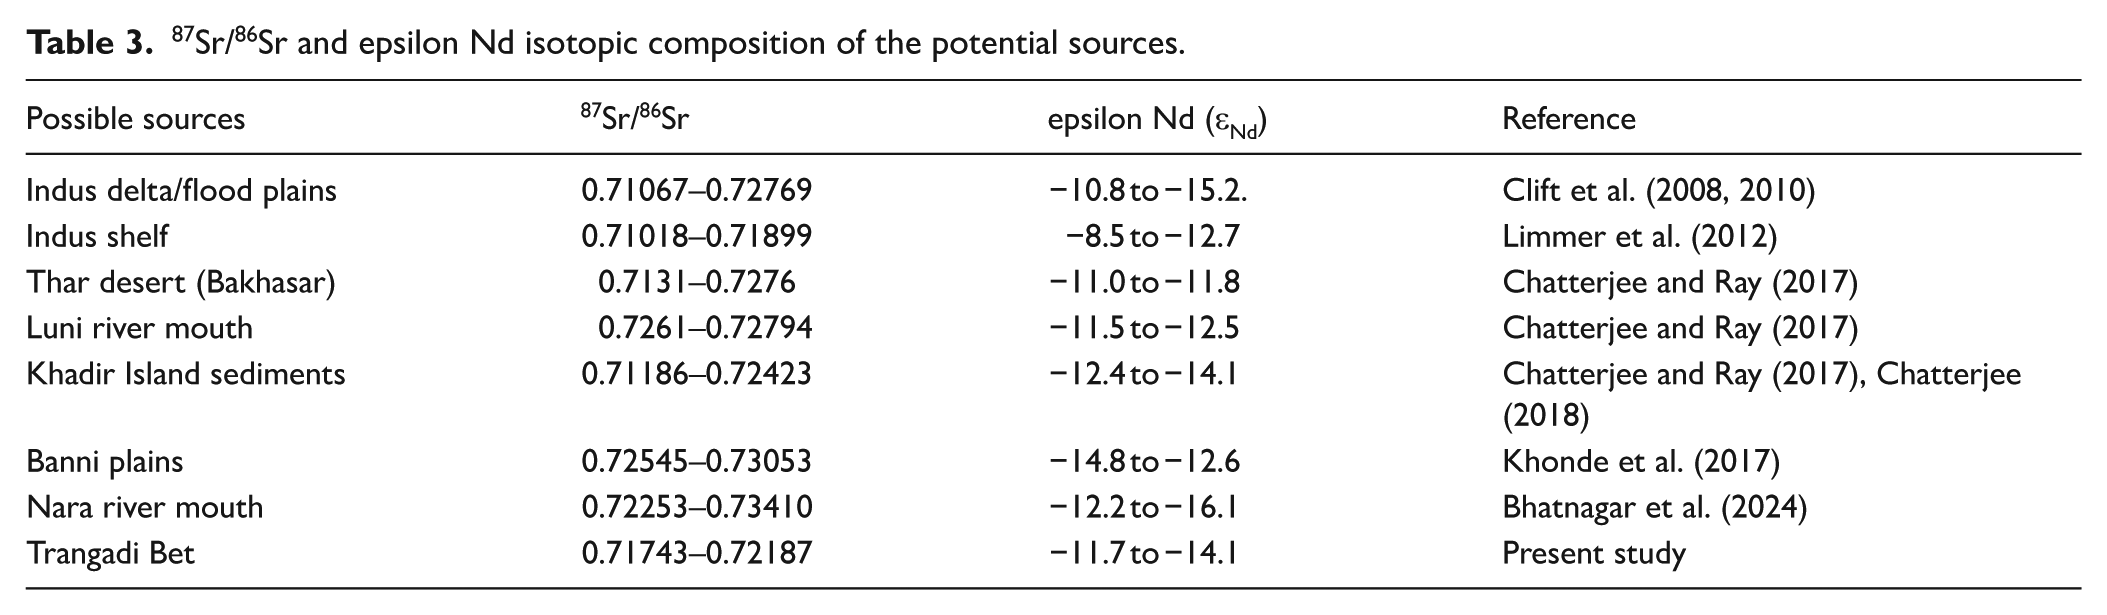
Figure 5 shows the isotopic signatures from the potential sources. Note that Trangadi Bet sediments exhibit less radiogenic Sr than the average WGRK sediments. However, they show a broad correspondence with the Indus delta/floodplain and the sediments deposited along the western margin of Khadir Island. Compared to this, the 87Sr/86Sr values of the Thar dune sediment show relatively wide scatter, whereas the εNd values are tightly clustered (Figure 5).
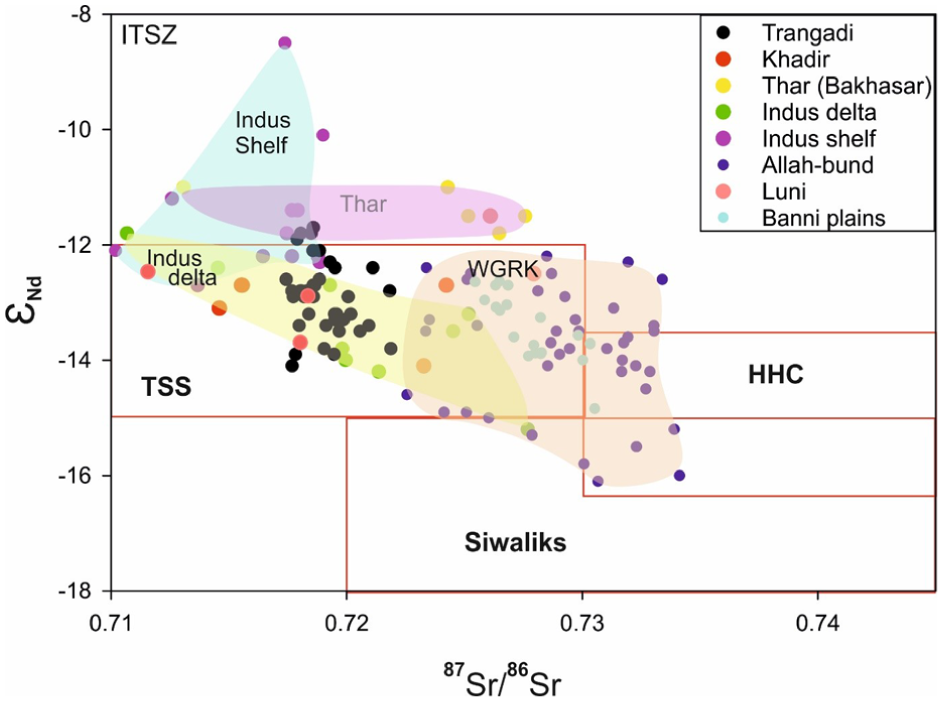
Scatter plot of 87Sr/86Sr and εNd of Trangadi Bet sediment core. For comparison, the Indus Delta sediment (Clift et al., 2008, 2010), Indus Shelf sediment (Limmer et al., 2012), Luni River, Thar Desert and Khadir sediments (Chatterjee and Ray, 2017) are plotted along with WGRK sediments (Bhatnagar et al., 2024) and western Banni plains sediments (Khonde et al., 2017). The end members such as the HHC-High Himalayan Crystalline, TSS-Tibetan Sedimentary Series, Siwaliks, ITSZ-Indus Tsangpo Suture zone are also marked (Singh et al., 2008 and Tripathi et al. (2013)). Note that the isotopic data of the Trangadi Bet sediment core show close affinity with that of the Indus sediment. The shaded area marks the patterned field of potential sources.
The temporal variability of the Sr and Nd isotopic data with depth depicts no major variations in the overall profile except with a minor excursion between 11.1 and 11.9 ka (19–23 m), implying that since the Bølling-Allerød interstadial, the sedimentation was dominated by the Indus with minor contribution (inferred based on more radiogenic Sr with lower εNd values) from the Precambrian Aravalli lithology through Luni River during 11.1 and 11.9 ka (Figure 6). After ~7 ka (7 m from top), there is a minor decrease in radiogenic Sr with moderate fluctuations in εNd.
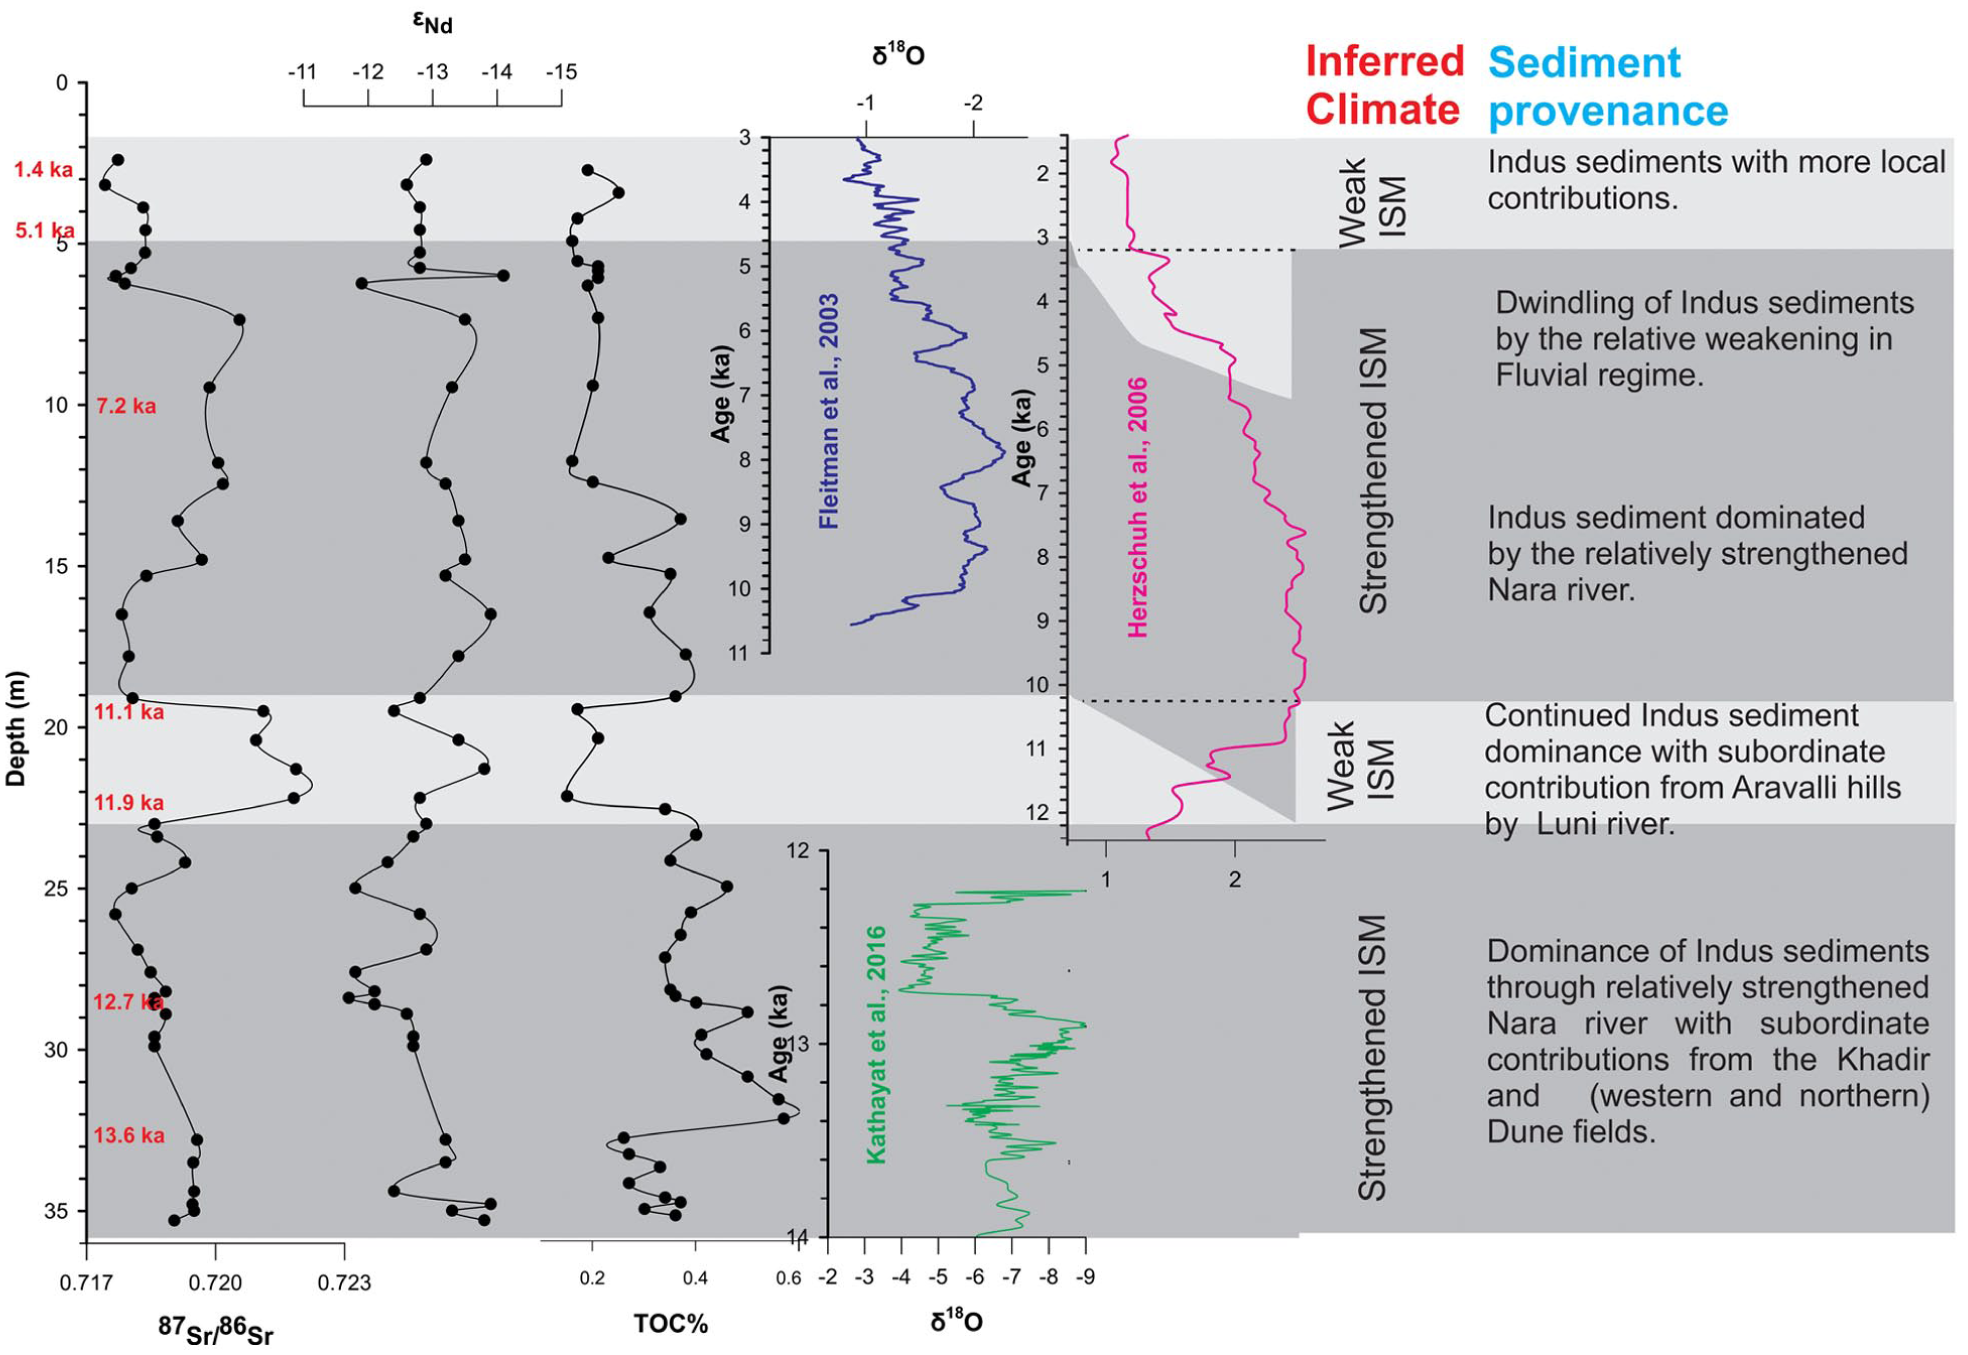
The chronologically constrained temporal changes in the 87Sr/86Sr and εNd in the Trangadi Bet sediment core are plotted along with the TOC (productivity proxy). The four broad phases of monsoon variability and associated sediment contribution to the EGRK are inferred. The dark gray panels mark the strengthened phase of ISM with improved hydrological conditions, and the light gray panel marks the weakened phase of monsoons, which show a decline in hydrological conditions. There is the domination of sediments from the Indus with subordinate contributions from the local sources (Khadir) and northern dune field since Bølling-Allerød interstadial till the Mid-Holocene. The pattern of variability broadly accords well with the regional climatic data (Fleitmann et al., 2003; Herzschuh, 2006 and Kathayat et al. (2016) representing Indian summer monsoon variability (ISM) since Bølling-Allerød interstadial till the Late-Holocene.
When plotted against the Dhordo core data (Khonde et al., 2017) and the Allah Bund sediment core data (Bhatnagar et al., 2024), the Sr values of the Trangadi bet sediment core are less radiogenic (Supplemental Figure 1, available online). This could be attributed to: (i) chemical weathering, because the Rb-bearing minerals in the source rocks, such as muscovite and K-feldspar, undergo decomposition into clay minerals. As a result, the finer sediment fractions produced exhibit higher 87Sr/86Sr ratios compared to the coarser fractions (Garcon et al., 2014 and the sediments here are mostly silty-sand dominated, (ii) contribution of local Mesozoic sandstones from Khadir Island that have lower values of radiogenic Sr (87Sr/86Sr 0.71–0.74, εNd −17.7 to −23.5) and volcanic rocks of Bhanjada island that also exhibit lower values of radiogenic Sr and positive values of εNd (87Sr/86Sr 0.71–0.73, εNd 0.8 to 2.6; Chatterjee (2018 and references therein), and (iii) mixing of older sediments probably through Thar (Bakhasar) that show larger spread in their 87Sr/86Sr signature (0.71– 0.73). Reworking and mixing of these sediments, likely through ephemeral fluvial channels or localized aeolian processes, could also contribute to the observed isotopic discrepancies. At this stage, we tend to suggest that the likely possibility could be the contributions from local lithology (Mesozoic Khadir lithology) with subordinate contributions from older Thar desert sediments.
Discussion
ISM variability since Bølling-Allerød interstadial
Quantitative analysis of major elements such as Al, Ca, Mg, Fe, and K in the flood plain sediments are found to be useful tracers to discern the temporal changes in the hydrological condition (Zou et al., 2021). Their concentration variability is a function of catchment erosion and transpiration caused by the changes in past hydrological conditions (Wünnemann et al., 2010). The periods of enhanced precipitation facilitate the mobilization of terrigenous sediment, thus resulting in an increase in their concentrations during periods of enhanced precipitation (Anoop et al., 2013a; Pillai et al., 2018). Therefore, the downcore variability of the major and trace elements and their ratios can be used to reconstruct the pattern of past hydrological changes (e.g. Bhushan et al., 2018; Khonde, 2014; Tyagi et al., 2012). Similarly, the K/Al and Mg/Al are used as detrital proxies to reconstruct the temporal changes in the fluvial supply of terrigenous material, while Si/Al and Ca/Al ratios are employed to infer the phases of dryness/aeolian input (Calvert and Pedersen, 2007; Govin et al., 2012; Martinez Ruiz et al., 2015; Rodrigo-Gámiz et al., 2011). An increase in ratios such as K/Al and Mg/Al is often correlated with warm and humid climatic conditions (Pattan et al., 2005), which are conducive to enhanced chemical weathering and sediment transport (Warrier and Shankar, 2009).
Studies indicate that the ISM profoundly impacted the intensity of weathering, sediment erosion, and their transportation during the late Quaternary (Limmer et al., 2012; Prins and Postma, 2000). Sediment records from western India and the Indus Delta reveal that monsoon-regulated erosion of the western Himalayas has significantly enhanced since the Last Glacial Maximum (LGM), particularly since the Bølling-Allerød interstadial (Bhatnagar et al., 2024, 2025; Clift et al., 2010; Kessarkar et al., 2003).
Phase-I (dated to 13.6 ka and 12.7 ka) corresponds to the Bølling-Allerød interstadial and shows an overall increase in the geochemical proxies, suggesting warm and humid climatic conditions. This period in the proximal marine record from the Arabian Sea core is represented by the post-LGM restrengthening of the ISM (Schulz et al., 1998; Sirocko et al., 1996). Whereas in the continental records, for example, the Timta limestone cave in the western Himalayas (Kathayat et al., 2016) and in the northwest Himalayas (Mishra et al., 2015) indicate stronger ISM. Following this, an overall decrease in the geochemical proxies during Phase-II (between 11.9 ka and 11.1 ka) indicates declining hydrological conditions, which broadly coincides with the Younger Dryas (YD) cooling event (Adams et al., 1999; Ali et al., 2018; Alley, 2000; Bond et al., 1993). The alluvial successions in the northern Gujarat alluvial plain revealed the reversal in the ISM intensity during this phase (Kar et al., 2001). Following this (<11 ka and >5 ka; Phase-III), there is an overall increase (with fluctuations) in geochemical proxies, TOC, and a decrease in aeolian proxies (Figure 3) suggesting improved hydrological conditions since early to Mid-Holocene. The climatic record from Lahuradewa Lake (Gangetic plain) shows intensified monsoon conditions during 9.2 to 5.3 ka BP with maximum intensity around 7 ka BP (Saxena et al., 2013). The wet phase of monsoon between 11 ka and 6.2 ka has also been documented from Lonar Lake in Central India based on high-resolution Holocene paleoclimate reconstruction (Prasad et al., 2014). Based on the Sr-Nd isotopic study, Goswami et al. (2012) inferred intensification of ISM around 9 ka from the southeastern Arabian Sea core. Dixit et al. (2014a), observed deepening of the Riwasa lake (eastern Thar) during Early Holocene. The declining trend with fluctuations in the geochemical proxies during the Phase-IV (dated to 5.1 ka and 1.4 ka), suggests an overall weakening of the ISM and encompasses the regionally dried Meghalayan Stage (4.3 ka–4.1 ka; Kathayat et al., 2018). The regional climatic records from western India also suggest the onset of aridity and weak ISM after 5 ka (Bhatnagar et al., 2024; Dixit et al., 2014b; Ngangom et al., 2017). The above climatic phases are adequately supported by the multivariate and univariate statistical analysis (discussed earlier).
Potential fluvial pathways (paleochannel)
The discrete patches of the sandy bets located between Pachham and Khadir Islands show a linear pattern (Figure 1). Although obscured at places by the salt encrustation, these can be laterally traced toward the north-west where they merge with the southern fringe of the Thar dunes (Figure 1). The relict channel in the present study accords well with the paleochannel maps prepared by Bhadra et al. (2009) which show two prominent channels, one flowing NW-SE and another north-south, traversing the depression between Bhanjada and Khadir Islands (figure reproduced after Kar, 2020). In the present study, satellite imagery (source Google) based observations indicate a paleochannel which, when traced north-west connects with the Nara channel. This channel flows obliquely toward the south-eastward proximal to the northern fringe of Pachham Island and flows toward the Trangadi Bet (modified after Kar, 2020, 2021). We hypothesize that this was probably the major channel transporting the Indus River sediment to the Trangadi Bet area (Figure 1). Thus, this points toward the possibility of the existence of north-east and north-south flowing Himalayan streams in the western part of the EGRK which accords well with the geomorphology of the study area indicating the regional slope of the terrain is toward the Trangadi Bet. Hence, it is reasonable to assume that this stream (inferred based on paleochannel trend) occupied a geomorphic depression, whereas the linear sandy bets represent the distal flood plain sequence. Therefore, it can be argued that the Trangadi bet sediments were transported and deposited by the northwest-southeast trending paleochannel with subordinate contribution from the local streams from Khadir Island and southern draining monsoon-fed streams from the southern and western Thar dune fields (Figure 1). However, the westerly flowing Luni River contribution from the Aravalli catchment cannot be ignored as indicated by some of the high radiogenic strontium values (discussed below).
Sediment provenance
The bi-variate plot of εNd and 87Sr/86Sr illustrates the isotopic variability of the Trangadi Bet sediment core in relation to potential source regions (Figure 5). The presence of low radiogenic Sr in the Trangadi Bet sediment core indicates its close correspondence with the Indus sediments. The lesser radiogenic Sr is reported from the Indus delta/shelf (Clift et al., 2010; Limmer et al., 2012) for which the Indus River draining through the western Tibetan Plateau lithology is implicated (Garzanti et al., 2020 and references therein). The Trangadi bet sediment core shows an overlapping isotopic signature with the Indus delta/floodplain, and shelf sediments implying most of the sediments were contributed from the Indus catchment (Figure 5).
Additionally, the isotopic range of Thar sediments also encompasses the values observed in the Trangadi Bet sediment core, indicating appreciable contribution from Thar dunes. However, no major fluvial system directly transports sediments from the Thar Desert into the Great Rann of Kachchh (GRK). Aeolian transport is similarly constrained by the dominant southwest monsoonal winds, which primarily drive sediment away from the GRK (Singhvi and Kar, 2004). While localized sandstorms and ephemeral fluvial reworking may have contributed, their influence is likely secondary. The Khadir alluvial sediments along the western margin also exhibit an overlap in isotopic values with our dataset. This makes them a possible source for the sediment deposition observed in our study area. Additionally, the dominant contribution from Khadir Island may be constrained by the small catchment size of the ephemeral streams draining southward. Nevertheless, isotopic source estimation suggests that Khadir sediments represent the second largest contributor to the sediment pool of Trangadi Bet (discussed below). Although the Luni is a big westerly flowing river that drains into the eastern margin of the EGRK, it seems to be an unlikely significant candidate due to its persistent ephemerality and aeolian activity since the early Holocene (Kar et al., 2001) and can be corroborated by our quantitative source attribution analysis.
To ascertain the sediment provenance, the isotopic geochemical data was subjected to statistical analysis using a two-to-four-end-member mixing model coupled with Bayesian estimation of source likelihoods. This includes the Indus, Khadir Island, Thar Desert, and the Luni River. It has been found that the Indus River was the major contributor (~ 48%), followed by the local reworking of the Mesozoic lithology of Khadir Island (~35%) which was also observed by Ngangom et al. (2017). The northern Thar dune fields contributed around 14% whereas the Precambrian lithology-dominated Luni River contribution was marginal (~3%).
Between 11.1 ka and 11.9 ka, there is an increase in radiogenic Sr and relatively lowered values of εNd (Figure 6), suggesting mixing from more radiogenic sources (probably Luni River sediments). It seems that the contribution from the upper Indus catchment was reduced due to the post-glacial advancement of the valley glaciers during the Younger Dryas cooling event (Sharma and Shukla, 2018). After 11 ka until around 7 ka, there was more contribution from Indus with subordinate contribution from local channels (Figure 7) as the upper Indus catchment glaciers began to recede (Sharma and Shukla, 2018) and the Great Rann witnessed increased monsoon precipitation (Bhatnagar et al., 2024). After 7 ka, as the monsoon begins to decline, the Indus sediments dwindle at the expense of local contributions (Figure 7).
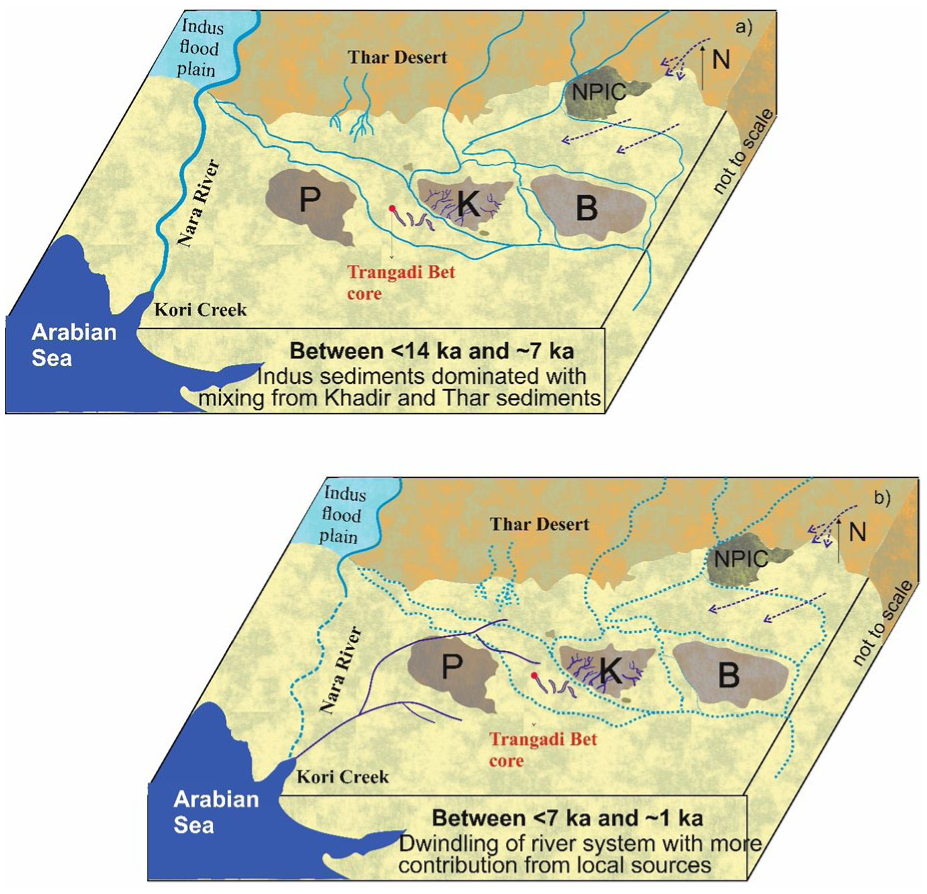
Schematic representation of the evolution of the EGRK with the temporal changes in the sediment provenance since Bølling-Allerød interstadial (a) After around 14 ka, the Indus River was the major contributor of sediment into the EGRK through the branch off northwest-southeast paleochannel of Nara (via Indus) and continued till ~7 ka. (b) After ~7 ka and until around 1 ka, there is a dwindling of this fluvial regime with more contribution through local (Khadir) and Thar sources (Ngangom et al., 2017).
Comparing the Trangadi bet sediment core isotopic data with the WGRK (Allah Bund Sediment core), the WGRK sediments indicate contribution from relatively more radiogenic Sr sources (Supplemental Figure 1, available online). The Allahbund sediment core Sr terminates at around 0.72253, whereas the Trangadi sediment core shows constantly lower 87Sr/86Sr (0.71743) and indicates a close affinity with the Indus delta sediments (Figure 5). The plausible explanation could be, compared to the Allah bund sediment core where the Nara River was the major conduit connected to both the western Himalayan and Indus River (Bhatnagar et al., 2024), there is no major river like Nara at Trangadi Bet, with limited contribution from the branch off SE flowing channels (Figure 1) and the north-south flowing ephemeral streams from Thar desert. The former is likely to receive sediment directly from the Indus River connected via the eastern branch of the Nara River (Figure 1), whereas the latter is dominantly drained through the local ephemeral streams from the Khadir Island and northern and western dune fields (Figure 1), which is known to be sensitive to fluvial reworking (Alizai et al., 2011b; Sam et al., 2015), mobilizing the already existing sediments.
The inferences based on the isotopic fingerprinting of Trangadi bet sediment had affinity with that of the Indus River and is further supported by the Ternary plot of major elements (Figure 4). The Indus sediments plot in the zone of weak weathering while sediments from our core indicate weak to intermediate weathering possibly due to the mixing of sediments from other sources.
Emergence and decline of Bronze Age IVC
The question pertaining to the emergence and the decline of the Bronze Age IVC in the EGRK is still being debated. Was it the high sea level or the existence of a persistent hydrological system (river)? A recent study by Sharma et al. (2021) has shown that there was around 1 m high sea stand during 7 ka and 5 ka (Mid-Holocene), which receded after around 5 ka. Further, there is evidence to indicate that the sea was much lower around the early Iron Age dated to around 3 ka (Sharma et al., 2021; Tyagi et al., 2012). This would imply that when the IVC was occupying the Dholavira archeological site at Khadir Island (EGRK), the sea already regressed. However, the possibility of the presence of an extended arm of the marine ingression proximal to the Dholavira archeological site through creeks, estuaries, and intertidal swampy pools cannot be ruled out. Occurrence of sizeable numbers of Terebralia palustris (gastropod shell) used as a source of food by the Harappans (Lawler, 2011; Sengupta et al., 2020) were recovered from the Dholavira archeological site. These shells thrive on tender mangrove leaves. The mangroves grow in brackish water (creeks/estuaries), and since the Dholavira site is located around 2 m above sea level, it was likely that the sea was at a distance from the Archeological site during their occupation (e.g. Sharma et al., 2021). Further presence of fluvial sediments near the Khadir Island (Dholavira) dated to 5 ka and 1 ka (Ngangom et al., 2017) indicates that the area around Khadir Island and Trangadi bet was under the influence of episodic fluvial activity. The evidence for the existence of freshwater in the vicinity accrues from the highly depleted oxygen isotopic signature obtained on the gastropod shell (Terebralia palustris) by Sengupta et al. (2020). They attributed it to either the presence of ancient Saraswati and/or the Indus distributary in the vicinity of Khadir Island. Thus, it seems during the occupation of IVC, the sea was certainly far away from Khadir Island as also suggested by Sharma et al. (2021). However, the presence of freshwater streams cannot be ruled out.
Conclusions
Based on the sedimentology, geochemistry, and AMS radiocarbon chronology, the present study allows us to draw the following major inferences.
(i). The Trangadi sediment core preserved a nearly continuous record of sedimentation since the Bølling-Allerød interstadial. Employing multi-proxy data, the study discerned four major climatic phases representing alternating strengthened and weakened ISM.
(ii). The sediment isotopic analysis (Sr and Nd) reveals that the Indus River was the major contributor (~48%), followed by the contribution from local reworking of Mesozoic lithology from the Khadir Island (~35%). The northern Thar Dune field contribution by ephemeral streams was around 14% whereas influence of Luni River at Trangadi Bet was insignificant (~3%).
(iii). The dominance of the fluvial regime dwindled after ~7 ka, well before the emergence of the IVC, and was weakened further between 5.5 ka and 3.8 ka. Despite reduced freshwater from the paleochannel (via Indus), the IVC settlements in the EGRK were sustained by monsoon-fed streams and advanced water management systems whereas the creeks or the relict channels provided navigability.
(iv). Our findings also align with the earlier studies suggesting that the emergence and decline of the IVC were not directly tied to the presence or absence of a major perennial fluvial system but to their ability to adapt and utilize available water resources effectively.
Supplemental Material
sj-docx-1-hol-10.1177_09596836251366207 – Supplemental material for Hydrological changes and landform evolution since the Bølling-Allerød interstadial in the Eastern Great Rann of Kachchh, India
Supplemental material, sj-docx-1-hol-10.1177_09596836251366207 for Hydrological changes and landform evolution since the Bølling-Allerød interstadial in the Eastern Great Rann of Kachchh, India by Ayushi Bhatnagar, Anil D Shukla, Mamata Ngangom, Mahesh Thakkar, Gaurav Chauhan, Ravi Bhushan, Shivansh Verma, Ankur Kumar Dhabi and Navin Juyal in The Holocene
Supplemental Material
sj-docx-2-hol-10.1177_09596836251366207 – Supplemental material for Hydrological changes and landform evolution since the Bølling-Allerød interstadial in the Eastern Great Rann of Kachchh, India
Supplemental material, sj-docx-2-hol-10.1177_09596836251366207 for Hydrological changes and landform evolution since the Bølling-Allerød interstadial in the Eastern Great Rann of Kachchh, India by Ayushi Bhatnagar, Anil D Shukla, Mamata Ngangom, Mahesh Thakkar, Gaurav Chauhan, Ravi Bhushan, Shivansh Verma, Ankur Kumar Dhabi and Navin Juyal in The Holocene
Footnotes
Acknowledgements
The present work is part of the Ph.D. thesis of Ms. Ayushi Bhatnagar and acknowledges DST for granting Inspire Fellowship, IF18048. I am also thankful to the Director, Physical Research Laboratory Ahmedabad for his kind support. Authors would also acknowledge the SERB sponsored project (SR/FTP/ES-278 49/2013) given to Dr. Ngangom Mamata Devi, and DST sponsored project (SR/S4/ES-279 TG/02/2008) given to Prof. M.G. Thakkar, for financial support raising the core in GRK in 2012.
Author contributions
Funding
The author(s) disclosed receipt of the following financial support for the research, authorship, and/or publication of this article: Science and Engineering Research Board (SERB) sponsored project (SR/FTP/ES-278 49/2013) given to Dr. Ngangom Mamata Devi, and Department of Science and Technology (DST) of the Government of India (DST) sponsored project (SR/S4/ES-279 TG/02/2008) given to Prof. M.G. Thakkar. DST Inspire Fellowship (IF-18048) awarded to Ayushi Bhatnagar.
Data availability
Data will be made available on request.
Supplemental material
Supplemental material for this article is available online.
References
Supplementary Material
Please find the following supplemental material available below.
For Open Access articles published under a Creative Commons License, all supplemental material carries the same license as the article it is associated with.
For non-Open Access articles published, all supplemental material carries a non-exclusive license, and permission requests for re-use of supplemental material or any part of supplemental material shall be sent directly to the copyright owner as specified in the copyright notice associated with the article.