
Abstract
Wood density and microfibril angle are strongly correlated with wood stiffness, shrinkage, and anisotropy. Understanding the spatial distribution of these values is critical for solid timber applications. In this study, near infrared (NIR) hyperspectral imaging was used to evaluate wood density and microfibril angle in a non-destructive, yet effective manner. Briefly, five wood samples collected from both normal and compression parts of two different Cryptomeria japonica trees were analyzed. Partial least squares regression analysis was performed to determine the relationship between X-ray reference data and NIR spectra, and cross-validation (leave-one-out) was used for checking prediction performances. The validation coefficient of determination (r2) between predicted densities by the NIR technique and measured values by SilviScan (X-ray data) was 0.83 with a root mean squared error of cross-validation (RMSECV) of 105.18 kg/m3. Regarding microfibril angle, r2 and RMSECV were 0.77 and 5.36°, respectively. Finally, wood density and microfibril angle were successfully mapped at a high spatial resolution (156 µm) to facilitate the detection of annual growth ring features and evaluation of aspects of heterogeneous wood quality.
Introduction
Wood has been used for thousands of years as an environmentally friendly and renewable construction material. However, compared to materials such as steel and brick, the wood formation is a complicated process with many biological events, and it has a naturally intricate matrix that yields poor outcomes, such as swelling, shrinking and twisting. Previous studies have shown that many of those undesired characteristics are due to localized spatial differences in properties such as density and the microfibril angle (MFA) of the S2 layer in the cell wall, as it is much thicker than the other layers (Figure 1).
Cellular structure of softwood (microfibril angle of the S2 layer is much thicker than the other layers).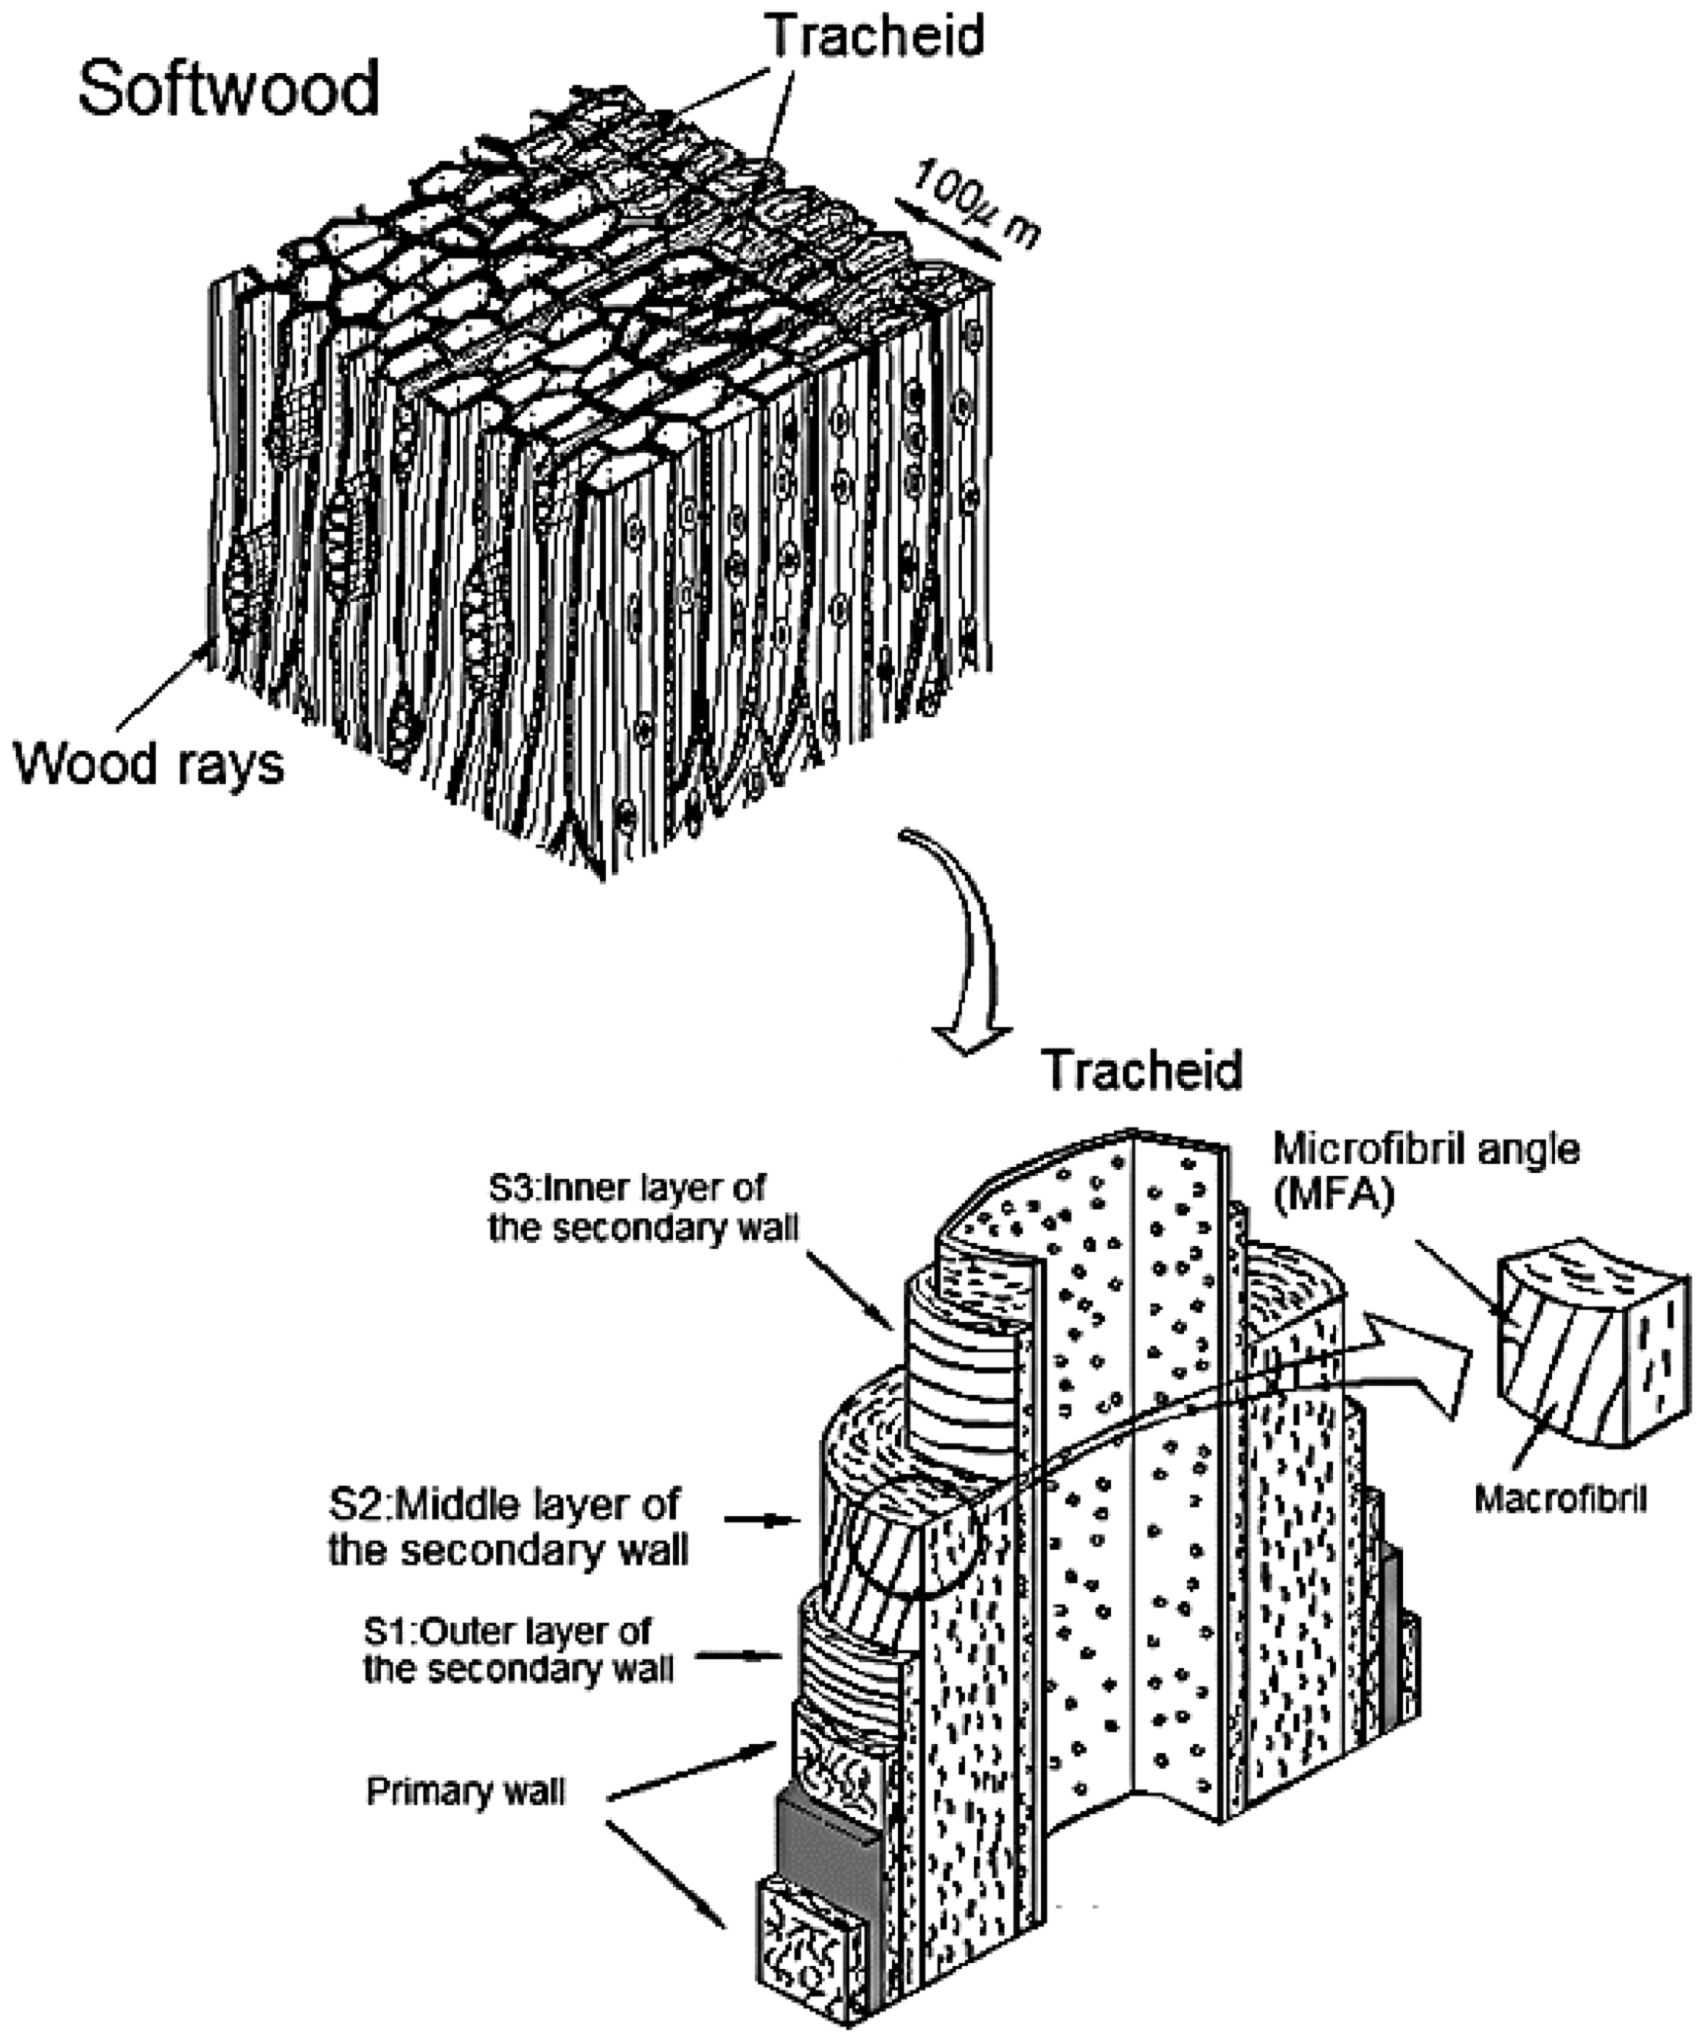
Applications of NIR spectroscopy in wood science have been frequently summarized.1–3 Here, we discuss the potential of NIR hyperspectral imaging, for mapping wood (Cryptomeria japonica) density and the S2 layer MFA at a high spatial resolution to detect annual growth ring features. To achieve that goal, partial least squares (PLS) regression analysis was performed to determine the relationship between NIR spectra and reference values collected by the SilviScan system. The expectation is that the mapping results can be calibrated and will show wooden characteristic properties between earlywood (EW) and latewood (LW), as well as between normal wood (NW) and compression wood (CW) parts. CW is formed on the lower sides of branches and leaning trucks for softwoods, which has a higher proportion of lignin and lower cellulose compared with normal softwood. It needs to be detected at an early stage of wood processing due to its tendency to bend and crook with changing moisture contents.
Materials and methods
In this study, 12 wood disks (15 mm in thickness) were collected from different heights of two Cryptomeria japonica trees, with CW and NW parts (Figure 2), located at Nagoya University, Japan. After air-dried for one month, they were visually inspected to select the five best pith-to-bark sections for analysis. The samples were sorted into blocks (15 mm (longitudinal direction) × 15 mm (tangential direction)) and conditioned at 40% relative humidity and 20℃ until equilibrium was reached (approximately 8% moisture content). Later, the blocks were then extracted with acetone for 12 h to remove resins that may affect density measurements. Then, the samples were extracted for 8 h at 70℃ in a modified Soxhlet extraction system and air-dried to equilibrium. Finally, all samples were cut into strips (7 mm (longitudinal direction) × 2 mm (tangential direction)).
Normal and compression wood parts were collected from different heights of two Cryptomeria japonica trees.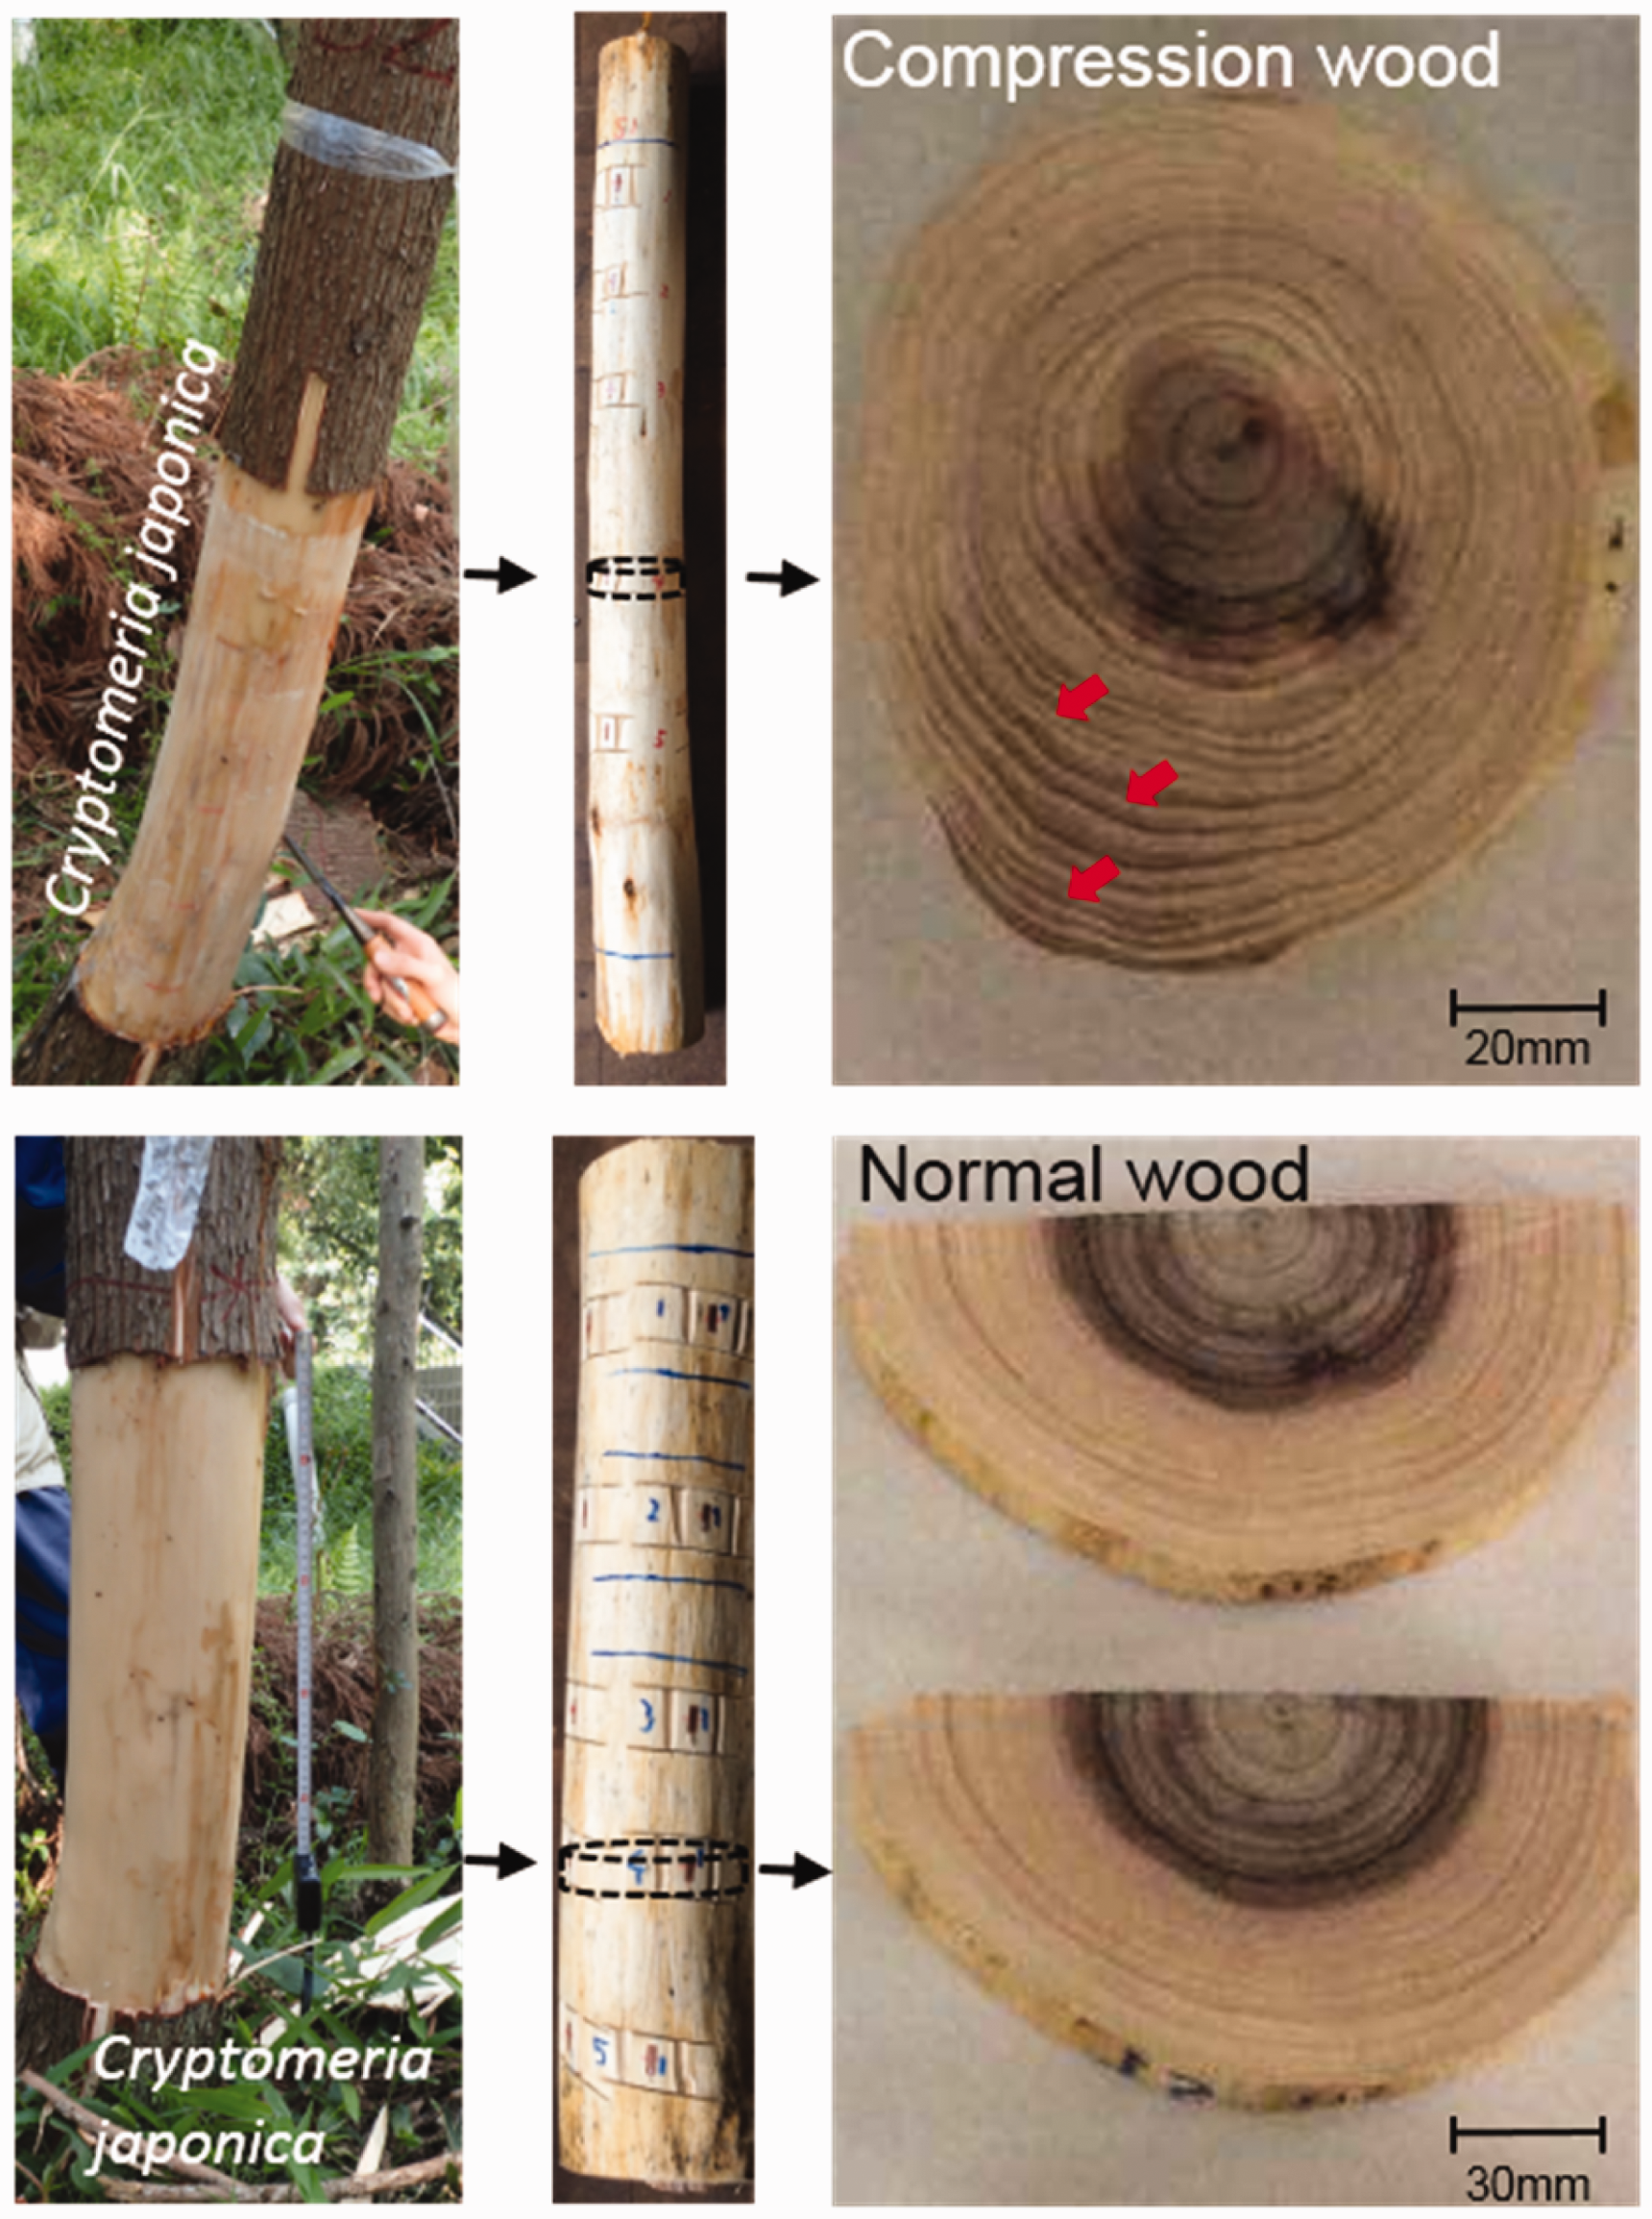
The SilviScan analysis system (FPInnovations, Vancouver, Canada) consists of three main parts: optical microscopy, X-ray densitometry, and X-ray diffractometry. Optical microscopy provides fibril cross-sectional dimensions. One middle horizontal line at the radial surface (longitudinal direction × radial direction) of each strip was scanned for wood density and MFA using X-ray densitometry and X-ray diffractometry, respectively. Wood density was measured at a 25 µm spatial resolution, whereas MFA was measured at 1 mm. (Figure 3(a)).
SilviScan analysis system (a) and NIR hyperspectral imaging system (b).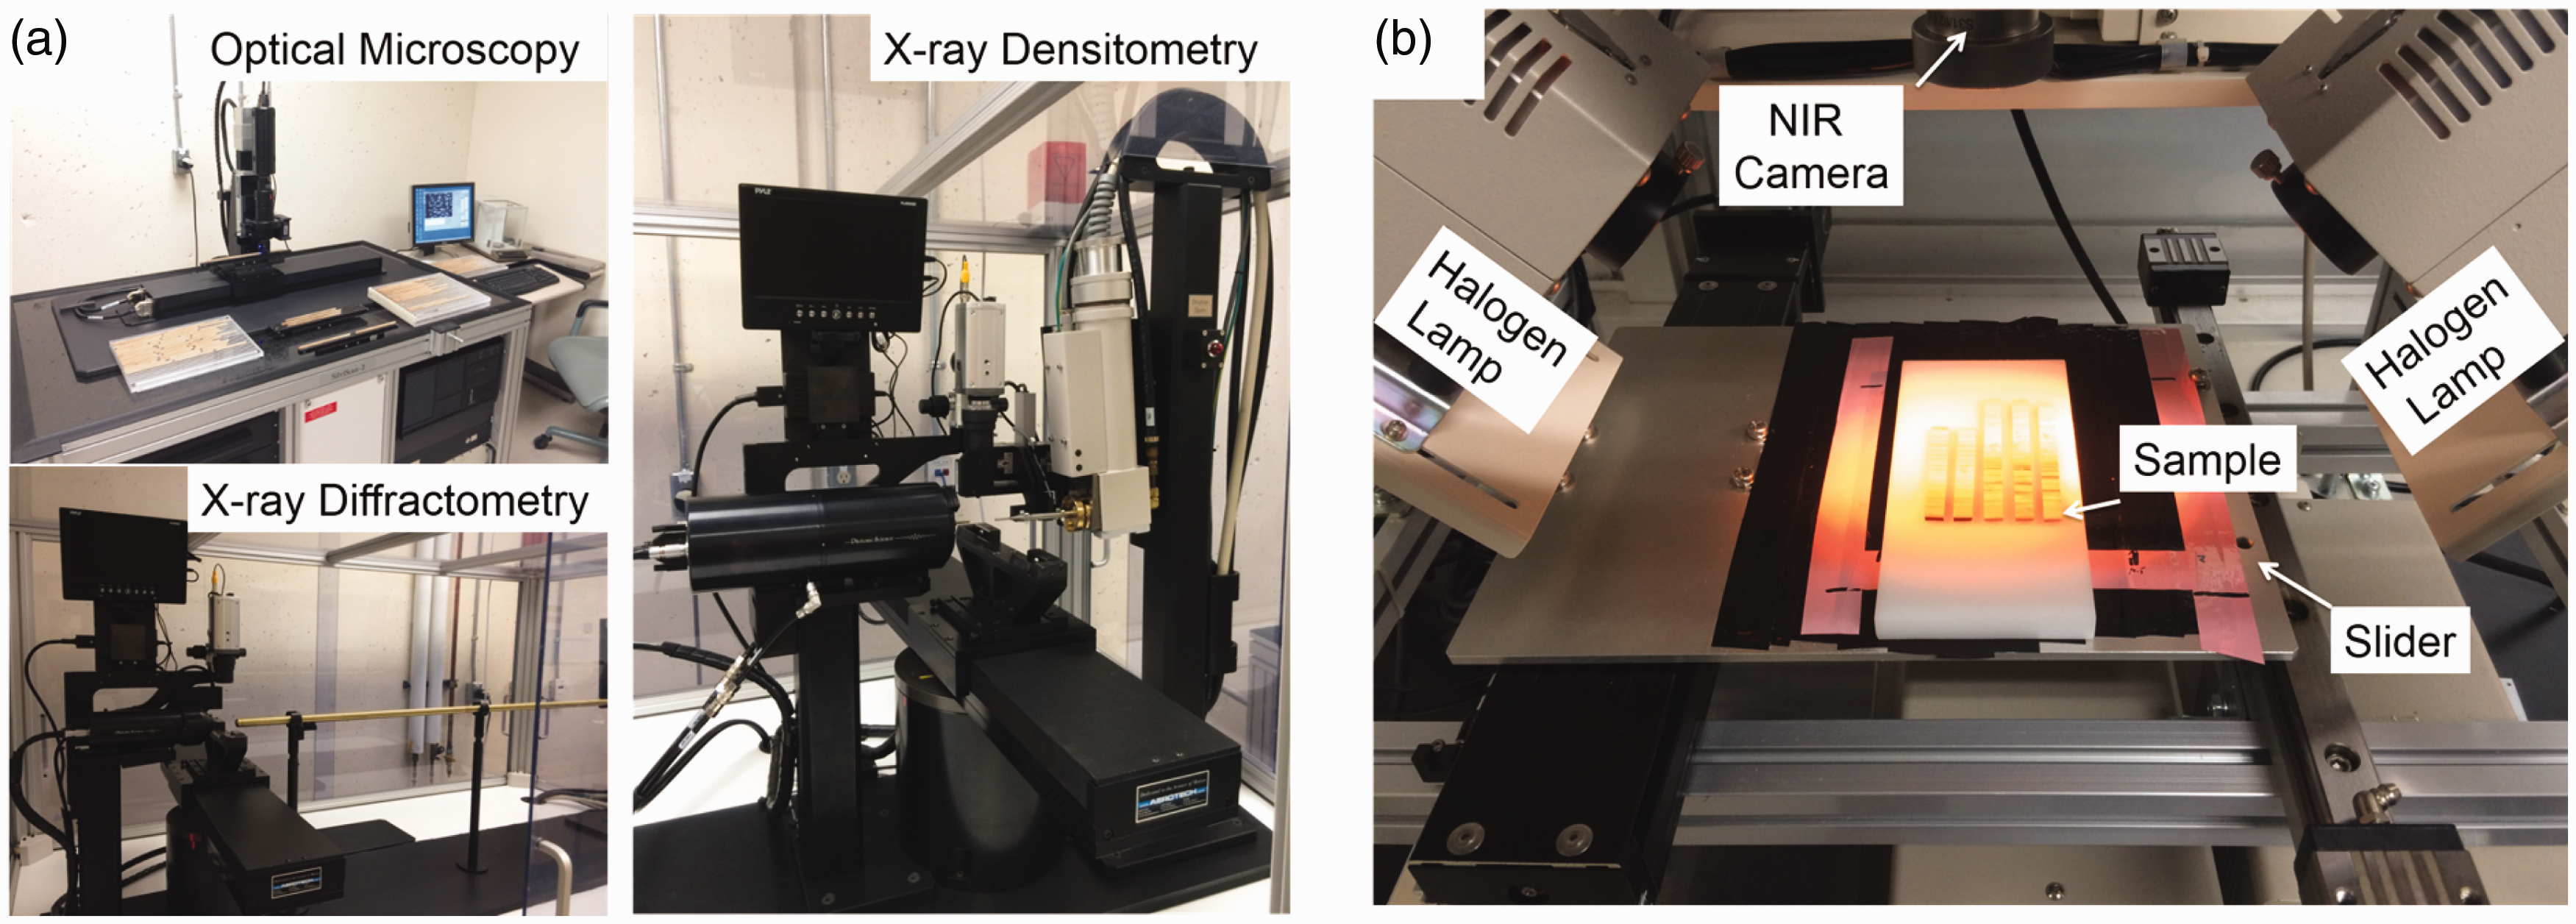
NIR hyperspectral images were obtained from the radial surface of each sample by a push-broom line scanning system (Compovision, Sumitomo Electric Industries, Ltd). The camera is equipped with a spectroscope and a 2D photosensitive element (256 pixels (wavelength) × 320 pixels (position)) that can receive NIR light from 913 nm to 2519 nm, at a spectral resolution of 6.2 nm. In this study, the distance between the target and camera was manually adjusted to achieve a spatial resolution of 156 µm per pixel. The light source was two halogen lamps. Each sample was positioned on the slider and scanned line-by-line (Figure 3(b)).
All collected spectral images were then converted to relative absorbance values for further analysis.As the spatial resolution between the X-ray density data (25 µm) and hyperspectral images (156 µm) are different, new data points were created along the curve defined by original X-ray reference density values to match the same spatial resolution as the hyperspectral images. On the other hand, averaged spectral values were used for matching MFA values. To improve the density and MFA calibration models, an effective wavelength range was selected (1000 nm to 2300 nm). Then, the second derivative NIR spectra (gap–segment method; gap = 0, segment = 9) and standard normal variate (SNV) spectra pre-treatment were applied. The best number of PLS factors was found by the leave-one-out cross-validation. Determination coefficients for cross-validation (r2) and the root mean squared error of cross-validation (RMSECV) were calculated for evaluating calibration models.
Results and discussion
Figure 4 shows the wood density and MFA reference values measured by the SilviScan system with the spatial resolutions of 25 µm and 1 mm, respectively. It is obvious that LW and CW parts had higher densities than EW. Additionally, a gradual increase from EW to LW and a sharp decrease from latewood to EW in each annual ring. In addition, MFAs declined from juvenile to mature wood on NW parts, and CW parts had higher MFAs. Such data collected from inherent wood properties indicated high-resolution and accuracy of the reference value measurements.
Compression wood (a) and normal Wood (b) reference values measured by the SilviScan system.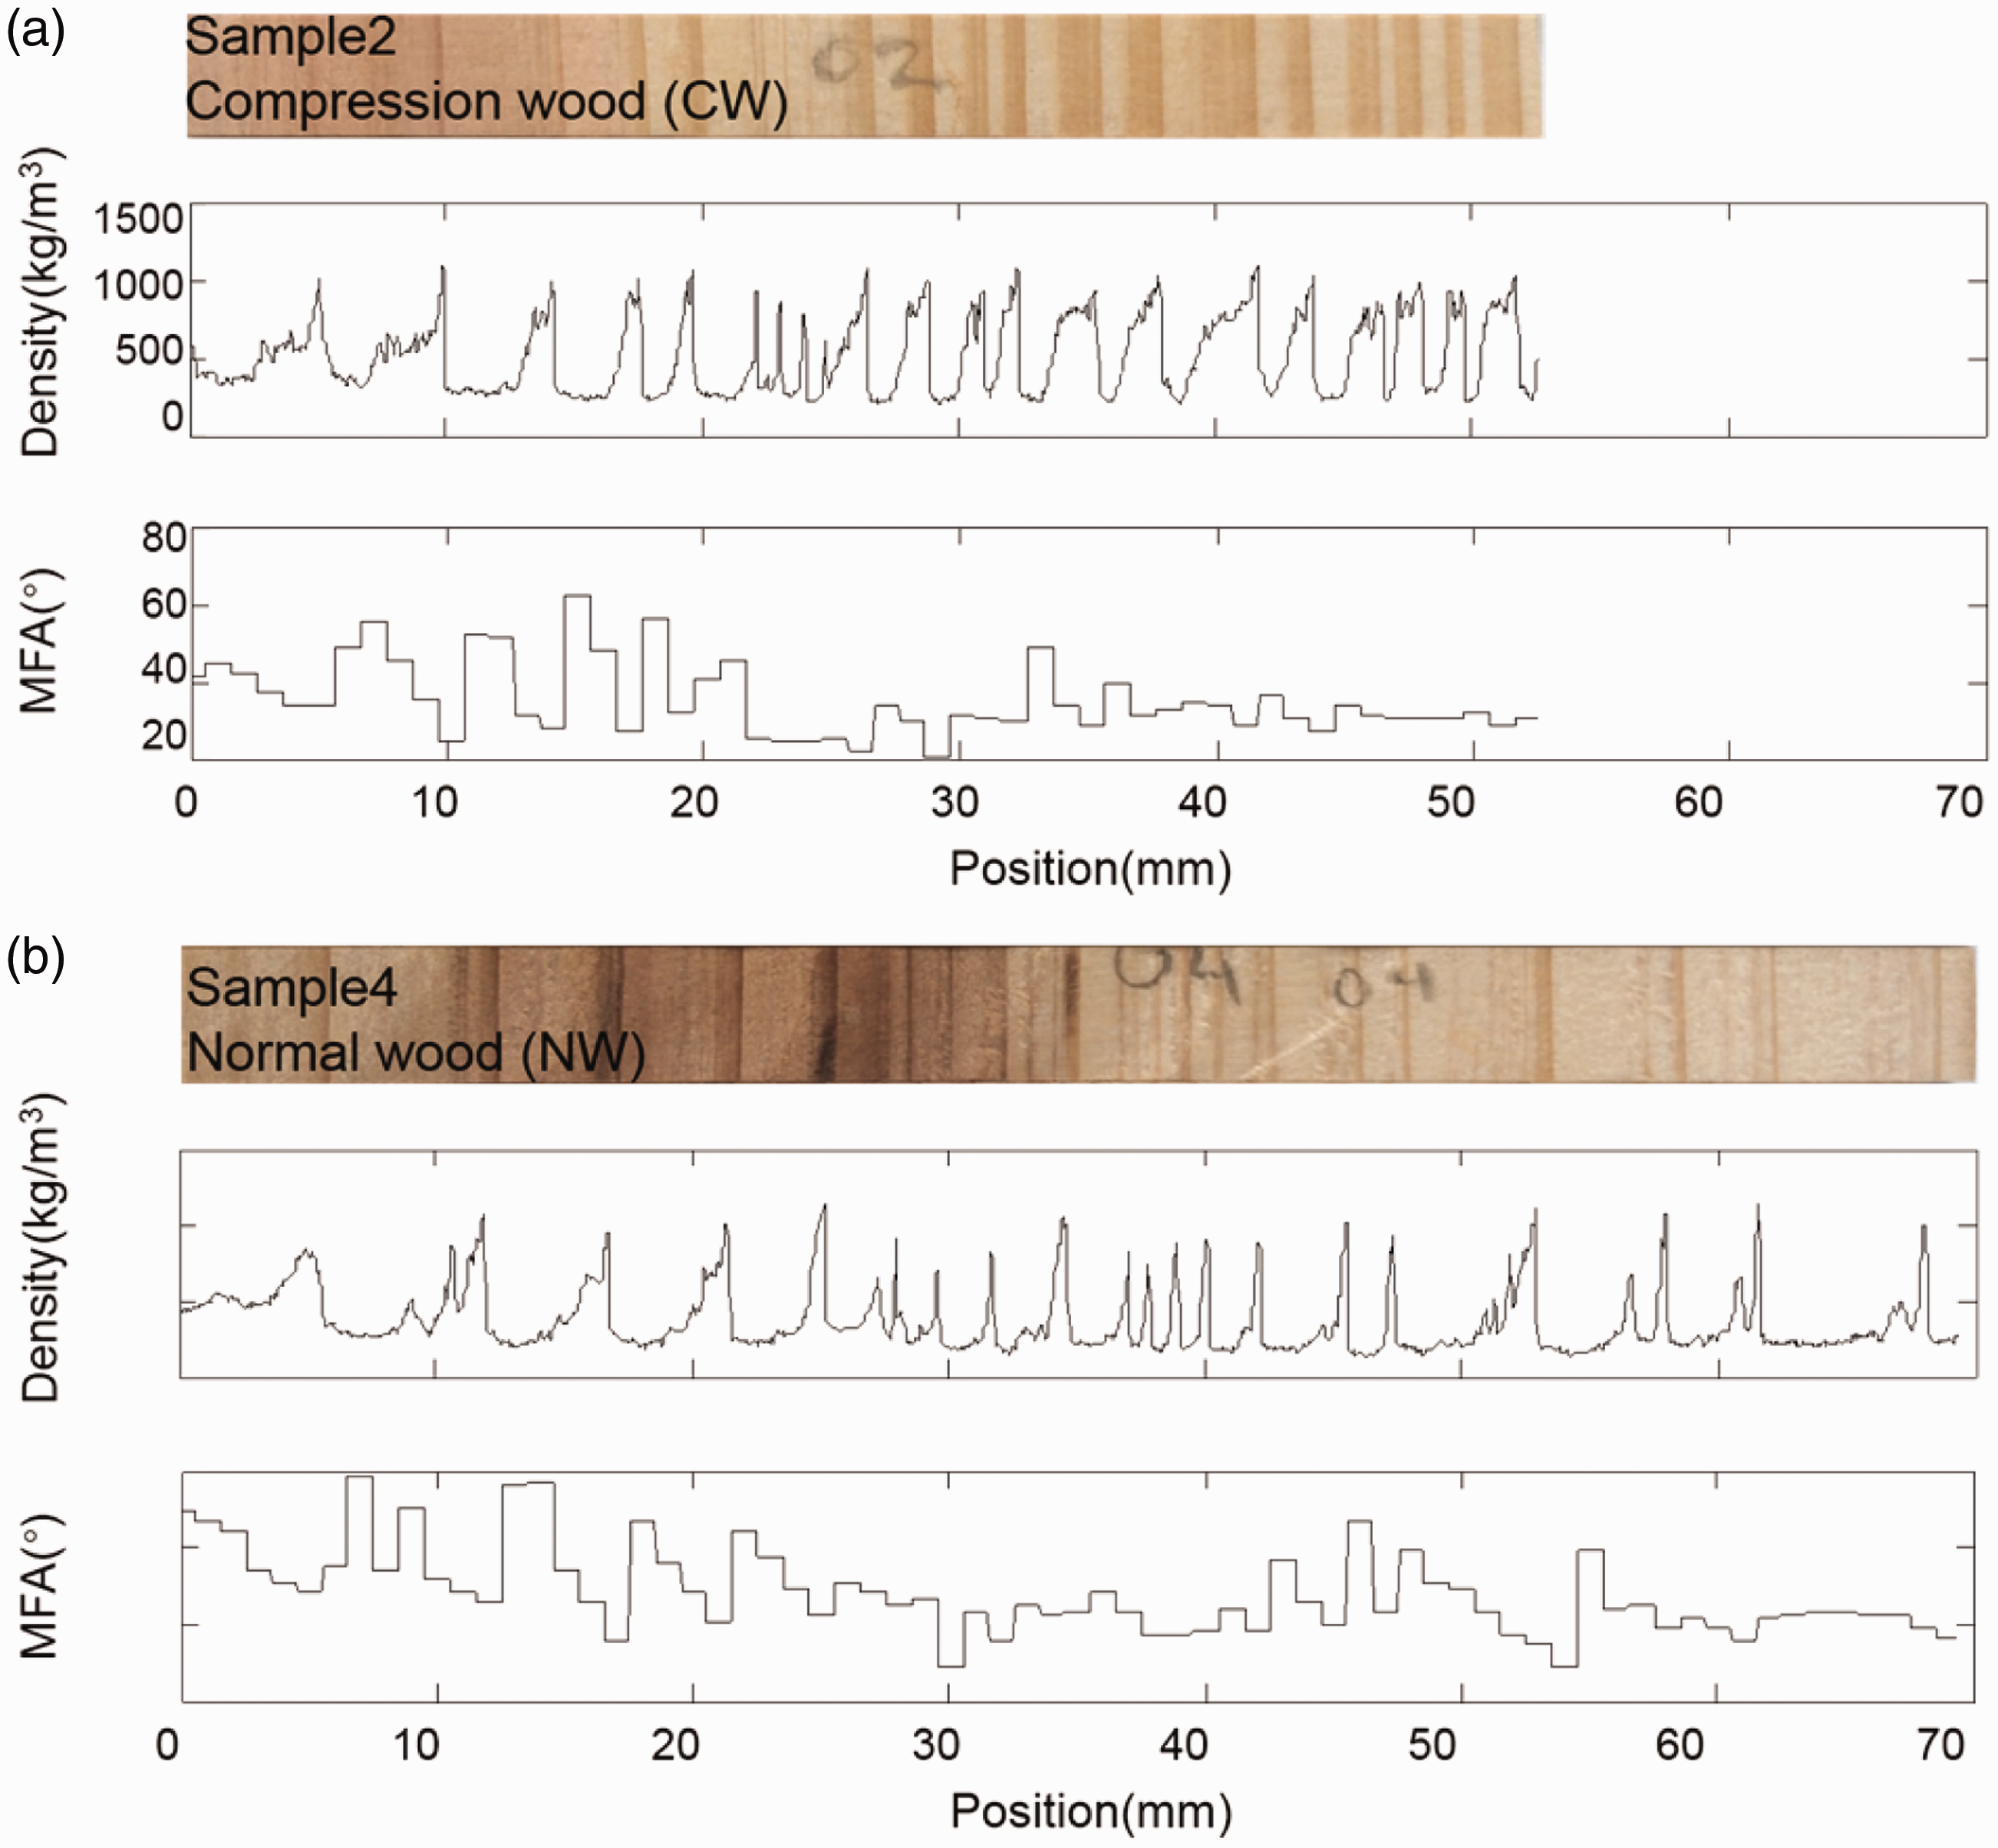
Figure 5(a) shows the averaged value of the second derivative NIR spectra used for building the PLS calibration model for density. The intensity of the lignin band at 1192 nm (second overtone C-H stretch.) is density dependent, and similar dynamics was observed at 1476 nm (first overtone O-H stretch.), 1703 nm (first overtone C-H stretching vibration), and 2111 nm (O-H deform. + O-H stretch.), which are related to cellulose.
1
The high PLS regression coefficients at these wavelengths indicate that lignin and cellulose contents play an important role in the calibration of wood density. Figure 5(b) shows the mean value of pre-processed spectra by the SNV pretreatment. Several absorption bands with higher PLS regression coefficients for the MFA prediction model were observed. Bands at 1370 nm (first overtone C-H str. + C-H def.) are related to hemicellulose content, while bands at 1731 nm (1st overtone C-H str.) and 2100 nm (O-H def. + O-H str.) are associated with cellulose content.
4
The second derivative (a) and SNV (b) averaged NIR spectra (with its PLS regression coefficients) of Cryptomeria japonica.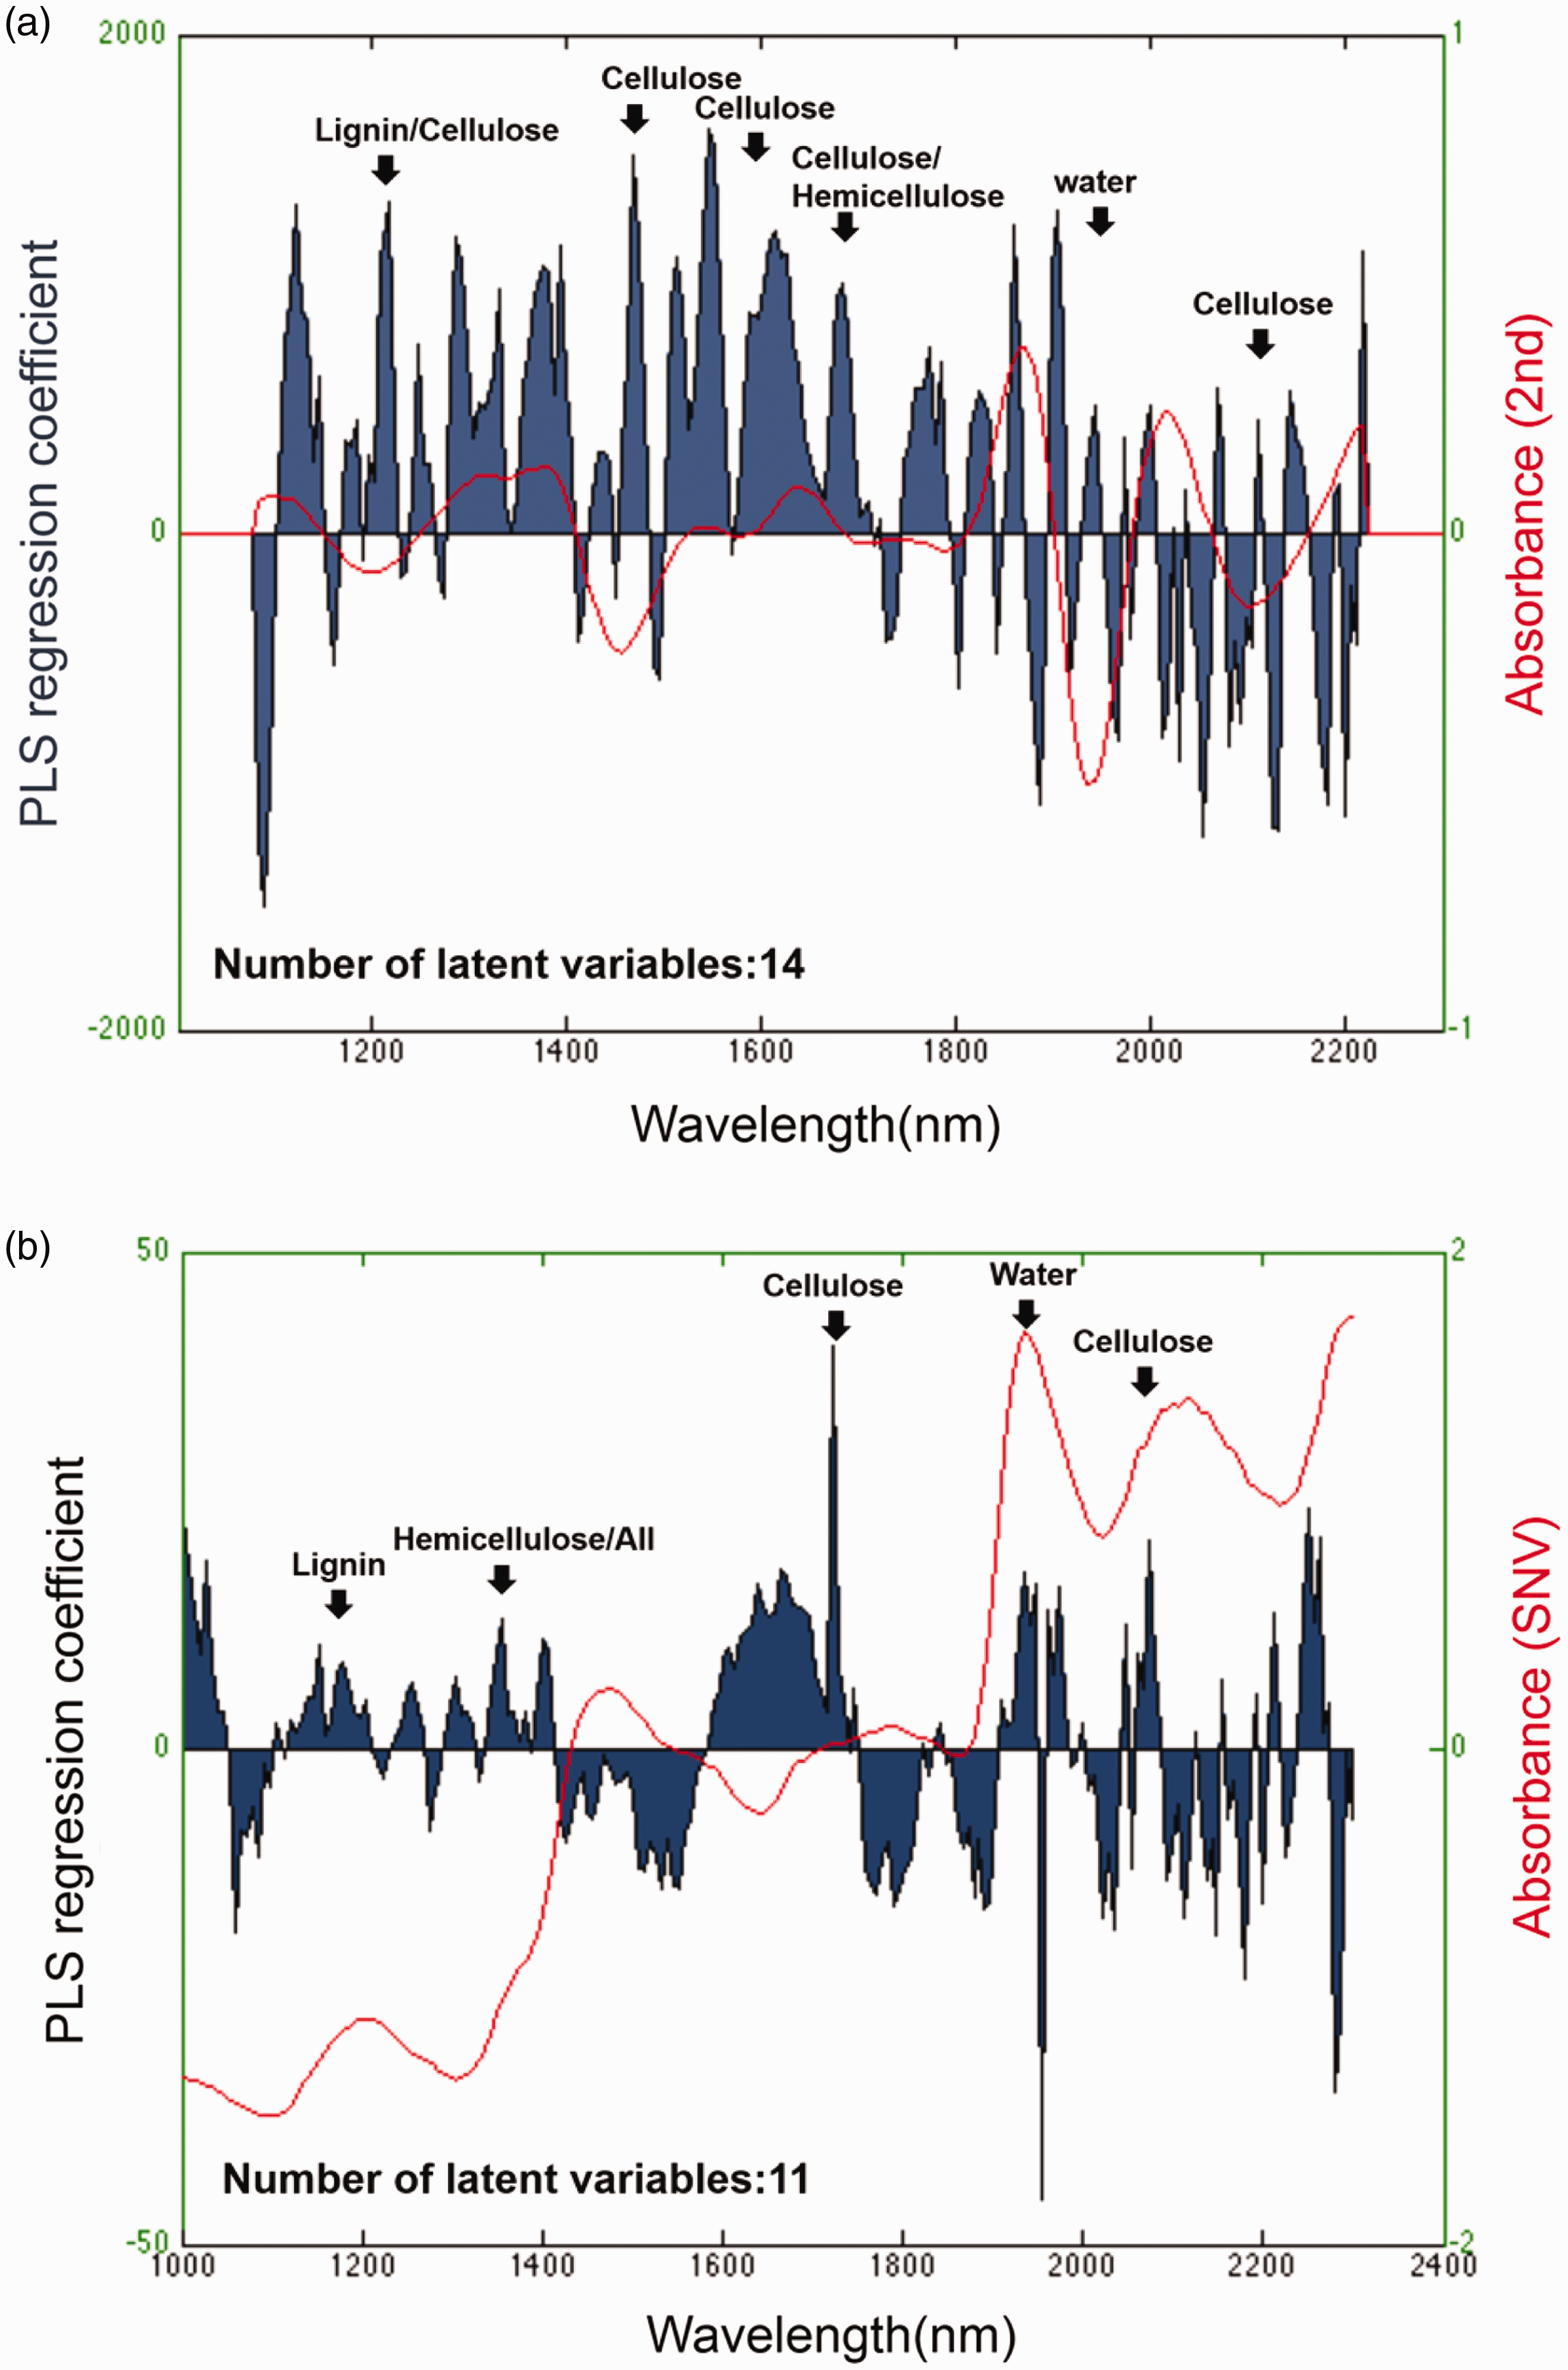
Summary of reference values and analysis results for PLS calibrations.
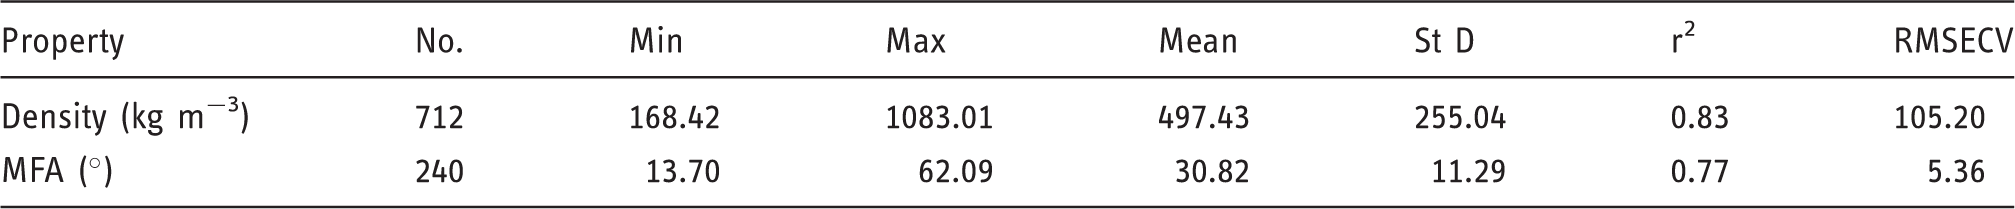
Figure 6(a) shows the density mapping results, indicating that LW and CW have higher densities than the EW. MFA mapping results are presented in Figure 6(b). Donaldson
5
found that juvenile wood (JW) often has higher MFAs, but at age 15 and beyond, trees generally have comparably lower MFAs. Thus, the declining pith-to-bark MFA trend is coherent. However, MFA is also influenced by environmental factors, which is most pronounced in higher MFA in CW and lower MFA in tension wood (TW).
6
For NW sample had a pith-to-bark trend of declining MFAs. However, there were still high MFAs in mature wood (MW) of the NW sample. This sample may have had small CW parts that may have been difficult to visually distinguish by the naked eye.
Density (a) and MFA (b) mapping results of compression and normal wood samples.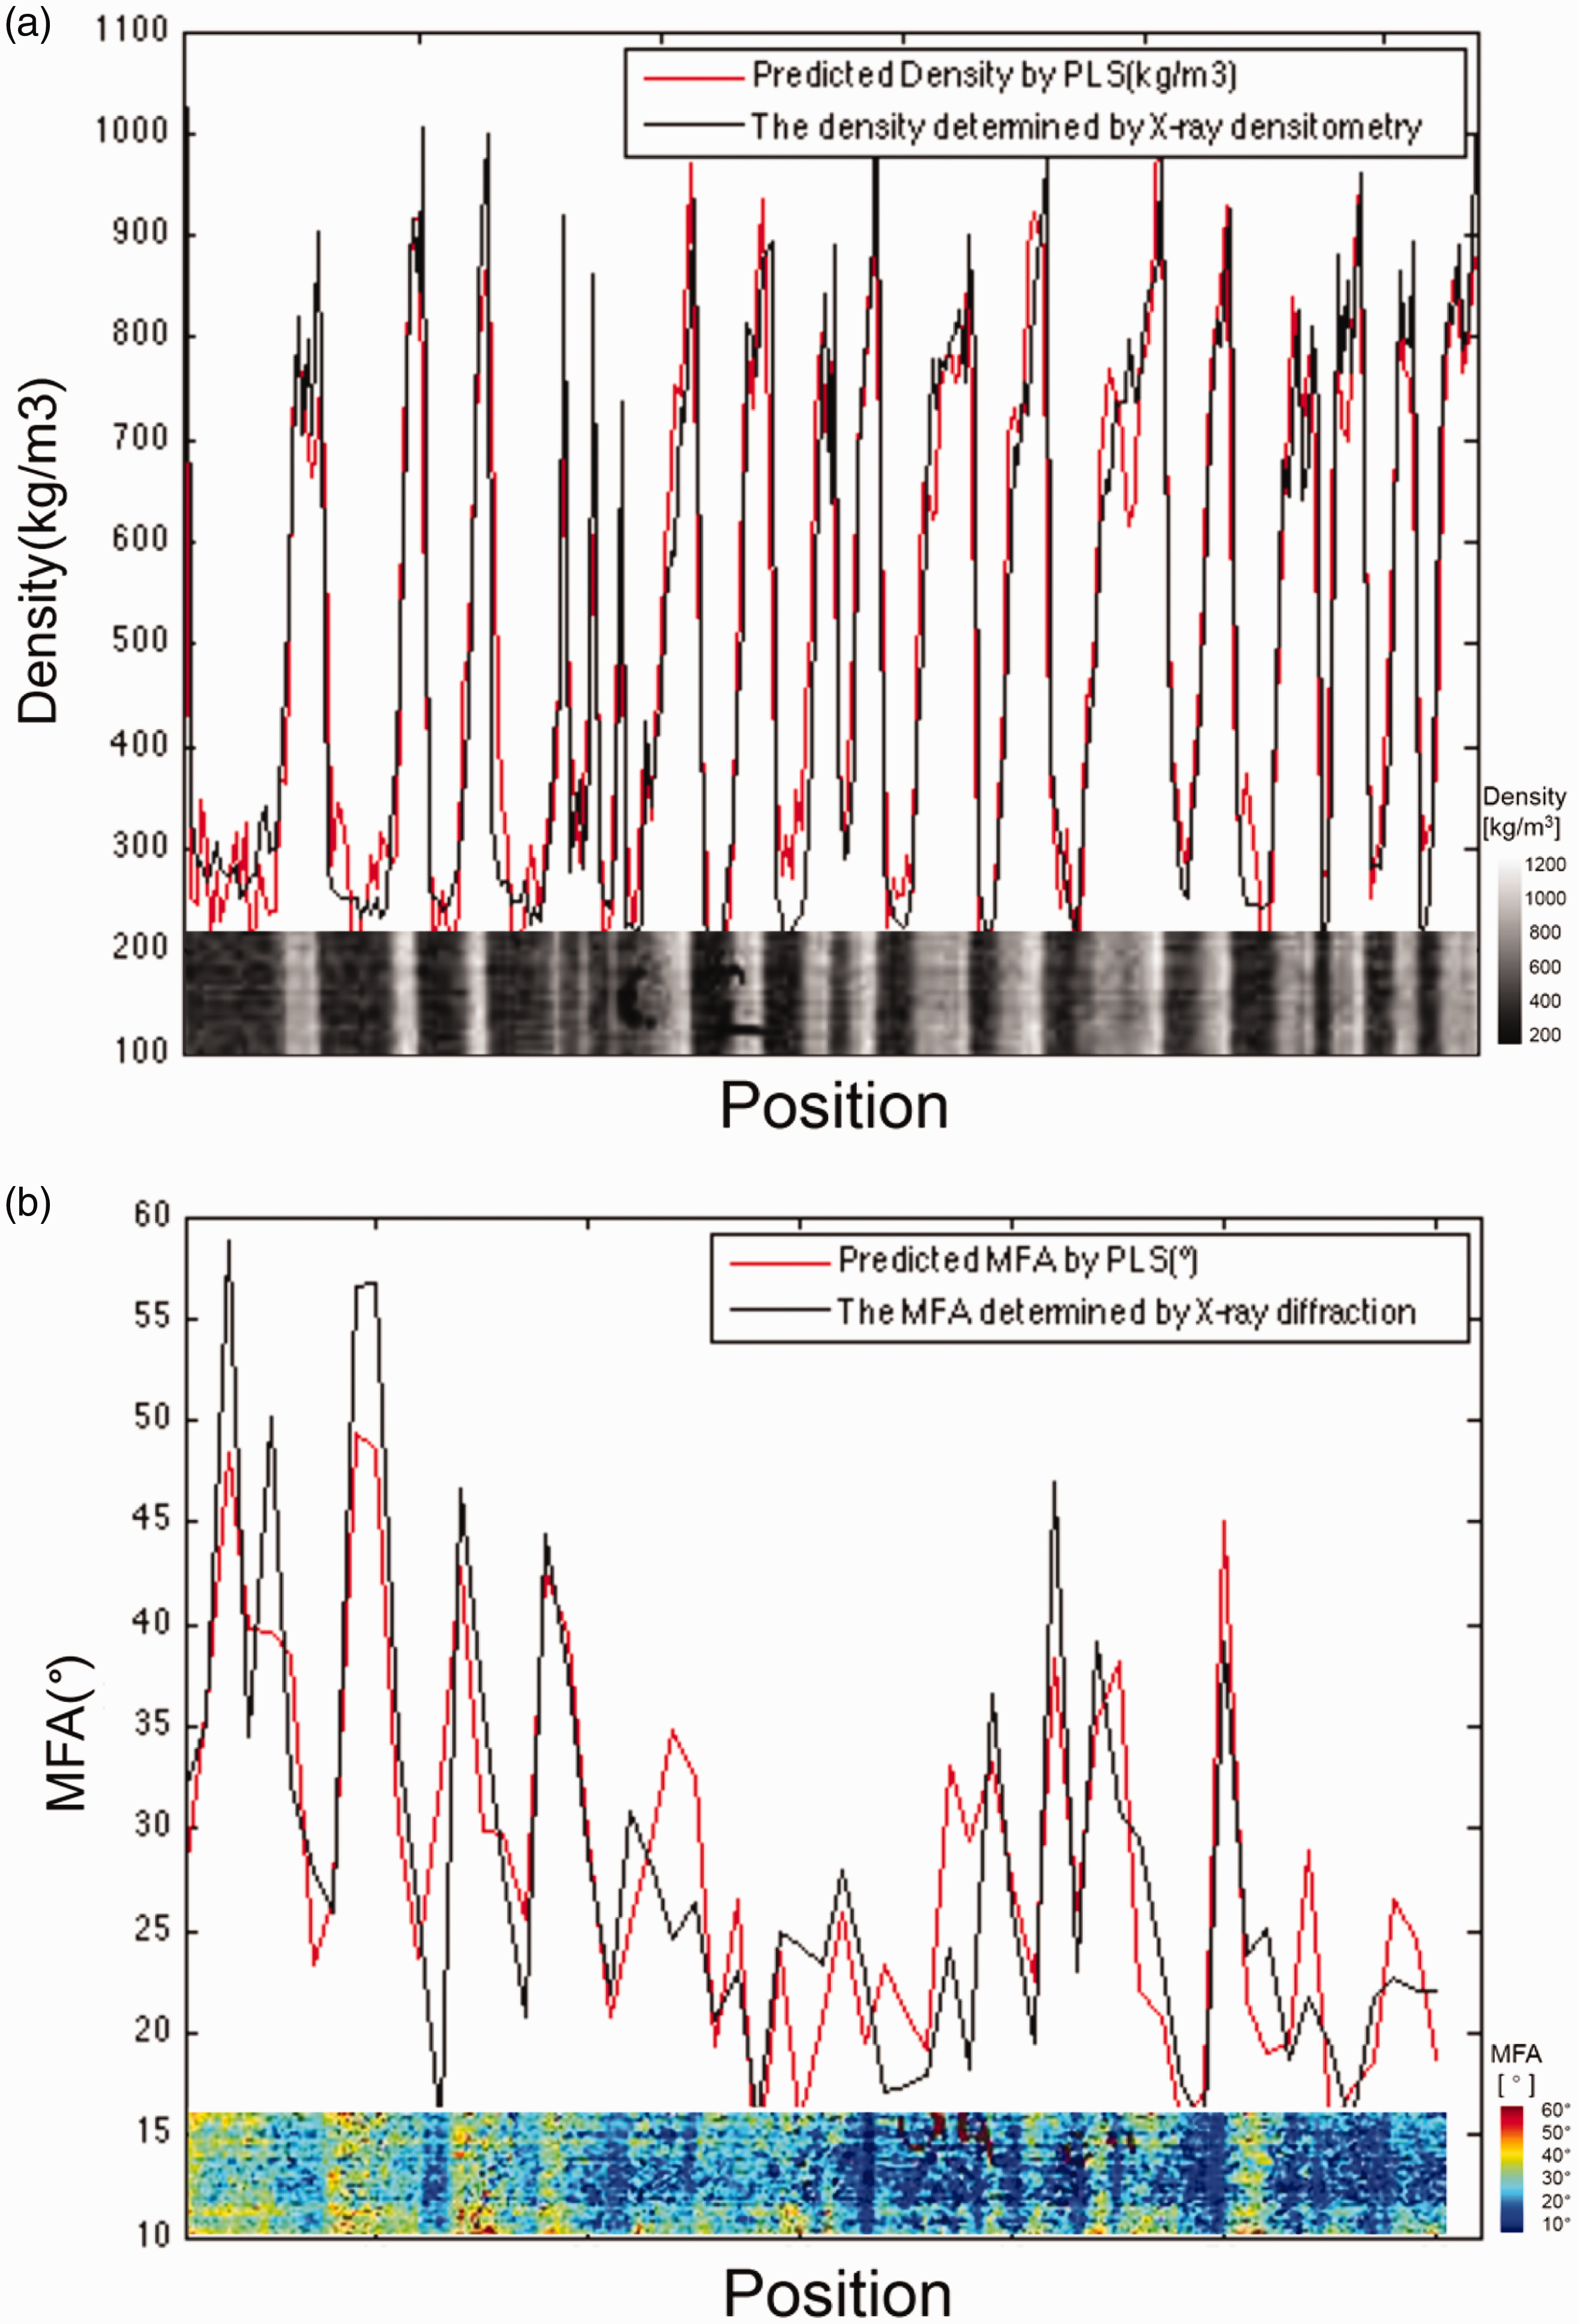
Figure 7 shows the microphotographs of Mäule-colored wood parts with higher MFAs seen at MW sections from normal wood sample. The guaiacyl lignin of C. japonica is manifest in a yellow-brown color. Compared with NW parts, CW has thick circular outlined tracheids with intercellular spaces at the cell corner and extended lignification of the S2 layer.
7
According to that cell wall features, the places with higher MFAs (checked by MFA mapping results) have CW parts nearby (verified by microphotographs). These results indicate that the prediction and mapping results of MFA are reliable.
Microphotographs of mature wood parts (normal wood) with higher MFAs.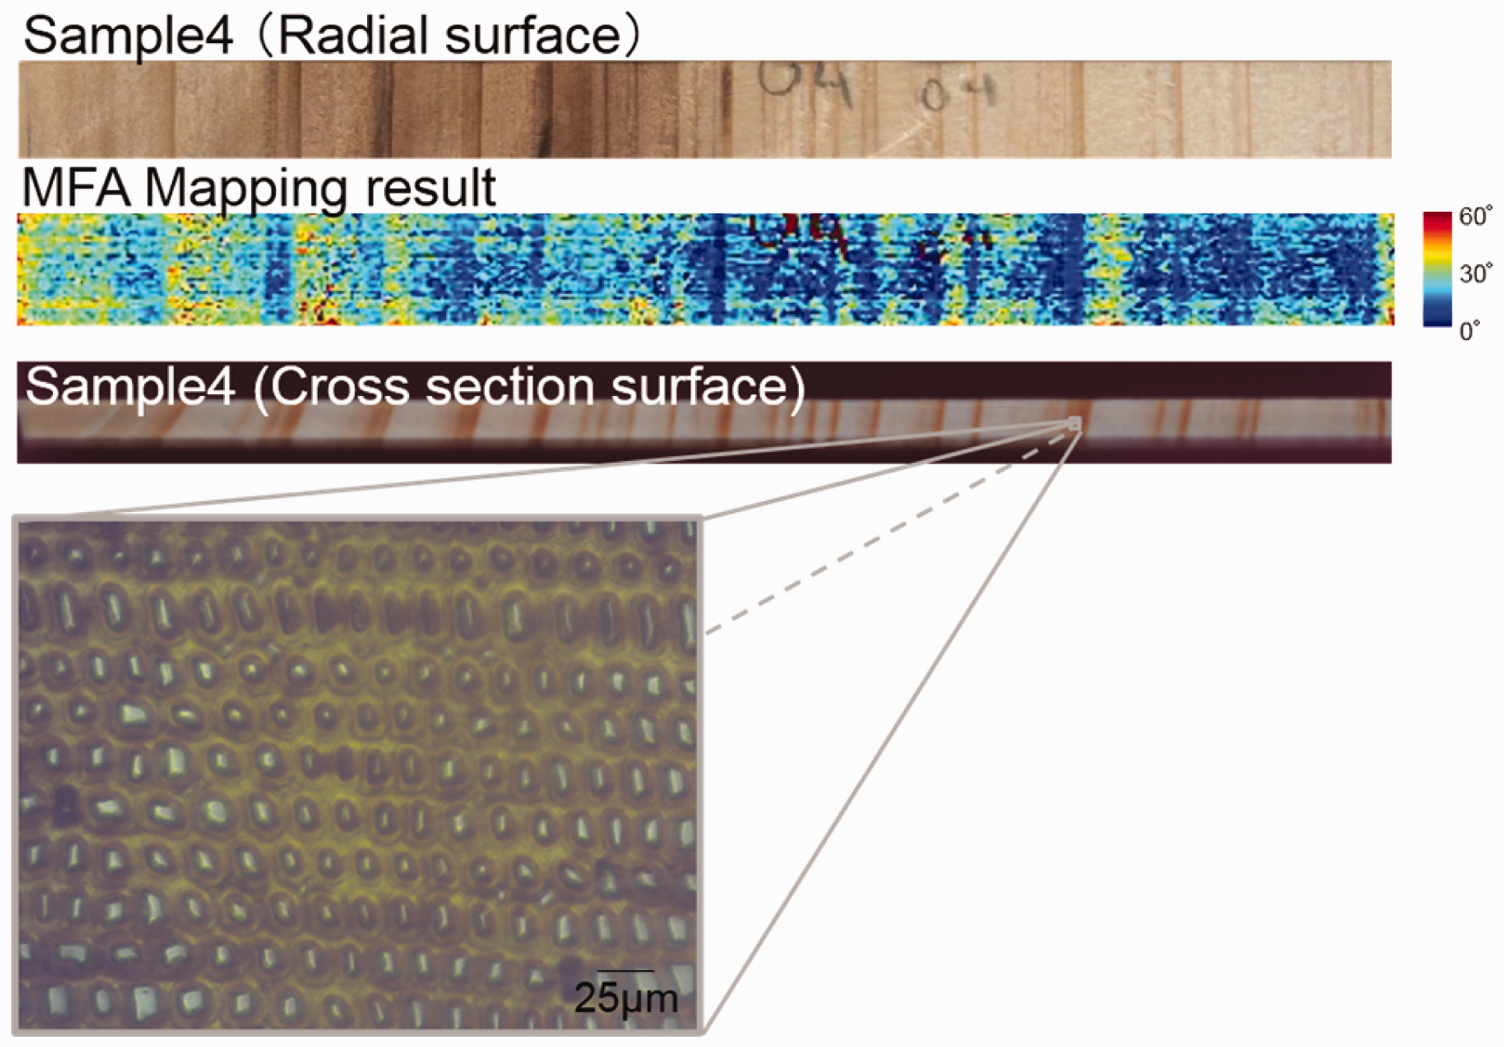
Conclusion
Comparing the calibration results between density and MFA data for each sample, it becomes clear that there is no correlation between MFA and wood density, NIR-based calibration models could be independently established for wood density and MFA.
Though the results are promising, the probability is low that the calibration data are stable at high-speed production lines with sample surface irregularities and the time-consuming hyper data analysis with the PLS factors around 11–14. Thus, further robust analysis for complex NIR spectra, such as selecting an optimal combination of effective wavelengths from HSI images, using less number of PLS factors is required.
Footnotes
Declaration of conflicting interests
The author(s) declared no potential conflicts of interest with respect to the research, authorship, and/or publication of this article.
Funding
The author(s) disclosed receipt of the following financial support for the research, authorship, and/or publication of this article: The authors thank JSPS (KAKENHI, no. 25292102) and Nagoya University PhD professional Toryumon program for their financial support of this work.