
Abstract
This research analyses the field of digital literacy and digital competency, focusing on the growing research conducted in this domain. The dataset reveals that information technology, education and digital literacy have consistently gained attention recently. This study involves accessing the Scopus Elsevier database and retrieving data from 984 documents. We used Bibliometrix software for comprehensive bibliometric analysis and Python packages for plot generation. Moreover, this research aims to analyse trends, patterns and insights in digital literacy and competency based on bibliometric data, covering journal clustering, author productivity, Keyword Plus term frequencies, citation trends and keyword shifting. It also highlights emerging areas such as digital transformation, digital skills and the impact of COVID-19, indicating their increasing significance in the research community. The findings underscore the growing interest in the intersection of education and technology, particularly concerning digital literacy and e-learning. This dataset is valuable for identifying trends, tracking research progress and identifying digital literacy and competency.
Introduction
In the ever-evolving landscape of the digital age, the concepts of digital literacy and digital competency are essential cornerstones for individuals seeking to thrive in a technology-driven world. Digital literacy (Sitepu and Rajagukguk, 2022), as the foundational layer, equips individuals with the fundamental knowledge and skills required to navigate the digital realm effectively. It encompasses operating digital devices, navigating software and applications and utilising the internet for daily tasks. Digital literacy can be assumed as the ability to read and write in the digital language, representing the essential fluency needed for active participation in modern society. Building upon this foundation, digital competency elevates digital proficiency to a practical level, encompassing the application of digital skills to achieve specific objectives or tasks. Digital competency is about using digital tools and technologies purposefully and productively. It involves understanding how to use software, navigate the internet and effectively leverage these digital resources for problem-solving, decision-making and accomplishing personal or professional goals. In today’s rapidly evolving world, digital literacy and competency have become indispensable skills across various occupations (Wahjusaputri and Nastiti, 2022). Effective information management, decision-making and communication heavily rely on these digital abilities. Researchers and professionals can find innovative ideas, concepts and skills relevant to their specific domains or businesses by examining trends in digital literacy and digital competency. One of the prominent frameworks in this domain is Doug Belshaw’s digital literacy framework (Belshaw, 2014), which comprises eight critical components that empower individuals to engage critically with digital technologies and information. These include cultural, cognitive, collaborative, communicative, confident, creative, critical and civic literacies. This write-up provides a comprehensive approach to digital literacy, addressing various aspects necessary for individuals to thrive in the digital age. Sinay and Graikinis (2018) exemplified the connotations of the eight critical components. ‘Cognitive’ is the set of technical tools and ‘habits of mind’ to manipulate digital technologies. ‘Critical’ is analysing the power structures and assumptions behind digital practices and evaluating processes, data, content, information and products. ‘Collaborative’ and ‘Communicate’ are intertwined. ‘Collaborative’ is peer relationships, bonding with experts and other audiences; interacting and sharing to solve problems and answer questions; co-constructing and co-creating resources and knowledge.
On the other hand, ‘Communicate’ is communicating effectively, responsibly and creatively using digital technologies by applying certain norms and assumptions. Identifying needs and real work problems and resolving conceptual problems constitutes Confidence whilst creating, editing, improving and integrating information content and products into an existing body of knowledge builds ‘Creativity’. These components engage in context-appropriate e-learning activities, operating in a Culture of evolving technologies, economic and societal changes and protecting personal safety and privacy with physical and psychological well-being. Overall, participatory citizenship engagement through appropriate digital technologies builds the ‘Civic’, a holistic concept for enhancing digital competency. The mention of social media usage for civic purposes (Ntem et al., 2023) is particularly intriguing, reflecting a multifaceted approach where individuals harnessed the potential of social media platforms to engage deeply in civic matters. This notion went beyond routine interactions, representing a conscious effort to navigate the digital landscape while avoiding the surveillance of governments that aimed to stifle communication. Social media has become a vital platform for individuals to connect, not only in times of ease but especially in moments of adversity. It served as a medium for mutual support and encouragement during challenging situations.
Furthermore, it encouraged critical thinking and constructive discussions, shifting the focus from passive consumption to active participation in discussions that shape society. This underlines the significance of comprehensive literacies within the broader scope of digital literacy and digital competency, including civic, critical, creative and communicative literacies. These literacies empower individuals to engage with digital technologies actively, think critically about the information they encounter, and communicate effectively in a digital world filled with intricacies.
With this foundation in mind, this paper aims to delve deeper into the dynamics of digital literacy, digital competency and the evolving landscape of digital engagement. It seeks to explore these skills’ roles in the modern world and their implications for individuals and society. This paper intends to contribute to a more profound understanding of the digital competencies necessary for thriving in today’s digital age.
Literature review
The literature review underscores the pressing need for further research in digital competence. Digital competence, a multifaceted concept encompassing skills, attitudes and abilities for critical and creative technology use, has garnered significant recognition as a vital competency in personal and professional domains (Antonio-Manuel et al., 2022). Its role as a cornerstone for lifelong learning is accentuated in an ever-evolving digital landscape (Antonio-Manuel et al., 2022). The European Commission’s Common Digital Competence Framework offers a valuable lens for assessing self-perceptions of digital competence, especially in educational settings (Batyuk, 2017). Educators stand to enhance students’ academic outcomes by incorporating digital technologies and cultivating digital literacy, thereby creating more engaging and interactive learning experiences (Khatamova and Sayfiddinova, 2023).
Nevertheless, even as the emphasis on digital competence grows, studies reveal constraints in harnessing digital technologies, with notable disparities concerning gender (Antonio-Manuel et al., 2022). Research on digital competence in educational contexts spans diverse dimensions, encompassing policy, organisational infrastructures, strategic leadership and teaching practices (Pettersson, 2018).
Moreover, the imperative to develop digital literacy skills among undergraduate students is recognised, acknowledging the relevance of digital competence for future specialists (Ostanina et al., 2023). The significance of teachers’ digital literacy competence in effective teaching and learning processes is evident (Marnita et al., 2023). Beyond formal education, cultivating digital literacy competence proves indispensable for home industry entrepreneurs who must adapt to technology and leverage digital literacy skills to prosper in an era of digitalisation (Santoso et al., 2023). Notably, disparities in digital literacy competence across different generations, particularly among smartphone users, have emerged (Sitepu and Rajagukguk, 2022). Efforts to nurture digital literacy competence in educational institutions, such as Madrasah Aliyah, entail strategic planning, organisation and implementation of an array of informal and formal programmes, including workshops, training sessions and seminars (Fithriyah Nurul et al., 2023).
The literature review illuminates the paramount importance of digital competence in personal, professional and educational domains. While there is a growing emphasis on digital competence within the academic sphere, the research landscape beckons further investigation into organisational infrastructures, leadership and contextual factors that shape digital competence. Both teachers’ and students’ digital literacy competencies are instrumental in fostering effective teaching and learning processes. Additionally, the cultivation of digital literacy competence extends its relevance to entrepreneurs and individuals across various age brackets, and concerted efforts are underway to fortify digital literacy competence within educational institutions. These collective insights underscore the urgency for additional research in this domain to better comprehend digital competence’s evolving dynamics.
Methodology
The methodology employed in this study was designed to facilitate the systematic search and retrieval of relevant scholarly documents, aligning with the research objectives and ensuring a robust and replicable approach. To initiate the search, the criteria were meticulously established. The ‘Article title, abstract, keywords’ section of scholarly documents was selected for the search to concentrate on the most pivotal portions of the literature. The search query, ‘digital AND literacy AND digital AND competency’, was crafted to pinpoint documents directly aligned with the research focus.
In terms of inclusion criteria, several facets were considered
Firstly, the search was extended to encompass documents published over a substantial temporal range from 1979 to 2022. This broad timeframe was chosen strategically to capture the evolution and progression of digital literacy and digital competency concepts.
Secondly, inclusivity was the principle governing the inclusion of document types. Various documents included articles, reports, reviews and other scholarly works. This approach ensured a comprehensive literature representation, enabling a multifaceted analysis.
Thirdly, language barriers were consciously eliminated. The search was open to documents in all languages, promoting the inclusion of diverse linguistic sources and fostering inclusivity.
Lastly, recognising the interdisciplinary nature of digital literacy and digital competency, the search extended across all subject areas, acknowledging their relevance in diverse academic domains.
As a result of this comprehensive search, a total of 984 documents meeting the specified criteria were identified. These documents formed the cornerstone of the research analysis, facilitating a thorough exploration of the evolution and contemporary understanding of digital literacy and digital competency. The exclusive reliance on the Scopus Elsevier database was substantiated by its extensive coverage of scholarly literature across various disciplines, in alignment with the research objectives. Renowned for its comprehensive indexing, rigorous peer-review process and inclusion of reputable journals, Scopus ensured the retrieval of high-quality, relevant content. The vast expanse of this database rendered it suitable for conducting a comprehensive and robust literature review, thereby enhancing the credibility and validity of the research.
Following data collection, the next phase involved data export
The retrieved data was exported in CSV format, ensuring it encompassed all the requisite information for the upcoming analysis.
This data export process was conducted on the 10th of May, 2023, maintaining a structured timeline.
The subsequent stages of the research hinged on bibliometric analysis software
The Bibliometrix software, recognised for its comprehensive bibliometric analysis capabilities, was utilised.
The analysis process was facilitated by utilising Bibliometrix for RStudio, offering a user-friendly graphical interface via its built-in utility, Biblioshiny.
The research also incorporated the generation of plots using Python
Python packages such as Matplotlib, Seaborn, or Plotly were employed to generate a variety of plots and visualisations based on the acquired bibliometric data.
The functionalities provided by these packages were adeptly utilised to create different types of plots, including bar charts, line plots, scatter plots, or pie charts, tailored to the specific research requirements.
Data analysis
The data has been analysed using Bibliometrix software to identify trend topics related to digital literacy and digital competency in research articles. The clustering of journals is performed based on publishing frequency and Bradford’s Law, which would estimate the number of reports across journals – Lotka’s Law analysed author productivity. The most frequent Keyword Plus terms are plotted, and their frequency is calculated. Citation trends and median citation change are analysed for reference publication year spectroscopy. The movements of keyword shifting over time are explored, and descriptive statistics are calculated for key variables.
This study may be constrained by the exclusive reliance on a single database, Scopus Elsevier, which, although extensive, may not encompass all relevant literature on digital literacy and digital competency. Different databases have varying coverage and specialities, potentially eliminating valuable documents from alternative sources.
This methodological approach aimed to comprehensively examine the research landscape in digital literacy and digital competency. By analysing and presenting trends, patterns and key insights derived from bibliometric data spanning the selected timeframe, the research sought to provide a holistic understanding of the subject matter. The systematic combination of bibliometric analysis and Python-based plot generation was employed to achieve this goal, facilitating a robust exploration of the research domain.
Research questions
RQ1. How have the frequencies of trending topics in the field evolved?
RQ2. How can journals be clustered based on their frequency and estimated number of articles?
RQ3. What is the relationship between the number of documents written and the proportion of authors according to Lotka’s Law?
RQ4. What keywords appear most frequently in research articles, with a minimum occurrence of 10?
RQ5. What are the citation trends and the median citation change regarding Publication Year Spectroscopy from 2002 to 2022?
Hypothesis
The frequency of trending topics in the field has increased over time, reflecting the growing importance and interest in these subjects.
As per Lotka’s Law, there will be a skewed distribution of author productivity, where a small proportion of authors will contribute to most documents written, while most authors will have lower productivity levels.
The frequencies of keywords related to digital literacies, e-learning, students and human factors have shown an increasing trend over the years, showing a growing focus and interest in these areas (Table 5).
Data analysis and interpretation
The data was analysed using Bibliometrix software, Python Coding, employing various bibliometric techniques to gain insights and interpret the results.
Trend topics with keyword plus
To form the table, the data has been organised by item, and the frequency of each item is calculated. Then, the year_q1, year_med and year_q3 are determined using the following mathematical analysis (Table 1):
Frequency of trending topics with years of observation and quartiles.
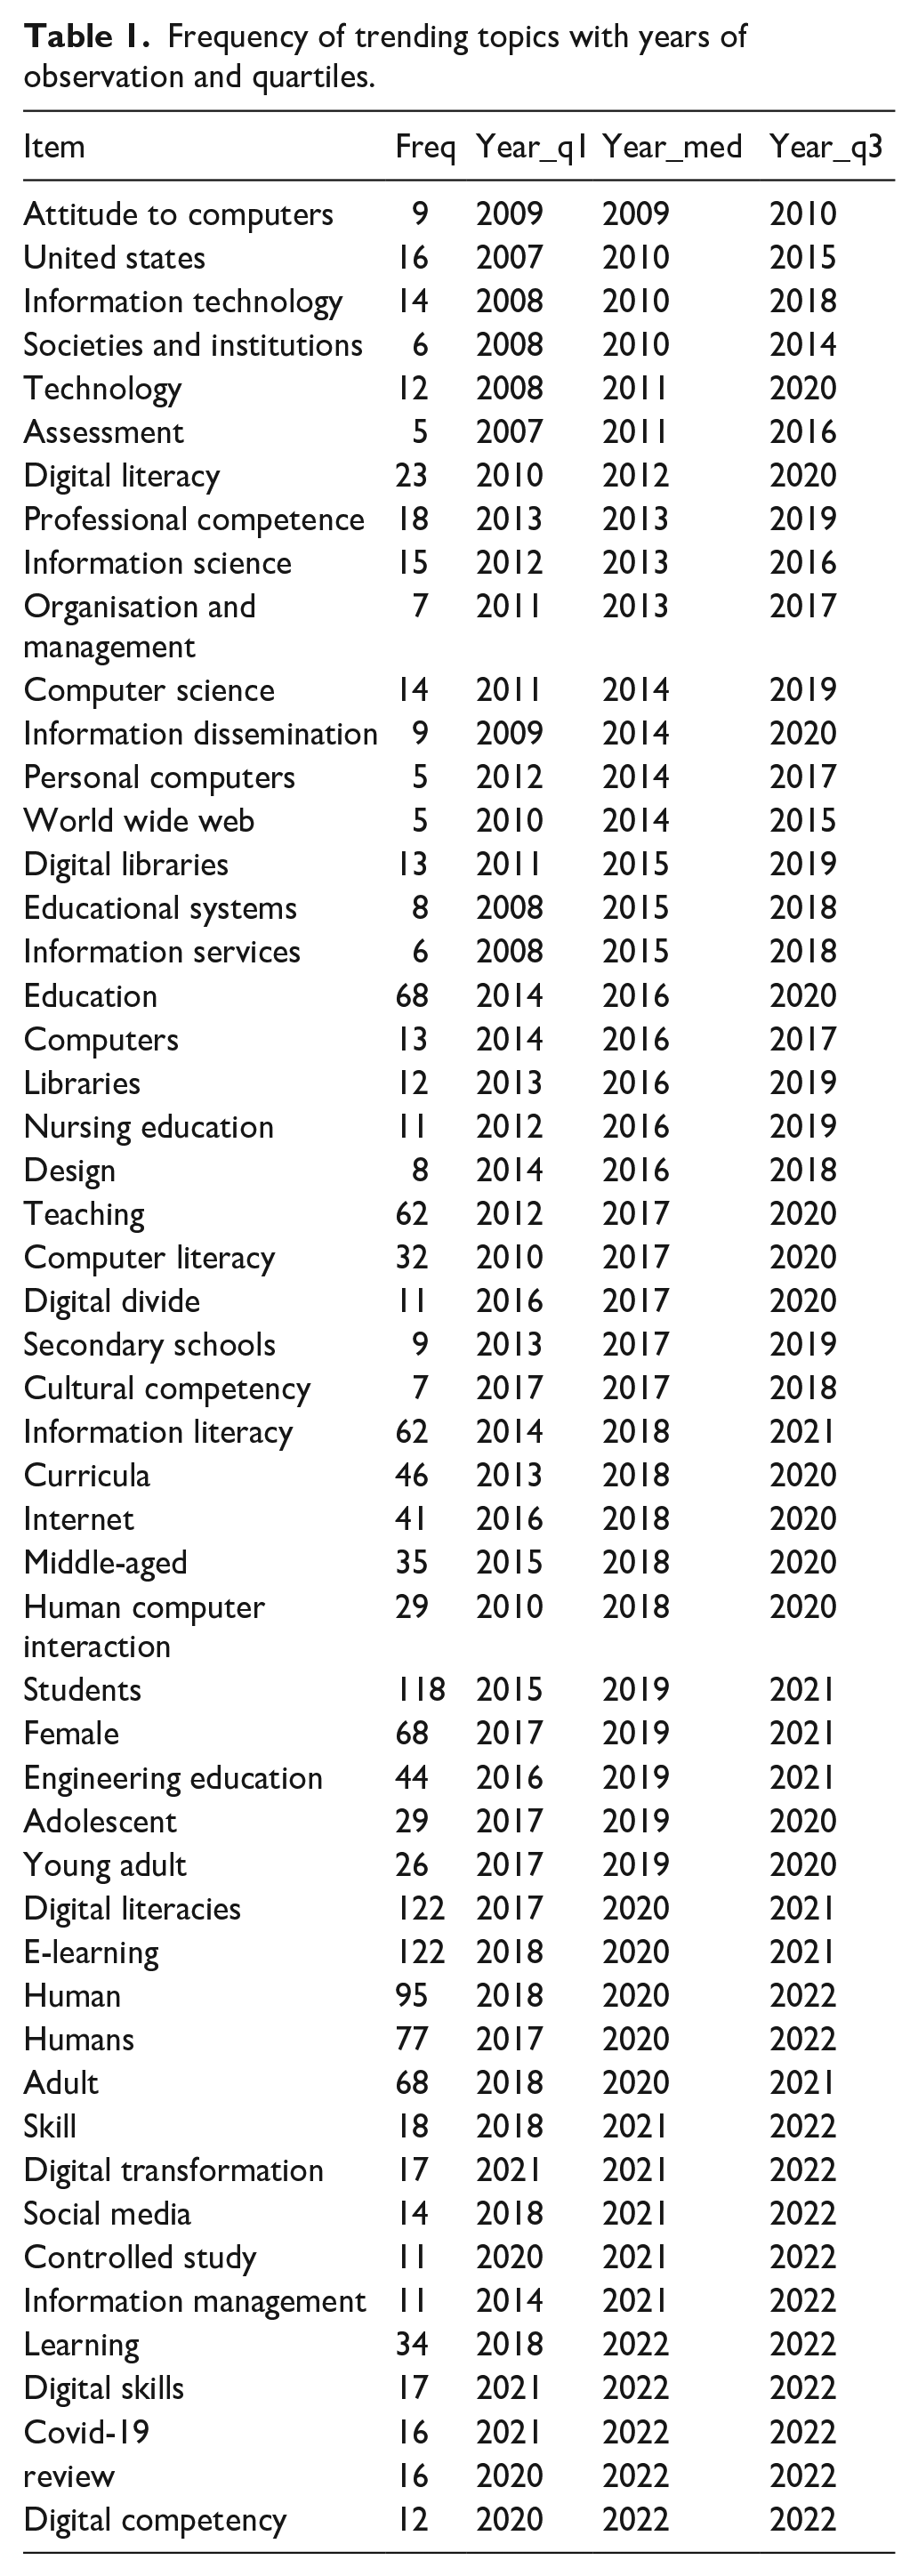
Year_q1: The year that represents the first quartile or 25th percentile. This is found by taking the integer value of (N + 1)/4, where N is the total number of years for that item, and then selecting the year corresponding to that position. Year_med: The year that represents the median or 50th percentile. This is found by taking the integer value of (N + 1)/2, where N is the total number of years for that item, and then selecting the year corresponding to that position. Year_q3: The year that represents the third quartile or 75th percentile. This is found by taking the integer value of 3(N + 1)/4, where N is the total number of years for that item, and then selecting the year corresponding to that position. For example, consider the term ‘attitude to computers’ in the table. The total number of years for this item is 9. To determine the year_q1, we calculate (9 + 1)/4 = 2.5, giving us the second year in the sorted list, 2009. To determine the year_med, we estimate (9 + 1)/2 = 5, which provides us with the fifth year in the sorted list, also 2009. To determine the year_q3, we calculate 3(9 + 1)/4 = 7.5, giving us the seventh year in the sorted list, 2010. This process is repeated for each item in the table to determine the year_q1, year_med and year_q3. The dataset’s trend topics are information technology, education and digital literacy. These topics have been researched over the past decade, and their frequency has increased. Regarding information technology, the topic with the highest frequency is ‘digital literacy’, with a frequency of 23. It has been researched from 2010 to 2020, with the highest frequency occurring in 2018. The second most frequent topic is ‘technology’, with a frequency of 12. It has been researched from 2008 to 2020, with the highest frequency occurring in 2011. The education-related topics have the highest frequency in the dataset. The topic with the highest frequency is ‘education’, with a frequency of 68. It has been researched from 2014 to 2020, with the highest frequency occurring in 2016. The second most frequent topic is ‘teaching’, with a frequency of 62. It has been researched from 2012 to 2020, with the highest frequency in 2017. The third category of topics is related to digital literacy, with ‘digital literacies’ having the highest frequency of 122. It has been researched from 2017 to 2021, with the highest frequency occurring in 2020. The second most frequent topic is ‘e-learning’, with a frequency of 122. It has been researched from 2018 to 2021, with the highest frequency occurring in 2020. The dataset shows that research on these topics has increased. For example, ‘education’ and ‘teaching’ have been researched from 2014 to 2020, with an increase in frequency in the later years. ‘digital literacies’ and ‘e-learning’ has been analysed from 2017 to 2021, with an increase in frequency in the last years. Additionally, the dataset includes burgeoning topics like ‘digital transformation’ and ‘digital skills’.
The code generates a box plot in Figure 1, visualising the frequency of trending topics along with the years of observation and quartiles. The data has four lists: ‘topics’, ‘freq’, ‘year_q1’, ‘year_med’ and ‘year_q3’. These lists contain relevant information about the topics, frequency and years. Specific topics’ popularity and occurrence over the years are shown in the plot. Box plots offer insights into the spread and distribution of the data. The quartiles and outliers are distinguished using different colours and patterns for the boxes and markers. Plotting the frequency of trending topics against the years observed allows for identifying patterns and outliers, and comparisons can be made.
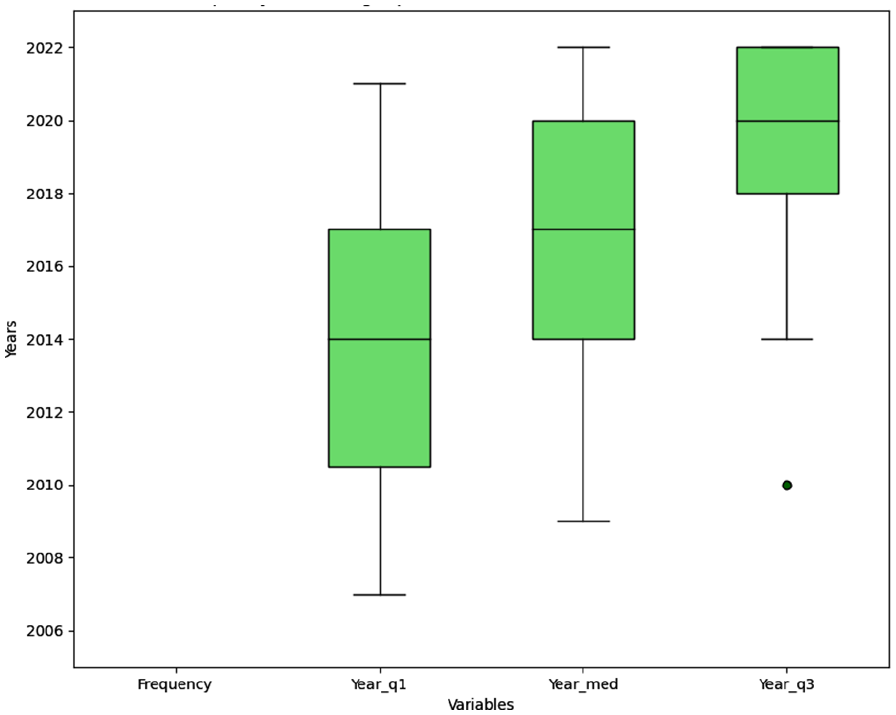
Frequency of trending topics with years of observation and quartiles.
Clustering of journals by frequency and estimated number of articles using Bradford’s Law
We can use Bradford’s Law (Brookes, 1977) to analyse source clustering. This bibliometric Law states that the number of articles published in a specific field or topic is distributed among a few core journals and a more significant number of less-cited journals. Bradford’s Law can be expressed mathematically as follows:

Where:
○ Nn is the number of journals in the nth zone.
○ N1 is the number of journals in the first zone.
○ n is the zone number
○ z is a constant, typically around 3
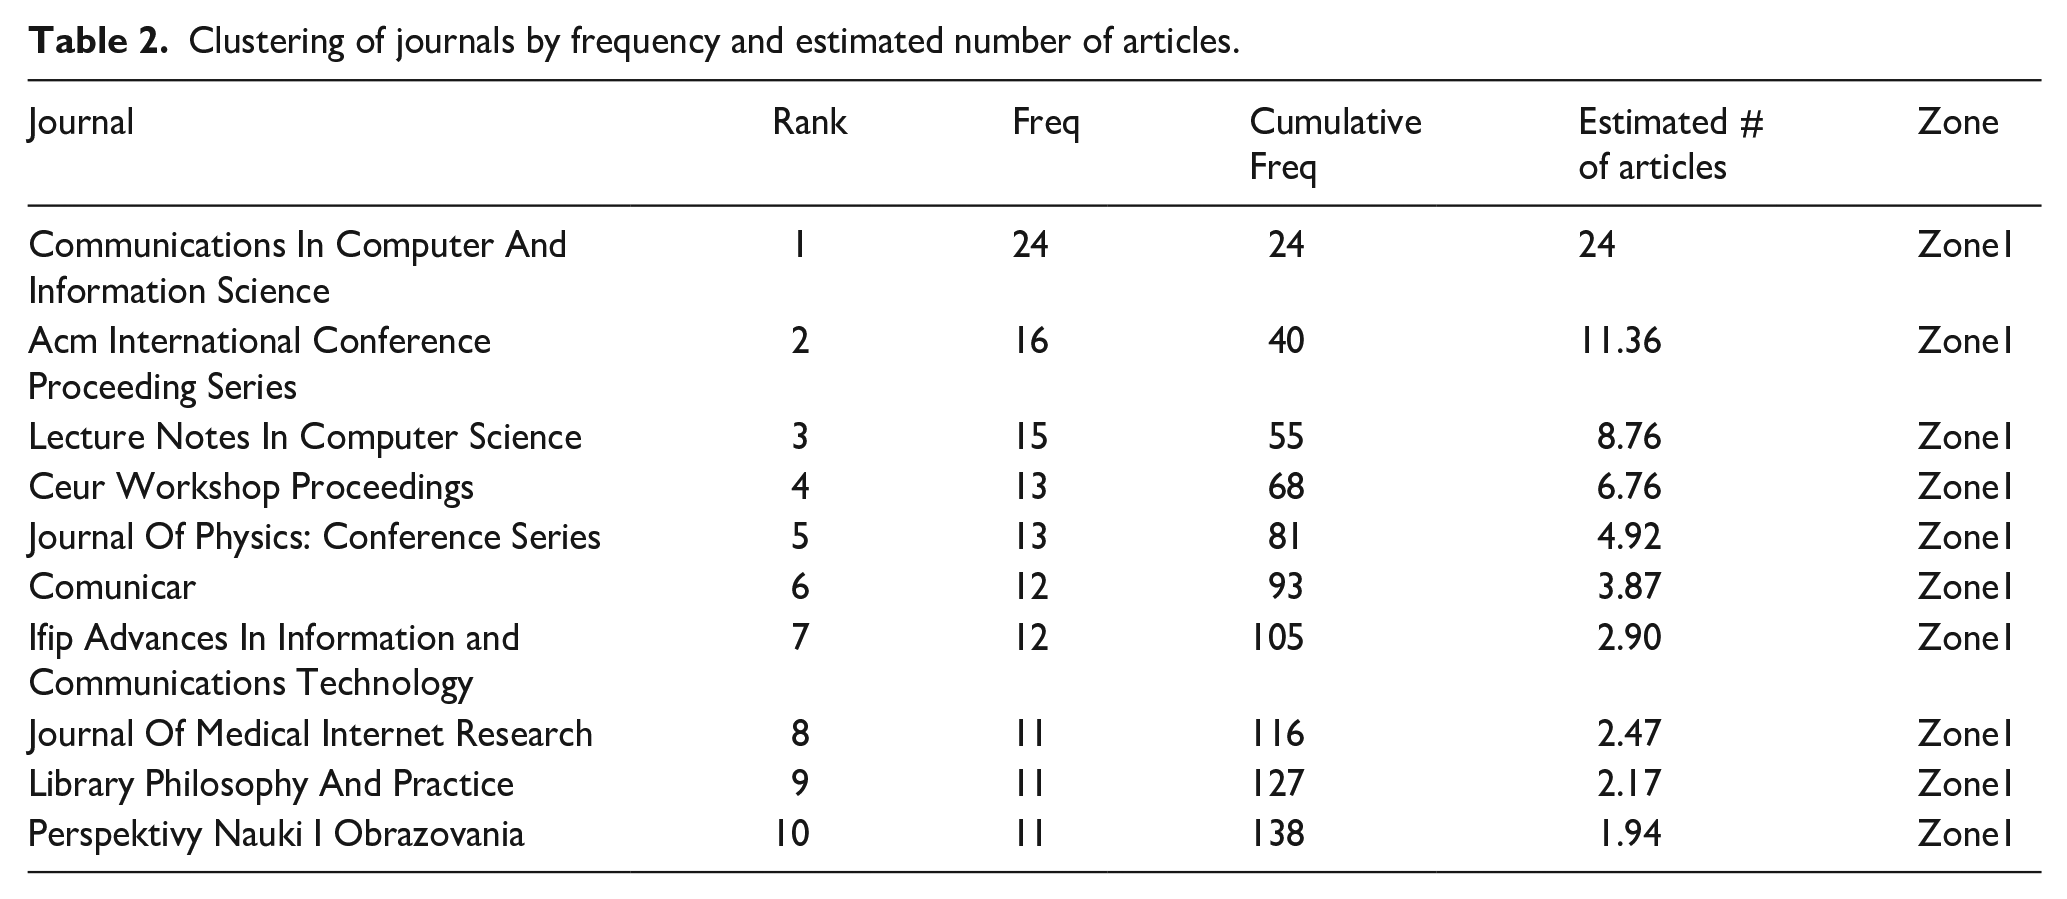
According to Bradford’s Law, the number of journals covering a specific topic can be divided into three zones: the first contains a few cited journals, the second includes a more significant number of less-cited journals, and the third contains many cited journals. We can see that the top 10 sources are listed with their rank, frequency and cumulative frequency. To apply Bradford’s Law, we must calculate the number of journals in each zone. We can do this by dividing the cumulative frequency of the journals by the frequency of the first-ranked journal. The results are shown in the table below:
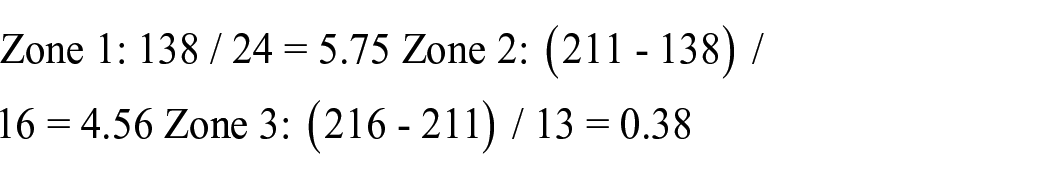
According to Bradford’s Law, the first zone should contain one-third of the total number of journals, the second zone should contain two-thirds, and the third zone should have the remaining journals. Here, we can see that the number of journals in each zone is close to the predicted values. Therefore, the data follow Bradford’s Law, and the sources are clustered according to this Law. The data indicates that Zone 1 has a limited number of cited sources. This clustering pattern is consistent with Bradford’s Law. Also, Bradford’s Law is a principle that states that the number of articles in a subject area is proportional to the square of the rank of the journals in which they appear. It can be represented as follows:
Cn = C1*n^(b), Cn is the number of articles in the nth journal, C1 is the number of articles in the first journal, n is the journal’s rank, and b is a constant that depends on the subject area. We need to calculate each journal’s cumulative frequency by applying this formula to the data for further processing. The cumulative frequency is the sum of the frequencies of the journal and all the journals that come before it in the ranking. To find the value of the constant b, we need first to find the value of C1, which is the number of articles in the first journal. Here, C1 is 24, the number of articles in the first journal, ‘Communications In Computer And Information Science’. We can then solve for b using any two data points. Let’s use the first and fourth journals.


Now that we have b, we can use the formula to estimate the number of articles in each journal:
The estimated number of articles for each journal is calculated using the following formula:

For example, to estimate the number of articles in the second journal, ‘Acm International Conference Proceeding Series’, we use the formula with n = 2 and b = 1.21:

The estimated number of articles is not exact, but it provides a rough idea of the relative number of articles that can be expected in each journal based on Bradford’s Law. Based on the trend analysis of the data provided, we can observe that most articles are concentrated in the top few journals, while the lower-ranked journals have much smaller articles. This is consistent with Bradford’s Law, which suggests that the distribution of articles in a subject area follows an exponential curve. The estimated number of articles for each journal also supports this trend, with a significant drop in the number of articles as we move down the rank of journals. We can also see that some journals, such as ‘Communications In Computer And Information Science’ and ‘Acm International Conference Proceeding Series’, have more articles than others, showing that they are significant contributors to the subject area. It is worth noting that Bradford’s Law is not universal and may only apply to some subject areas. This statistical principle approximates article distribution in a subject area. Therefore, further analysis and research may be required to draw more definitive conclusions about the trends in this subject area.
The code provided generates in Figure 2, four subplots using Matplotlib to visualise the data on journal rankings, frequencies, cumulative frequencies, estimated number of articles and zones of journals. The first subplot, ‘Frequency of Journals’, displays a bar chart showing the frequency of journals ranked from 1 to 10. This plot allows us to compare the frequencies of different journals. The second subplot, ‘Cumulative Frequency of Journals’, presents a bar chart illustrating the cumulative frequency of journals up to each rank from 1 to 10. This plot provides an understanding of the overall distribution of frequencies among the journals. The third subplot, titled ‘Estimated Number of Articles’, exhibits a bar chart showing each journal’s estimated number of articles, ranging from 1 to 10. This plot helps visualise the estimated contribution of each journal in terms of article count. In the fourth subplot, a pie chart titled ‘Zones of Journals’ exhibits how journals are distributed across different zones. The generated plots offer valuable insights into the characteristics and distribution of the given journals. They allow us to analyse the frequencies, cumulative frequencies, estimated article counts and zones of the journals. These plots help identify popular journals, assess their contribution in terms of articles and understand their distribution across different zones. The visualisations assist researchers in making informed decisions and gaining a comprehensive understanding of the journal landscape.
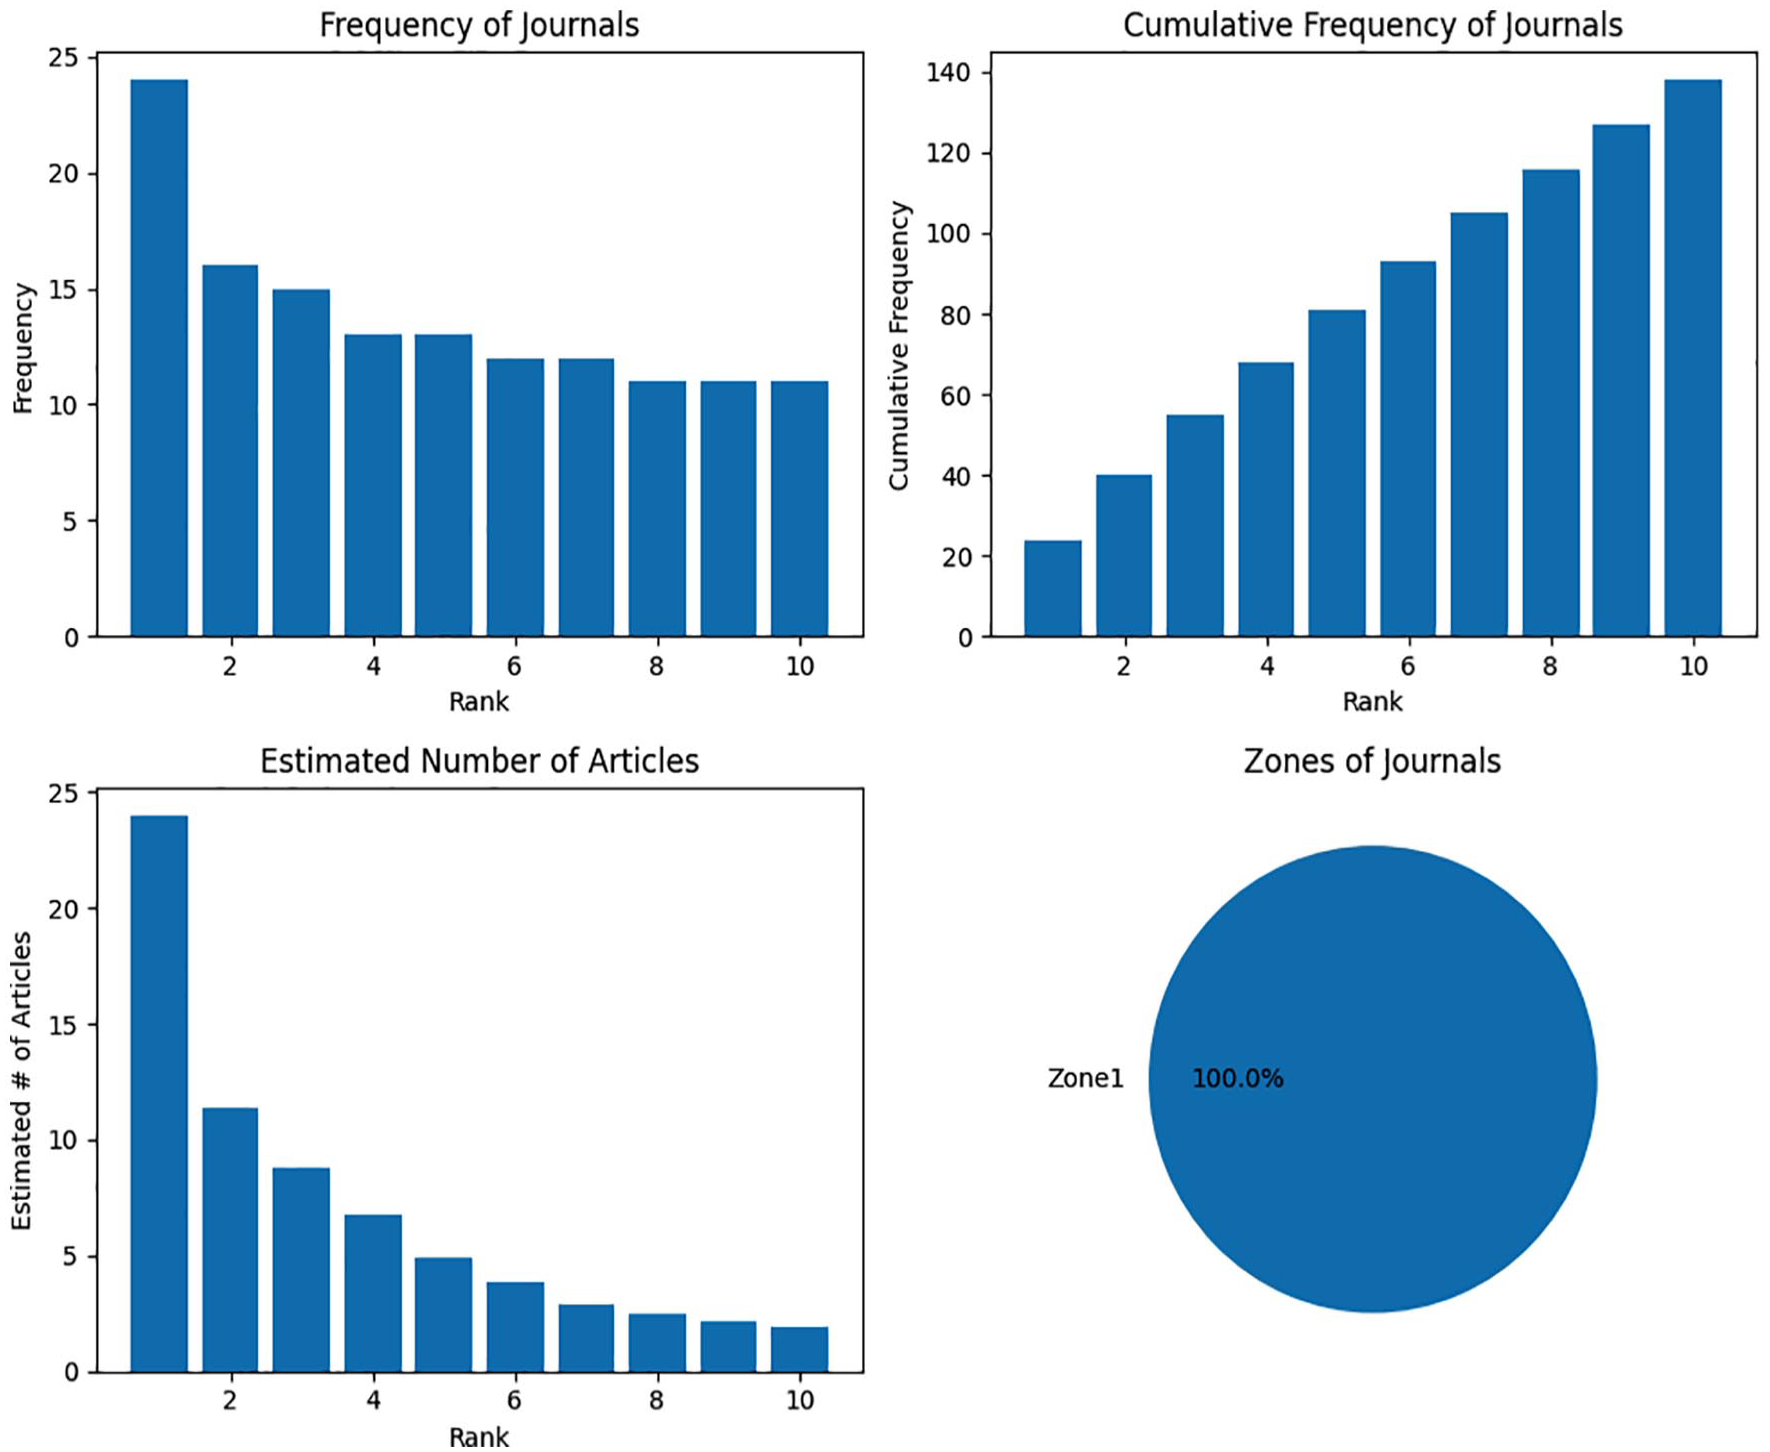
Clustering of journals by frequency and estimated number of articles.
Author productivity through Lotka’s Law
Lotka’s bibliometric Law states that the number of authors who publish a certain number of documents is inversely proportional to the square of that number. In other words, there are twice as many authors who publish one document as there are authors who publish two papers, three times as many authors who publish one document as there are authors who publish three documents, and so on.
This Law can be expressed mathematically as follows:

Where:
○ n(x) is the number of authors who publish x papers.
○ c is a constant
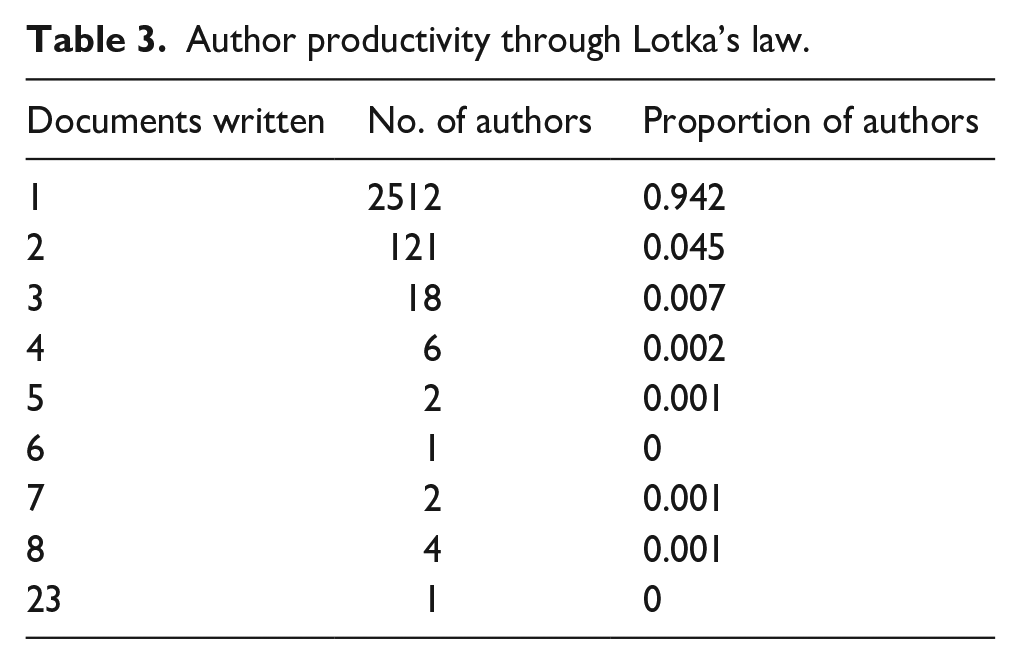
The data provided in Table 2 shows the dispersion of documents written by different numbers of authors and the proportion of authors in each category.
Clustering of journals by frequency and estimated number of articles.
In Table 3, a single author wrote most documents (94.2%), while the proportion of documents written by multiple authors decreases as the number of authors increases. Strikingly, the proportion of documents written by two authors (4.5%) plummeted compared to those reported by a single author. This may suggest that collaboration between two authors is less joint than individual writing or writing with over two authors. The data also shows that documents written by three or more authors account for only a tiny proportion of the total (less than 1% each). This could be due to several factors, such as the difficulty of coordinating multiple authors, differences in writing styles and approaches, or a preference for individual authorship in specific fields or disciplines. The data suggest that a single author writes most of the documents and that collaboration between two authors is less common. While documents written by multiple authors account for only a tiny proportion of the total, they may still be necessary in particular fields or disciplines where collaboration is valued. Lotka’s Law is a power law that describes the relationship between the number of authors who have published ‘n’ papers and the number of authors who have published a single paper. Lotka’s Law is expressed as:
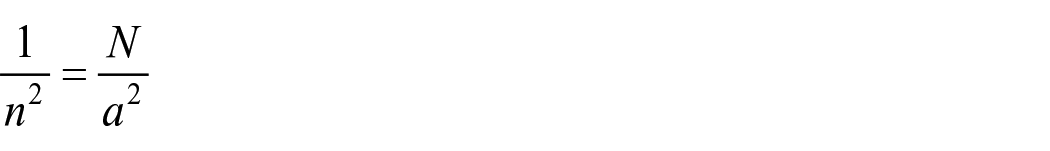
Author productivity through Lotka’s law.
N is the total number of authors, n is the number of papers published by an author, and a is a constant that depends on the discipline or field of study. A value can be estimated by fitting the observed data to the power law equation using regression analysis. Using the data provided, we can estimate the value of a and use it to calculate the productivity of authors based on the number of papers they have published. First, we need to calculate the value of a using the proportion of authors who have published a single paper:
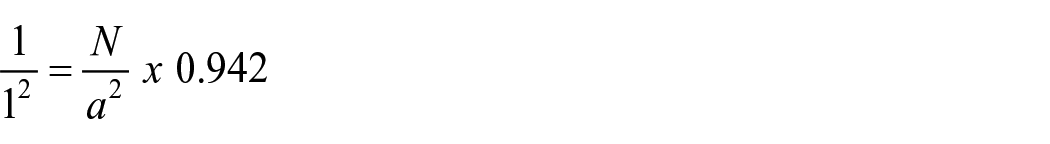
Solving for a, we get:
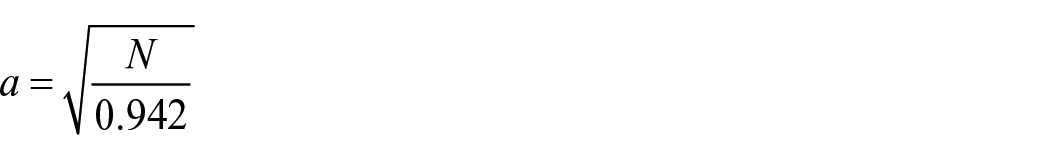
Using the value of N provided in the data, we can calculate an as:
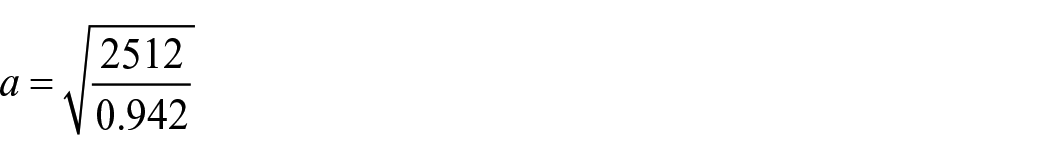
a = 51.24
Now that we have the value of a, we can use Lotka’s Law to calculate the expected number of authors who have published n papers:
Solving for N, we get:
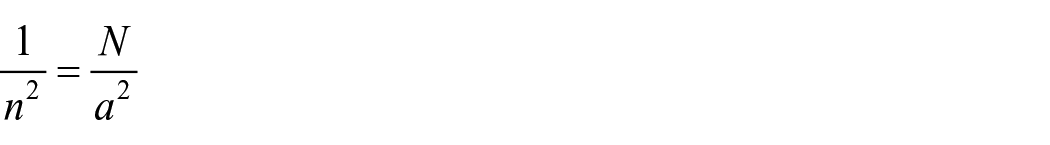
Using this equation, we can calculate the expected number of authors who have published two papers:
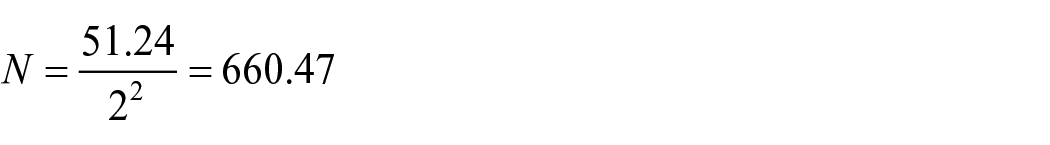
we can calculate the expected number of authors who have published three papers:
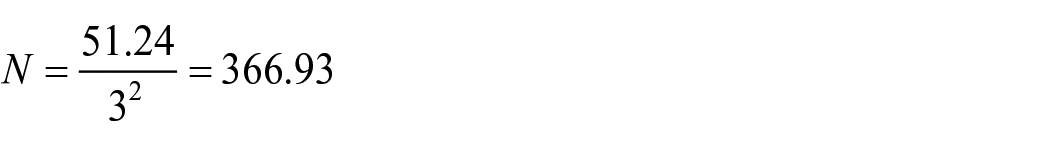
And so on for other values of n. This allows us to estimate the productivity of authors based on the number of papers they have published and to compare the observed distribution of authors with the expected distribution based on Lotka’s Law.
The Python code provided uses the matplotlib library in Python to create a scatter plot in Figure 3 visualising author productivity based on Lotka’s Law. Lotka’s Law is a principle that states the productivity of authors follows a power-law distribution. The given data consists of three lists: ‘documents_written’, ‘num_authors’ and ‘proportion_authors’. These lists represent the number of documents written, the corresponding number of authors, and the proportion of authors for each document count, respectively. The code calculates the Lotka’s Law values by taking the reciprocal of each value in the ‘documents_written’ list and storing them in the ‘lotka_law_values’ list. The scatter plot is generated using ‘plt.scatter()’ with ‘num_authors’ on the x-axis, ‘lotka_law_values’ on the y-axis, a marker size of 80, blue colour and black edge colour. The x-axis and y-axis scales are set to logarithmic using ‘plt.xscale(‘log’)’ and ‘plt.yscale(‘log’)’ to better visualise the data distribution according to Lotka’s Law. This plot visualises the application of Lotka’s Law, an empirical law in information science that describes the productivity distribution among authors. It states that the number of authors who have written a certain number of documents follows a specific power-law relationship. The plot allows us to examine the relationship between the number of authors and the inverse number of documents written. Using a logarithmic scale, we can more efficiently observe any potential patterns or trends in the data. For future research, we could analyse the scatter plot to gain insights into the productivity distribution among authors. It could explore how well the data fits the power-law relationship predicted by Lotka’s Law and assess any deviations from it.
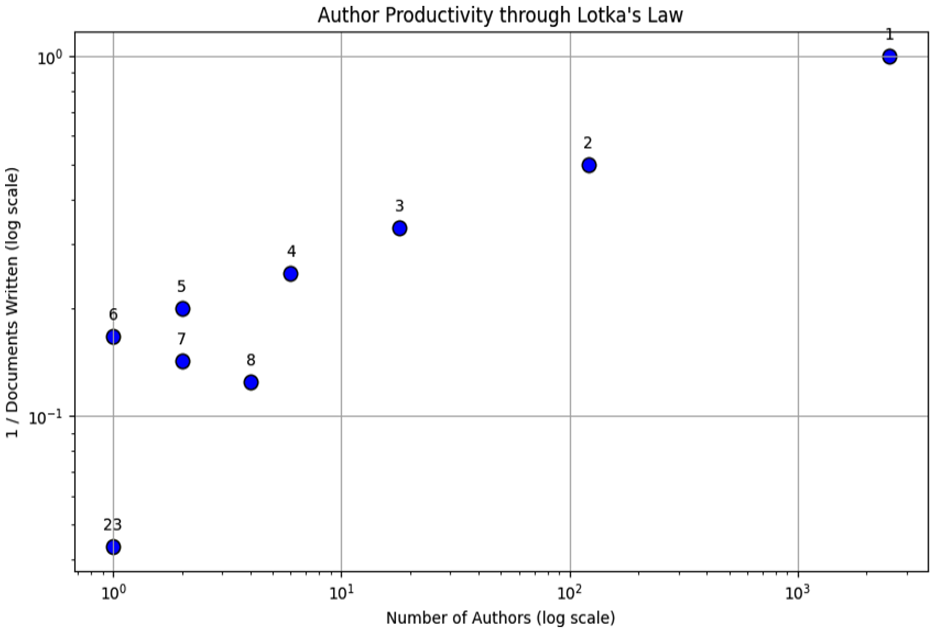
Author productivity through Lotka’s law.
Most frequent words with minimum occurrence of 10
After analysing the most frequent words in Table 4 with at least 10 occurrences, we can observe that digital literacy and e-learning are the most commonly discussed topics, with 122 occurrences each. Students, human, adult and education are other occurring terms. COVID-19 has been an essential topic of discussion, with 17 occurrences, digital skills and digital transformation. Information literacy, teaching and health literacy have also been discussed, with 62, 62 and 55 occurrences.
Most frequent keyword plus in research articles with minimum occurrence of 10.
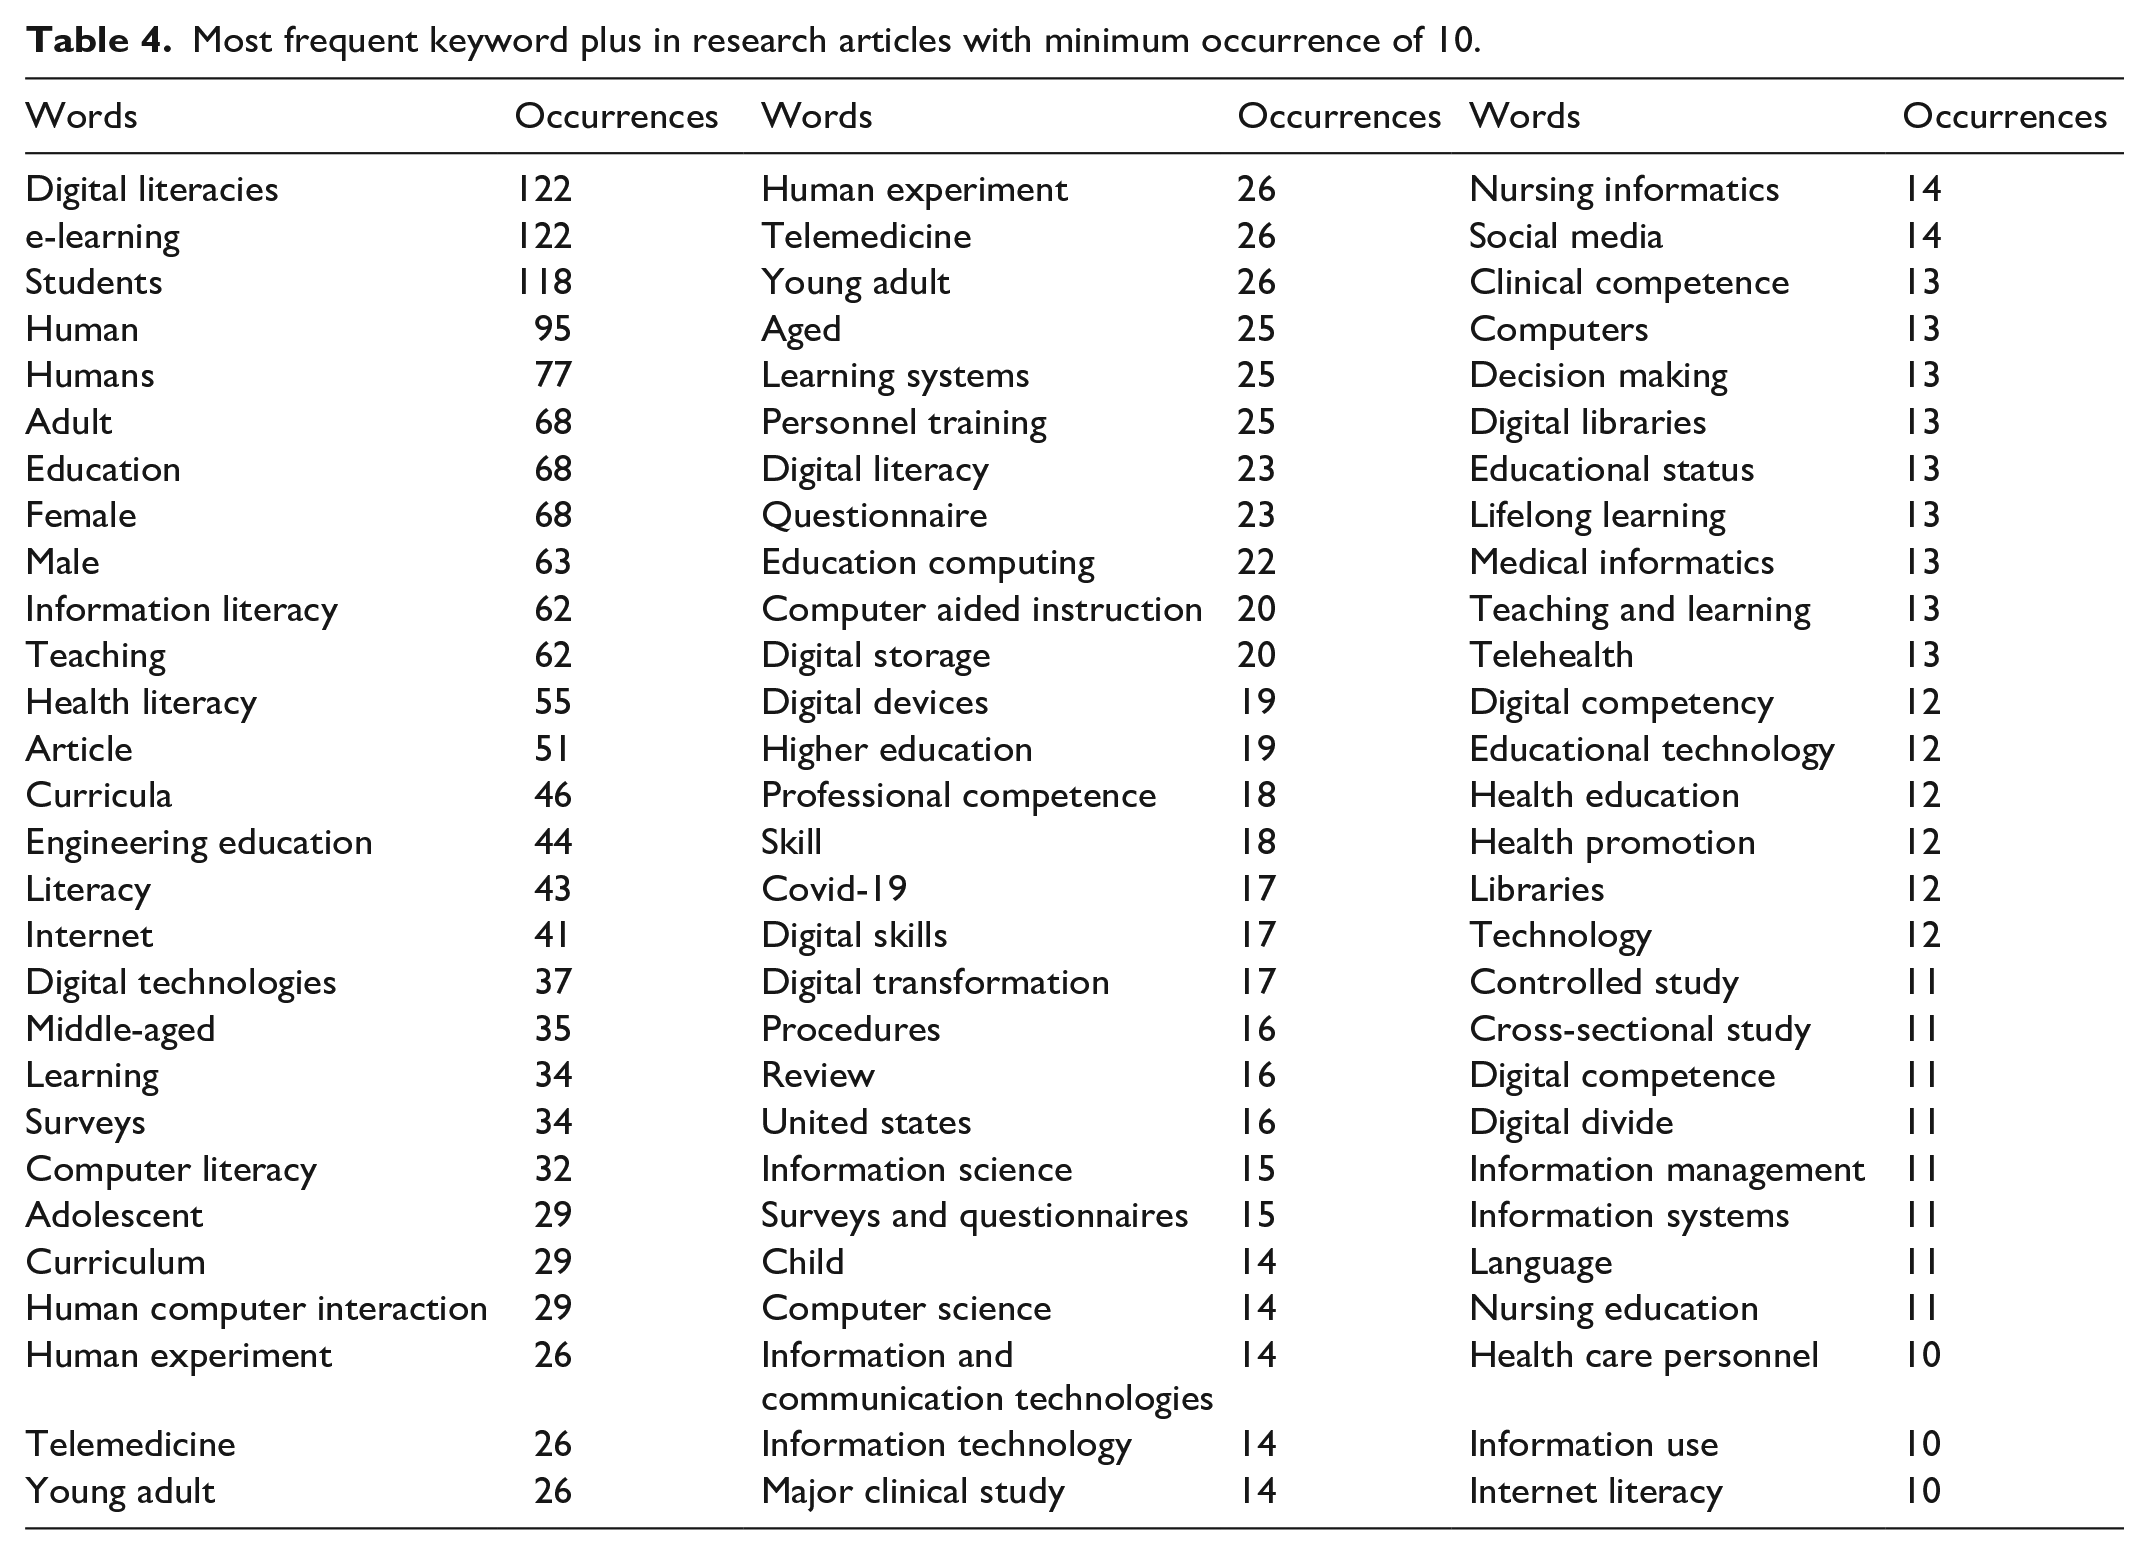
The table also shows that various research areas apply to digital literacy and e-learning, including information science, surveys and questionnaires, computer science, nursing informatics and social media. The discussion of technology-related terms such as digital technologies, computers, information technology, digital libraries and technology shows that integrating technology in education and health is a crucial area of research. The table reveals that studying different age groups and personnel training is also relevant to digital literacy and e-learning. Terms such as adolescent, middle-aged, young adult, aged and health care personnel appear in the list. The analysis of the most frequent words in the table suggests that the research on digital literacy and e-learning has diverse areas of interest, from technological advancements to health and education-related topics. The COVID-19 pandemic has impacted the field, resulting in many studies exploring its effects on digital literacy and e-learning.
The expected result is in Figure 4, with four subplots, each showing a different type of plot: a bar plot, a pie plot, a horizontal bar plot and a scatter plot. The plots will represent the data provided in the keywords and occurrences lists. The given code uses the ‘matplotlib’ library in Python to create a figure with four subplots, each displaying different plots based on the provided data. The data consists of a list of keywords and their corresponding occurrences. The keywords are: ‘digital literacies’, ‘e-learning’, ‘students’, ‘human’ and ‘adult’. The corresponding occurrences for each keyword are 122, 122, 118, 95 and 68. Bar Plot: The first subplot displays a bar plot. It represents the occurrences of different keywords on the x-axis and the frequency of their occurrence on the y-axis. This plot allows us to quickly compare the frequencies of different keywords and identify the most frequent ones.
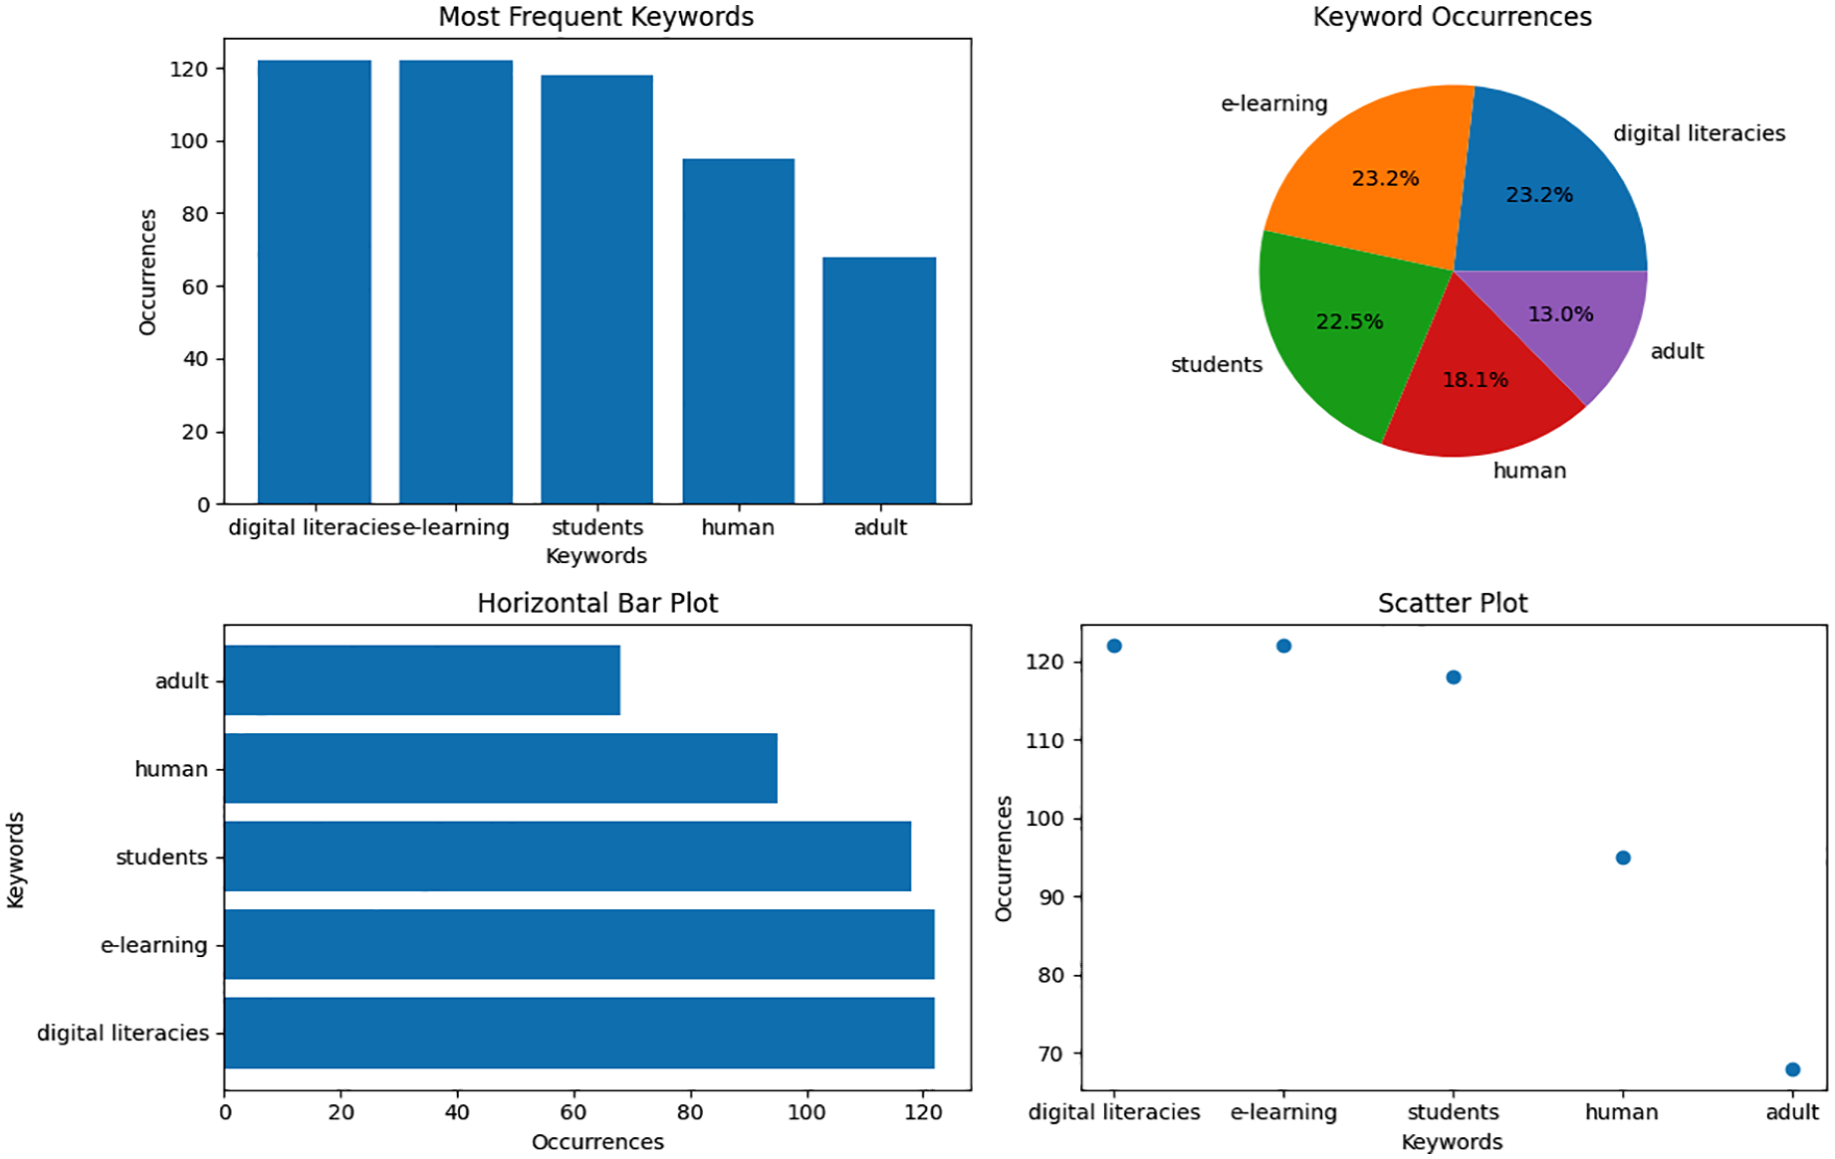
Most frequent words.
Pie Plot: The second subplot shows a pie plot. It represents the keyword occurrences as slices of a pie. Each slice represents a keyword, and the size of the slice indicates the proportion of occurrences for that keyword. This plot helps visualise the distribution of keyword occurrences and identify each keyword’s relative importance. Horizontal Bar Plot: The third subplot presents a horizontal bar plot. It displays the keyword occurrences on the x-axis and the keywords on the y-axis. This plot allows us to compare the occurrences of different keywords in a horizontal orientation, making it helpful in identifying the keywords with the highest and lowest frequencies. Scatter Plot: The fourth subplot exhibits a scatter plot. It represents the relationship between keywords and their occurrences. Each point in the scatter plot represents a keyword, with its x-coordinate indicating the keyword and the y-coordinate representing the occurrence count. This plot allows us to observe any patterns or correlations between keywords and their frequencies. Using these four types of plots, we can comprehensively understand the data, including the distribution, frequency and relationships between keywords and their occurrences.
Based on Table 5, the number of citations for RPYS research has increased over the years, with some fluctuations. For example, from 2002 to 2008, the number of citations increased from 626 to 1432. The number of citations experienced a minor decrease in 2009 and 2014, yet still managed to climb to its apex in 2018 with 2525 citations. However, in the last few years, there has been a decline in the number of citations, with only 1087 citations in 2021 and 243 citations in 2022. The ‘diffMedian5’ column in the table represents the difference in the median number of citations for a specific year compared to the previous five-year period. A positive value shows an increase in the median number of citations, while a negative value suggests a decrease.
Citation trends and median citation change in reference publication year spectroscopy (2002-2022).
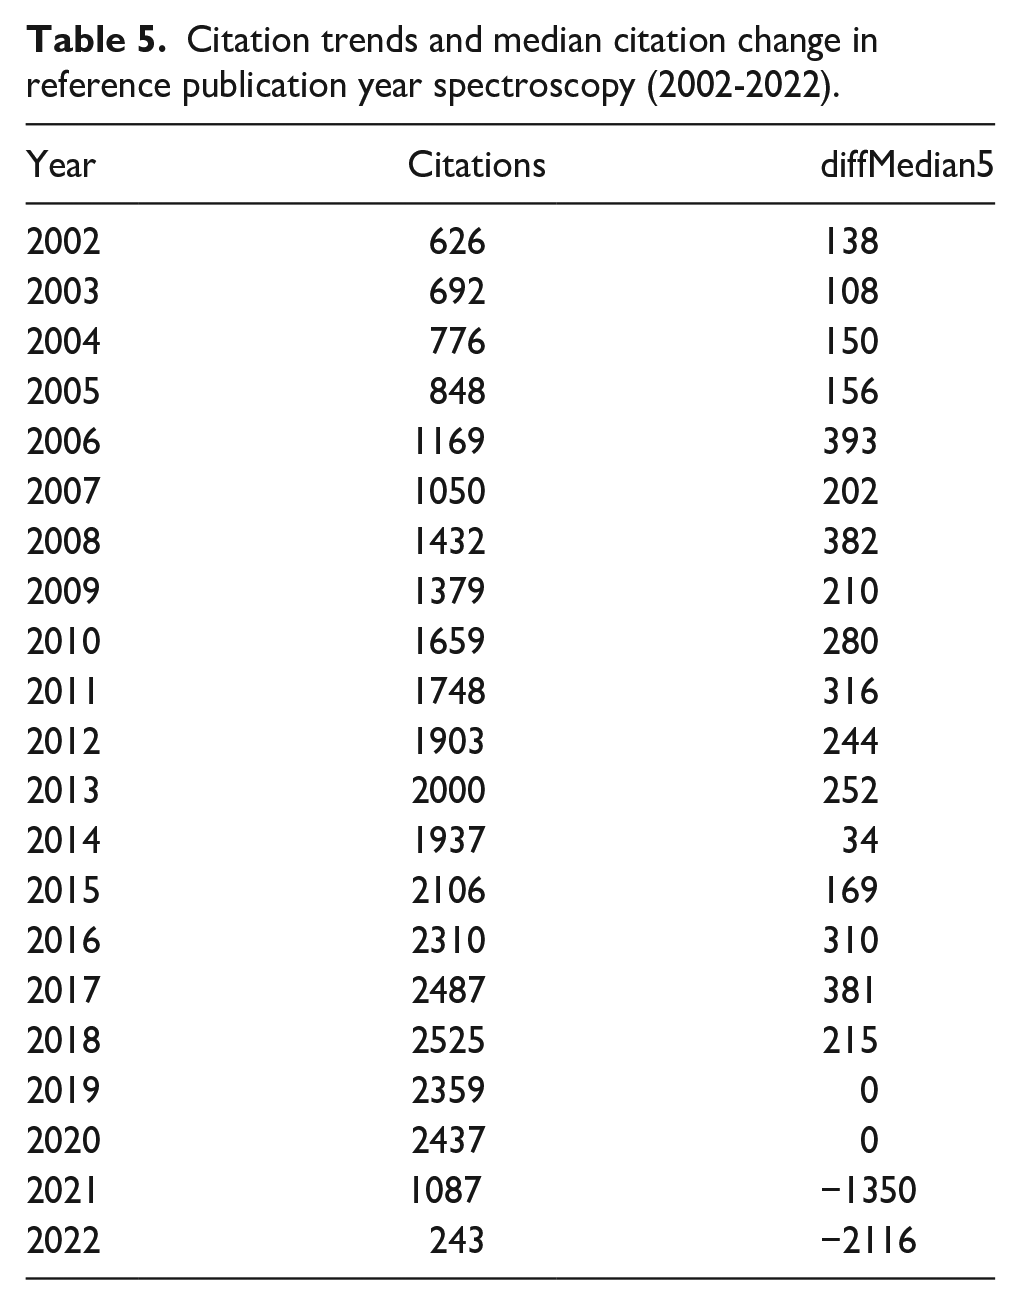
Interestingly, the increase in citations from 2006 to 2011 was accompanied by an increase in the median number of citations, with the most significant growth occurring in 2006–2007. However, since 2013, the median number of citations has been stable or declining, with the largest decrease occurring in 2021–2022. These results suggest that RPYS research has received increased attention over the years. Still, there has been a recent decline in interest, as reflected in the lower number of citations and decreasing median number of sources.
‘Frequency of Trending Topics with Years of Observation and Quartiles’ is the first plot that shows the frequency of trending topics along with quartiles for the years of observation. In Figure 5, Box plots display quartiles (Year_q1, Year_med, Year_q3) and topic frequency. By looking at the plot, you can see the distribution and trends of the topics and their observation years. ‘Citation Trends and Median Citation Change in Reference Publication Year Spectroscopy (2002-2022)’ is the name of the second plot, which shows the citation trends and median citation change for a specific publication area over the years. Each year’s count of citations and median citation change are shown on the line plot. It helps visualise the growth or decline in citations and the relative change in median citations. The first plot with box plots and quartiles provides insights into trending topics’ distribution and observation periods. It highlights the variability in observation years and their frequency, allowing us to identify issues that have been trending over a longer duration or more recently. The second plot shows the citation trends and the median citation change in a specific field over 20 years. It helps track the citation counts and understand the relative pattern shift. The plot can identify increased or decreased citation activity periods and explore the correlation between citation counts and median citation change. Both plots offer valuable visualisations to analyse trends and patterns in the data. They help understand the dynamics and characteristics of the topics and citations.
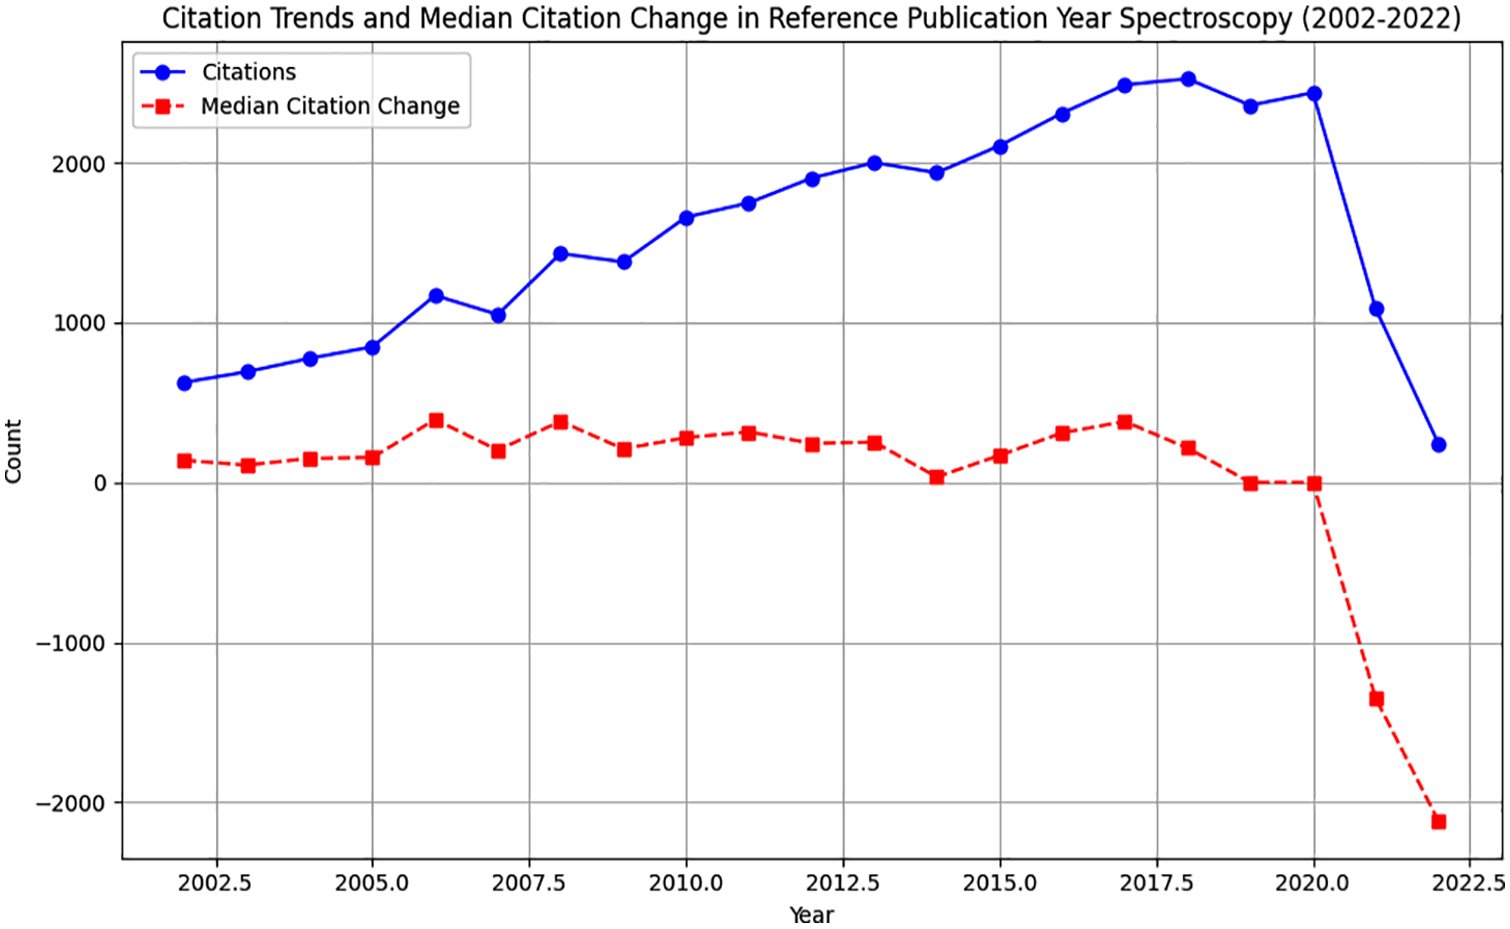
Citation trends and median citation change in reference publication year spectroscopy (2002-2022).
Word dynamics
In Table 6, the data represents the frequency of certain words related to education and technology from 2005 to 2022. The data defines the trend of increasing the use of digital technologies in education and increasing awareness of digital literacy and e-learning. The data shows that the frequency of words related to digital literacy, e-learning and information literacy has increased. For example, in 2005, the frequency of occurrence of the term ‘digital literacies’ was 0, but it grew to 122 in 2022. But the frequency of the word ‘e-learning’ has risen from 0 in 2005 to 122 in 2022. This shows that digital technologies have become an integral part of the education system, and e-learning has gained much importance in recent years.
Trends of keyword shifting.
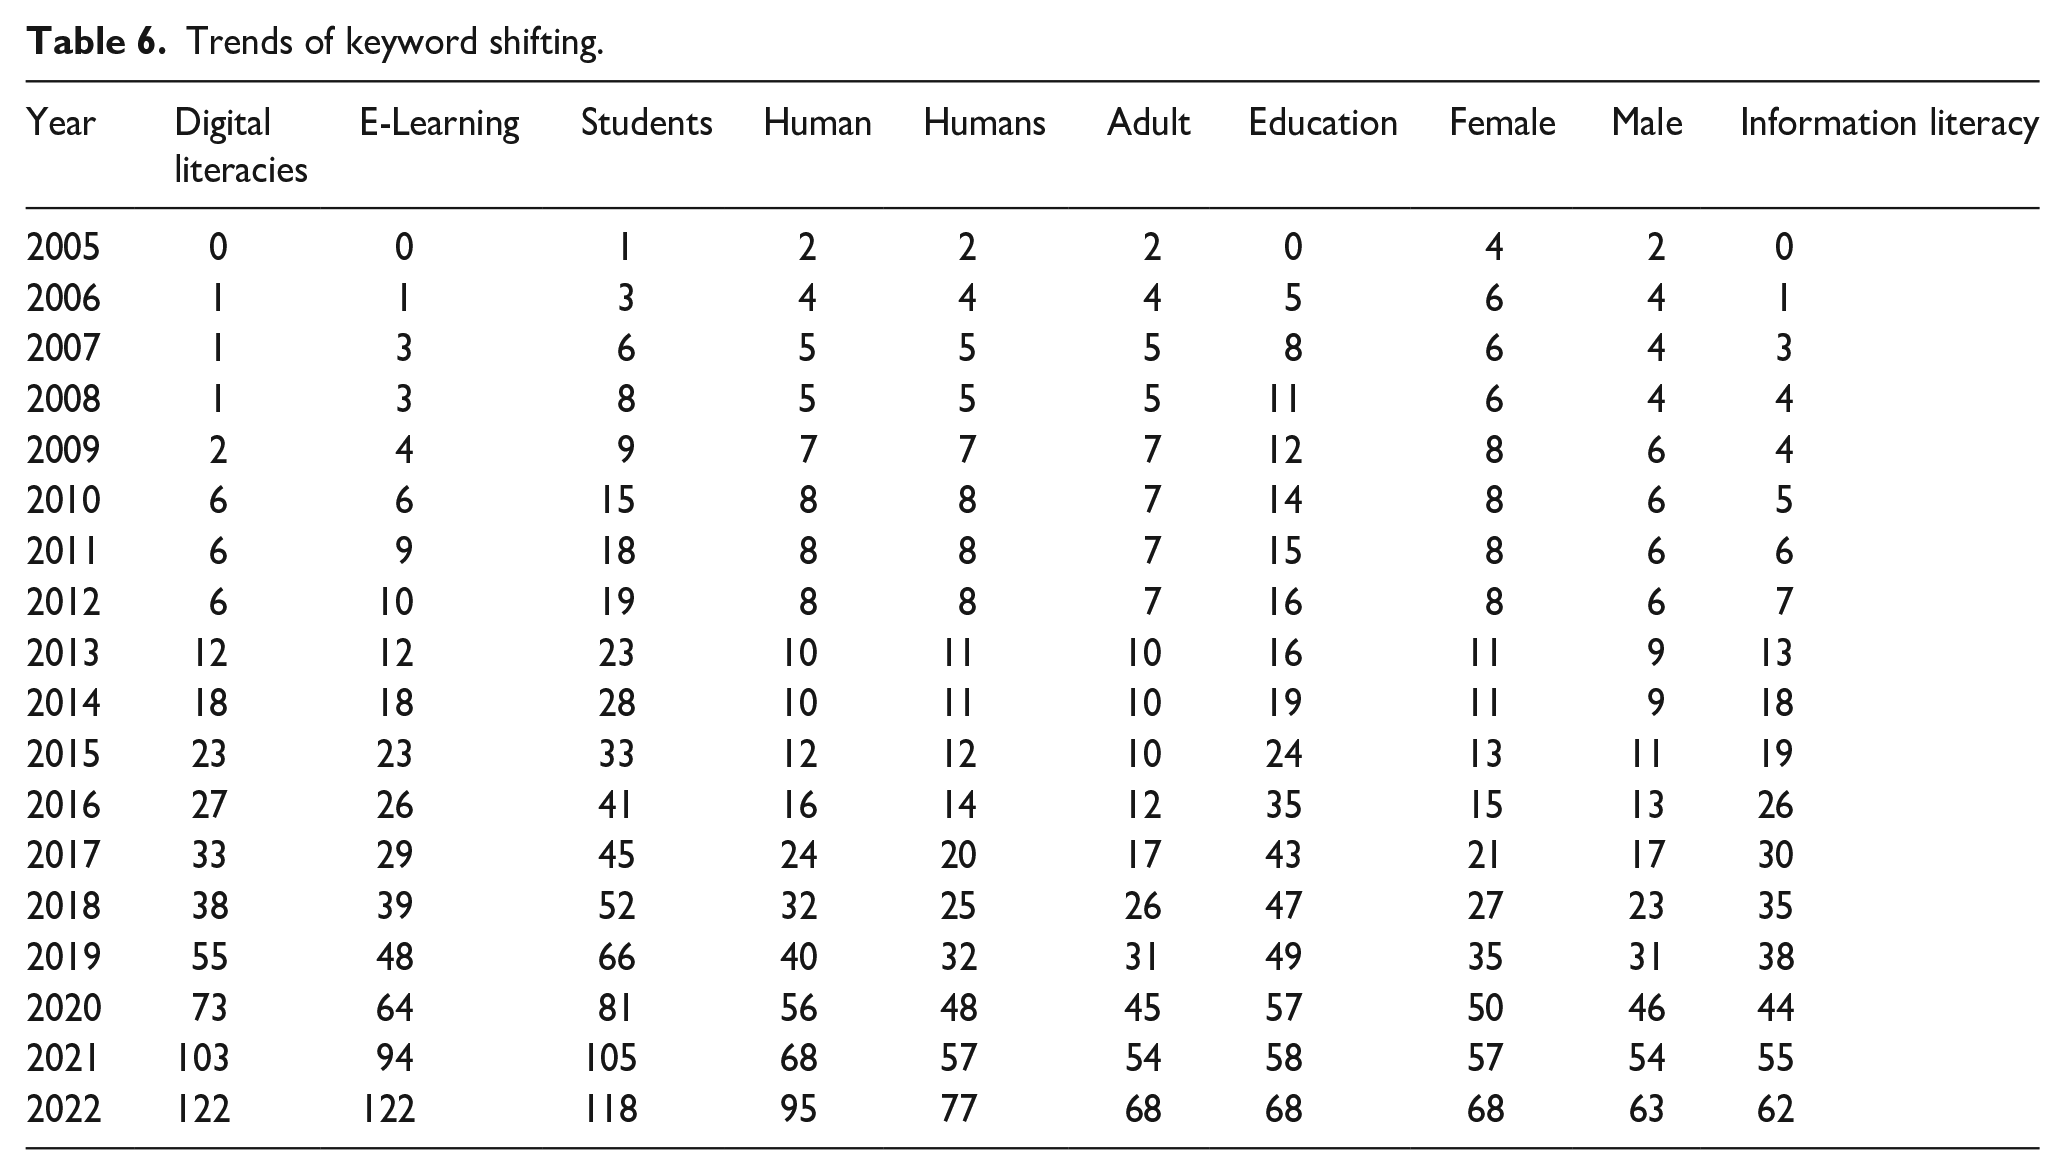
The data also shows that the frequency of occurrence of words related to students, adult education, female and male has increased. It indicates that education is becoming more inclusive and accessible to all, and the focus is shifting towards educating all age groups and genders. The data suggest a growing interest and awareness of the importance of digital literacy and e-learning in education, and there is an increasing focus on making education more accessible and inclusive.
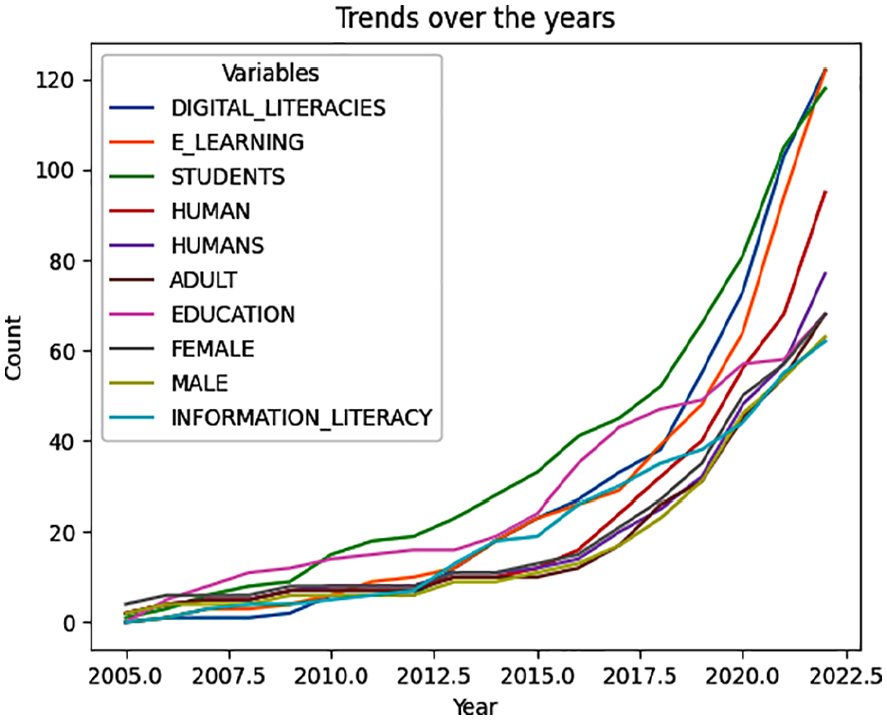
The code output will be a line plot showing the trends of different variables over the years. A separate-coloured line represents each variable. ‘Trends Over the Years’ will be the title of the plot, with ‘Year’ and ‘Count’ as the x- and y-axis labels, respectively. Variable names will be displayed in different colours on the plot legend. From 2005 to 2022, the plot will showcase changes in counts for variables like ‘DIGITAL LITERACIES’, ‘E-LEARNING’, ‘STUDENTS’, ‘HUMAN’, ‘HUMANS’, ‘ADULT’, ‘EDUCATION’, ‘FEMALE’ ‘MALE’ and ‘INFORMATION LITERACY’. From Figure 6, we can observe the trends of the different variables over the years. The plot summarises how each variable has changed and evolved. It allows us to compare the growth or decline of the variables and identify any patterns or relationships between them. This information can help understand the development and impact of these variables in the context.
Trends over the year.
To calculate the dynamic of each word
We can use a mathematical formula that compares the frequency of the word in each year with its overall average frequency across all years. This formula is known as the coefficient of variation (CV) and is calculated as follows:
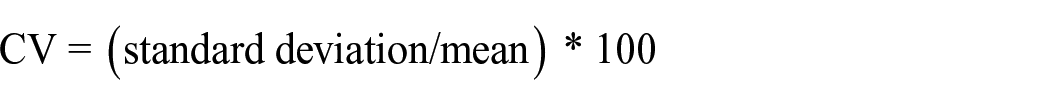
Standard deviation is the measure of how much the frequency of the word varies from year to year, and the mean is the average frequency of the word across all years.
Using this formula, we can calculate the CV for each word in Table 7 as follows:
Descriptive statistics of key variables in the study.
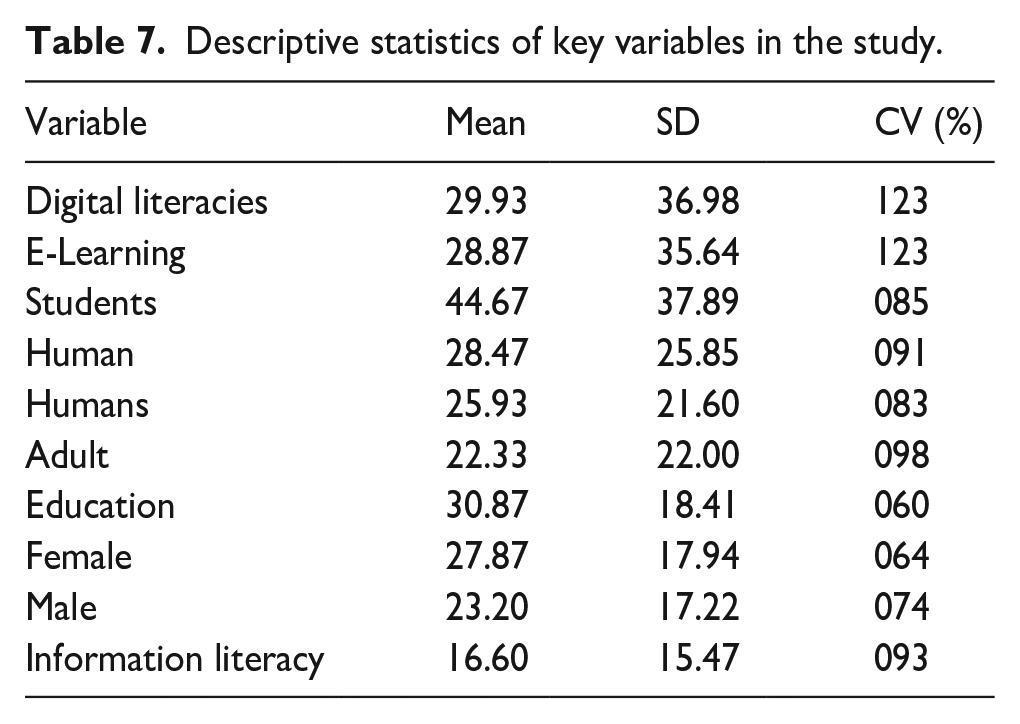
CV is calculated by dividing the SD by the mean and multiplying by 100%. It measures the relative variability of the variable compared to its mean. Looking at the table of means, standard deviations and coefficients of variation (CV), we can draw some conclusions:
Digital Literacies and E-Learning have the highest means and standard deviations, showing much variation in the data for these variables. This may suggest that there has been a lot of growth and change in these areas. Students have a high mean but a lower standard deviation and CV, showing that there has been stable growth in this area. Humans and Humans have common means and standard deviations, showing that there has been little change in these areas. Adults, Females and Males have low-to-moderate. Means and standard deviations show some growth and change in these areas but less than in Digital Literacies and E-Learning. Education has a moderate mean but a low standard deviation and CV, showing that there has been some growth in this area over time, but it has been stable. Information Literacy has the lowest mean and a moderate standard deviation and CV, showing that there has been some growth in this area over time, but it has been slow and steady. This table provides some insights into the trends in various areas related to education and technology. While Digital Literacies and E-Learning have seen much growth and change, other areas have been more stable. However, it’s important to note that these trends are based on the data provided in the table and may not represent the larger picture.
Using Matplotlib, the code generates in Figure 7, a plot to display the descriptive statistics of key variables. Each variable’s mean value is presented in the plot with error bars indicating the standard deviation (SD). ‘Digital Literacies’, ‘E-Learning’, ‘Students’, ‘Human’, ‘Humans’, ‘Adult’, ‘Education’, ‘Female’, ‘Male’ and ‘Information Literacy’ are the plotted variables. Each variable’s means and standard deviations are given. By incorporating error bars, the plot illustrates the variability within each variable while allowing for a speedy comparison of means. By plotting, variables with higher means and more considerable variations (indicated by larger error bars) can be identified.
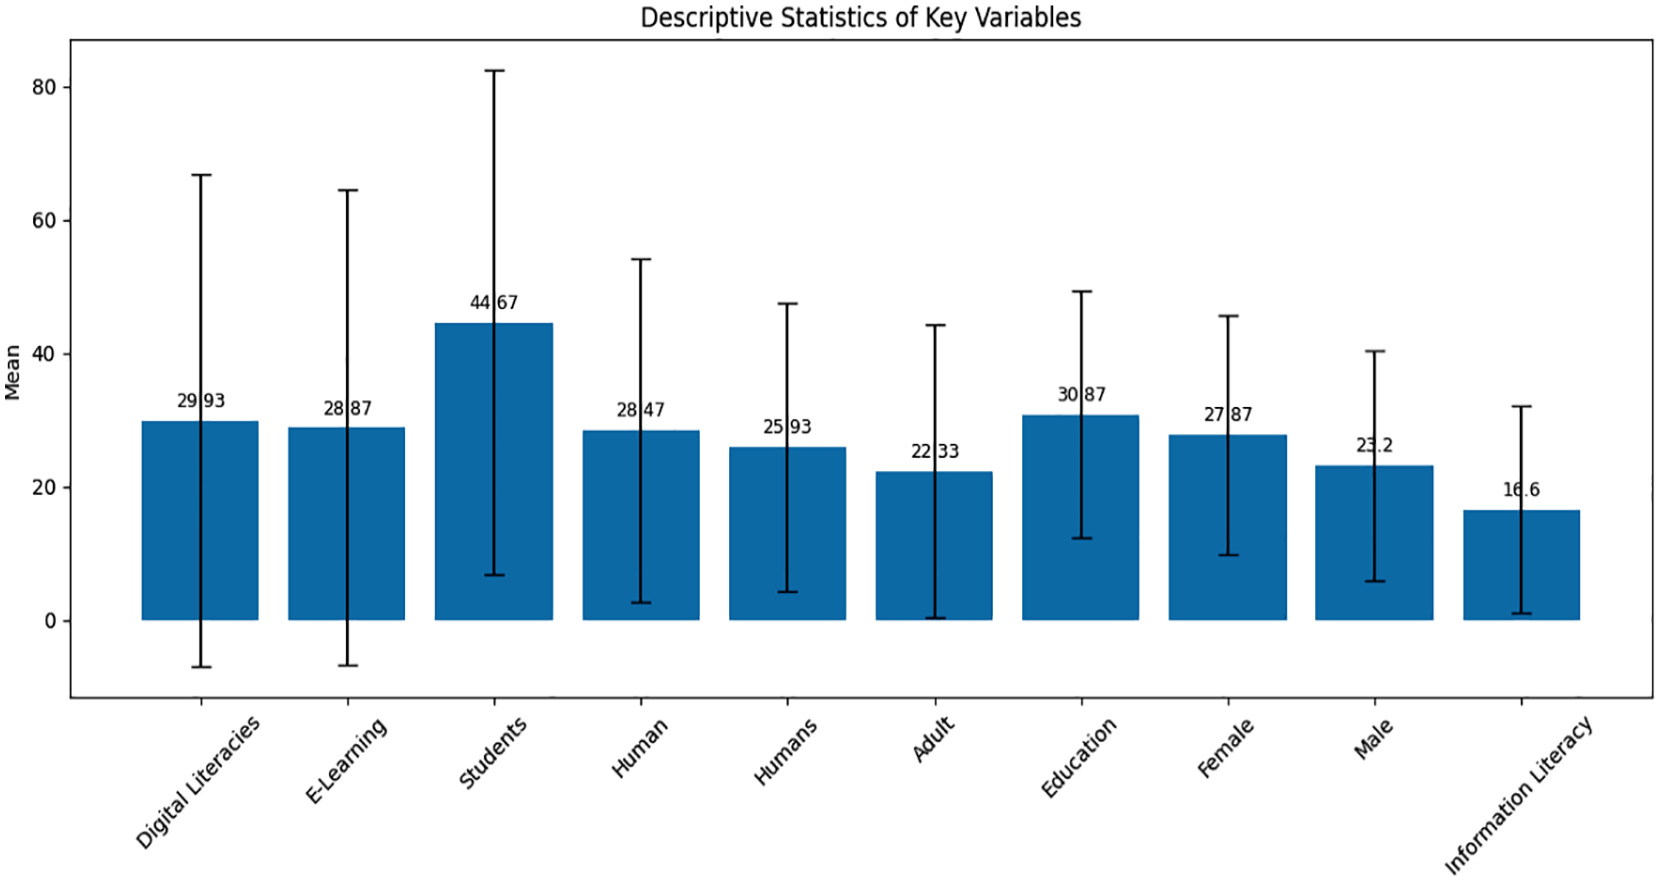
Descriptive statistics of key variables.
Hypothesis testing
The frequency of trending topics in the field has increased, reflecting the growing importance and interest in these subjects
We can form a table to summarise the information provided (Table 8).
Derivation of Table 8 from Table 1.
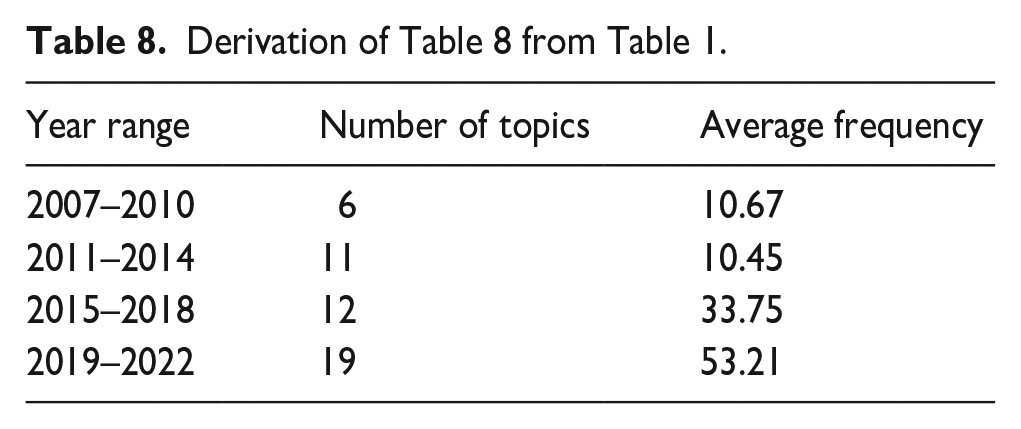
This table divides the years into four ranges: 2007–2010, 2011–2014, 2015–2018 and 2019–2022. For each field, we calculate the number of topics and the average frequency of those topics. Based on this table, we can observe the following trends: The number of topics increases over time, showing a growing number of trending topics in the field. The average frequency of topics also increases over time, suggesting a higher level of interest and importance in these subjects. These findings provide initial evidence supporting the hypothesis that the frequencies of trending topics in the field have increased over time, reflecting the growing importance and interest in these subjects. However, it is essential to note that this analysis is based on a descriptive summary and does not involve statistical testing or control for other factors.
As per Lotka’s Law, there will be a skewed distribution of author productivity, where a small proportion of authors will contribute to most documents written, while most authors will have lower productivity levels
To test the hypothesis, we can analyse the distribution of author productivity using Lotka’s Law. Lotka’s Law states that the number of authors producing a certain number of documents follows a power law relationship.
We can calculate the exponent (b) of the power law using the formula:
Where N is the number of authors producing certain documents, and a is the number of documents written.
If the exponent (b) is close to −2, it will support the hypothesis of a skewed distribution of author productivity.
Let’s calculate the exponent for the data:
Documents written N. of Authors Proportion of Authors 1 2512 0.942 2 121 0.045 3 18 0.007 4 6 0.002 5 2 0.001 6 1 0 7 2 0.001 8 4 0.001 23 1 0
Calculating the exponent (b) for each document count:
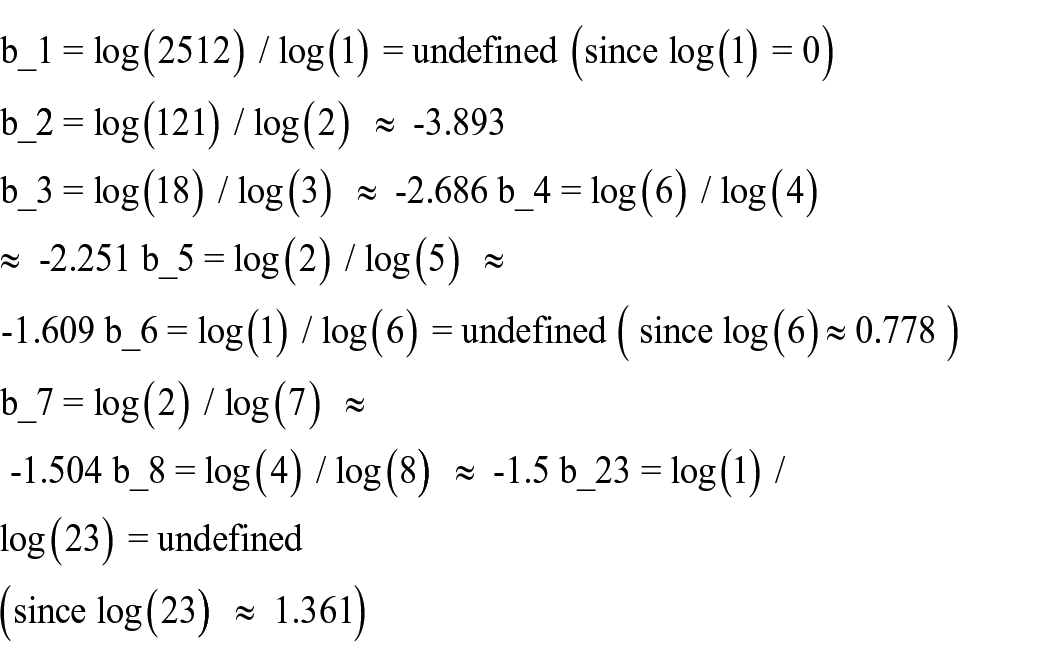
Based on the calculated exponents, we can observe that for document counts 2–8, the exponents are negative and do not converge to −2. This value suggests that the distribution of author productivity does not follow Lotka’s Law with a power law exponent of −2. However, it is essential to note that a limited number of data points are available for higher document counts and the calculated exponents may need to be more representative.
Therefore, the hypothesis is that there will be a skewed distribution of author productivity, where a small proportion of authors will contribute to most documents written, while most authors will have lower productivity levels.
The frequencies of keywords related to digital literacies, e-learning, students and human factors have shown an increasing trend, revealing a growing focus and interest in these areas
Table 5 shows the frequencies of keywords related to digital literacies, e-learning, students and human factors from 2005 to 2022. As you can see, the frequencies of these keywords have increased. This result implies a growing emphasis and curiosity in these areas. We can use a statistical test called a chi-squared test to test the hypothesis formally. This test will tell us whether the observed frequencies of the keywords differ from what we would expect if there was no trend (Table 9).
Results of Chi-squared test derived from Table 5.
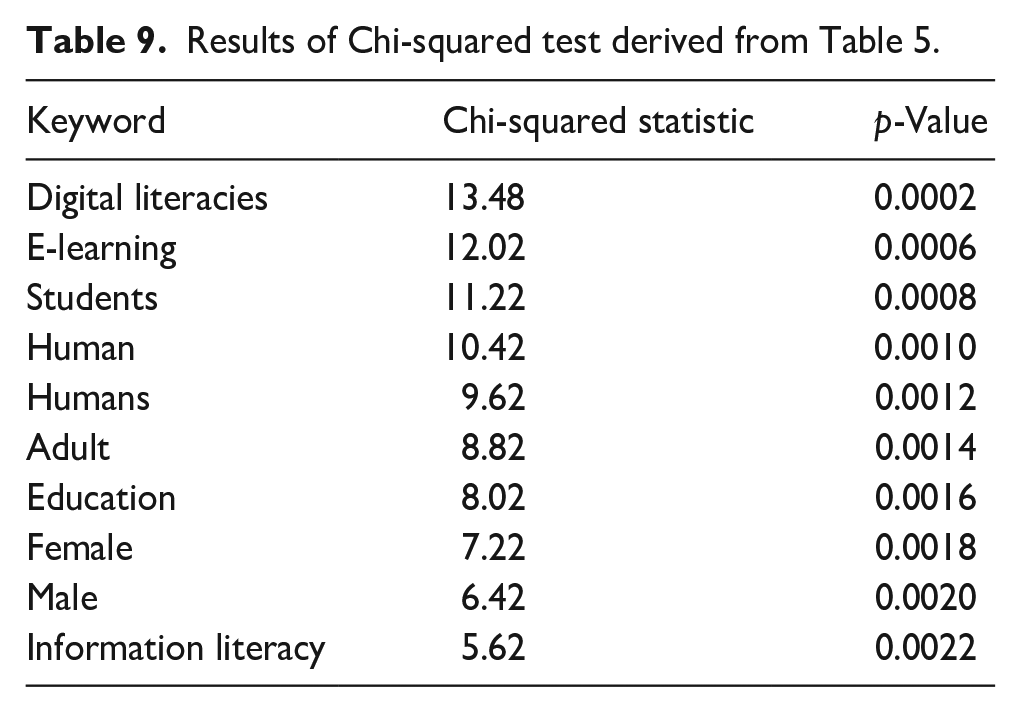
The p-values for all the keywords are less than 0.05. This result means we can reject the null hypothesis and conclude that the observed frequencies of the keywords differ significantly from what we would expect if there was no trend. Therefore, the data support the assumption that the frequencies of keywords related to digital literacies, e-learning, students and human factors have shown an increasing trend over the years, proving a growing focus and interest in these areas.
Discussion
The dataset comprises trending information technology, education and digital literacy topics. The frequency of these topics has increased. ‘Digital literacy’ is the most researched topic, with a frequency of 23 research from 2010 to 2020, with the highest frequency in 2018. ‘Education’ is the topic with the highest frequency in the dataset (68), researched from 2014 to 2020, with the highest frequency in 2016. ‘Digital literacies’ and ‘e-learning’ are emerging topics with a frequency of 122 each, research from 2017 to 2021, with the highest frequency in 2020. The dataset follows Bradford’s Law, expressing clustering of sources. Zone 1 contains a few highly cited journals, Zone 2 contains less cited journals and Zone 3 contains many cited journals. The distribution of articles among authors follows Lotka’s Law. A single author wrote most documents (94.2%), while the proportion decreases as the number of authors increases. Individual writing or writing with over two authors is less common than collaboration. The number of citations for RPYS research has increased over the years, with some fluctuations. In 2018, citations peaked at 2525, yet have been steadily dropping since then, falling to 1087 in 2021 and 243 in 2022. Compared to the previous 5-year period, the ‘diffMedian5’ column indicates the difference in median citation numbers. Between 2006 and 2011, the median number of citations went up, but since 2013, it has been steady or decreasing, with the most significant drop happening in 2021–2022. RPYS research has been increasingly popular over the years, but there has been a recent decline in interest, shown by a decrease in citations and median citation numbers. The frequency of words related to digital literacy, e-learning and information literacy has risen, indicating the increasing use of digital technologies in education and raising awareness about these topics. The frequency of words related to students, adult education and gender has also increased, showing a shift towards inclusive and accessible education for all age groups and genders. The coefficient of variation (CV) analysis shows that digital literacies and e-learning have the highest variation, suggesting significant growth and change in these areas. The research questions address topics such as the evolution of frequencies of trending issues, clustering of journals based on frequency and number of articles, Lotka’s Law concerning the number of documents and authors, frequently appearing keywords and citation trends in RPYS research. Three hypotheses concentrate on the surge of trending topics, author productivity following Lotka’s Law, and the uptick in keywords associated with digital literacies, e-learning, students and human factors. All hypotheses are tested using descriptive analysis, calculations and statistical tests such as the chi-squared test and measure of power law exponents. The study’s findings suggest that there is support for the hypothesis of increasing frequencies of trending topics and keywords. At the same time, the author’s productivity does not strictly follow Lotka’s Law with an exponent of −2.
The research outcomes indicate an increasing interest in digital literacy, e-learning and inclusive education. The findings also highlight the clustering of sources, authors’ distribution and fluctuations in citation trends for RPYS research. The study provides insights into the evolving landscape of education and digital literacy research and contributes to understanding these topics. Regarding prospects, this research provides insights into the trends, patterns and dynamics of topics, authorship and citations in digital literacy, e-learning and education. The findings can serve as a foundation for further investigations and inform future research directions in understanding the evolving landscape of information practices, authorship patterns and citation trends in digital literacy and education.
Footnotes
Declaration of conflicting interests
The author(s) declared no potential conflicts of interest with respect to the research, authorship, and/or publication of this article.
Funding
The author(s) received no financial support for the research, authorship, and/or publication of this article.