
Abstract
This study aims to contribute to the pertinent body of knowledge by examining the field of data literacy (DL) to better understand its trends and evolution, thematic clusters, relevant studies and the most productive authors and journals. The analysis of scientific literature indexed by Web of Science from 1980 to 2023 (n = 1704 items) combined co-occurrence (using VOSviewer) and co-citation (using CiteSpace) techniques based on the words in the title and abstract, as well as the keywords, authors and journals. There is evidence of four main trend topics (Data Literacy, Statistical Literacy, Data-based assessment and e-society) and six thematic clusters (Data Literacy, Statistical Literacy, Quantitative Literacy, Big Data, Data Science and Quantitative Skills). With DL emerging in 2011, the research initially focused on both quantitative and statistical literacy, and later (2012–2016) shifted toward applying statistical literacy to various disciplines. Since 2018, the use of data has led to the emergence of fields like big data and data science, resulting in progress being made in data literacy. The combination of the two analysis techniques offers complementary perspectives: co-word analysis reveals fields of application, and co-citation analysis shows the internal evolution of the discipline. This study evidences a significant increase in publications on DL, indicating its expansion to several disciplines and a promising, yet uncertain, future.
Introduction
Data have been central to the construction of social knowledge since the Renaissance, serving as the evidence supporting the advance of science, first in the natural sciences and later, in the late 19th and 20th centuries, in the social and human sciences. In the last century, the information technology revolution has led to a continuous improvement in the capture, processing, dissemination, and interconnection of data, both in terms of size, power, and quality. In the Semantic Web, data is clearly seen as the building block of the web. This massive availability (big data) plays a crucial role in fueling the current artificial intelligence revolution. The central role of data in science and society, has even been recognized by the new emerging discipline of data science.
All these advances are expected to contribute to a decisive boost in the way science is done and disseminated, making it a far more transdisciplinary, shared, social, sustainable, and technologically empowered way, which is a vision that has materialized in the concept of e-science. In this context, data literacy has become a program that plays an essential role in advancing the information and knowledge society, providing greater opportunities for all, and supporting the progress of societies. It is emerging as a central element in education, as it prepares young people to become informed citizens. Hence, evaluation and critical thinking are key elements with which to approach data literacy (Shields, 2005). In this regard, Engel (2017) stated that large amounts of data, its sources and visualization tools offer the opportunity to illustrate complex relationships with real data, but warned that the misuse of these tools can lead to misinterpretations or to wrong decisions. Since data literacy must go beyond the skills required to use data, Sander (2020a) and Carmi et al. (2020) suggested the concept of extended critical literacy, based on critical awareness and reflection.
As interest in data grows, data literacy requires more attention and multiple perspectives are emerging to define it from different contexts. There is, however, a lack of agreement among the disciplines about its scope (Khan et al., 2018). Calzada Prado and Marzal (2013) defined data literacy as the component of information literacy that enables individuals to access, interpret, critically assess, manage, handle, and ethically use data. From that perspective, information literacy and data literacy form part of a continuum, a gradual process of scientific-investigative education that begins at school, is perfected and becomes specialized in higher education, and forms part of the individual’s skill set throughout their lifetime. Thus, those authors identified a series of skills, some of the most important being: determining when data is needed; critically evaluating data and its sources; knowing how to select and synthesize data; using data ethically; and applying the results to learning, decision-making or problem solving. For Carlson et al. (2011) data literacy involves understanding what data mean, including how to read graphs and charts appropriately, drawing correct conclusions from data, and recognizing when data are being used in misleading or inappropriate ways. Statistical literacy, on the other hand, refers to the ability to read and interpret summary statistics in everyday media (Baykoucheva, 2015). Finally, the growing interest in specific training in data management (and, more particularly, research data management) has motivated the development of programs focused on competences related to the understanding, management and analysis of data for multiple audiences (Sharma, 2017; Shields, 2005).
The overall objective of this research is to explore the strategic thematic field of data literacy in the context of those literacies with which it developed, that is, quantitative and statistical ones, by providing a diagnosis of the scientific production in Web of Science (WoS).
To gain insights into the emergence of Data Literacy (DL) as a subject area, we consider the following research questions:
Research Question 1—What is the overall quantitative evolution of DL and related literacies and which are the most productive authors and journals in this domain?
Research Question 2—What evidence on the structure and evolution of the field can be gained by combining co-occurrence analysis in titles and abstracts with co-keyword and citation burst analysis?
Literature review: Context and related studies
According to Ghodoosi et al. (2023), the field of data literacy has emerged and evolved rapidly in the last two decades. In their recent literature review of the field, the same authors showed that 3.8% of the papers on this topic were published between 2000 and 2005, 8.7% between 2006 and 2010, 21.9% between 2011 and 2015, and 65.6% after 2015. Early publications were focused on the differences and similarities of DL with respect to other related literacies, mainly statistical and information literacy (Ghodoosi et al., 2023; Shields, 2005).
The DL movement started in the social sciences, where data is a crucial source of information, as a result of the collaboration between statisticians, information professionals, and academics involved in education. Verdi (2023) conducted a thorough survey of the field of DL, encompassing its early sporadic instances. Data literacy has been used since the emergence of new literacies and new media (Kellner, 2000; Kress, 2003). Information and communication technologies, especially the Internet, have contributed to bringing data to the forefront of our culture: the semantic web, open access, and big data movements are three of the more important facets.
The field of DL emerged after the creation and widespread acceptance of the World Wide Web between 1989 and 1993 (Scheets, 1995). Even recognizing the absence of a standard definition of DL, Tedesco (2002) used the concept in relation to data literacy programs. A pivotal moment was the “Data Futures: Building on 30 Years of Advocacy” conference of the International Association for Social Science Information Service and Technology (IASSIST) in 2004 at the Data and Program Library Service, University of Wisconsin-Madison. Data literacy arose as a new and distinct field of study (Hunt, 2005), in contrast to the previous emphasis on quantitative literacy (Lackie, 2004) and statistical literacy (Shields, 2005). Although Hunt (2005) did not advance a formal definition of DL, she did identify “statistical literacy, quantitative reasoning or quantitative literacy, numeracy, and data literacy [as] all roughly meaning the same thing,” suggesting the need for a common terminology (p. 14). While some approaches may overlook the importance of searching for and evaluating data and statistics, Hunt argued that ACRL standards can provide valuable guidance for data literacy programs. However, she also noted that the practical application of data literacy differs significantly from traditional information literacy (Hunt, 2005). According to Shields (2005), promoting statistical literacy is essential to promote information literacy or data literacy.
Although statistics is undoubtedly an essential background to DL (and more broadly Information Literacy), the development of Internet technology contributed to an increased focus on data as a key source of information. In their literature review, Ghodoosi et al. (2023) confirmed “that the trend toward focusing on organizations and the necessity of data literacy for strategic decision-making helped to separate the concept of data literacy from statistical literacy and information literacy.”
This trend first became public in 2007, when the National Science Foundation, Cyberinfrastructure Council (2007) decided to support the development of cutting-edge data management and distribution systems, including digital libraries and educational tools, in order to facilitate scientific breakthroughs in the 21st century. The goal was to create well-documented, publicly available digital datasets that could be easily accessed by both experts and the general public. To achieve this, a policy was introduced mandating researchers to create data management plans when seeking public grants, which soon became a norm across OECD countries. Sharing and reusing datasets proved challenging due to the inadequate education of researchers and the public’s limited understanding of new opportunities. In 2010, the libraries of the Universities of Purdue, Minnesota, Oregon and Cornell collaborated in a successful research project on Data Information Literacy (Carlson and Johnston, 2015). Data Information Literacy can be characterized as framing data management and the use of training problems inside the general frame of information literacy, as represented by the ACRL standards (Association of College and Research Libraries [ACRL], 2000; ACRL, 2015). The data information literacy movement has its roots in the e-science movement. It aims to develop competences in research data management and the understanding of data languages. Research data management has also converged into the big data movement (data science in the academic field) and its deep social and economic implications (Forbes, 2017; Manyika et al., 2011). However, it is probably with the information data literacy project that data literacy reached its most operational definition as something distinct from other related literacies. In information data literacy, the concept of library curation is applied to data, and the “the concepts of researcher-as-producer and researcher-as-consumer” are effectively merged (Carlson et al., 2011). Consequently, data researchers think not only about the immediate application of their data (producers) or only about using other datasets (consumers), but also, as a result of the integration of the two perspectives, about the preservation and future reuse of the data they themselves produce and the requirements they demand from solid datasets. Although data literacy requires and presupposes statistical and quantitative skills, its emphasis is on data lifecycle management. In this direction, Calzada Prado and Marzal (2013) defined it “as the component of information literacy that enables individuals to access, interpret, critically assess, manage, handle and ethically use data” (p. 126).
As Ghodoosi et al. (2023) noted, from 2010 onward researchers began to apply the concept of DL (now well-grounded and enjoying broad consensus) to specific fields and areas of activity. As a result of this effort, DL has been effectively used in various contexts and disciplines, each with unique states of the art and all incorporated into the field of data literacy. A good example of both the common roots and the originality of specific field studies in DL are the research projects by Vanhoof et al. (2011) and Vanhoof and Mahieu (2013). These authors used the concept of data literacy in the context of school principals transforming the data of their schools into actionable knowledge to improve the management of educative processes and their results. School principals can enhance the management of their educational processes and results by using data literacy to convert school data into practical knowledge. They examined the relationship between data literacy skills, guidance provided for interpreting the data, the application of feedback, and the possible impact on school improvement. In accordance with their specific interests, they brought scientific traditions from their field of interest, in particular elaborating on the ideas of Earl and Fullan (2003) about the data cycle in educational leadership, in order to advance a definition of DL. Yet, they also merged them with the definition of information literacy of Williams and Coles (2007), which they used to propose a definition of data literacy. Finally, in 2013, they coined a very specific concept—“knowledge brokerage”—focused “on promoting the integration of the best available evidence into policy and practice-related decisions.” (p. 188)
Since 2016, there has been a rise in data literacies that are specific to certain fields beyond general information literacy, such as digital and ICT competences (Braun and Huwer, 2022; Cerny, 2021; Rubach and Lazarides, 2021), digital humanities (Garwood and Poole, 2019; Locke, 2017), geospatial literacy and GIS (Appel, 2019; Rutkowski and Williams, 2019) or digital archeology literacy (Banek Zorica et al., 2019). Also, numeracy, quantitative literacy, quantitative information literacy and statistical literacy have maintained a noteworthy presence (Brock et al., 2021; Šorgo, 2018; Tiro, 2018). In some cases, the authors are well aware of the interactions among information, statistical, and data literacies (Šorgo, 2018).
In recent years, the debate on multi-literacies (Marzal, 2020; Valverde-Berrocoso et al., 2022) and meta-literacy (Deja et al., 2021; Marzal and Borges, 2017) has become increasingly influential in DL research. The Covid-19 pandemic is a significant factor fueling the ongoing debate (Koltay, 2023). Additionally, the increasing issues of disinformation and other abnormalities in social information have sparked an interest in addressing the broader problem of citizen information literacy. This involves empowering the general population to navigate the modern information landscape and tackle the challenges it presents for democratic societies (Koltay, 2023; Valverde-Berrocoso et al., 2022). As a result, critical literacy has also gained a place in the field of data literacy, contributing to the wider scope of information problems and needs (Piranec et al., 2019).
Recent bibliometric analyses of data literacy and related fields (Research Data Management and statistical literacy) have some connection to this work. In a study by Zhang and Eichmann-Kalwara (2019), the authors mapped the literature in Scopus, with a wider scope (RDM), and data literacy was the third main cluster detected, out of a total of seven. Naseema and Sevukan’s (2022) co-citation analysis and journal co-citation analysis for RDM papers in Scopus up until October 2021 revealed the specialization in the fields of education, medicine and technology. Sheriff and Sevukan (2023) showed researchers gaps concerning RDM. The two studies used Scopus as their source, whereas our research relied on WoS. A bibliometric study on statistical literacy by Marchy and Juandi (2023) contributed from this perspective.
Finally, two recent literature reviews are closely related to our research, as they are focused on DL (Ghodoosi et al., 2023; Sheriff and Sevukan, 2023). Subsequently, we will explain how our research complements and differs from those earlier studies, in terms of sources, methodologies and results.
Ghodoosi et al. (2023) conducted a comprehensive review of data literacy education, yielding both quantitative and qualitative evidence and insights, which have been fully integrated into this literature review. Their sources were Google Scholar, Science Direct, ResearchGate and Scopus. WoS was not considered. The review conducted by Ghodoosi et al. (2023) was focused on data literacy education, excluding other related literacies such as digital and statistical literacy, although its corpus allowed them to correctly identify how DL began closely related to statistical and information literacy (pp. 114−115). Besides a general description of the corpus and its authors (geographic scope, focal areas, disciplinary scope, methods), its topics of interest are mainly related to teaching: competences, teaching approaches and theories, student cohorts, and educators. In contrast, our research aims to delve into the development of DL as a field by considering its roots in statistical and quantitative literacy, a close historical relation that has been shown in this literature review, although over the years they have gradually diverged away from each other. On the other hand, the methodological approach of Ghodoosi et al. (2023) is a systematic quantitative literature review, whereas this paper uses advanced keyword analysis to illustrate the evolution of DL as a research field.
Sheriff and Sevukan (2023) performed an exploration of DL research using bibliometric methods, specifically Co-Citation Analysis of both documents and journals. They searched for the term “data literacy” in Scopus in order to determine which countries, papers, periodicals and authors were contributing, and what areas had been explored, using CiteSpace. In contrast, besides a CiteSpace exploration, our study also uses VOSviewer on a WoS collection and performs a co-occuring word analysis, which provided a clear visualization of the relations among DL, QL and SL and their main concepts so as to be able to research the evolution of this transdisciplinary field.
To sum up, no bibliometric study could be retrieved that addresses the analysis of the literature on DL included in WoS. So this is a pioneering study in this respect and complements previous research. In addition, it also explores other closely related literacies (statistical and quantitative) from which DL had to differentiate itself, instead of restricting the analysis to the string “data literacy.”
Materials and methods
Data collection
This study is limited to the scientific literature indexed by the WoS Core Collection. The advantage of using WoS is that its Core Collection is a rigorously-constructed, compact and selective bibliographic corpus, which is built on two levels—the SCI + SSCI + A&HCI and Emerging Sources Citation Index (ESCI)—both of which are based on impact criteria (citation analysis of articles, authors and editorial team, with an emphasis on content that does not have an immediate impact in terms of citations) (Clarivate, 2023). In addition, this paper performs a set of different analyses that provide both corroborating and complementary perspectives and findings. Moreover, the most related reviews on DL development are based on other sources: Scopus (Sheriff and Sevukan, 2023), and Google Scholar, Science Direct, ResearchGate and Scopus (Ghodoosi et al., 2023).
Firstly, it was necessary to discuss the search terms, as they may be related or similar terms, sometimes belonging to other fields of study. Search terms included the closely-related literacies from which they evolved and some expressions that are used instead of literacy in certain research communities: skills and competences (data literacy, data competences, quantitative literacy, quantitative competences, statistical literacy, statistical competences). The inclusion criteria were defined so as to gather only journal papers and main proceedings in English, published between 1980 and March 2023. We used the following search equation:
(TITLE-ABS-KEY (“data literacy” OR “data literate” OR “data competence” OR “data competency” OR “data skill” OR “data literacies” OR “data literates” OR “data competences” OR “data competencies” OR “data skills” OR “data competent” OR “data skillful” OR “quantitative literacy” OR “quantitative literate” OR “quantitative competence” OR “quantitative competency” OR “quantitative skill” OR “quantitative literacies” OR “quantitative literates” OR “quantitative competences” OR “quantitative competencies” OR “quantitative skills” OR “quantitative competent” OR “quantitatively skillful” OR “quantitatively competent” OR “quantitatively skillful” OR “statistical literacy” OR “statistical literate” OR “statistical competence” OR “statistical competency” OR “statistical skill” OR “statistical literacies” OR “statistical literates” OR “statistical competences” OR “statistical competencies” OR “statistical skills” OR “statistical competent” OR “statistically skillful” OR “statistically competent” OR “statistically skillful”)
So, although our focus was on DL, the search was expanded to include quantitative and statistical literacy, because previous research has shown that DL emerged in close relation to them, and it seemed important to be able to distinguish how they evolved together over the period in which DL was developing. Numeracy was not included because it is usually associated with basic mathematical knowledge and has a much wider scope and a different constituency than DL, as is the case with literacy and information literacy. Likewise, other related terms such as mathematical or numerical reasoning were not included either because they are more connected with psychological research on the acquisition of mathematical concepts. Other possible synonyms for literacy, however, were considered: literate, competence, competency, competent skill, and their plurals, because some authors work with the concept of DL without actually referring to it in this way, and we wanted to have a wide range of DL developments as a field of research and practice.
The search yielded 1785 records. After filtering out three duplicated records (73 in other languages were also removed) and verifying that the publications that formed the dataset were relevant to data literacy (there were five false positives), the total number of references amounted to 1704.
Bibliometric techniques
The main techniques used for analysis and visualization of the literature review were co-occurrence and co-citation (Chang et al., 2022; Ding and Yang, 2022; Kemeç and Altınay, 2023; Liu et al., 2023; van Eck and Waltman, 2017).
Co-occurrence analysis shows a relationship or association between two elements that frequently appear together in a specific context, like words, terms, or concepts. It involves identifying and quantifying the relationship between these elements by observing how they occur together compared to what would be expected by chance. This technique helps identify trends, authors, journals, institutions, and prominent terms in a research field and provides visualizations such as word clouds or network graphs.
Co-citation network analysis examines the relationships between scientific documents based on the citations they receive and assesses their importance.
It involves identifying documents or terms that are co-cited by other documents, suggesting a thematic or conceptual relationship between them. Co-citation analysis provides information about the structure and dynamics of a research field, including the identification of key documents or terms and collaborations, and research patterns in a particular area of knowledge.
With VOSviewer’s co-occurring word analysis (Van Eck and Waltman, 2011), it is easy to find the frequently used words in titles and abstracts based on the calculation of a matrix that records the levels of co-occurrence among pairs of keywords (co-occurrence matrix). This method makes it possible to create a network visualization that highlights the main words from these sections. This facilitates the identification of primary terms and the relationships between them, as well as the potential conceptual clustering (van Eck and Waltman, 2011). We generated the network view using the VOS clustering technique, where VOS stands for the visualization of similarities, to show the connections between items. We considered the total link strength attribute to measure the strength of the relationships. Colors indicate the cluster for each term, and the label size corresponds to its weight or significance, with larger labels representing greater weights.
CiteSpace (Chen, 2020, 2022) is a tool that helps visualize information and generate knowledge maps by identifying patterns through co-citation analysis of keywords, authors and journals in order to detect thematic clusters and research fronts, as well as to identify the most influential researchers and journals (Markscheffel and Schröter, 2021). A time-slicing method is used to produce a series of network models. In practice, this method involves dividing a dataset into distinct time periods (a year or range of years), or slices, and creating separate network models for each slice. These models are then merged to form a comprehensive network overview. We considered the latent semantic indexing (LSI) technique to categorize the network. Furthermore, the study employed structural metrics like silhouette and modularity to evaluate the network’s structural aspects. The modularity of a network is a measure of how easy it is to break it down into multiple components or modules. If a network has a modularity close to 1.00, it is clearly divided into distinct groups. Silhouette is a measure to assess intra-cluster cohesion and inter-cluster separation. It is computed for each node and averaged to obtain an overall measure of clustering quality. An average silhouette close to 1 indicates that nodes are well grouped (good clustering), while an average silhouette close to −1 suggests that nodes may be poorly grouped (poor clustering quality) (Chen, 2022; Jokić and Van Mieghem, 2023).
Finally, to analyze the temporal dynamics of the corpus, the citation burstiness metric given by CiteSpace allows us to identify periods of intense citation activity for an item (keyword, document or author). Burst detection is a computational technique used to identify sudden changes in events, which may indicate moments of particular influence, impact or relevance of an item in a specific research field. An item is considered to cause a burst when it is frequently cited or used within a specific period (Lamba et al., 2022).
Findings
Findings are organized as follows: First, in subsection 4.1, we provide an overview of the evolution of scientific production. Subsection 4.2 addresses the study of the main authors, the distribution of documents among authors, and the production of the main journals. Subsection 4.3 visualizes the trending topics through a co-word analysis, while subsection 4.4 identifies the research fronts using co-citation analysis of the keywords. Finally, subsection 4.5 highlights the most influential keywords, authors, and journals in terms of their burst periods.
Quantitative evolution
The set of references consisted of journal papers (1427 = 83.7%) and conference proceedings (277 = 16.3%).
The descriptive overview of the quantitative scientific production for the period considered (1980–2023) reveals significant growth with an exponential adjustment that shows two higher points in 2020 and 2022 (Figure 1).
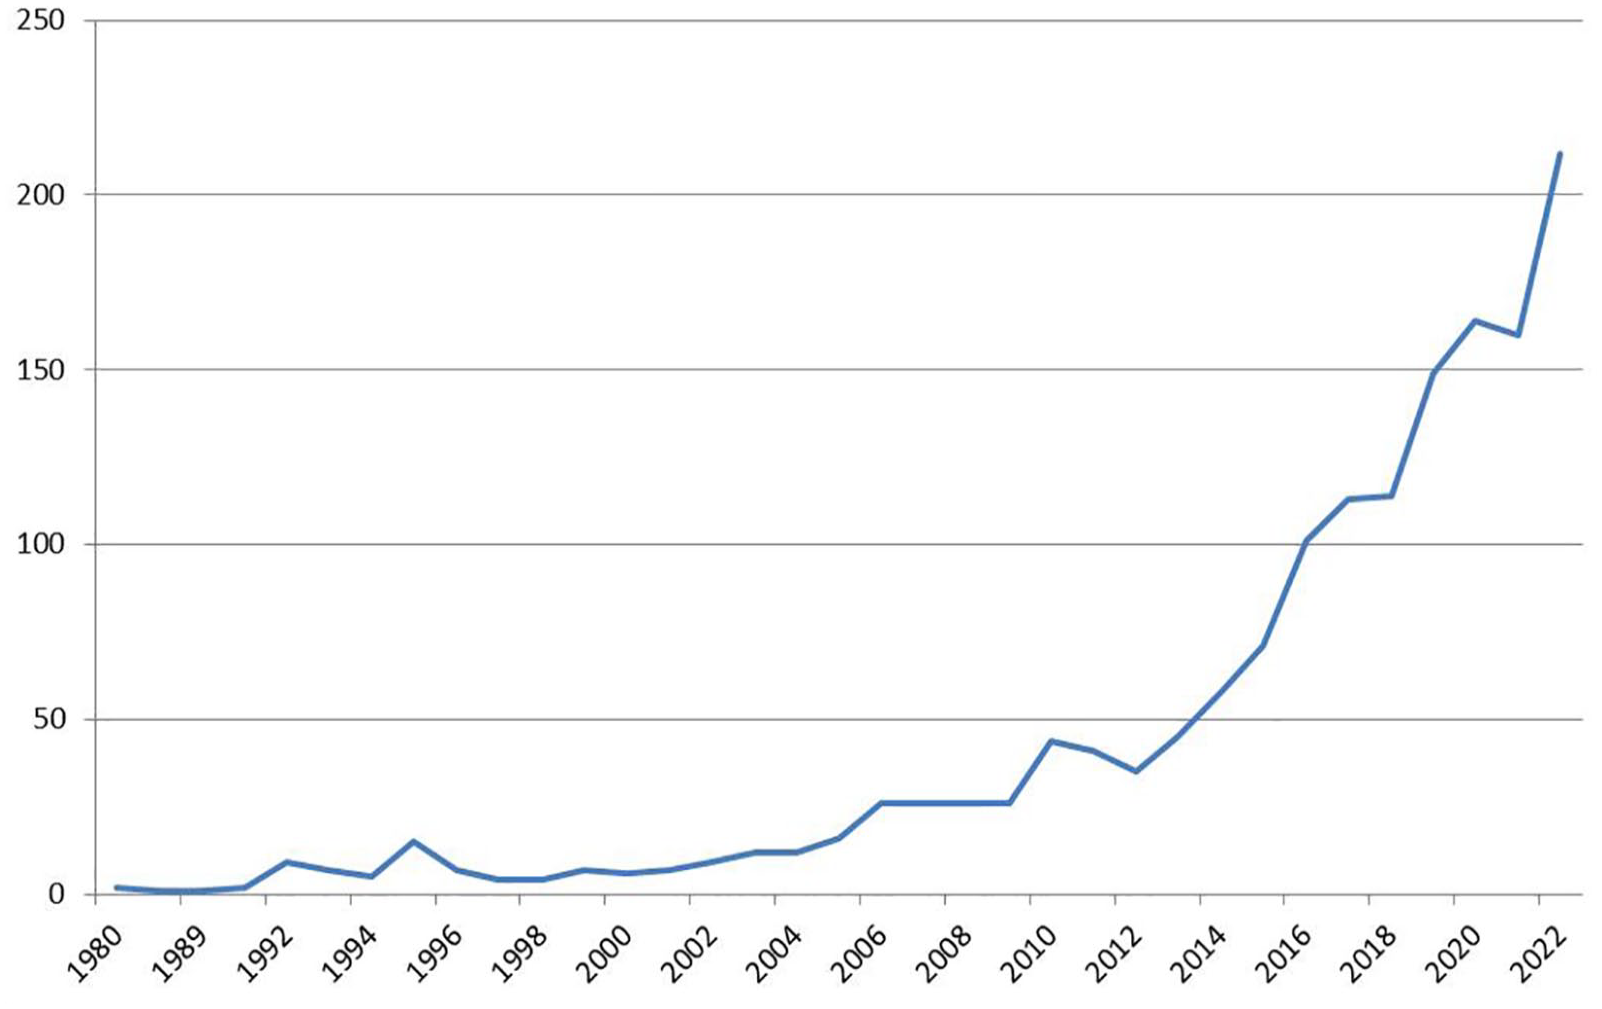
Evolution of scientific production.
Authors’ and journals’ production
Authors’ production
According to the records, the 1704 references were published by 5364 authors from 89 countries, with the number of authors per contribution varying from 1 to 20. This variability is directly linked to the collaboration among authors, resulting in an average of 3.15 authors per item (Table 3). Such collaboration is evidenced in 357 documents, as almost 21% of the papers were co-authored by three individuals.
To illustrate that the distribution of the documents among the authors fits a Zipf distribution (Zipf, 1940) we applied the Kolmogorov–Smirnov non-parametric goodness-of-fit test. We considered that the empirical distribution of documents follows what is known as “Zipf’s law” with:
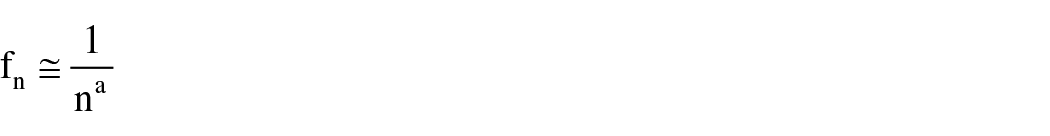
where fn denotes the relative frequency of the n-th value, while a represents a positive real number, usually slightly greater than 1. In our case, we have considered a = 1.35 for n > 1. The Kolmogorov-Smirnoff test (p > 0.05) confirms that Zipf’s law is adequate in this study to determine the distribution parameter of scientific production by number of authors (Figure 2).
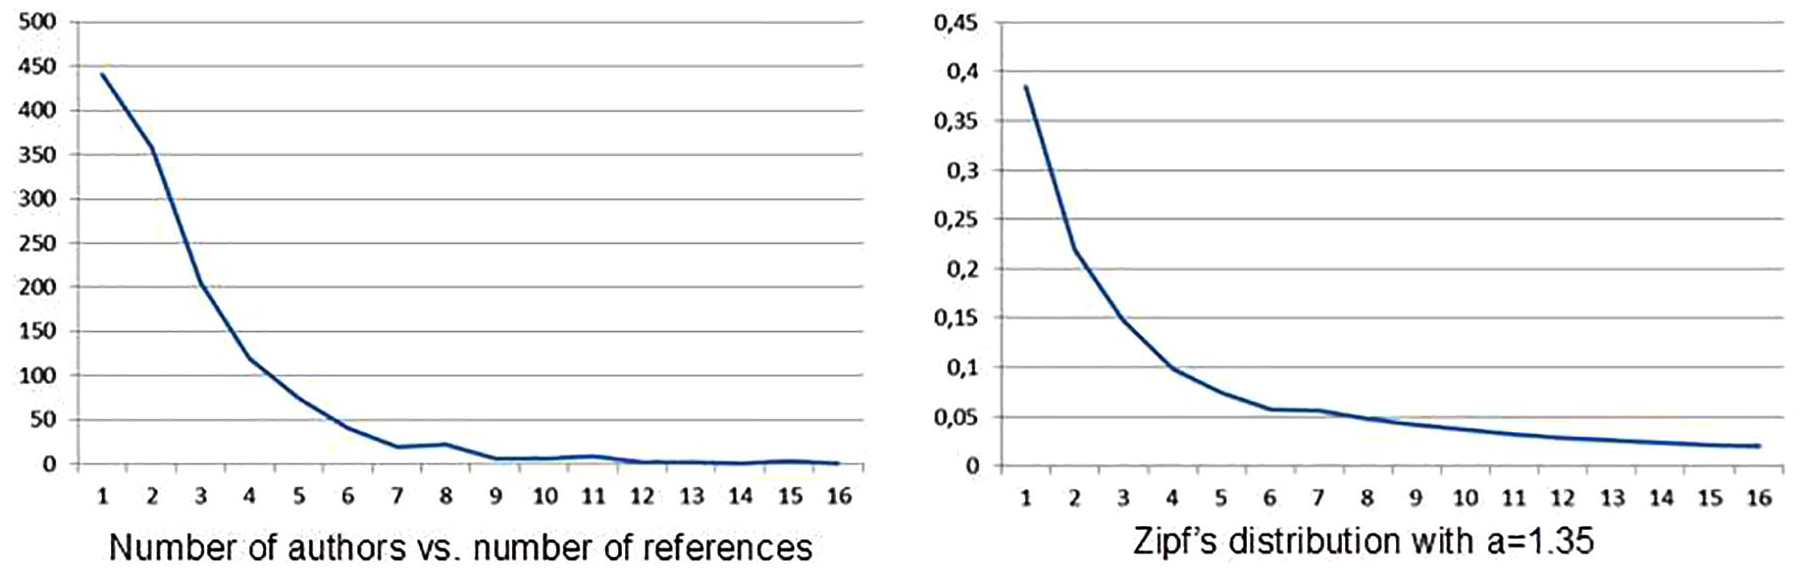
Author productivity.
Most productive authors
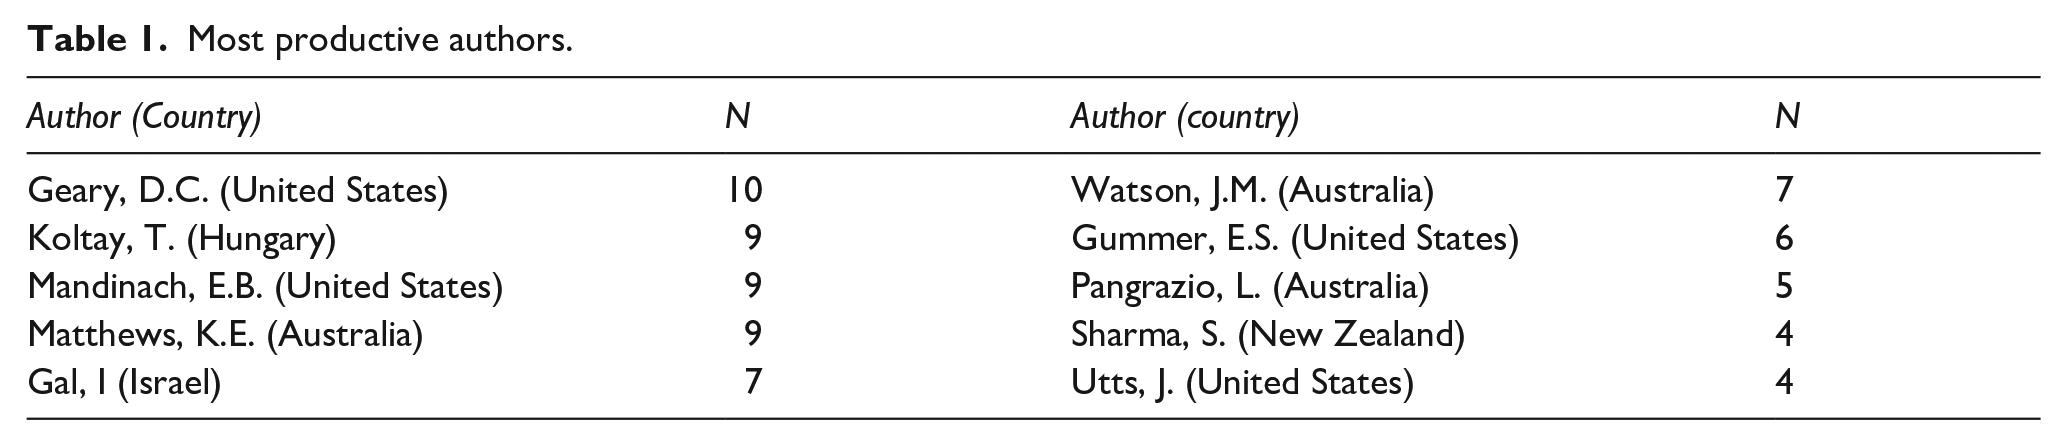
The authors with the highest productivity during the research period and their countries (shown in parenthesis) are displayed in Table 1. The geographical diversity of these researchers highlights the universality and global significance of the thematic field analyzed.
Most productive authors.
There are a total of nine countries with a scientific production exceeding 3% of the corpus. The USA leads with 888 documents, followed by the UK (194), Australia (143), and Germany (118). At some distance behind, the next on the list are Canada (96), Spain (74), People’s Republic of China (66), the Netherlands (55), and South Africa (50).
Most productive journals
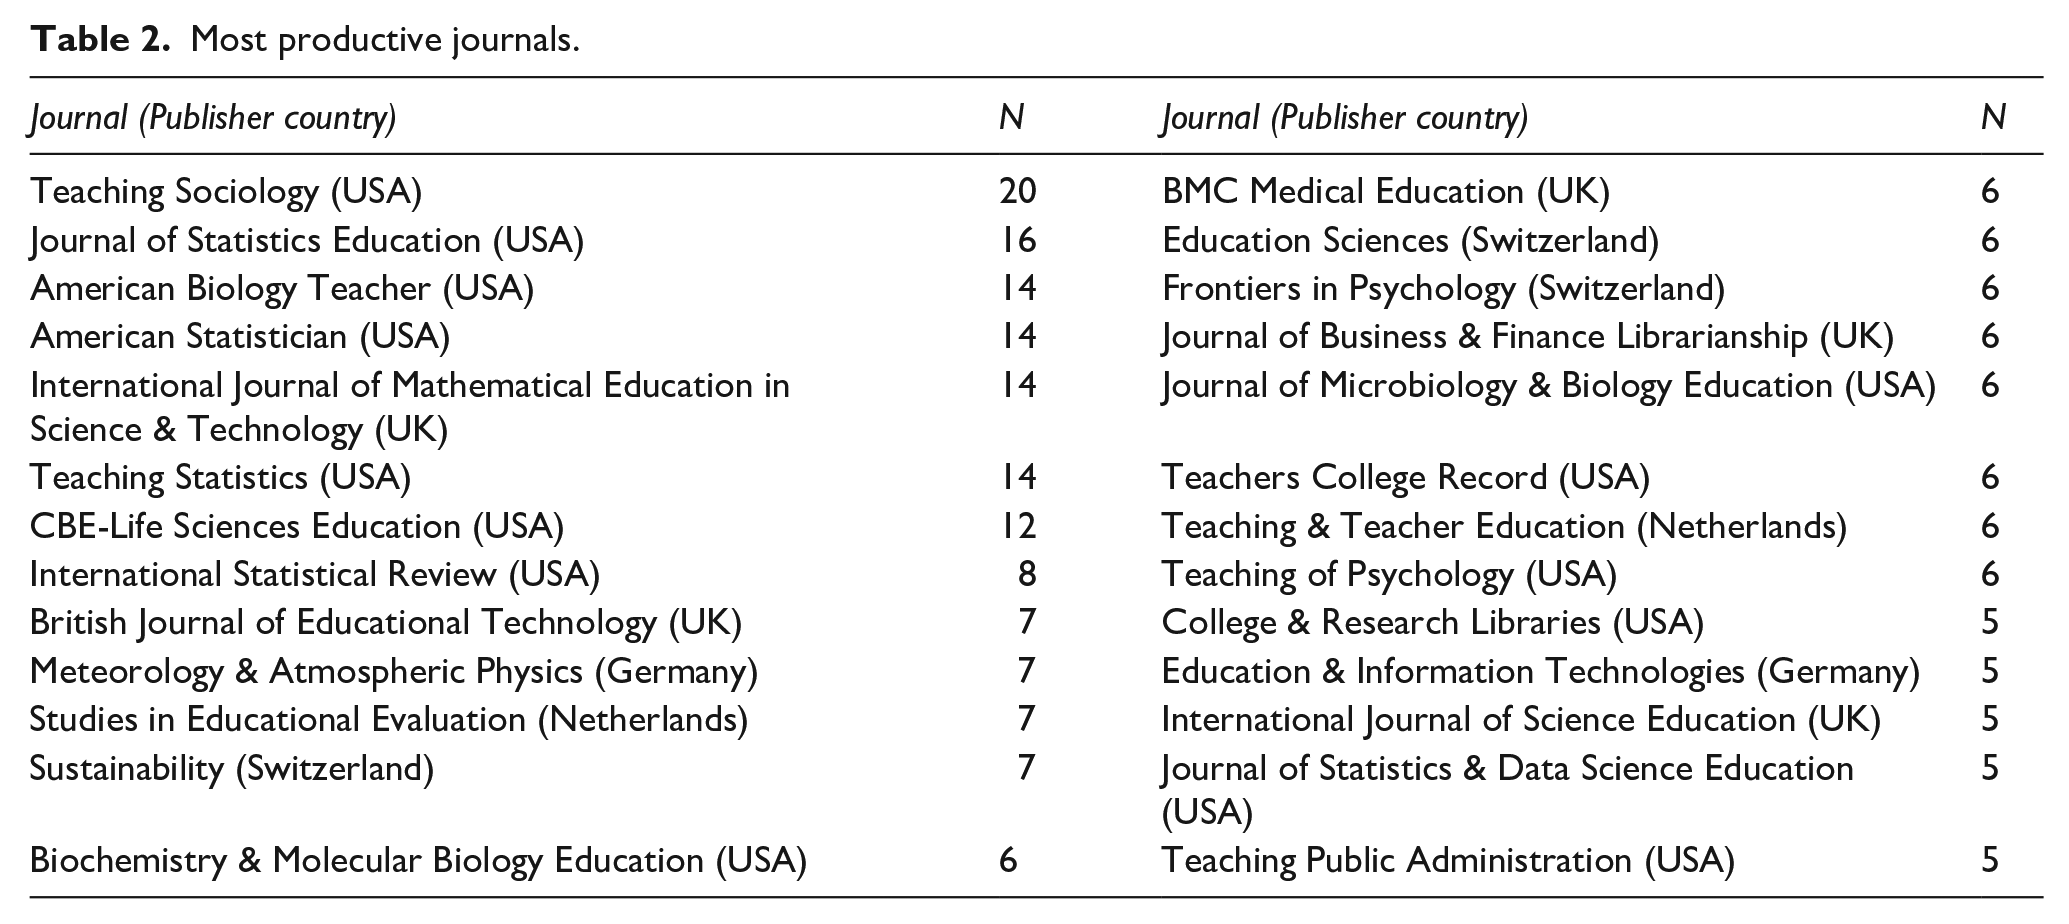
There are a total of 1427 journal papers in the records retrieved. Table 2 displays the most productive journals, which account for 219 records (15.3% of the journal articles).
Most productive journals.
Visualizing the trend topics by co-words analysis
With the aim of visualizing recurring topics, major trends and the evolution over time of the main terms used in titles and abstracts, we performed a co-occurring analysis in VOSviewer. After removing empty words such as connectors, prepositions, conjunctions and articles, we identified 32,185 terms that were relevant to the topics of this research. From this set, we selected 211 terms that appeared more than 20 times, to be included in the map (Figure 3).
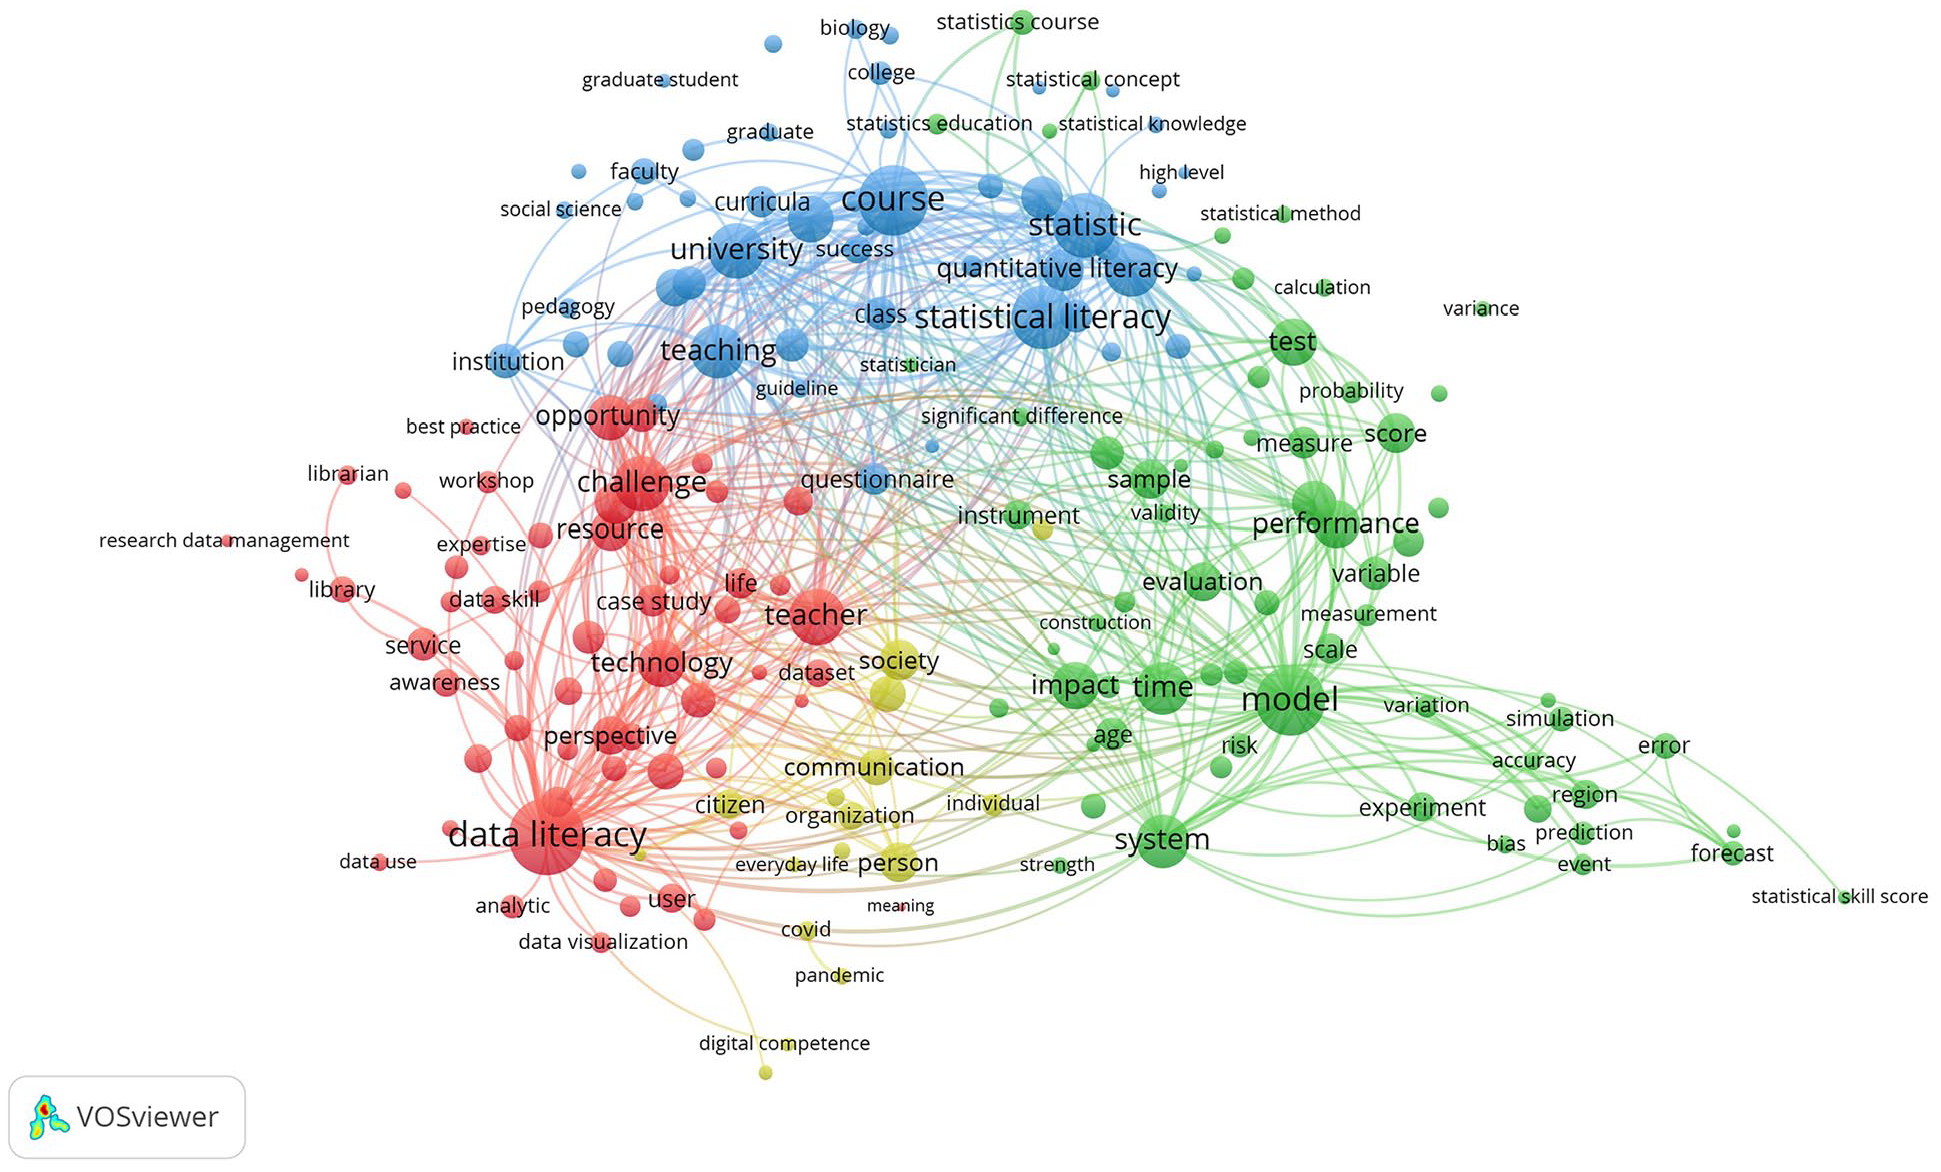
Main trend topics using co-words (VOSviewer).
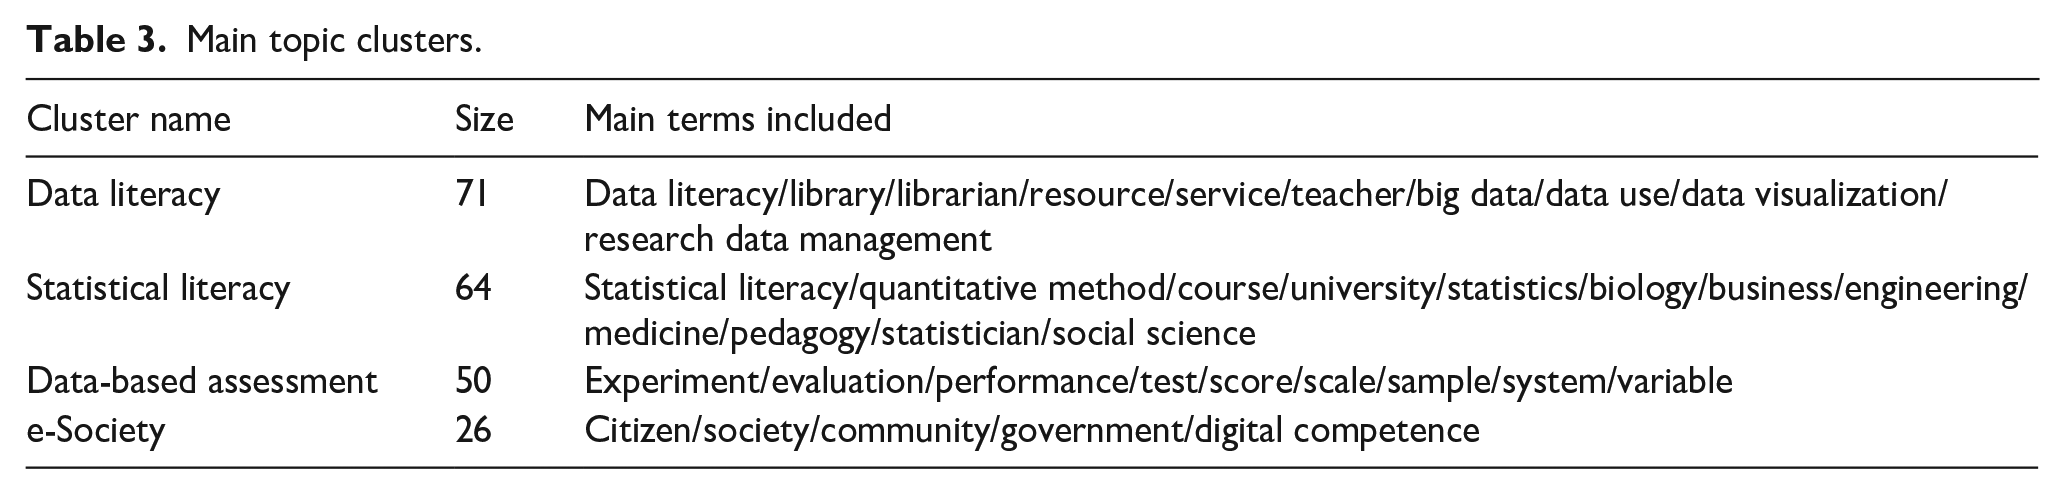
Four major clusters were obtained (see Table 3). The first cluster revolved around data literacy (in red) and included terms such as library/librarian/resource/service/teacher/big data/data use/data visualization. The second cluster was related to statistical literacy (blue), with applications in various disciplines such as statistics/biology/business/engineering/medicine/pedagogy/statistician/social sciences. The third cluster was centered around Data-based assessment and e-science (green), encompassing terms associated with quantitative methods, like experiment/evaluation/performance/test/score/scale/sample/variable. Lastly, the fourth thematic cluster considered e-science (mustard), taking into account digital competence and the application of DL to society and citizenship, including terms like citizen/society/community/government.
Main topic clusters.
The incidence of the main terms used in titles and abstracts over the time period analyzed is shown in Figure 4. Each term is color-coded to the mean year of publication.
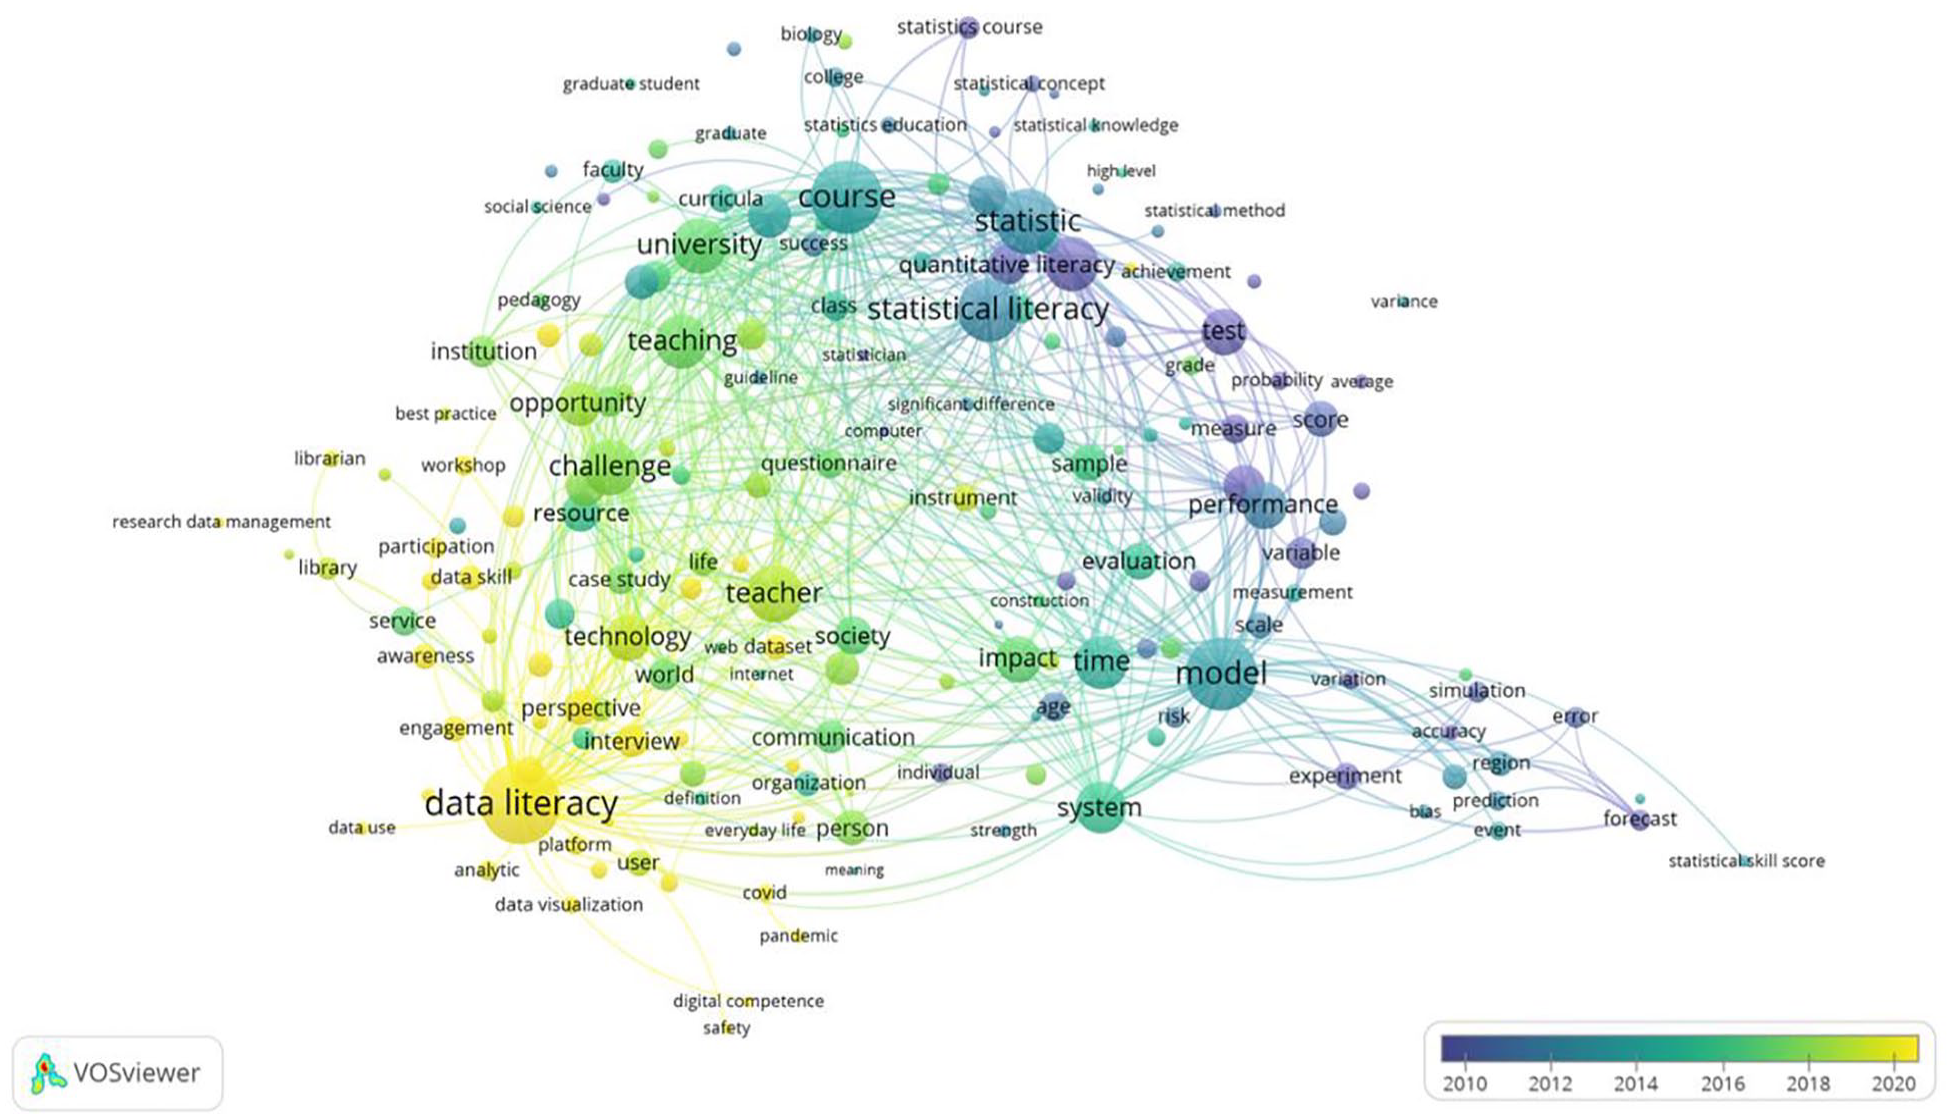
Evolution over time of main trend topics.
Identifying the research fronts by co-citation keyword analysis
The co-citation analysis of keywords was conducted using CiteSpace (Jia and Bava Harji, 2023). A total of 192 clusters were generated with 642 nodes and 1310 links for the research period from 1990 to 2023 (time slice 1), with a modularity Q value of 0.7836 showing a good separation among groups and a high mean silhouette score of 0.9389. This result indicates that the references within a cluster have similar content (Chen, 2020). Six major clusters of papers that share the same keywords have been identified.
Table 4 presents a comprehensive overview of the main keywords and associated papers displaying the cluster size, mean year, silhouette score, Label (LSI), and citing publications. As expected, the largest cluster with the most co-cited keywords is categorized as data literacy, encompassing 72 papers with a high silhouette value of 0.938. The mean year of these publications is 2018. This is the latent semantic indexing (LSI): data literacy; data capability; data visualizations; k-12 education; multimodal literacy; and academic librarians.
An overview of the co-keywords network.
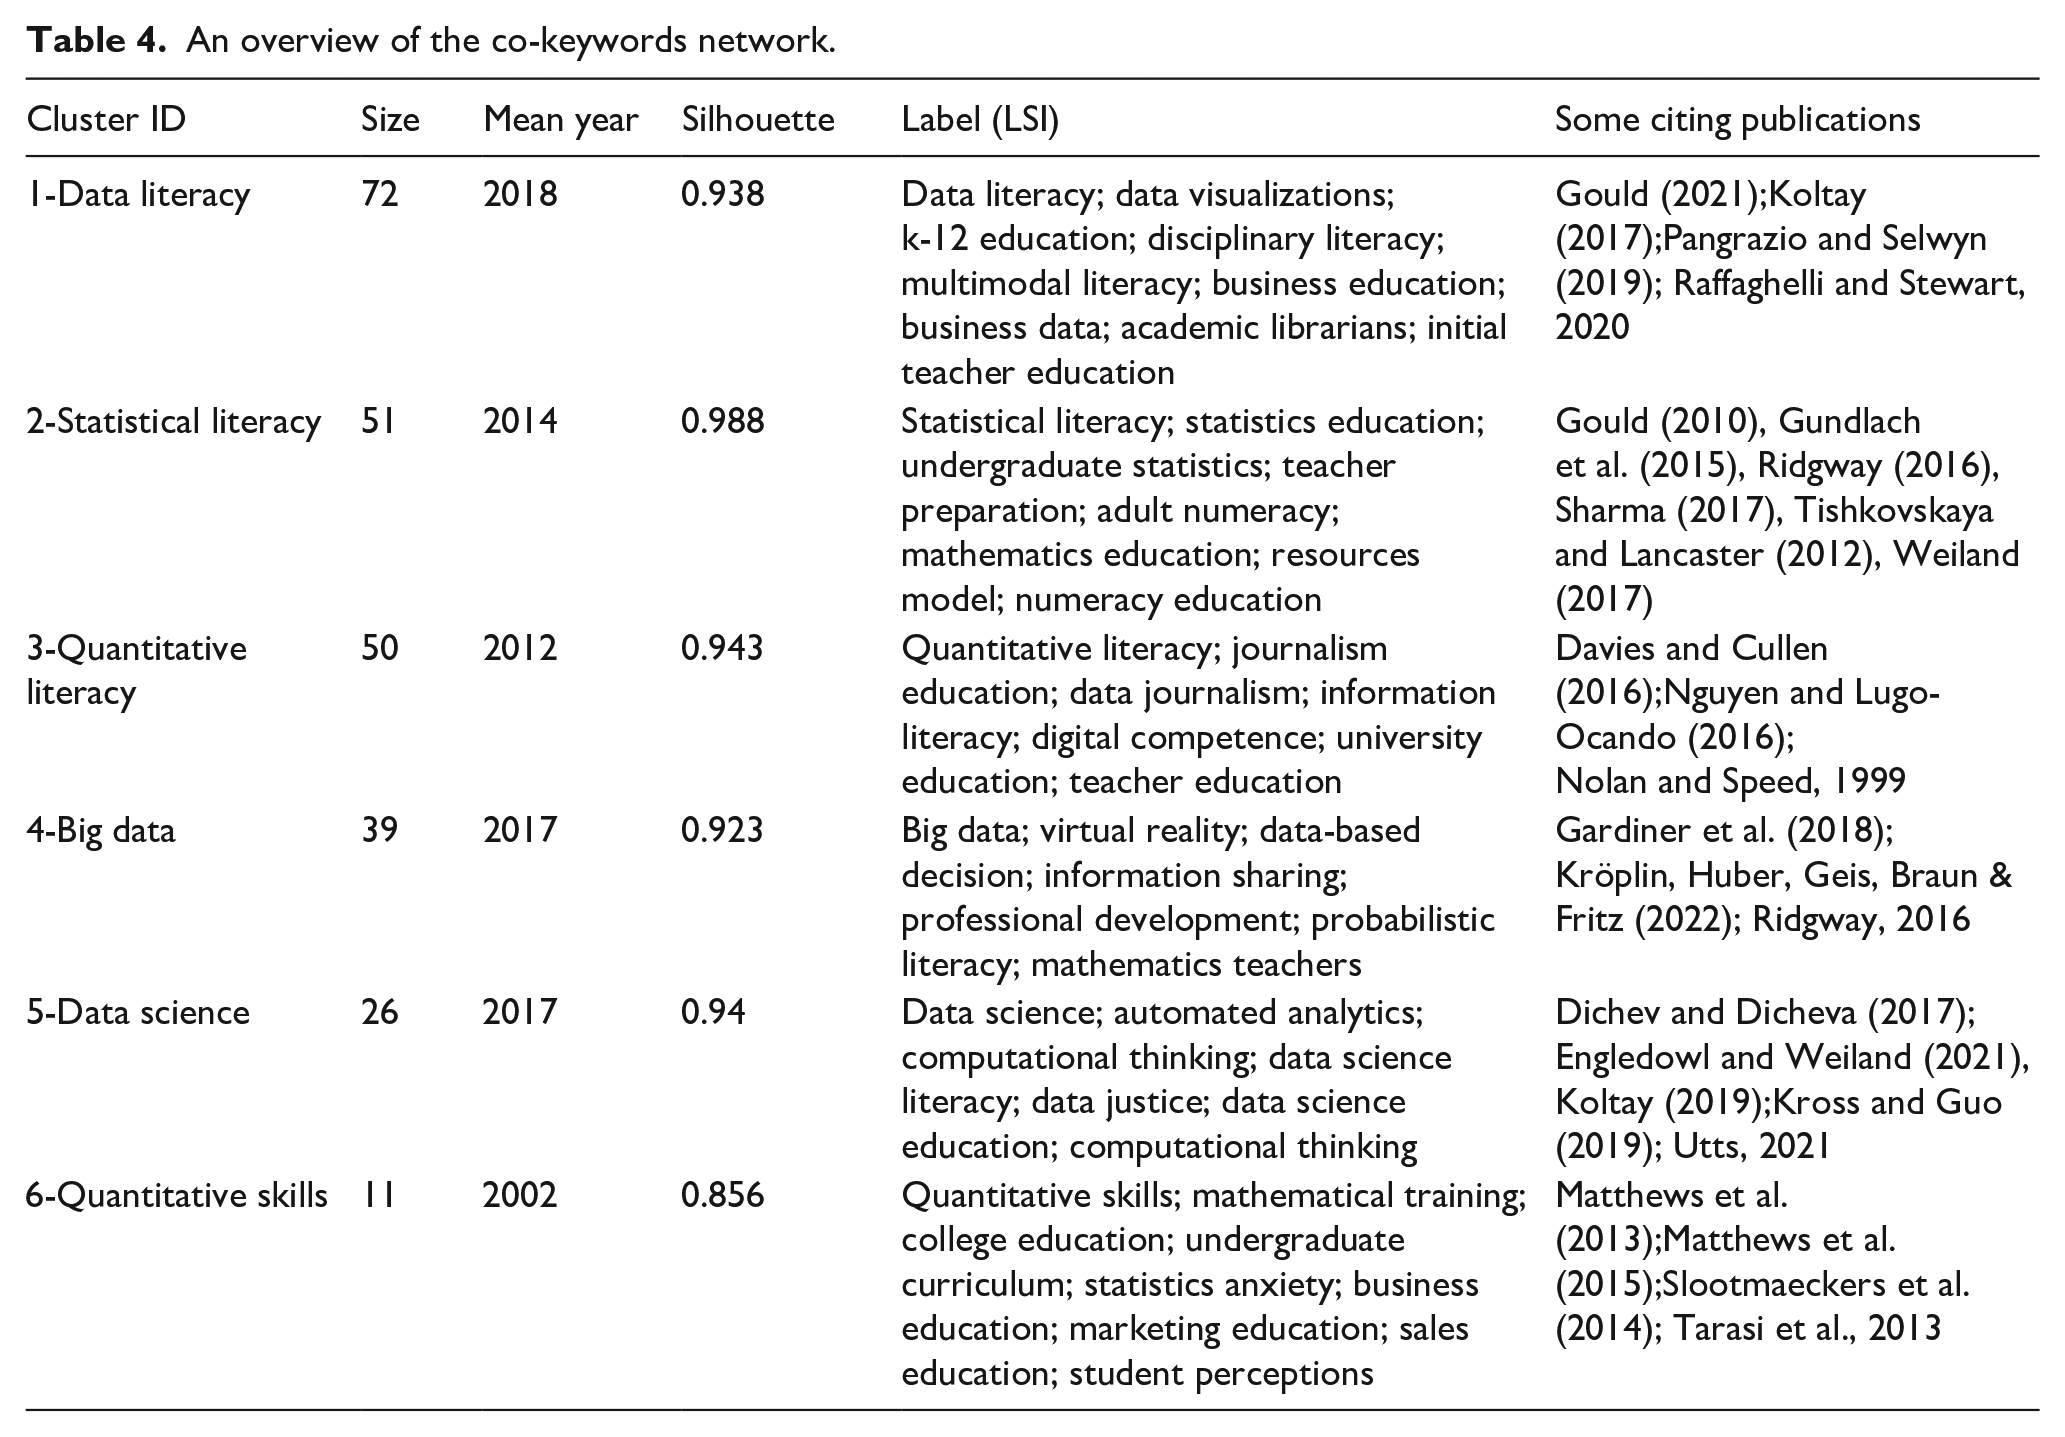
The statistical literacy cluster includes 51 publications. Its silhouette score of 0.988 indicates that it is the most compact group. The mean year is 2014. This is the cluster’s LSI: statistical literacy; statistics education; undergraduate statistics; mathematics education; disciplinary literacy; numeracy education; and statistical reasoning.
The third cluster, related to quantitative literacy, includes 50 items, with a silhouette value of 0.943. The mean year is 2012. This is the cluster’s LSI: quantitative literacy; data analysis; data journalism; information literacy; digital competence; higher education; and teacher education.
The big data cluster includes 36 publications, and has a silhouette value of 0.923. The mean year is 2017. This is the cluster’s LSI: big data; virtual reality; data-based decision; data-driven decision; data use; information sharing; professional development; probabilistic literacy; and mathematics teachers.
The fifth cluster, called data science, includes 29 publications and has a silhouette value of 0.940. The mean year is 2017. This is the cluster’s LSI: data science; automated analytics; computational thinking; data science literacy; data justice; and data science education.
Finally, the smallest cluster is on quantitative skills, consisting of only 11 items. Its consistency is lower, with a silhouette value of 0.856. The mean year is 2002. This is the cluster’s LSI: quantitative skills; mathematical training; college education; undergraduate curriculum; statistics anxiety; and student perceptions.
Most influential keywords, authors, and journals
Top keywords based on citation bursts
The keywords and publications with the strongest citation burst, including their first publication year, burst intensity, and the start and end year of the burst period, are displayed in Figure 5, ordered by the strength of the burst. These findings provide valuable insights into the major research trends in this domain. According to the strength of the burst, we can highlight the terms Data literacy (strength 10.11), which emerged in 2011, with the strongest bursts starting in 2020, followed by Data science (6.23), which was born in 2013, with a burst from 2021 onward. The third strongest burst is devoted to quantitative literacy (5.25) followed by big data (5.14) and statistical literacy (4). Additionally, clear evidence is found of the evolution in the usage of terms such as quantitative literacy, which emerged in 1997, quantitative skills (2002) and statistical literacy (2005) toward terms such as data literacy and data use (2011) and big data and data science (2013), or digital competence in recent times (2021).
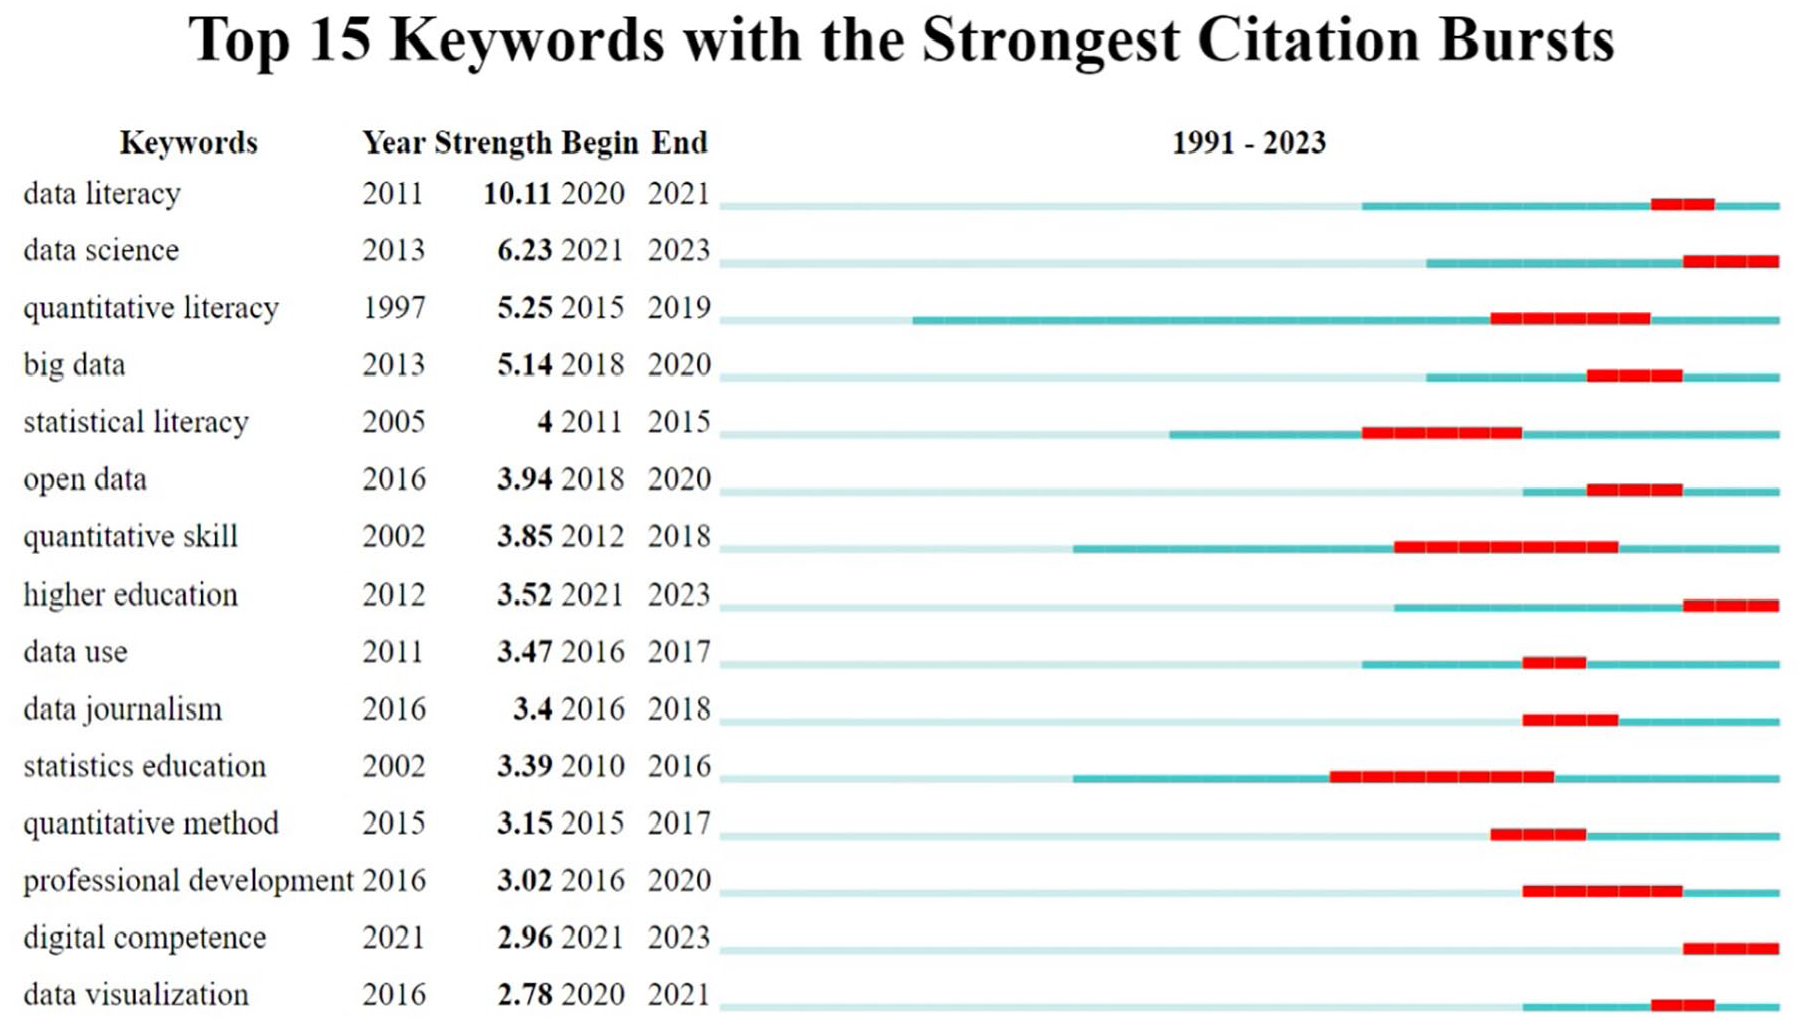
Top keywords by the strength of their citation bursts.
Top cited authors based on citation bursts
Regarding the most cited publications, we can highlight the work of Mandinach and Gummer (2013), which presented the burst with the highest intensity (11.6) and duration over the period 2014–2018, followed by Calzada Prado and Marzal (2013) with a burst (9.89) from 2016 to 2018. Additionally, we can cite Mandinach and Jimerson (2016), which has bursts of 9.53 in 2019–2021, Kippers et al. (2018) and Pangrazio and Selwyn (2019), whose bursts (8.05 and 7.96) emerged in 2020 and are still active, and Koltay (2015) with a burst (7.88) from 2016 to 2020 (Figure 6).
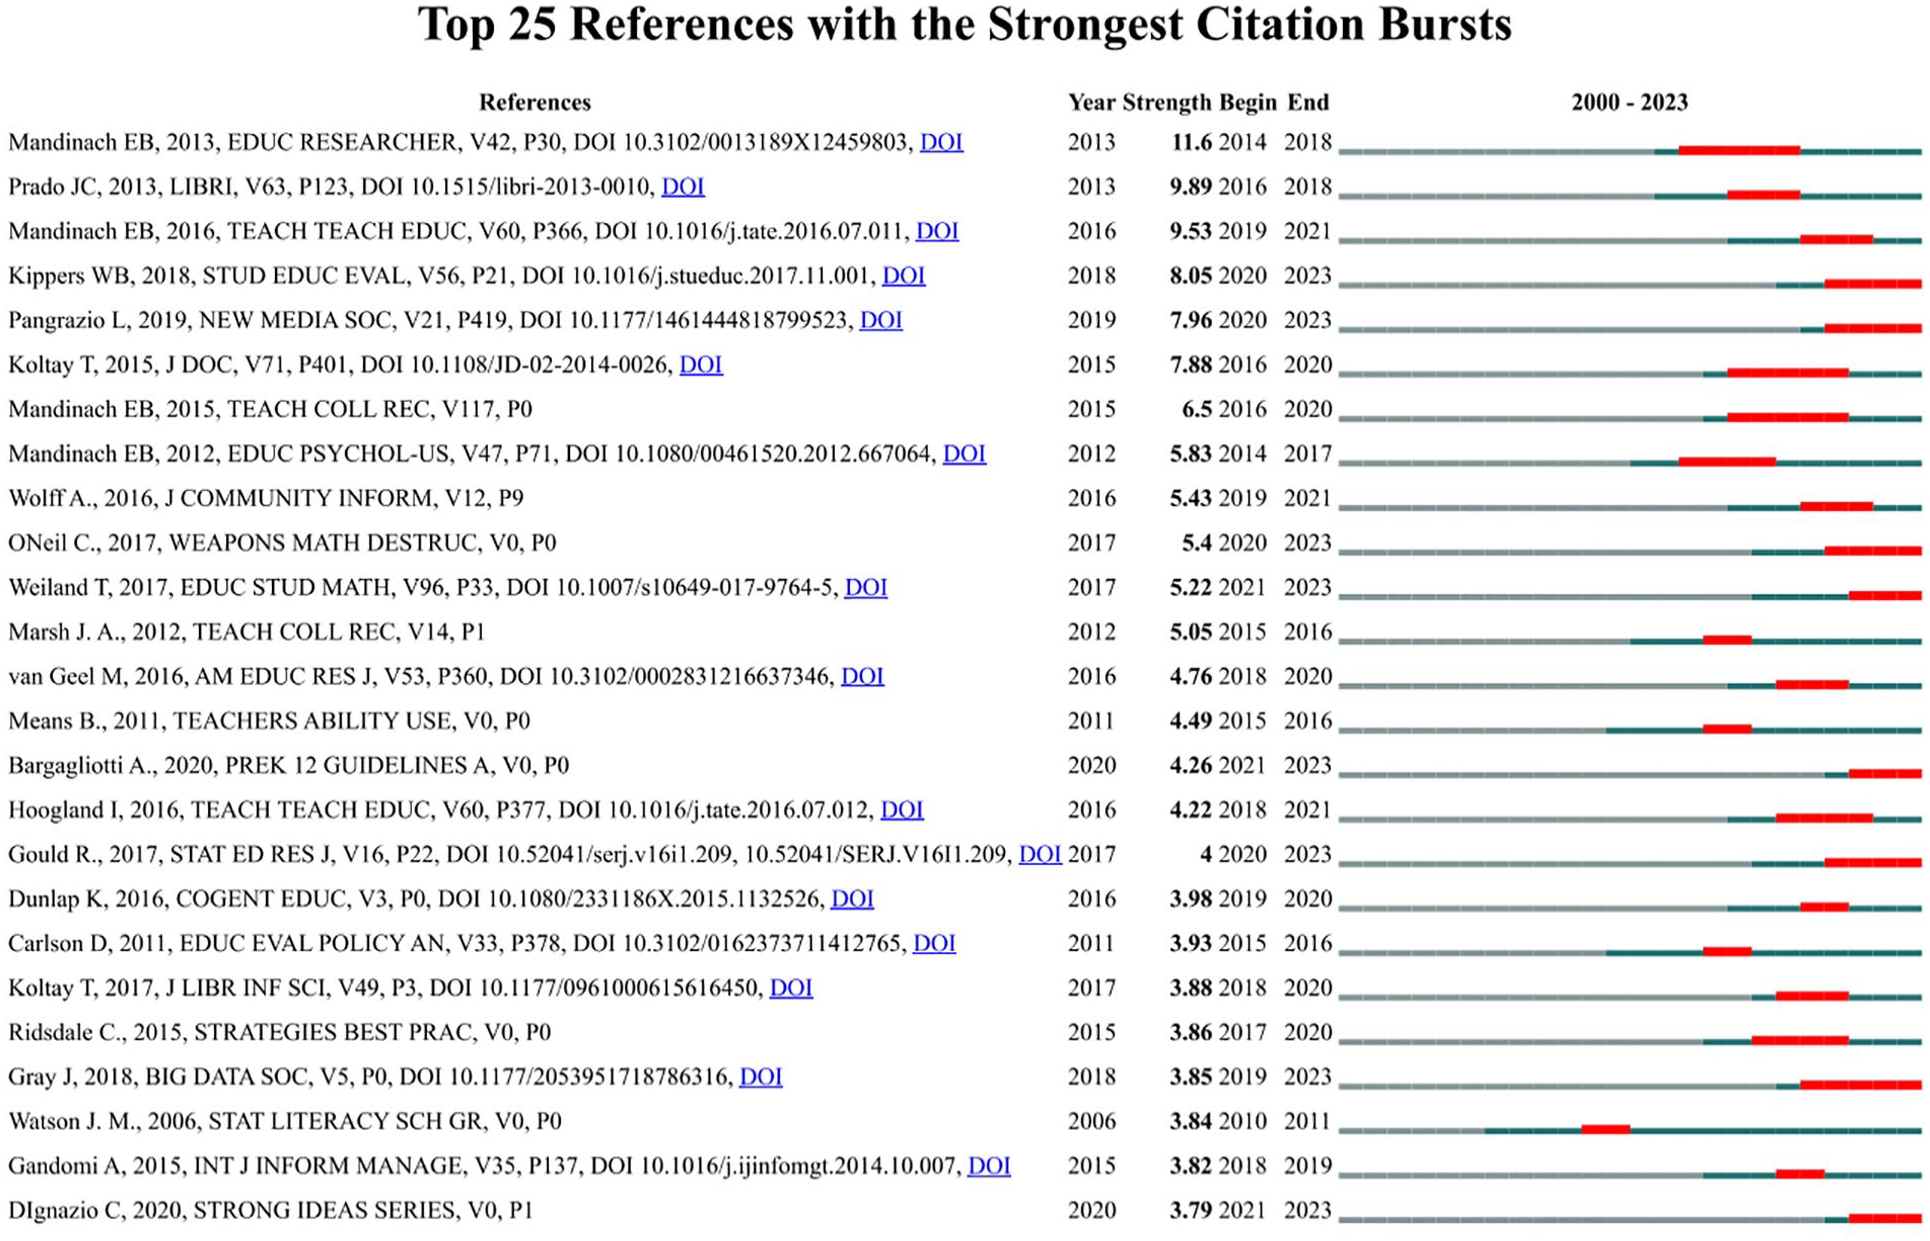
Top references by strength of the citation burst.
Top-cited journals based on citation bursts
An examination of the main journals publishing on DL and closely related literacies provides an overview of the main research and practice communities. Among the top 20 journals ranked by citation bursts, the great majority (14) are directly related to the field of education, but there are also three journals from other communities: mainly medicine (2), libraries (1), computer science (1), psychology (1) and meteorology (1). The top-ranked journals by citation bursts are the Journal of Statistics Education, with bursts of 17.75 for over a decade (2006–2017), and Thesis, with bursts of 13.13 in 2016–2019. The third position is for JAMA—Journal of the American Medical Association, with bursts of 11.62, in 2003–2011. Currently, the top-cited journals with high citation bursts, which are still active and highlight the significance of multidisciplinarity, are Technology, Knowledge and Learning (burst of 8.47), ZDM-Mathematics Education (7.85), International Journal of Mathematical Education in Science and Technology (7.73) and Learning Media and Technology (7.64) (Figure 7).
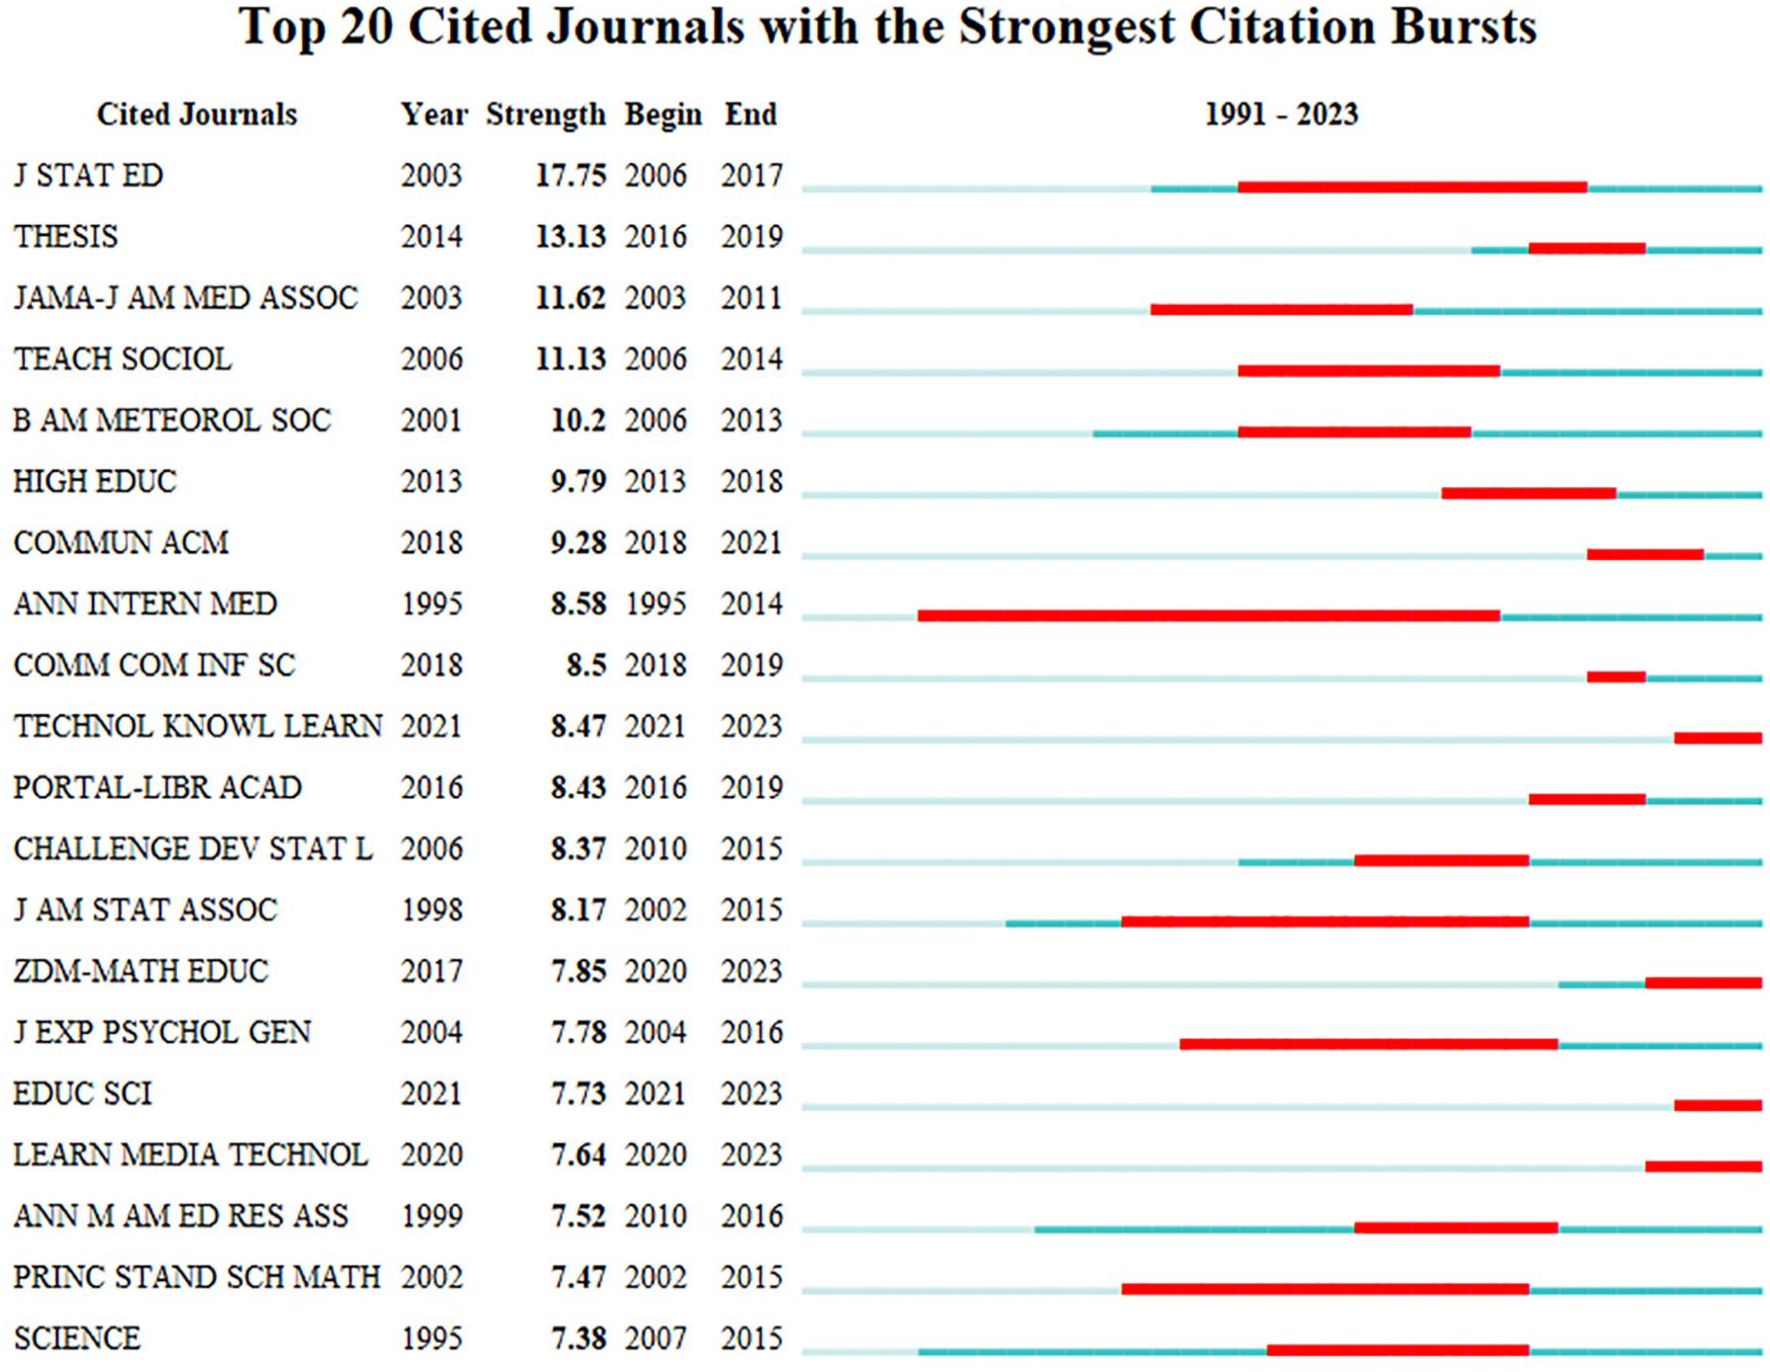
Top-cited journals by the strength of the citation burst.
Discussion
Regarding RQ1, the results of our bibliometric analysis of scientific production in WoS on the data literacy field from 1980 to 2023 reveal a significant increase in publications on DL and their closely related literacies. This indicates that this topic is garnering increasing interest among researchers and has consolidated its presence in the literature over the past decade. These results are coherent with those of a recent literature review on the topic by Ghodoosi et al. (2023).
Regarding authors by country, our results produce a set very similar to those of Sheriff and Sevukan (2023, p. 132-3) with some changes in the rankings. Taking the first five positions in our WoS-based wider-scoped study, English-speaking countries lead—USA (888), UK (194), Australia (143), Germany (118) and Canada (96); and in Sheriff and Sevukan’s Scopus-based DL-focused study, China (38) is in second position – USA (188), China (38), Australia (33), UK (31) and Germany (26).
Only four authors from the initial top 10 are common to both papers (Koltay, Mandinach, Gummer and Pangrazio). So, the specific search string performed in bibliometric literature reviews can alter notably the landscape offered, especially in terms of the actual ranking of papers.
Concerning the most productive journals, in Sheriff and Sevukan (2023) they are mainly LIS related. In contrast, the top journals in our study have an educational scope as a result of the wider range of our research. (p. 140)
Regarding RQ2, the combination of co-occurrence analysis in titles and abstracts with co-keyword and citation burst analysis offers a comprehensive understanding of the field under study. Firstly, concerning the analysis of words in titles and abstracts by through co-word cluster analysis, the results provide insight into the main areas of application and practice of DL. We find some connections with areas that were presented in the literature review section when sketching the evolution of the data literacy field and related literacies. First, the cluster is devoted to data information literacy (Carlson et al., 2011; Carlson and Johnston, 2015; Koltay, 2017, 2019; McKinney and Shaffer, 2023), which is a library-centered movement, although very committed to cooperation with other academics and professionals. Second, statistical literacy is found mainly in bio-health, business or social sciences education, where the teaching protagonists are statisticians interested in the significant implications of the data revolution for statistics education (Aggarwal, 2018; Berndt et al., 2021; Birkenkrahe, 2022; Ridgway, 2016; Shields, 2005; Woltenberg, 2021). The third is data-based assessment, which is also mainly carried out by statisticians and operational researchers, but with a focus on advanced research topics in postgraduate learning and research practice (Brock et al., 2021; Kläre and Jung, 2019; Marchy and Juandi, 2023; Šorgo, 2018; Tiro, 2018). Finally, there is citizen empowerment, where the leaders are public managers, social scientists and open government data scientists (Craveiro et al., 2016; Poirier, 2021; Shreiner, 2020; Utts, 2003), but also media academics and information scientists concerned about disinformation and the information challenges to democratic life (Koltay, 2017; Pothier and Condon, 2020; Valverde-Berrocoso et al., 2022).
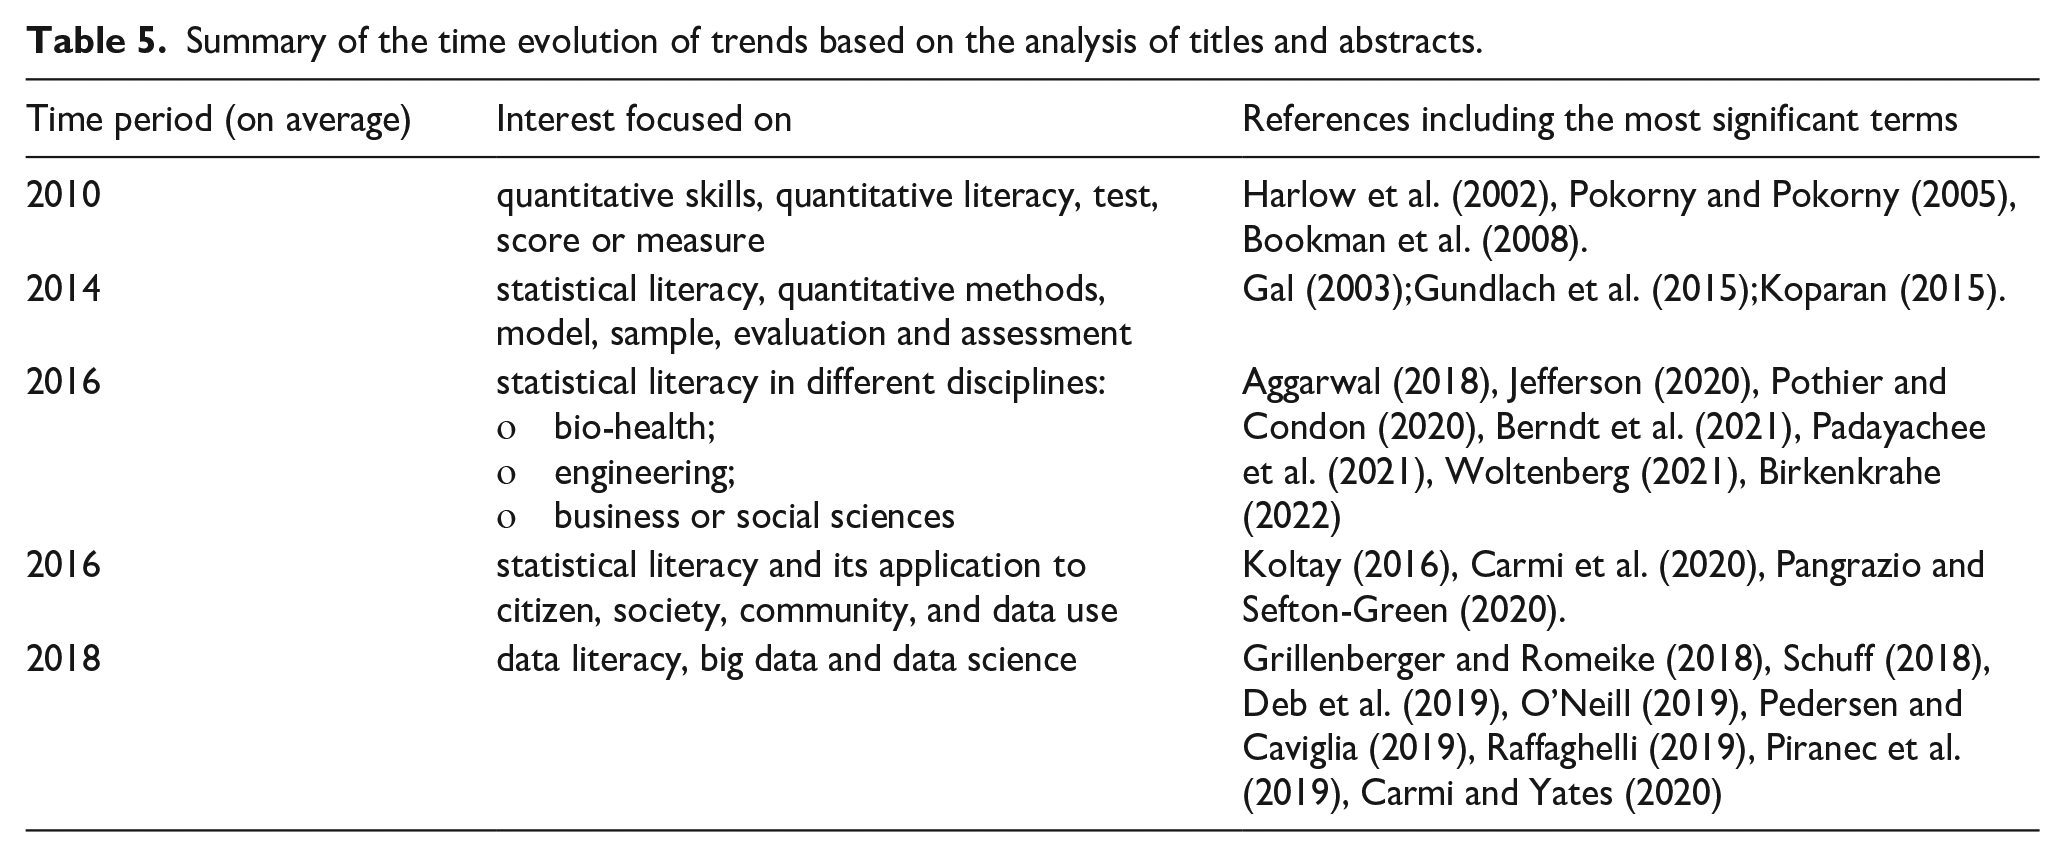
The narrative that emerges from the strict interpretation of the data provided by the cluster analysis corresponds closely to the evolution of the group of disciplines that was outlined in the literature review section. Based on the insights presented in IASSIST (Hunt, 2004) and Carlson and Johnston (2015), there has been a noticeable development in the terminology and thematic focus of the corpus. More specifically, the analysis of the evolution over time of the words used in titles and abstracts is consistent with the results obtained by Ghodoosi et al. (2023) using a different methodology, namely, a systematic quantitative review. Co-word analysis confirms that initially these studies were centered on quantitative skills, quantitative literacy, test, score or measure. However, by 2014, there was a shift toward statistical literacy and quantitative methods, including terms such as model, sample, evaluation and assessment. Around 2016, publications covered both the application areas of statistical literacy in different disciplines, and its application to citizen, society, community, and data use. Around 2018, the usage of terms such as data literacy, big data and data science became firmly established (Table 5).
Summary of the time evolution of trends based on the analysis of titles and abstracts.
Secondly, with regard to the co-citation analysis of keywords conducted using CiteSpace, results reveal six main clusters of terms, categorized as Data Literacy, Statistical Literacy, Quantitative Literacy, Big Data, Data Science, and Quantitative Skills.
These findings support the earlier analysis of co-occurrences of terms in titles and abstracts conducted using VOSviewer and the consistency noted in the terminology and chronological trends, reflecting the history of DL precisely as it was presented in the literature review section. Dates show some delay compared to the first occurrences because they are means, representing the mean year of publication.
The smallest cluster (quantitative skills) is also the first to appear and it has lost importance over the period, giving up its place to quantitative literacy, which is a more articulated and solid movement than the previous one. Quantitative literacy has the second smallest size, which seems logical, as statistical literacy became independent at a later stage when it separated itself from its quantitative literacy roots (Shields, 2005; Šorgo, 2018; Tiro, 2018). After that, DL has grown increasingly connected to two of the main research and development trends of the last decade (Forbes, 2017; Manyika et al., 2011), namely, big data and data science. In fact, both movements are the two sides of the same coin: big data is more practical and business-oriented whereas data science is more theoretical and academic; yet, both deal with the increasing importance, availability, computability and profitability of data in our society (Gardiner et al., 2018; Poirier, 2021; Sander, 2020a, 2020b). At the end of the period, a number of authors began to discuss data science literacy as a specific topic in itself (Birkenkrahe, 2022; Overton and Kleinschmit, 2022, 2023; Wise, 2020). The data science movement is the response to the new possibilities for the application of statistical analysis in almost any field of research and practice opened up by the collection of and access to big data in the Internet and semantic web environment, as well as increasingly powerful computing platforms, languages and applications. At the current time, science data literacy conveys a wider, more progressive and ambitious meaning than data literacy, because it is about managing the whole cycle of data with advanced statistical and computing tools. Nevertheless, its use will probably be more restricted to academic and research environments, while data literacy keeps a much wider scope for other educational levels, disciplines and constituencies.
Finally, regarding the emergence of DL, the results of the analysis of the appearance periods and bursts of keywords confirm and complement the findings in the literature review. As Ghodoosi et al. (2023) stated, DL surged in the last two decades thanks to cooperation among statisticians, information professionals (notably academic librarians) and academics involved in education. The literature analyzed confirms its inception in 2011. It evolved from research initially centered on quantitative literacy, which emerged in 1997. This evolution progressed through an interest in quantitative skills in 2002 and, shortly afterward, toward statistical literacy (2005), which is related to statistics being considered a distinct field of science that is separate from or within (depending on the perspectives) the general realm of mathematics (Tiro, 2018). The evolution of terminology has shifted toward the data movement burst, generating a concern for data literacy and data usage in 2011. In addition, big data and data science (2013) currently seem to be catalyzing the interest together with the broader approach of digital competence, which emerged in 2021 (Bacalja et al., 2022; Zhao et al., 2021). In any case, as stated in the literature review, the interest in these topics is a relatively recent phenomenon (since the turn of the century) that is closely connected with the expansion of the internet and the web.
Conclusions
This study has investigated the strategic field of data literacy using bibliometric techniques, based on the analysis of a dataset of journal articles and proceedings indexed in WoS during 1980−2023. As we have not found any similar studies conducted on publications in WoS, this study presents novel results. Additionally, we have explored a broad spectrum, encompassing DL, quantitative and statistical literacy.
Regarding RQ1, education on data in a broad sense and DL in particular are quickly growing research topics that have gained exponential attention in the last decade, although the total production is still small compared to other literacies, such as information literacy. The most relevant and influential authors have been effectively identified, providing a primary source of information for readers interested in delving into the field of data literacy and related areas/topics. English-speaking countries dominate the top positions, in terms of volume of publications, with the USA, UK, Australia, Germany and Canada leading the list. This allows readers to access a valuable reference in order to gain a better understanding of the landscape and key contributions in this ever-evolving domain.
The diversity regarding the identity and scope of data literacy is evident, as manifested in the wide range of research areas that have been incorporated into this field of study, such as Statistics & Probability, Education & Educational Research, Communication, Information Science & Library Science, Communication or Psychology, among others.
Finally, as regards RQ2, the main methodological contribution of this paper lies in the combination of two scientometric techniques to study the field of DL based on words in titles, abstract and keywords, namely co-occurrence analysis (using VOSviewer) and co-citation analysis (using CiteSpace). This two-fold analysis provides two complementary views. On the one hand, it reveals the major research trends and the interdisciplinary nature of the field by mapping the most frequently used keywords, regardless of who cites them, according to their co-occurrence in the titles, abstracts and keywords of each record. On the other hand, it sheds light on the specialties of the working groups and the areas of origin that support DL and its data-related literacies, by mapping keywords by citations.
This dual approach has made it possible to identify the main transdisciplinary domain topics (Data Literacy, Statistical Literacy, Data-based Assessment, and e-Society) and also the major thematic citation clusters based on the keywords that were used (Data Literacy, Statistical Literacy, Quantitative Literacy, Big Data, Data Science and Quantitative Skills) in the corpus under study. It is obvious that consistency exists between the terms used by authors in titles and abstracts and the results of the keyword analysis. Co-occurrence keyword analysis shows the main areas of practice, which are quite compact and distinct, whereas co-citation keyword analysis shows the main research fronts and, in particular, the new emerging fields of big data and data science. It has been possible to connect the disciplines to specific communities, in a non-exclusive way: data literacy to librarians, statistic literacy to statisticians and quantitative literacy/skills to mathematicians.
But when examining the papers, which requires a qualitative approach (e.g. Pinto et al., 2023), one can observe that the educational focus, that is, the focus on literacy, provides a comprehensive interest that forces the specialist to consider the different aspects of the data cycle. For example, a mathematics teacher interested in promoting quantitative thinking with a group of students will need to teach them about data sources (Brock et al., 2021). Although from the perspective of a statistician and carefully delimiting statistical literacy competences from other literacies, Tiro (2018) ended up promoting statistical literacy in the broader field of information literacy. More complex activities are even more interrelated: for example, as Shields (2005) stated, data evaluation is a key element in information literacy, statistical literacy and data literacy. Projects with undergraduates usually become completely cross-disciplinary (Šorgo, 2018).
When considering their evolution, a noticeable progression in the DL terminology is observed. The first to approach this field were those who focused on quantitative literacy and statistical literacy in the period 1980–2012, with data literacy emerging in 2011. The evolution in 2012−1015 was focused on the applications of statistical literacy in different disciplines that were published on average in 2016. More recently, from the year 2018 onward, topics like citizenship, society and data use have contributed to the advancement of data literacy, and are currently leading to the development of emerging fields of current interest, such as big data and data science. It is clear that data literacy has emerged as a thematic field of interest among researchers and points to data literacy gradually building momentum, separate from data analysis, and gaining momentum closer to the 2010s or 2020s. It is very interesting to consider that, initially, DL emerged from the broader field of quantitative literacy/skills, sometime later than statistical literacy. The moment coincides with the emphasis on data sharing made possible by Internet and the semantic web. But in recent years there has been a new confluence between statistics, data, computing and quantitative thinking around the emerging data science cluster. At the present time, it is difficult to make an educated guess about the future evolution of the field. There is likely to be a specialization in the different phases of the data cycle: statistical literacy in the creation phase, and data literacy in the preservation and sharing phases. Data science, however, will remain a transdiscipline for many years to come, with diffuse frontiers and contributing to the political promotion of data in science and education.
One of the potential limitations of our study could be the exclusion of Scopus and other databases such as ERIC. However, our focus has been on offering an innovative perspective and comprehensive scope of the emergence of DL and the development of related literacies using the literature published in WoS. The reason for choosing this database is that it has not previously been studied and contributes with careful data curation and selection policies, and therefore with a distinct approach.
Because the realm of data literacy, including its interconnected literacies and disciplines, is continuously growing and developing, it is crucial to consistently conduct ongoing research using different sources (WoS, Scopus, ERIC) and methods (scientometric analysis, systematic reviews, theoretical reviews).
Footnotes
Authors’ contribution statements
Emergence and Evolution of Data Literacy: Insights from a bibliometric study
Declaration of conflicting interests
The author(s) declared no potential conflicts of interest with respect to the research, authorship, and/or publication of this article.
Funding
The author(s) disclosed receipt of the following financial support for the research, authorship, and/or publication of this article:This paper is part of the R+D+I “Knowledge Generation”, PID2021-128808OB-I00, funded by MICIU/AEI/ 10.13039/501100011033 and, by the European Regional Development Fund (ERDF/EU).
Data availability statement
The data can be obtained by sending a request by email to the corresponding author.