
Abstract
This paper aims to provide researchers in the field of library digital transformation (LDT) with a systematic and comprehensive knowledge map, helping them quickly understand related key knowledge, evolutionary trends, and research frontiers. Using bibliometric methods like CiteSpace and VOSviewer software, a scientific knowledge map was constructed for 1736 publications (sources: Web of Science and Scopus) in the field of LDT spanning from 1990 to 2024. Further, a systematic review of the publications was conducted qualitatively and quantitatively. Consequently, findings indicate that LDT had garnered researchers’ attention rapidly since 2005, with the number of publications following an exponential function of y = 3.0137e0.1288x. The hotspots of research in this field primarily focused on three aspects: the influencing factors of LDT, the significant role of information technology (IT) in LDT, and artificial intelligence-driven LDT. The future research trends will concentrate on breaking the obstacles to LDT (including fund investment, facility improvement, information literacy education, professional talent cultivation, and service management enhancement) and the intelligent and personalized applications of artificial intelligence.
Introduction
The rapid development of modern information technologies represented by big data, artificial intelligence (AI), cloud computing, and 5G has driven rapid changes in all sectors of society and is continually reshaping our cognition, behaviors, learning, production, and lifestyles. The global investment in digital transformation has surpassed $2.5 trillion in 2024, as reported in the IDC’s Worldwide Digital Transformation Spending Guide Taxonomy (International Data Corporation, 2024). Over the next 5 years, the Compound Annual Growth Rate (CAGR) of the global digital transformation market is projected to reach 15.4% (Statista, 2024). Promoting digital transformation across various sectors through modern IT has become a global consensus, hence urgently necessitating the unceasing creation of new business forms, the design of new models, and the development of new applications (Yang et al., 2023). Meanwhile, libraries as crucial venues for knowledge preservation and knowledge services in human society also face challenges posed by changes in the environments for knowledge creation, dissemination, and service. From a micro perspective, these changes have disruptively affected the internal structure and manifestation of library resources, users, spaces, and services. From a macro perspective, these changes have given rise to new interpretations and value elucidations for the cultural missions and social contributions of libraries (Sun et al., 2023).
Digital transformation typically involves three concepts: “digitization,” “digitalization,” and “digital transformation.” According to Gartner’s IT Glossary, digitization refers to the process of conversion from a paper-based or analog format to a digital format, such as the digitization of traditional documents (Gartner, 2024). Digitalization refers to converting workflows, as well as the interaction and communication between humans, machines, and systems, into digital formats such as integrated library management systems and the like information application systems (Gartner, 2024). Digital transformation refers to the development of digital technologies and supporting capabilities to create a dynamic digital business pattern (Gartner, 2024). Public and academic libraries have undergone two major transformations since their inception. The first was digitization, which shifted libraries from traditional paper-based physical forms to digital mobile forms. The second was digitalization, which changed digital libraries into intelligent and smart libraries. Currently, libraries are facing digital transformation (Chu et al., 2022). Generally, the essence of LDT is to find new development directions and trends in library business, operation, and organization through data analysis and insights, and to achieve a deep integration of resources and services through optimization and innovation, thereby enhancing user experience and service efficiency (Chen, 2022a). Post-digital transformation, libraries will become user-centered and data-driven flexible ecological organizations capable of continuously iterating technologies and rapidly perceiving user needs.
Initial research on digital transformation primarily focused on analog-to-digital conversion (Doernberg et al., 1989), media transformation (Huang, 2004), electronic publishing (Thomas, 1999), teaching innovation (Kearley and Phillips, 2004), and industrial transformation (Francis and Bessant, 2005). Researchers paid attention to the impact of digital transformation on traditional industries and organizations, exploring ways to heighten the competitiveness of enterprises or organizations through digital transformation. In recent years, numerous researchers have begun to be concerned about the key elements for successful digital transformation, which mainly include advancements in digital technology, diffusion of innovation, enhancement of user experience, and demands for competitiveness (Cui and Pan, 2015; Halpern et al., 2021; Morakanyane et al., 2020; Oswald and Kleinemeier, 2017; Zhu et al., 2006). Meanwhile, the impacts, pathways, and strategies of digital transformation have gradually become the focus of attention for stakeholders (Jafari-Sadeghi et al., 2021; Kerroum et al., 2020). In terms of digital transformation in libraries, relevant research primarily involved academic libraries. Researchers explored the impact of library digitalization on the level of service equalization (Peng and Jin, 2023), digital strategies for libraries (Li and Yuan, 2023), controlled digital borrowing models in libraries (Liu et al., 2023), strategies for digital transformation in university libraries (He et al., 2021), and visions for digital transformation in university libraries (Yao and Gao, 2022).
Researchers have made extensive and diverse research achievements by focusing on the digital transformation of libraries. However, three critical gaps remain: (1) Existing studies predominantly focus on isolated aspects of digital transformation (e.g. service models, technical implementations) rather than providing a holistic analysis of the field (Liu et al., 2023; Peng and Jin, 2023); (2) Current reviews are fragmented by disciplinary boundaries, with limited integration of insights from computer science, business management, and library science (Khoeini et al., 2024; Nakaziba and Ngulube, 2025); (3) Traditional narrative reviews struggle to map rapid technological advancements due to their reliance on subjective interpretation and small-scale samples (Chen, 2017; Yan et al., 2024). These limitations obscure actionable insights for libraries undergoing complex digital transitions. The digital transformation of libraries represents a cutting-edge interdisciplinary field. This study address these gaps by conducting the first large-scale bibliometric analysis of LDT research. The authors systematically analyze 1736 documents spanning 34 years, employing co-words analysis and burst detection algorithms to objectively identify research trends and emerging topics. This methodology enables two key contributions: (1) A unified framework integrating interdisciplinary perspectives on library digital transformation; (2) A data-driven roadmap for future research priorities, particularly in understudied areas such as public and academic libraries.
In this study, the authors leverage bibliometrics, a methodology rooted in quantitative documentary analysis since 1969 (Qiu, 1988), to statistically map research impacts, collaboration networks, and thematic evolution. By incorporating quantitative analysis alongside qualitative methods, bibliometrics allows for a more objective and reliable literature review process.The aim is to provide stakeholders with a panoramic view of this field, enabling them to quickly know about the evolution, hotspots, and trends in research on the digital transformation of libraries. The specific research questions are as follows: (1) What are the characteristics of collaboration among countries, institutions, and authors on the topic of LDT? (2) What are the main research hotspots regarding the application of digital transformation in libraries worldwide? (3) What are the research frontiers and future research trends in LDT?
Methodology
Data acquisition
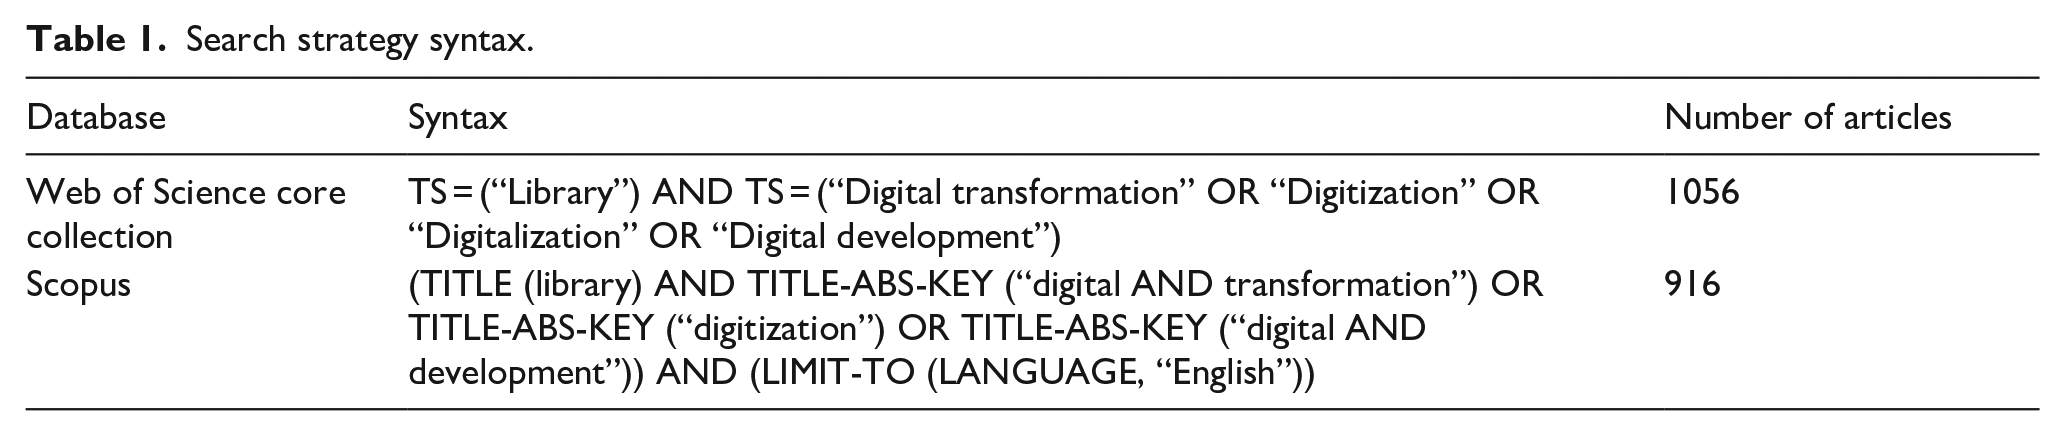
Data is the basis for a scientific analysis of a knowledge map. Meanwhile, a targeted, comprehensive, and accurate document retrieval is quite important (Chen et al., 2015). The literature retrieval strategies were based on the guidelines of the Preferred Reporting Items for Systematic Reviews and Meta-Analyses (PRISMA), a framework for reporting and synthesizing literature review (Moher et al., 2009). Following PRISMA suggestions, the authors conducted four steps in locating and reviewing relevant studies. For the first step, Web of Science (WoS) and Scopus, were searched for relevant articles on November 3, 2024. WoS and Scopus were selected as the primary databases due to their comprehensive coverage of high-impact journals across disciplines, rigorous indexing standards, and widespread adoption in bibliometric studies (Martín-Martín et al., 2020). WoS provides authoritative coverage of core journals in library science and computer science, while Scopus offers broader interdisciplinary inclusion, ensuring balanced representation of technological and social aspects of digital transformation (Singh et al., 2021).The search syntax was designed iteratively through pilot testing to balance recall and precision. Initial keywords (library digital transformation, digitization, digitalization, digital development) were validated against prior systematic reviews (Nakaziba and Ngulube, 2025) and expanded using controlled vocabularies (e.g. MeSH terms “libraries, digital”). Boolean operators (AND/OR) and truncation (digital*) were applied to capture variants (digitized, digitalized).The detailed search strategy syntax is provided in Table 1, and the time span was 1990–2024 (first pubulised in 1990). Using a combination of the identified keywords in the initial search, yielded 1972 journal articles (Figure 1 displays the study selection flow using PRISMA guidelines). After removing duplicates, 1867 articles remained. Next, the titles and abstracts of the articles were screened by setting and applying the following inclusion criteria: (a) topics relating to the keywords, (b) the full text written in English, and (c) peer-reviewed studies published in academic journals (excluding book chapters, conference articles, and theses) to ensure the inclusion of published articles that have undergone a peer-review process. Restricting the analysis to English-language, peer-reviewed journal articles ensured consistency in quality assessment and facilitated comparative analysis of global trends (Keysar et al., 2012). However, this may exclude regionally impactful non-English studies and gray literature conference proceedings, technical reports), potentially under-representing innovations in non-Anglophone contexts. To mitigate this, future studies could incorporate multilingual databases like CNKI or SciELO. As a result, 1803 articles were selected for the next step of full-text review. Next, came the evaluation and eligibility of the full-text versions of the published articles. This full-text review resulted in further exclusion of 67 articles as they were found not meeting all the inclusion criteria. Following these assessments, 1736 articles met all the inclusion criteria. The analysis approaches are described below.
Search strategy syntax.
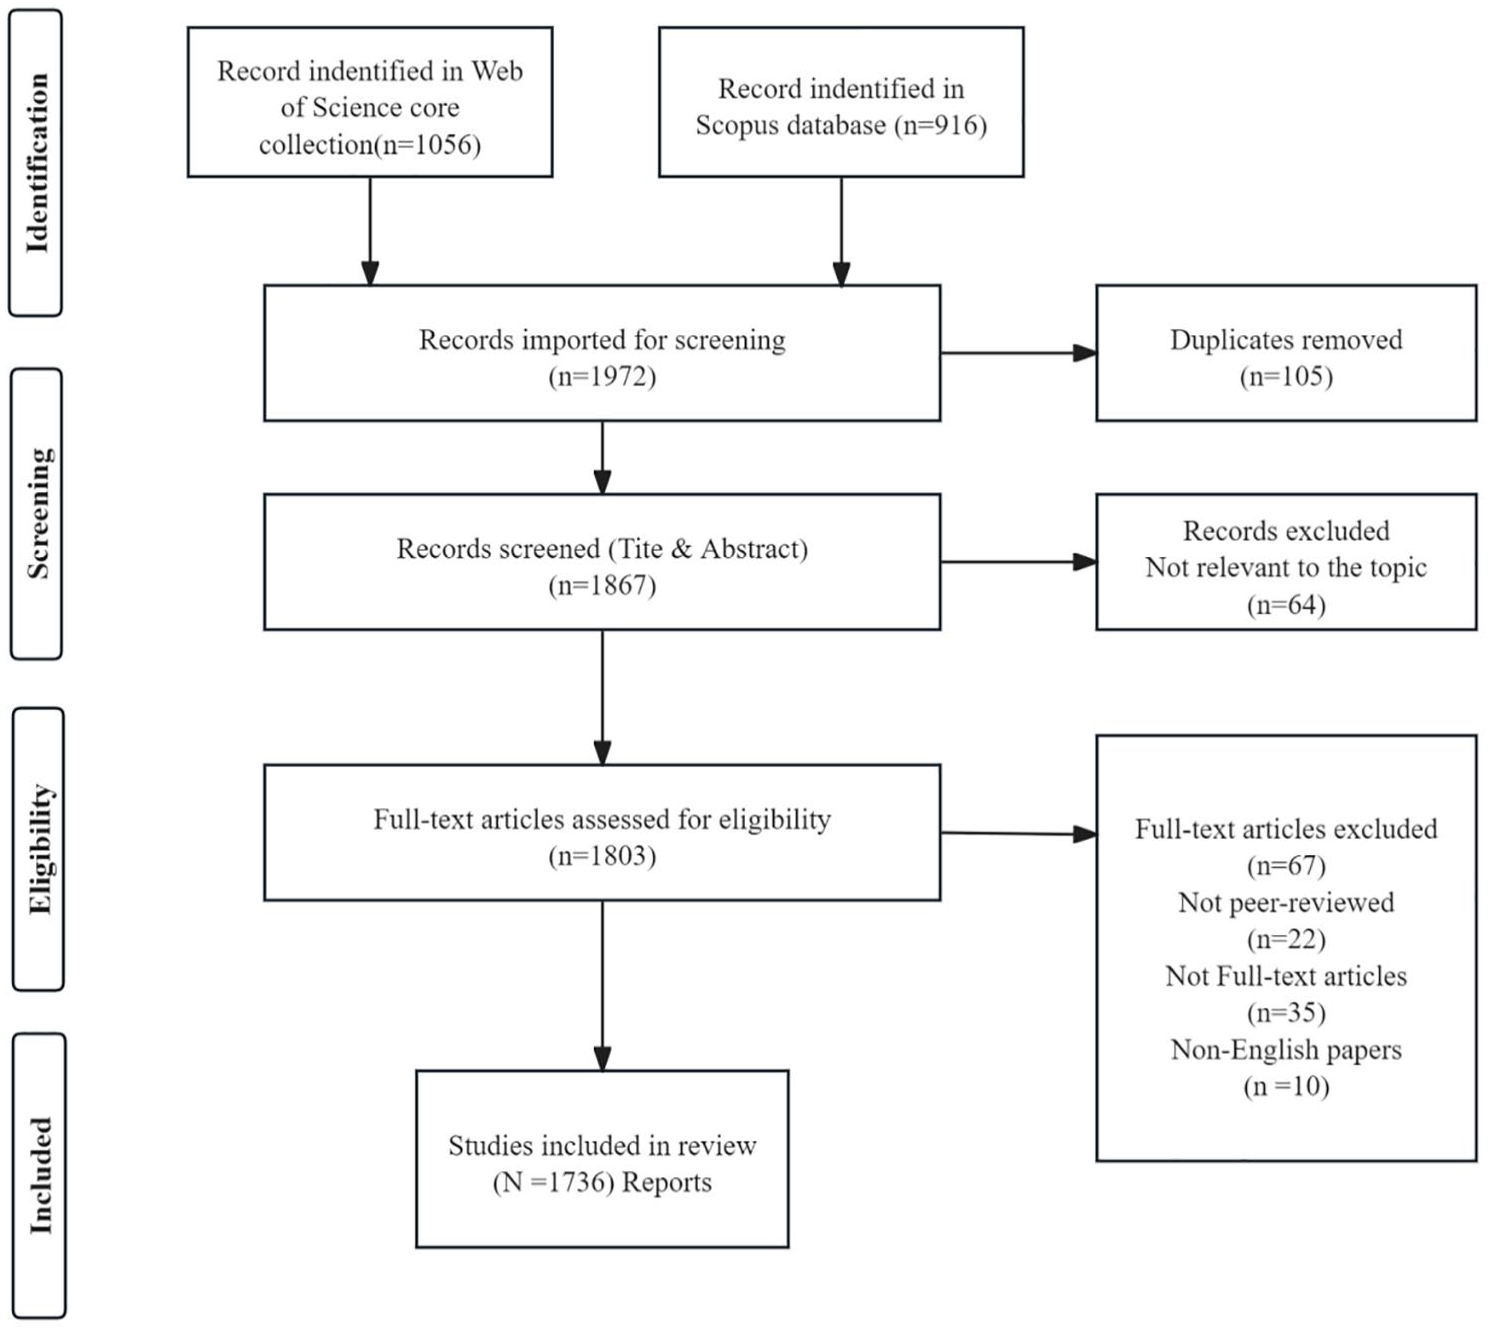
Selection of articles based on the guidelines of PRISMA.
Analysis method
Researchers often employ bibliometric analysis and social network analysis methods (Chao et al., 2016) for quantitative literature research. Scientific knowledge map as a new method and domain within scientometrics has emerged and developed all over the world and has also been widely applied in the field of bibliometrics. With the development of information visualization, various tools for creating scientific knowledge maps have emerged in succession (Chen et al., 2008). Among them, CiteSpace and VOSviewer have suddenly risen as prominent players, becoming two of the most popular tools for knowledge map creation at present. They are both literature visualization analysis software developed based on the Java language but differ in the theoretical algorithms for generating knowledge maps. CiteSpace utilizes the cosine algorithm to calculate the cooperation intensity between authors or institutions. The link strength between nodes represents the cooperation intensity among authors or institutions and is computed as the cosine distance of the angle between nodes, as expressed in Formula (1).
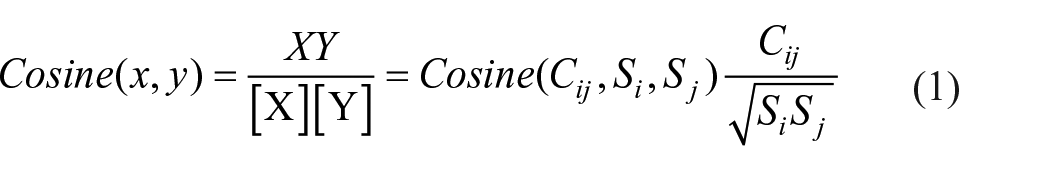
In the formula, Cij represents the number of articles published by co-authors (author i and author j); Si and Sj denote the number of articles published by author i and author j, respectively. The cooperation intensity ranges between 0 and 1.
VOSviewer uses the correlation strength algorithm, as shown in formula (2):
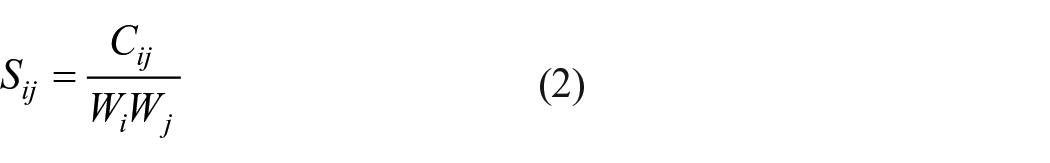
In formula (2), Cij represents the number of articles published by co-authors (author i and author j), Wi and Wj represent the number of articles published by author i and author j respectively, and Sij represents the similarity between author i and author j. It should be noted that the accuracy of VOSviewer’s association strength algorithm can be guaranteed only if author i and author j are independent of each other. Therefore, the association strength algorithm measures the similarity from the perspective of probability.
CiteSpace is primarily used to explore the scientific research trends and status within specific research fields, while VOSviewer is often employed to construct and visualize the relationships among the most productive countries, research institutions, and author keywords. Given the respective advantages of the above two software tools, a combination of CiteSpace and VOSviewer was used in this study. Firstly, the cooperation relationships among countries, institutions, and authors in the research field of LDT were analyzed. Subsequently, visual analysis of keyword clusters, keyword bursts, co-citations of articles, and co-citations of journals was conducted to explore the research hotspots, evolution paths, and frontiers in this field. Due to the long time span of the research data (from 1990 to 2023, excluding 2024), the time slice was set to 3 years. The node types selected were country, institution, author, keyword, reference, and cited journal. The maps generated by VOSviewer were obtained by setting the minimum visibility criteria. In CiteSpace, the node threshold was mainly set using TopN (where N is 10, 20, 30. . ., representing the top N nodes at each stage) and g-index (K = 5, 10, 15, 25. . ., where the number of included nodes was adjusted by tuning the proportional factor K at each stage; Chen, 2006). The maps were pruned using the Pathfinder algorithm based on the characteristics of the data, with the option “Pruning sliced networks” ticked.
Data analysis results
Analysis of annual number of publications
The literature growth law can reflect the development status of a certain research field to a certain extent. Price (1963) proposed the law of literature growth, which can be categorized into four distinct stages: the initial stage (formative phase, characterized by slow growth), the exponential growth stage (take-off phase, marked by rapid expansion), the linear growth stage (stabilization phase, with moderated growth rates), and the saturation stage (maturation, where growth plateaus or declines). As displayed in Figure 2, research related to LDT began in 1990. Then the number of publications showed a trend of increasing year by year. By the end of 2024, 1736 published articles had been indexed by Web of Science and Scopus. According to the exponential growth rule of literature in bibliometric theory, the curve fitted the cumulative publications in the research field of LDT from 1994 to 2023 (From 1990 to 1993, the number of publications was too small to be added to the fitting function). It was found that the available exponential function y = 3.0137e0.1288x was fitted, which indicated that this function curve could reflect the growth of cumulative publications over time. Specifically, during 1990–1997, the number of publications was low; the annual number of publications was less than 10; and the overall publication level was merely 3.25 articles per year. From 1998 to 2024, the number of publications exhibited a fluctuating growth trend, with an annual publication level of 63.3 articles per year. The largest increase appeared between 2005 and 2006, with a growth rate of 93.9%. In 2023, the number of publications reached 124, marking a peak at that stage. Overall, the number of publications on LDT research has been growing slowly and steadily. Based on the annual publication trend and the fitting curve formula, it can be predicted that the number of publications in this field will continue to rise.
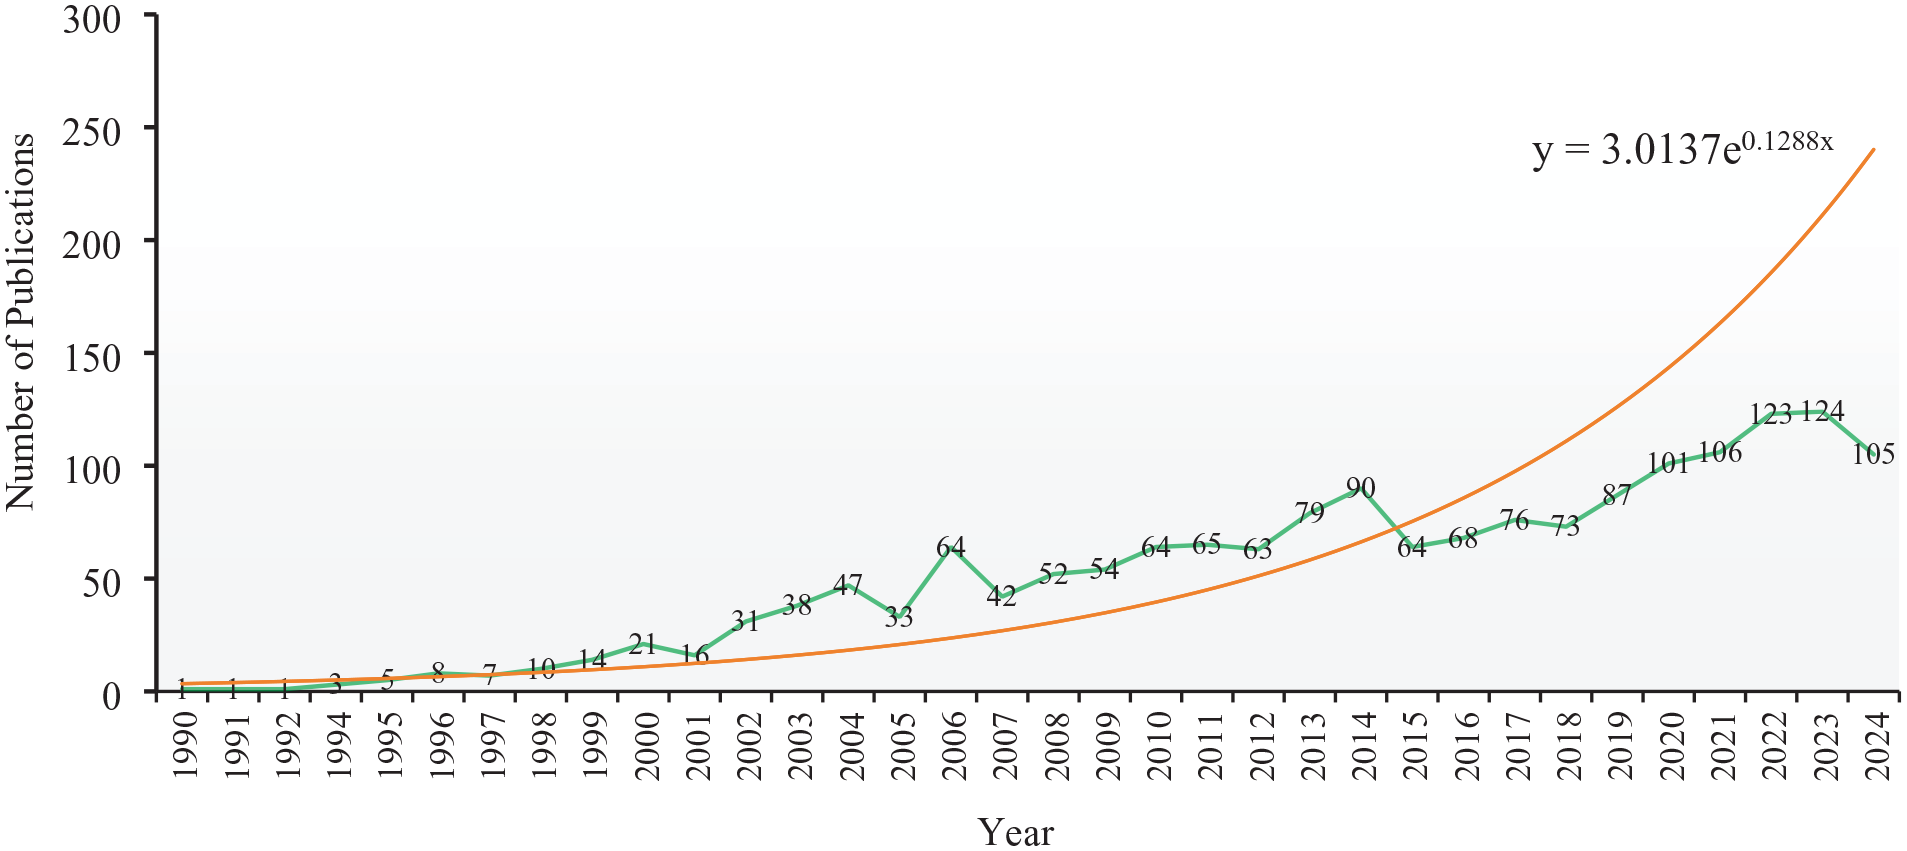
The change trend in the annual number of publications from 1990 to 2024.
Analysis of publications in countries
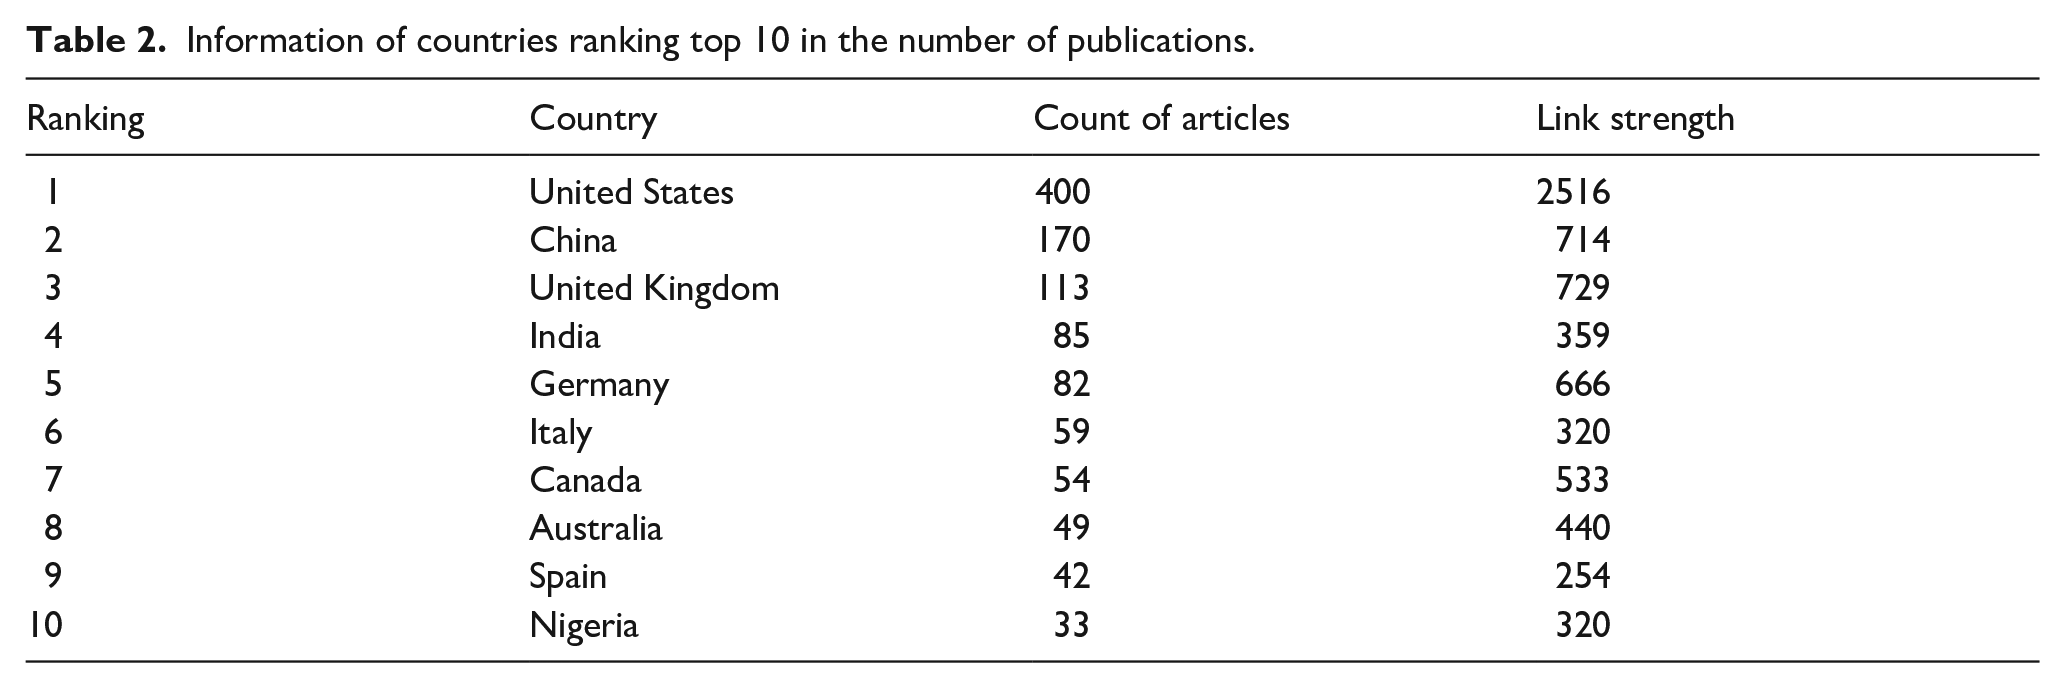
Table 2 lists the information of countries ranking top 10 in the number of publications. The United States had the highest number of publications (400 articles), accounting for approximately 23.04% of the total. China ranked second with 170 articles, accounting for about 9.79%. The United Kingdom ranked third with 113 articles, accounting for about 6.51%, followed by India (85 articles), Germany (82 articles), Italy (59 articles), Canada (54 articles), and so on. The number of publications from the top three countries accounted for more than half of the total. The map of cooperation among countries (Figure 3) contains 34 nodes and 195 connecting lines. Each node corresponds to a country and each connecting line indicates a collaborative relationship between the connected countries. The United States had the highest link strength (2516), followed by the United Kingdom (721), China (714), and Germany (666). This indicated that these four countries had a high degree of international recognition and significant influence in this research field. The United States, Canada, China, India, Germany, Australia, and Italy had relatively close collaborative relationships.
Information of countries ranking top 10 in the number of publications.
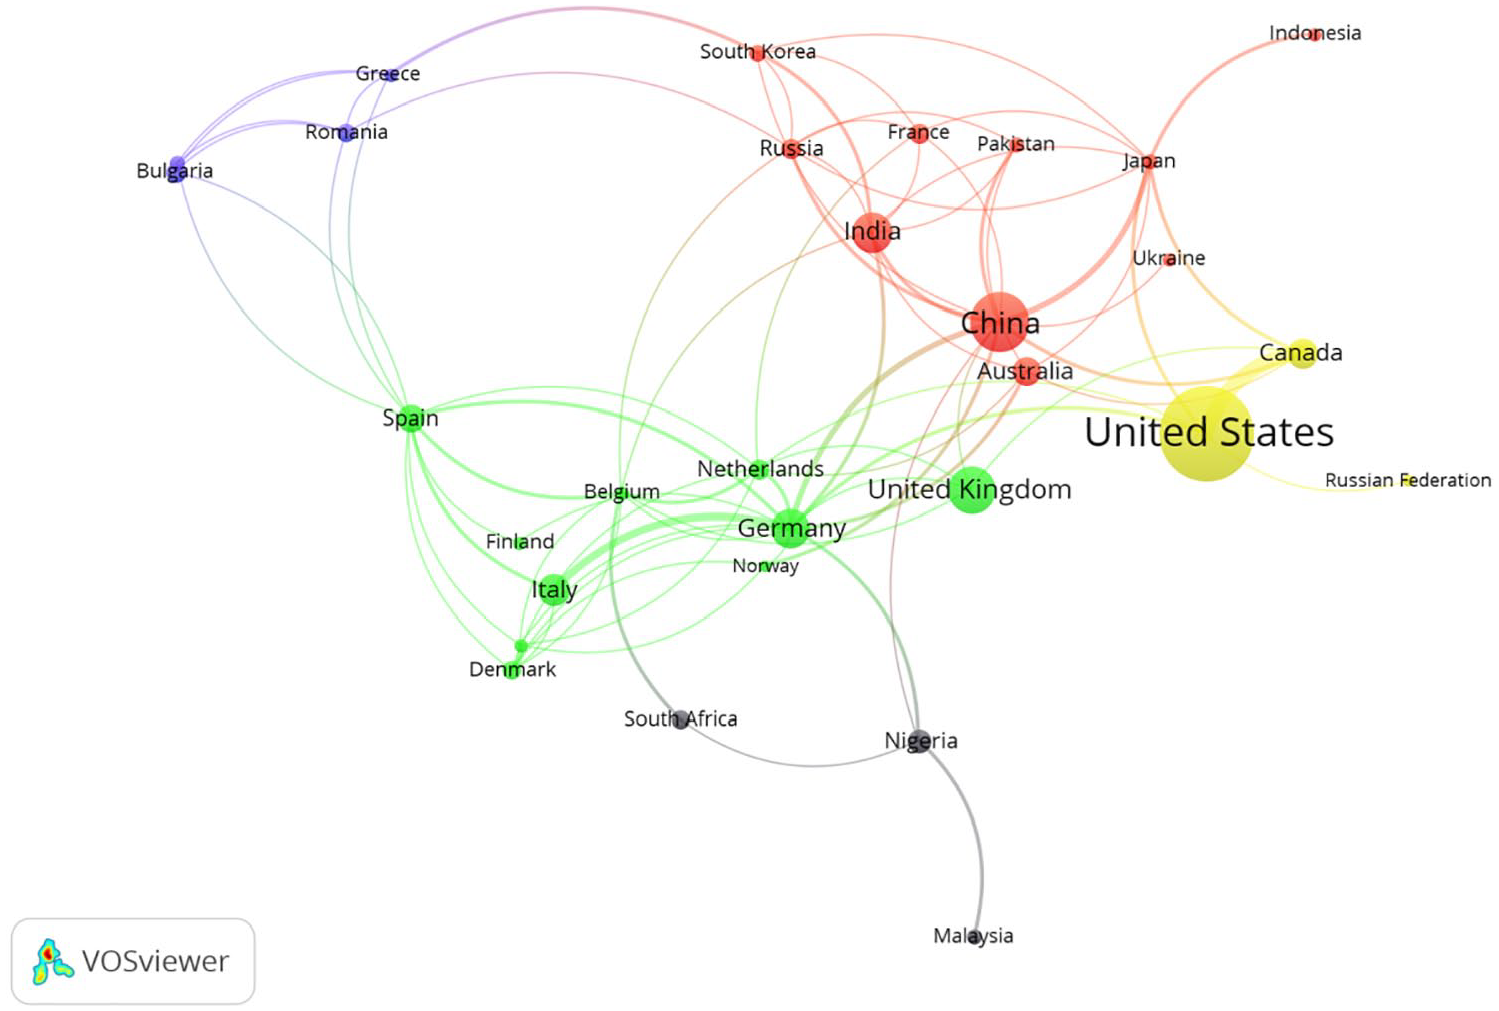
National cooperation network map.
Analysis of Institutions
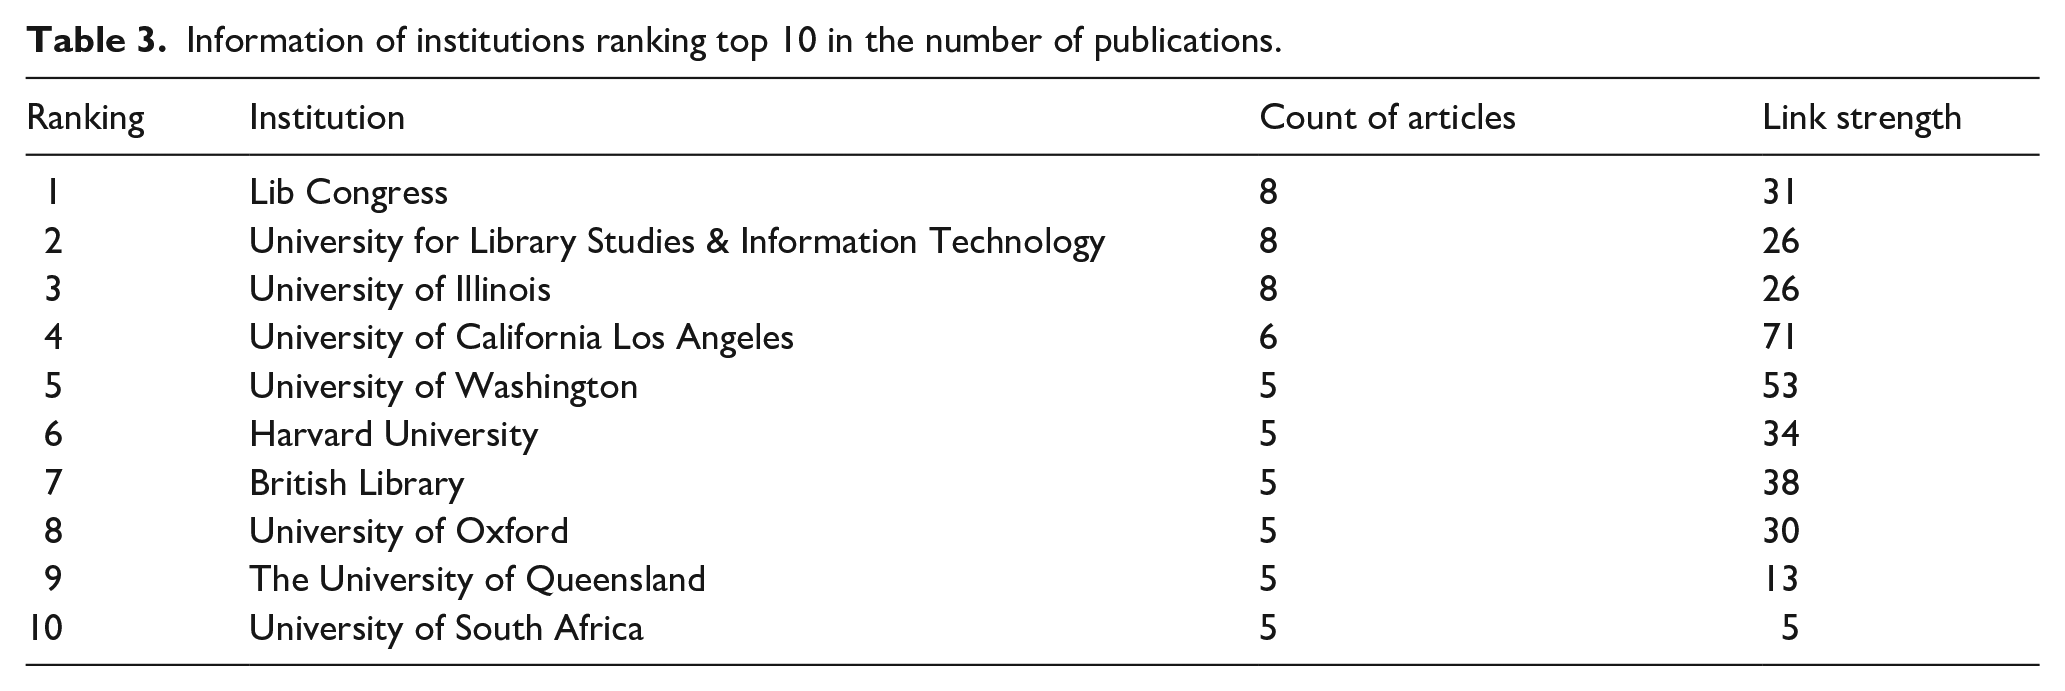
Table 3 provides the information of institutions ranking top 10 in the number of publications. Among them, Lib Congress, University for Library Studies & Information Technology and University of Illinois had the largest number of publications (each with eight articles), accounting for 0.46% of the total. The map of the collaboration network among institutions (Figure 4) contains 33 nodes and eight connecting lines. Each node corresponds to an institution and each connecting line implies a collaborative relationship between the connected institutions. According to the map, there was little collaboration among the publication institutions aiming at the field of LDT. The institution with the highest link strength was the University of California Los Angeles (71), followed by the University of Washington (53), British Library (38), and Harvard University (34).
Information of institutions ranking top 10 in the number of publications.
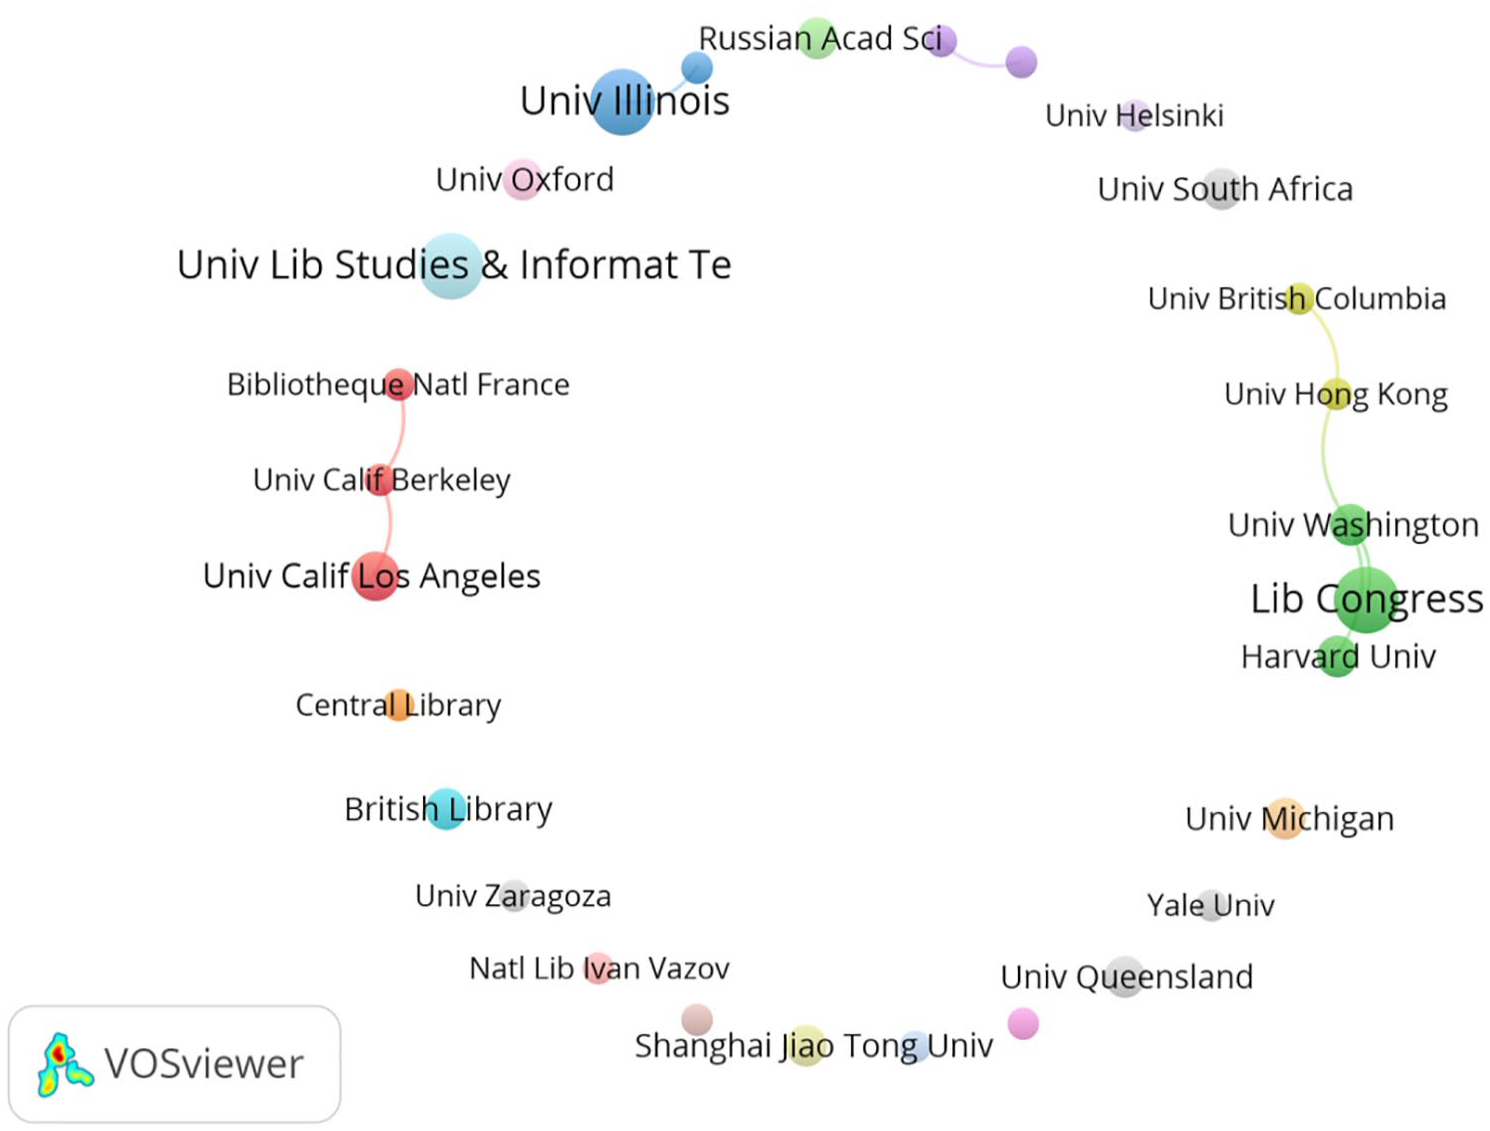
Institutional cooperation network map.
Analysis of authors
Table 4 shows the authors ranking top 10 in the number of publications related to LDT. Among them, Kratchanov, Ivan had the highest number of publications in this field (six articles). Rafiq, Muhammad ranked second with five articles. Sobolevskaya, I, Werla, Marcin, Allard, Bradley, Lampert, Cory, Bia, Alejandro, Cho, Allan, Joint, Nicholas, and Kajberg, Leif, each with four articles, ranked from third to 10th respectively. The co-authorship map (Figure 5) contains 34 nodes and 33 connecting lines. Each node corresponds to an author, and each connecting line represents a collaborative relationship between the connected authors. The authors with high link strengths were Allard, Bradley (8), and Sobolevskaya, I (6). The collaboration was mainly among authors with large numbers of publications. The scales of individual collaboration teams were small and the collaboration intensity was weak. Overall, there were few collaborative relationships among authors.
Information of authors ranking top 10 in the number of publications.
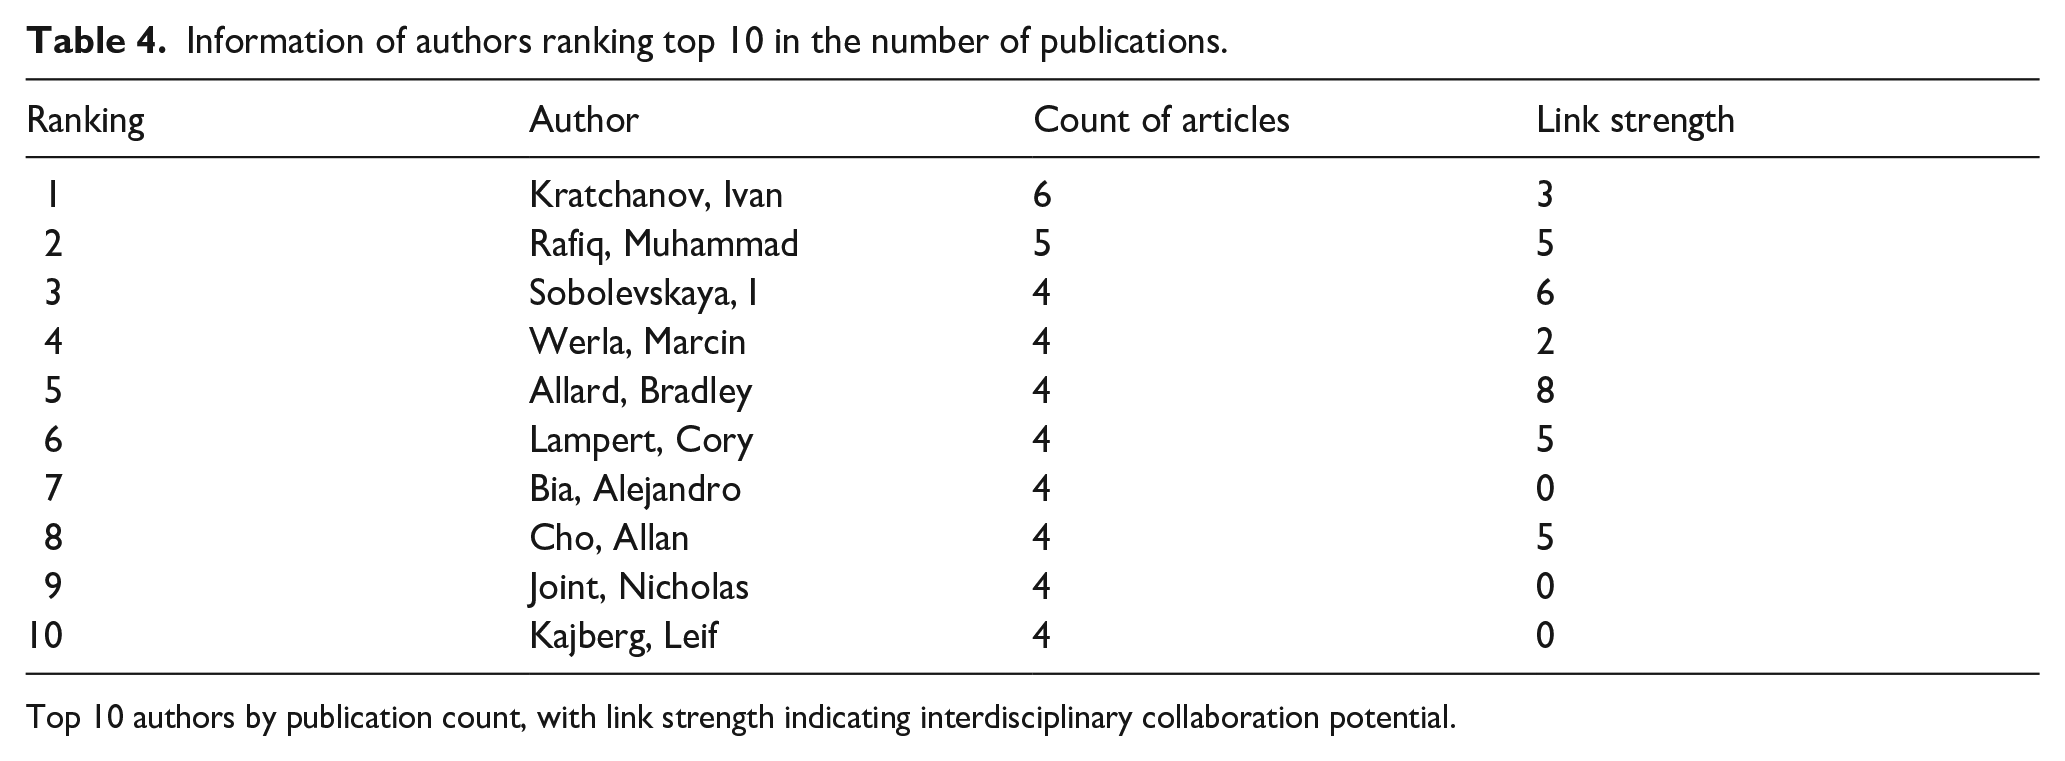
Top 10 authors by publication count, with link strength indicating interdisciplinary collaboration potential.
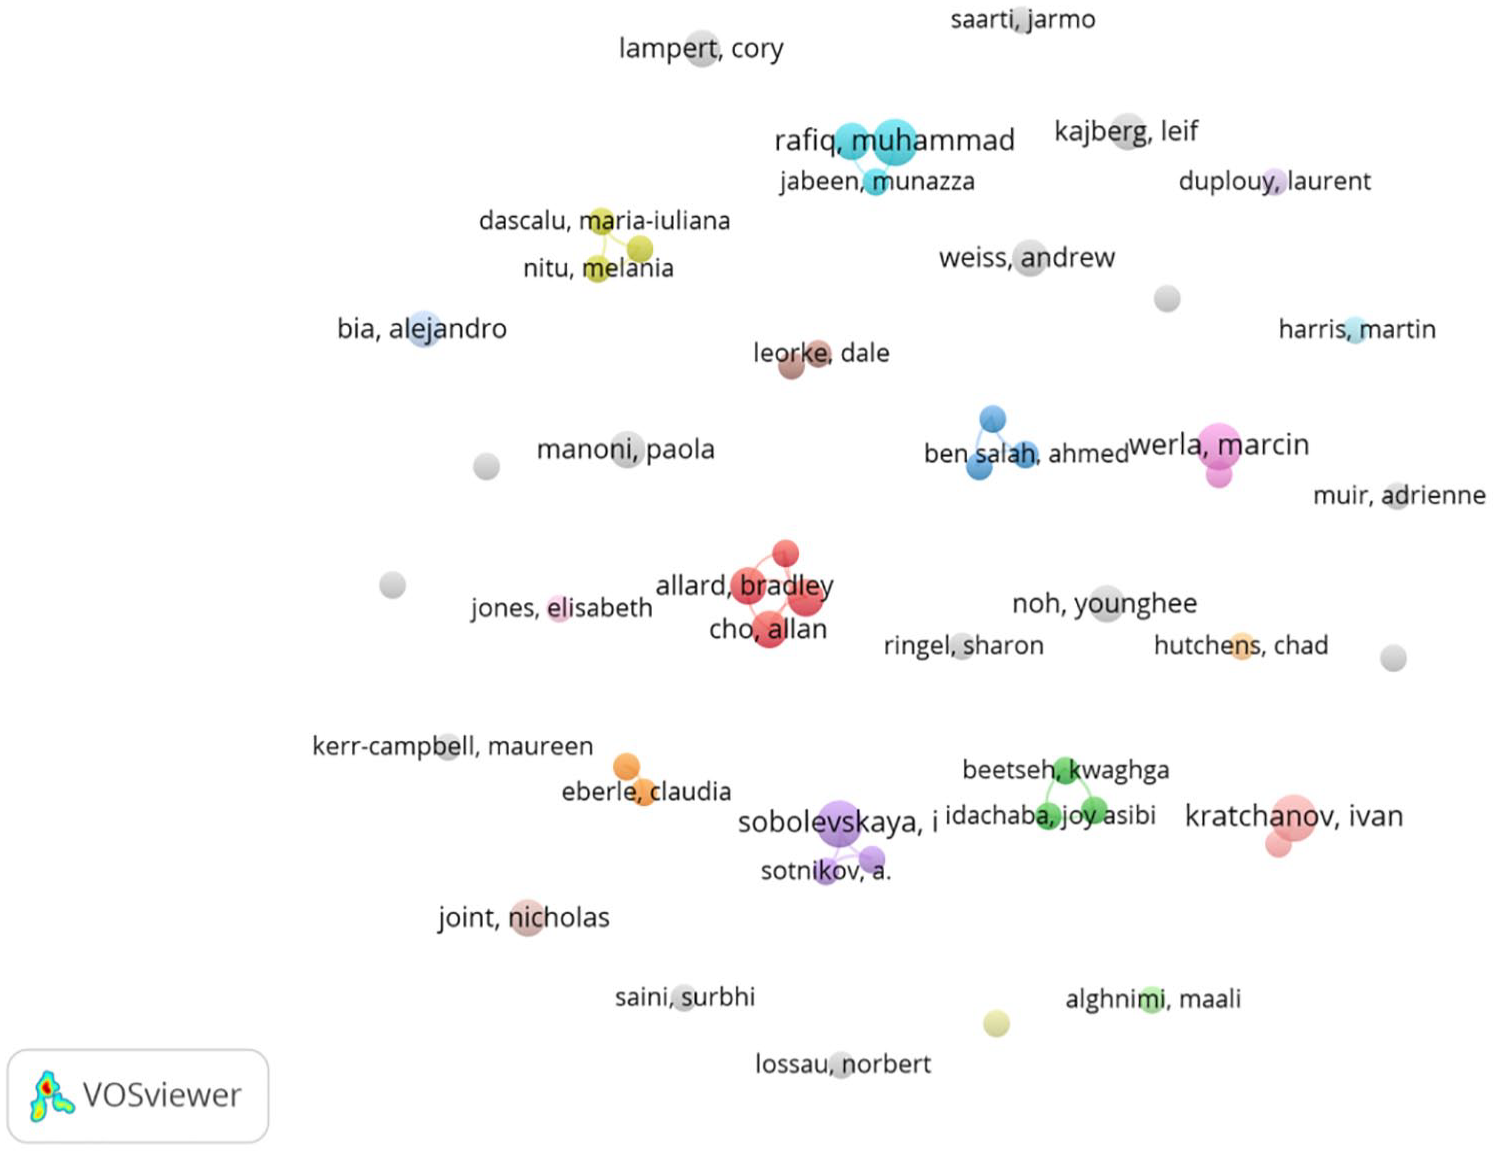
Co-authorship map.
The dominance of individual authors (Kratchanov, Ivan with six publications) and sparse collaboration networks (Figure 5) reflect two key characteristics of the field: On the hand of early-stage development, low collaboration intensity (average link strength = 3.2) aligns with Price’s initial growth phase, where research is often driven by isolated efforts rather than coordinated teams (Price, 1963). On the other of interdisciplinary barriers, the weak co-authorship links (Allard, Bradley’s eight collaborations vs Bia, Alejandro’s 0) suggest fragmented integration between library science and adjacent fields such as computer science. This may hinder knowledge transfer critical to digital transformation (Egghe and Rousseau, 1990).
The sparse collaboration networks and dominance of Western institutions (Table 4) highlight a geographic and disciplinary siloing that constrains AI-driven innovation. This fragmentation explains why AI-related keywords such as machine learning emerged abruptly post-2020 (in the keywords bursts section) rather than evolving through sustained interdisciplinary partnerships.
Analysis of journals
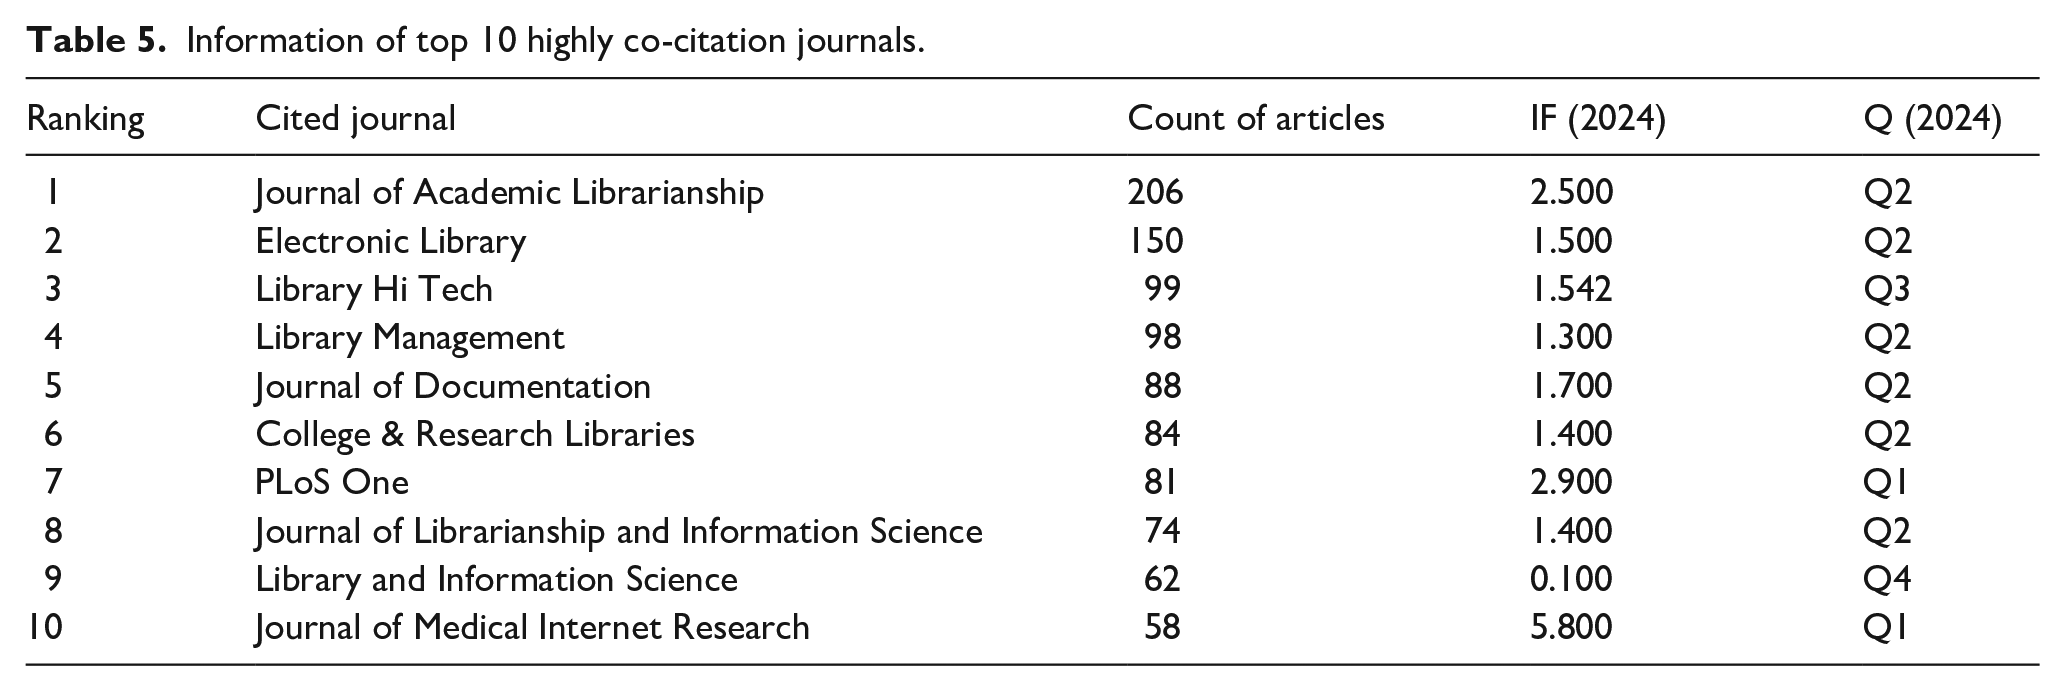
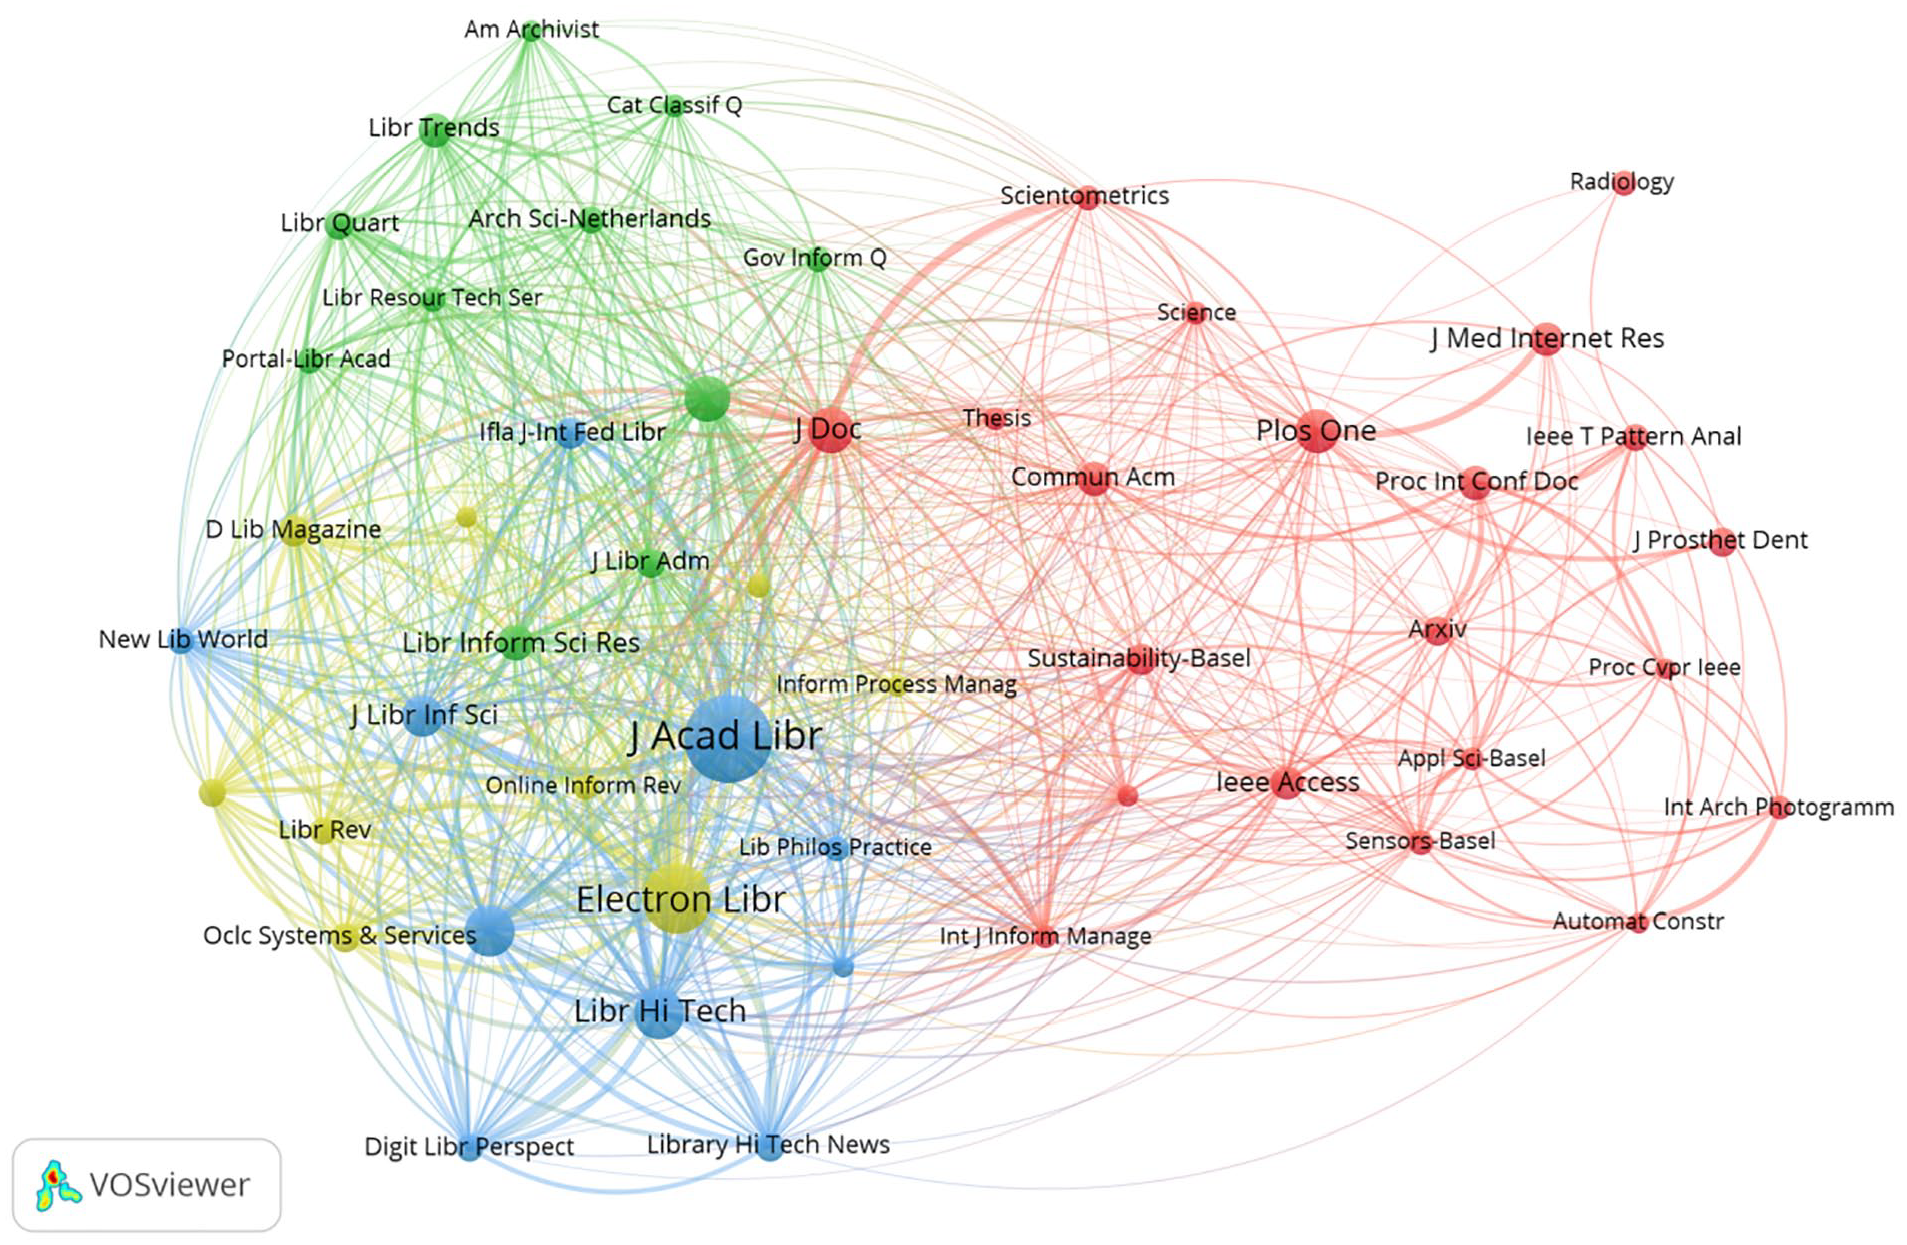
Table 5 presents the information of the top 10 highly co-citation journals in the field of LDT. The journal with the highest number of co-citations was the Journal of Academic Librarianship (206 co-citations) in Q2 with an impact factor (IF) of 2.500. That with the second highest number of co-citations is the Electronic Library (150 co-citations) in Q2 with an IF of 1.500; the third is the Library Hi Tech (99 co-citations) in Q2 with an IF of 1.542; and the fourth is the Library Management (98 co-citations) in Q2 with an IF of 1.300. Among the top 10 highly co-cited journals in this field, the Journal of Medical Internet Research possessed the highest IF, 5.800. Figure 6 illustrates a journal co-citation map containing 51 nodes and 830 connecting lines. Nodes in the figure represent co-cited journals, and the connecting lines denote the co-citation relationship between the connected journals. Among them, the Journal of Academic Librarianship, the Electronic Library, the Library Hi Tech, and the Journal of Librarianship and Information Science exhibited strong co-citation relationships.
Information of top 10 highly co-citation journals.
Co-citation network among journals.
The co-citation network (Figure 6) reveals a dual hierarchy in knowledge dissemination: First, Journal of Academic Librarianship (206 co-citations) and Electronic Library (150 co-citations) serve as primary hubs for theoretical discourse, focusing on organizational change and user experience; Second, Journal of Medical Internet Research (IF = 5.8) connects library science to broader digital health innovations, yet its low co-citation count (58) underscores the field’s limited engagement with cutting-edge technologies. This dichotomy suggests that LDT research remains siloed within traditional LIS journals, potentially slowing adoption of emerging paradigms (such as AI-driven analytics).
Analysis of literature co-citations
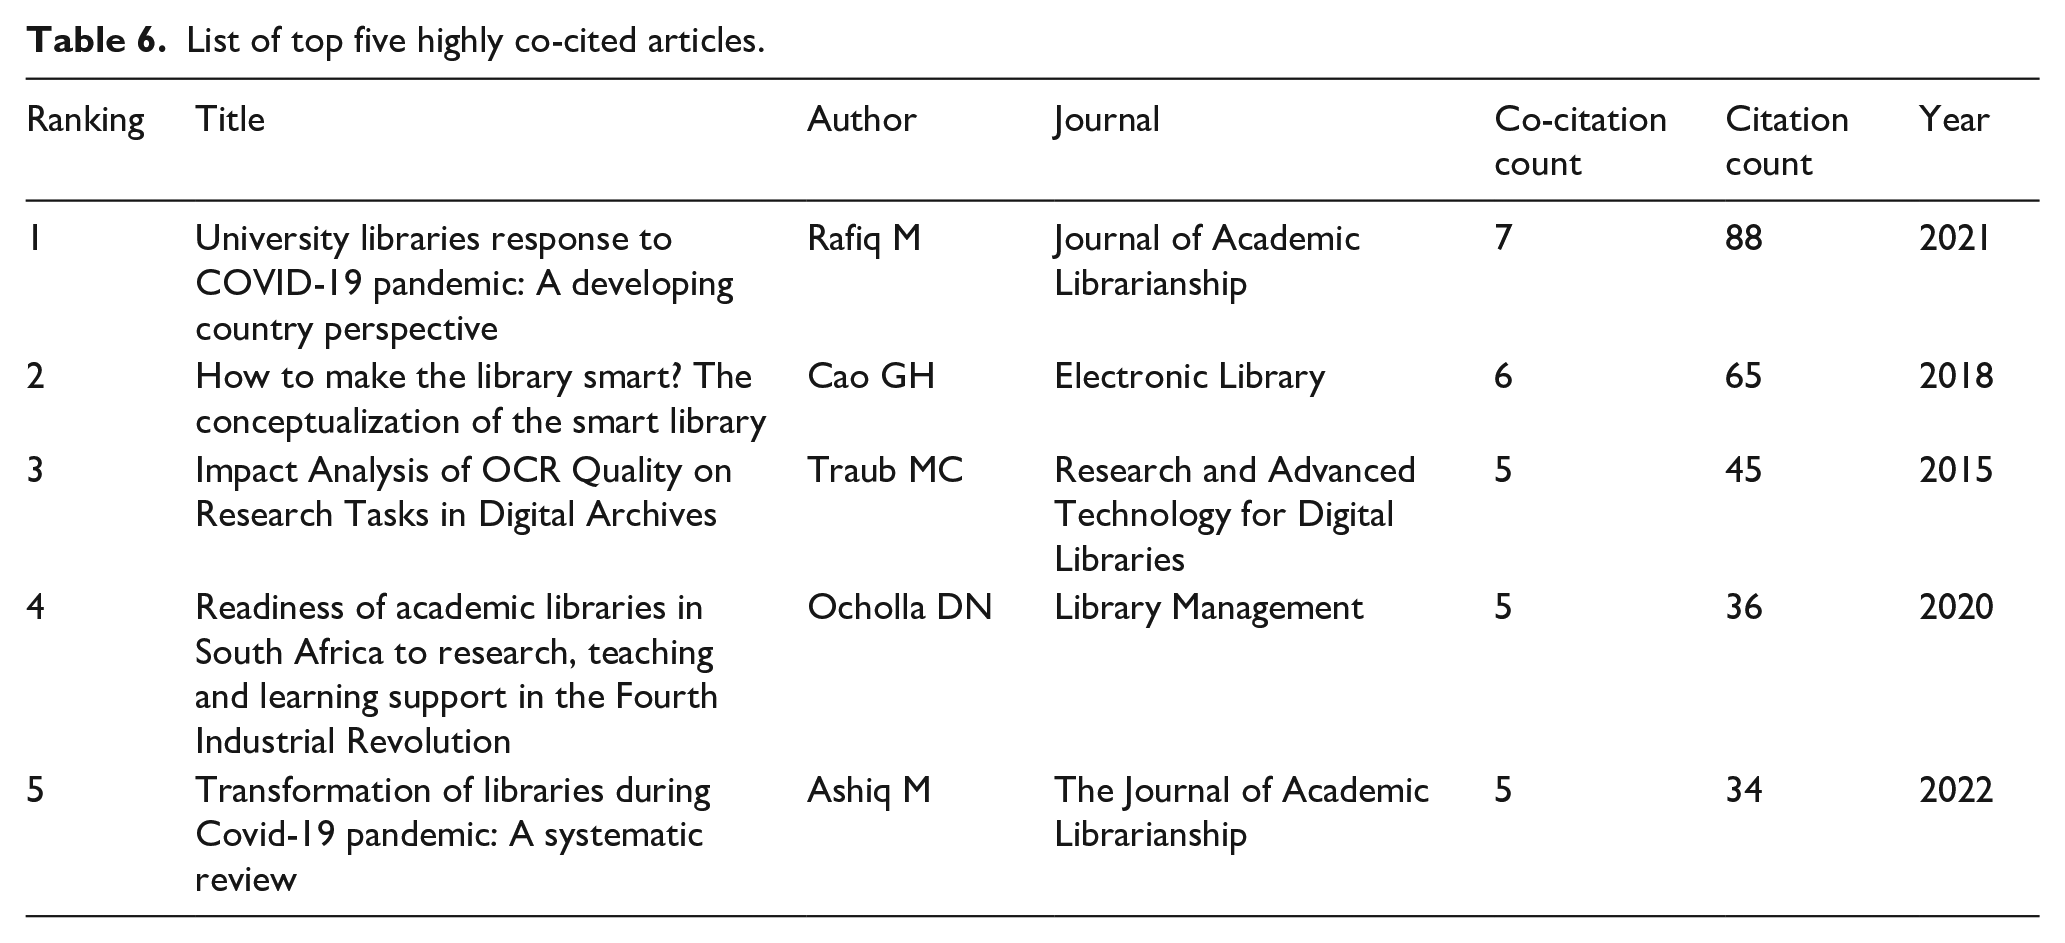
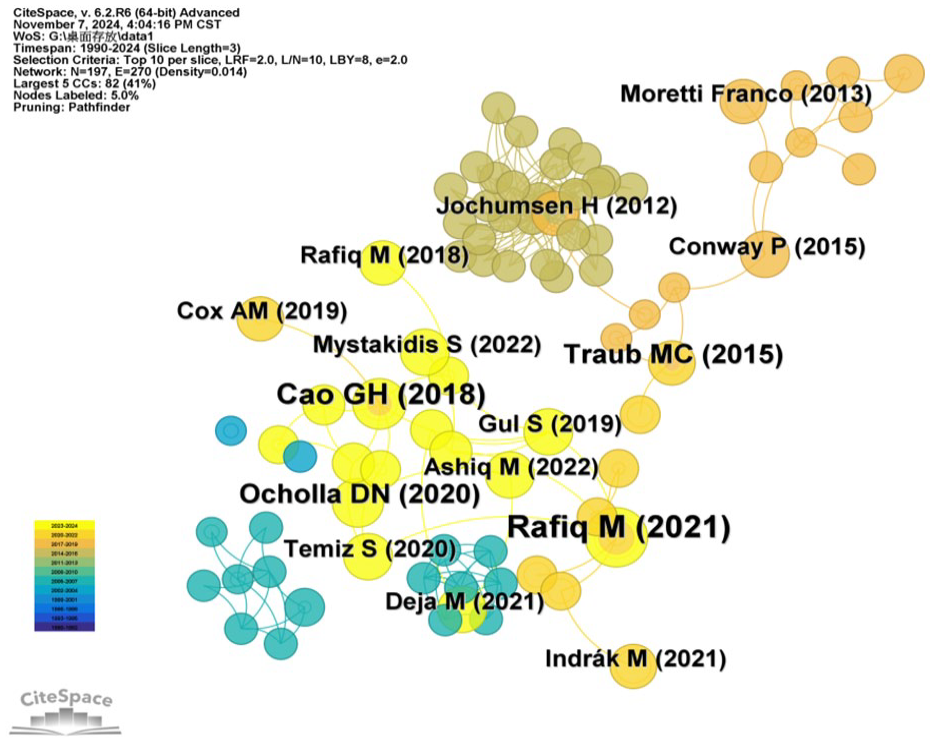
Literature co-citation mainly refers to a dynamic link formed when two articles are concurrently cited by a citing article. The CiteSpace software can visualize articles based on their co-citation relationships, and it also can quickly locate “highly influential mutant literature,” which is often a sign of breakthrough results or emerging directions in the field (Small, 1973). Hence, literature co-citation analysis was made in Citespace to elucidate the important knowledge foundation for research and development in the field of LDT. Table 6 lists the information of the top five highly co-cited articles in this field, mainly covering the concepts, technologies, and methods related to LDT and also having high citation counts. The article with the highest co-citation count was titled “University Libraries’ Response to the COVID-19 Pandemic: A Developing Country Perspective” and published by Rafiq M in 2021 in the Journal of Academic Librarianship. This article explores the online response measures taken by university libraries during the COVID-19 pandemic, pointing out that the digital divide, lack of digital literacy, and slow internet speed are major obstacles to the libraries’ transition from a physical mode to an online mode (Rafiq et al., 2021). The second highly co-cited article was published by Cao GH in 2018 in the Electronic Library. Cao GH believed that the focus of LDT encompassed three aspects: technology, service, and people. Traditional libraries can transform into smart libraries through strategic design and advanced technologies (such as cloud computing, data mining, and AI), but they need to consider service construction, user cultivation, and librarian training (Cao et al., 2018). Figure 7 displays the overall distribution of co-cited articles. The size of a node represents the count a particular article has been co-cited: namely, the larger the node, the higher the co-citation count of the article. The color of a node represents the publication year of an article. Through the color changes, it can intuitively understand the temporal distribution of the articles. According to Figure 7, highly co-cited articles were mainly published in recent years.
List of top five highly co-cited articles.
Literature co-citation network.
Analysis of keywords
Keywords are highly summarized and condensed representations of the core content of an article. Through a study of keywords, the hot topics and directions of research in a field can be grasped accurately and quickly (Zhao and Jiang, 2014). In this study, the CiteSpace software was employed to mine the keyword co-occurrence relationships in the research field of LDT (Chen et al., 2010) to grasp the hotspots and development trends of research in this field.
Analysis keywords co-occurrence
The keywords with the top 10 occurrence frequencies and centrality in LDT research are shown in Table 7. The keyword with the highest occurrence frequency was “digital library” (259 times), followed by “library” (98 times) in second place. The subsequent keywords were “academic libraries,” “university library,” “analog to digital conversion,” “digital transformation,” “cultural heritage,” “digitization,” “metadata,” and “public libraries.” Centrality serves as an indicator to measure the importance or influence of a node (such as keywords, authors, institutions, etc.) within a network (Chen et al., 2010). Through this indicator, the authors can quickly identify the most critical or influential nodes in the network, which may represent research hotspots, core authors, or institutions. In terms of centrality, the top five keywords were “character recognition (0.48),” “information science (0.37),” “electronic publishing (0.35),” “digital library (0.27),” and “information technology (0.2),” all with centralities greater than 0.10, indicating that they are the research hotspots and core content in the field of LDT.
Information of keywords with high occurrence frequency and high centrality.
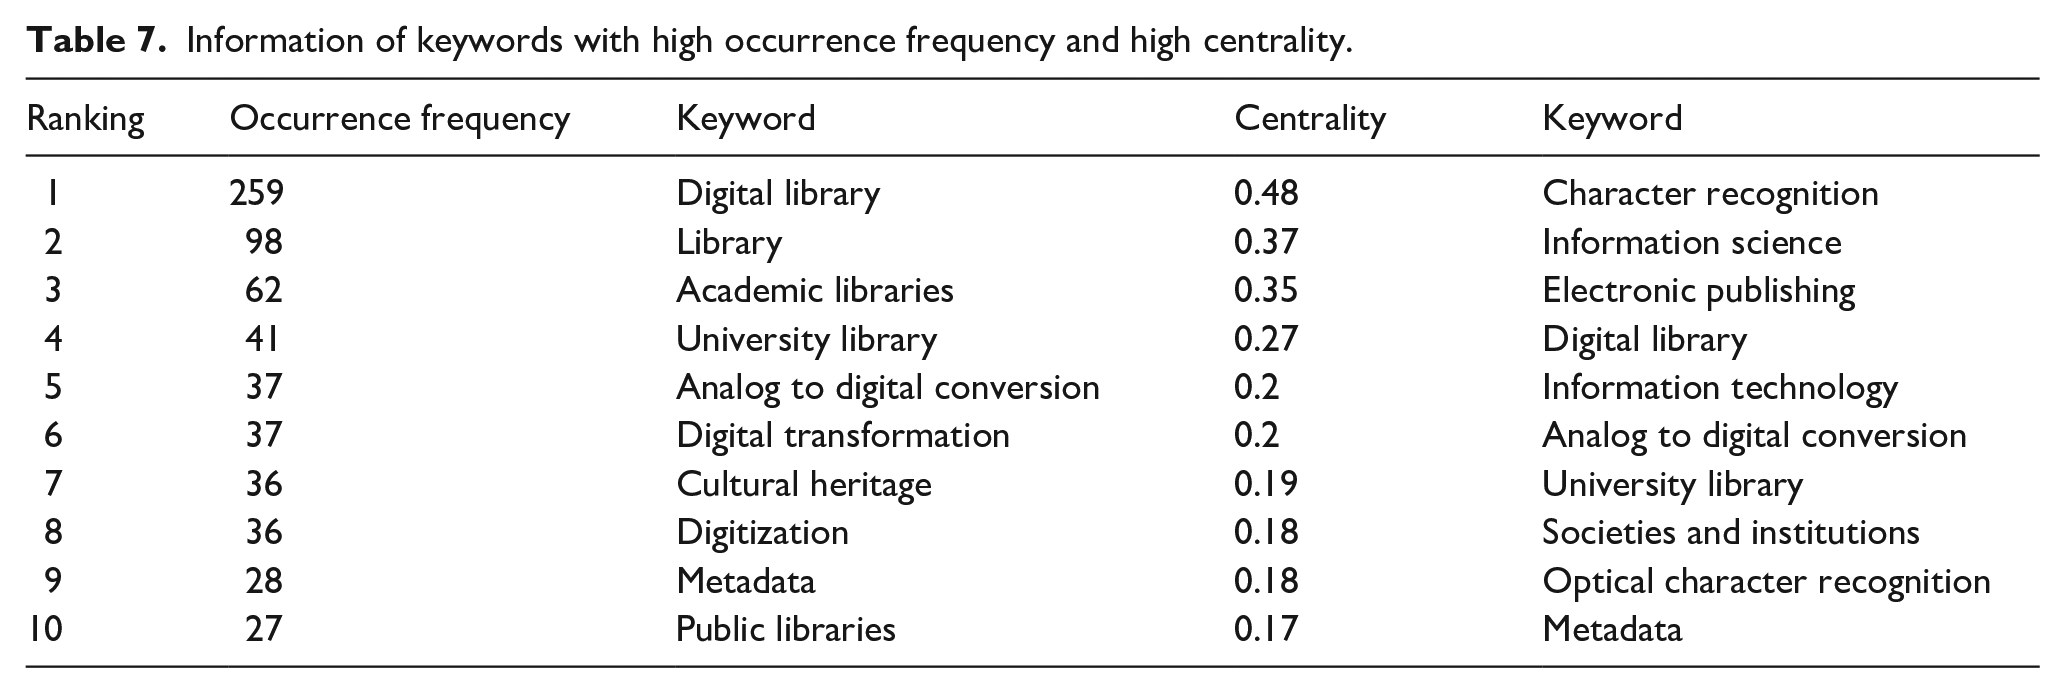
The keyword co-occurrence map (Figure 8) contains 182 nodes and 349 connecting lines. In the map, circular nodes represent keywords. The larger a node is, the greater its role in the entire connected network is and the stronger ability it has to control the co-occurrence of other nodes. The lines between nodes indicate co-occurrence relationships (Xiao, 2014). This study probed into the internal relationships between research hotspots from two aspects: First, in terms of node sizes, “digital library,” “academic libraries,” “university library,” “analog to digital conversion,” “cultural heritage,” “metadata,” “public libraries,” and others constituted the core hotspots in LDT research. Second, in terms of connectivity of the studies, there were numerous connections centered on high-frequency keywords such as “character recognition,” “information science,” “electronic publishing,” “digital library,” and “information technology.” This indicated that these were the focuses of attention for researchers in this field, with other nodes expanding around them. Additionally, directions such as “societies and institutions” and “optical character recognition” also received some attention.
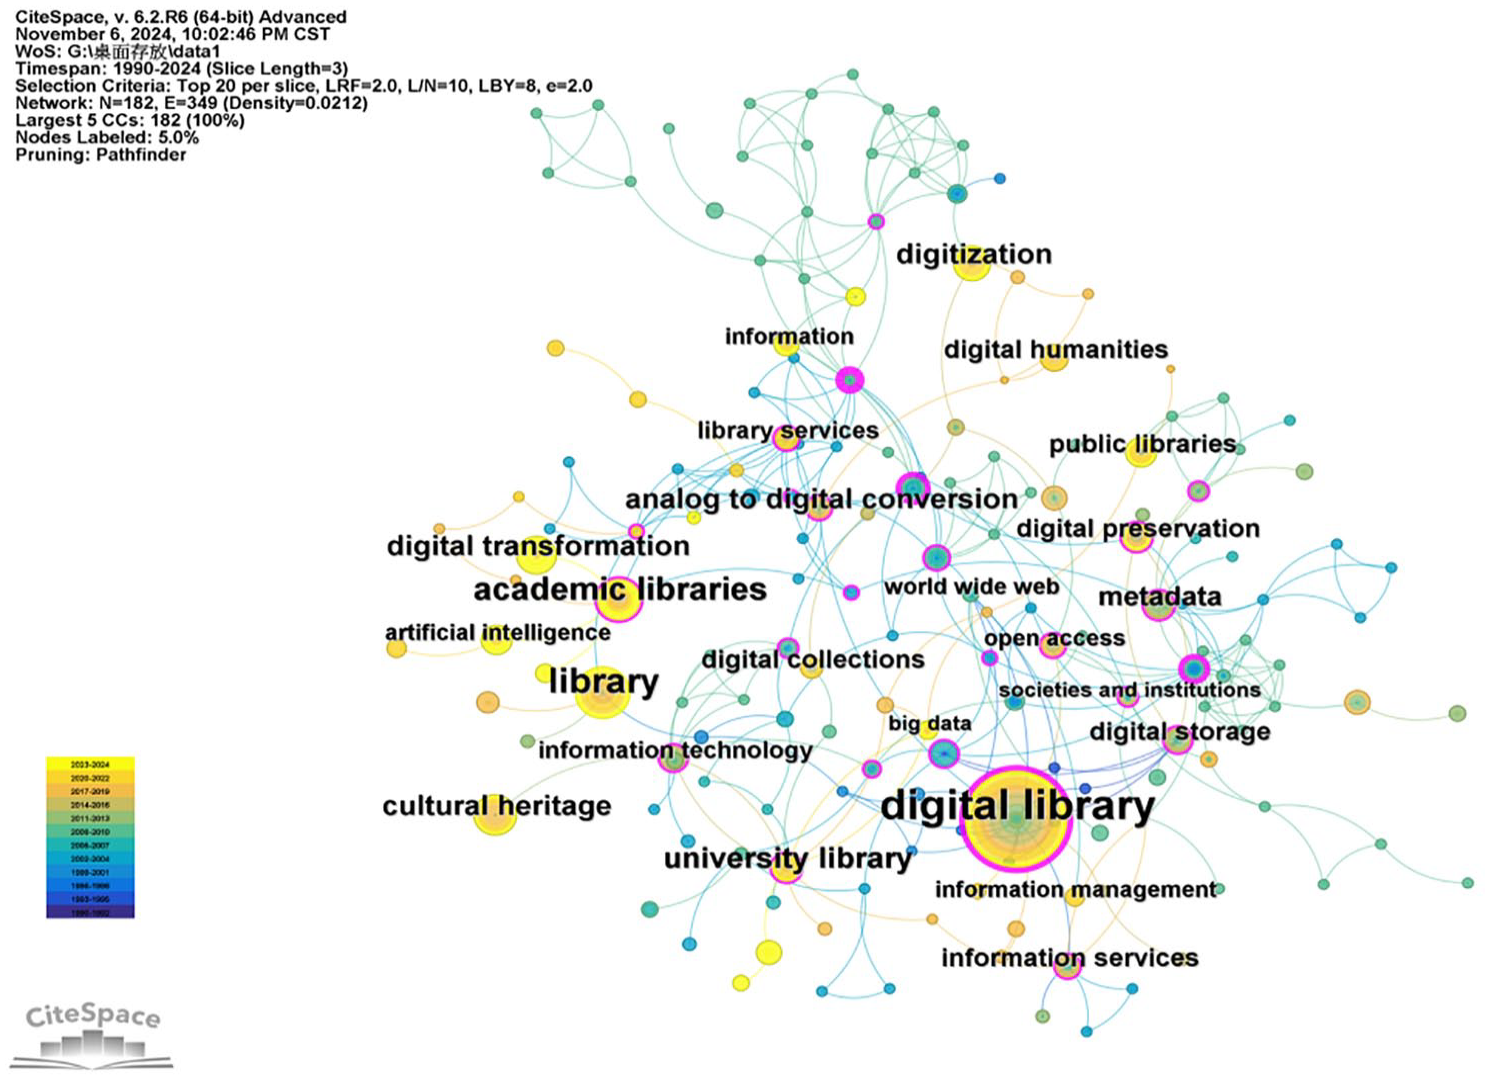
Keyword co-occurrence map.
Analysis of keyword clusters
A keyword cluster timeline map (Figure 9) was generated based on keyword co-occurrence using the LLR algorithm (Chen, 2004) for clustering, labeled with “K,” and arranged in a timeline mode. The modules divided in the cluster map were labeled with #. The structure and clarity of the clusters were mainly determined by two indicators: the modularity value (Q-value for short) and the average silhouette value (S-value for short). The Q-value ranges between 0 and 1. When Q is greater than 0.3, it indicates that the cluster network structure is significant. S measures the homogeneity of the cluster map. When S is not less than 0.7, the clustering results can be considered reliable (Chen, 2004). In Figure 9, the Q-value was 0.7665, which was greater than 0.3, and the S value was 0.9038, which was greater than 0.5, implying that the clustering results were significant and reliable. There are eight keyword clusters in the figure, labeled #0 to #7: namely #0 academic libraries, #1 depository libraries, #2 digital mathematical library, #3 digital library, #4 metadata, #5 university library, #6 open access, #7 document image processing. The smaller the cluster number is, the larger the font size is and the larger number of keywords the cluster contains. The cluster information table (Table 8) was obtained using the “Cluster Export” function.
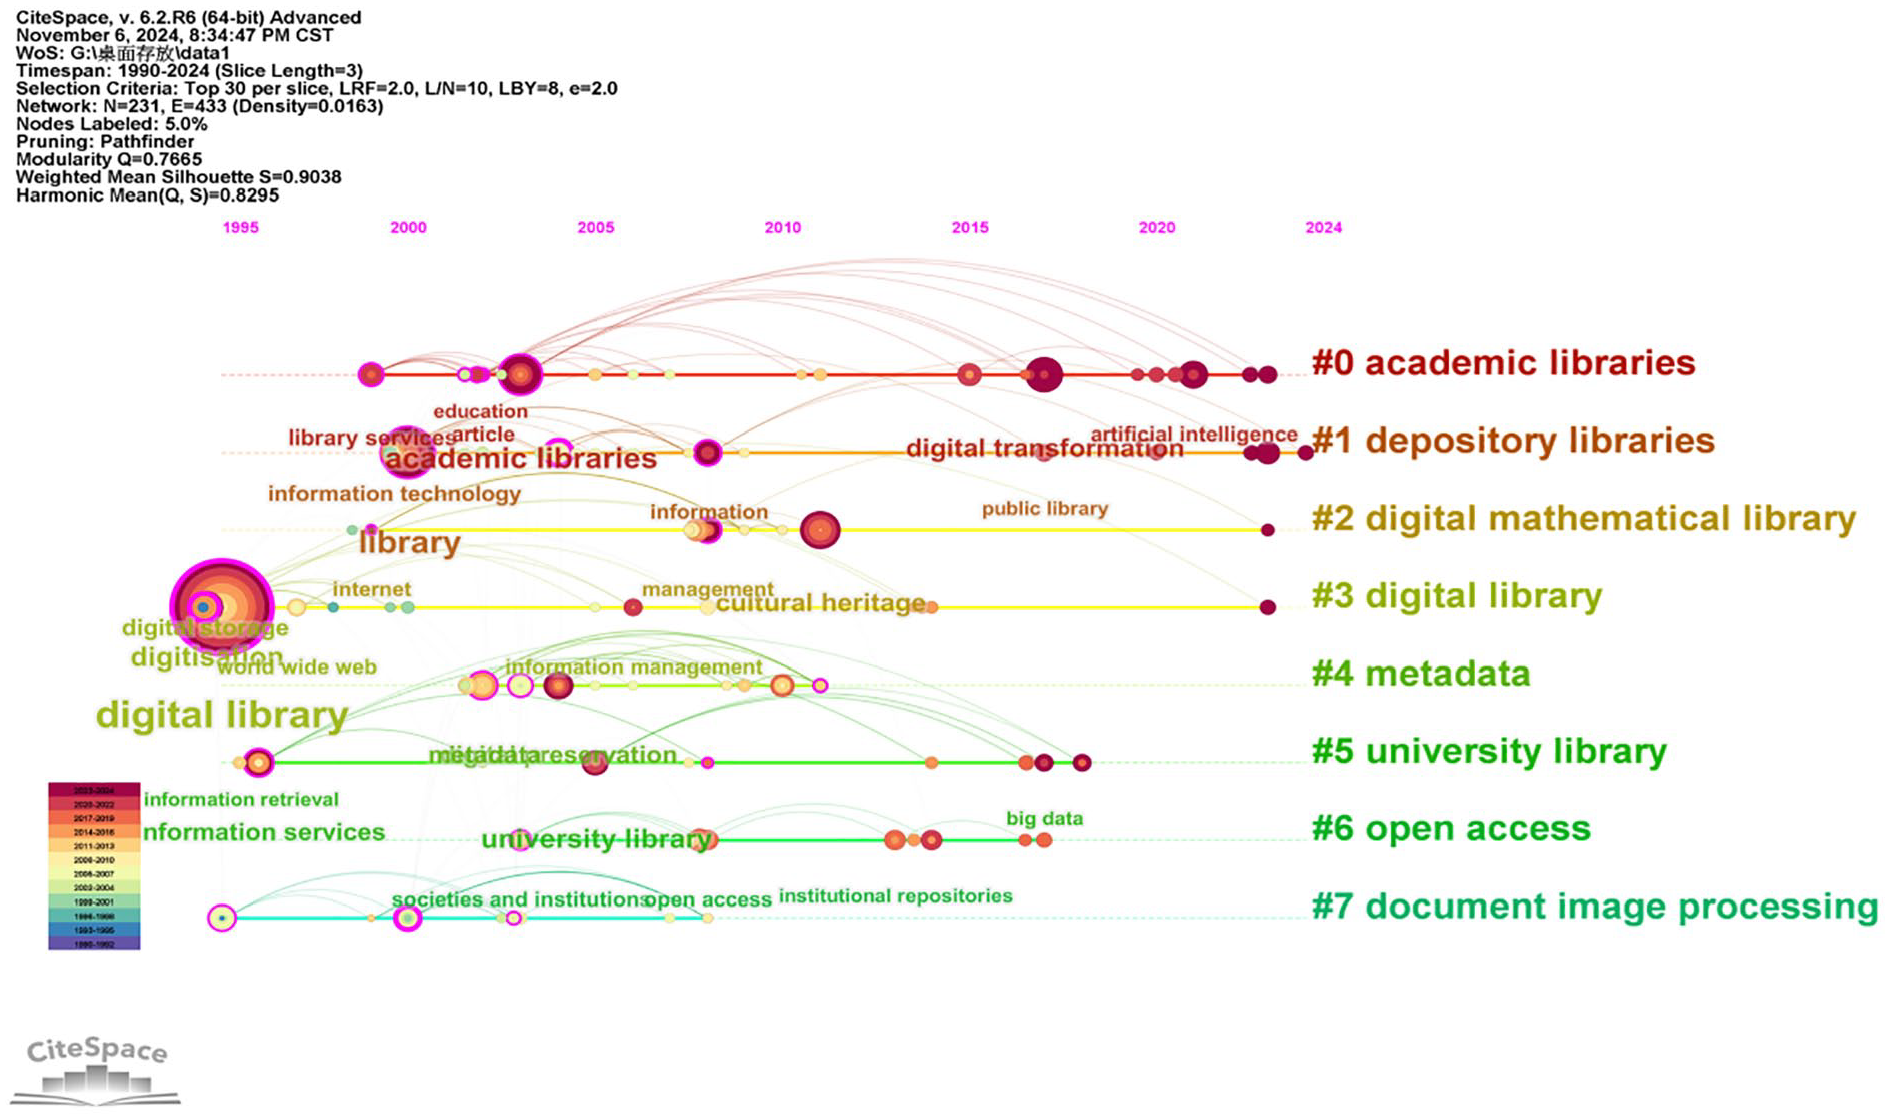
Keyword cluster timeline network.
Cluster information.
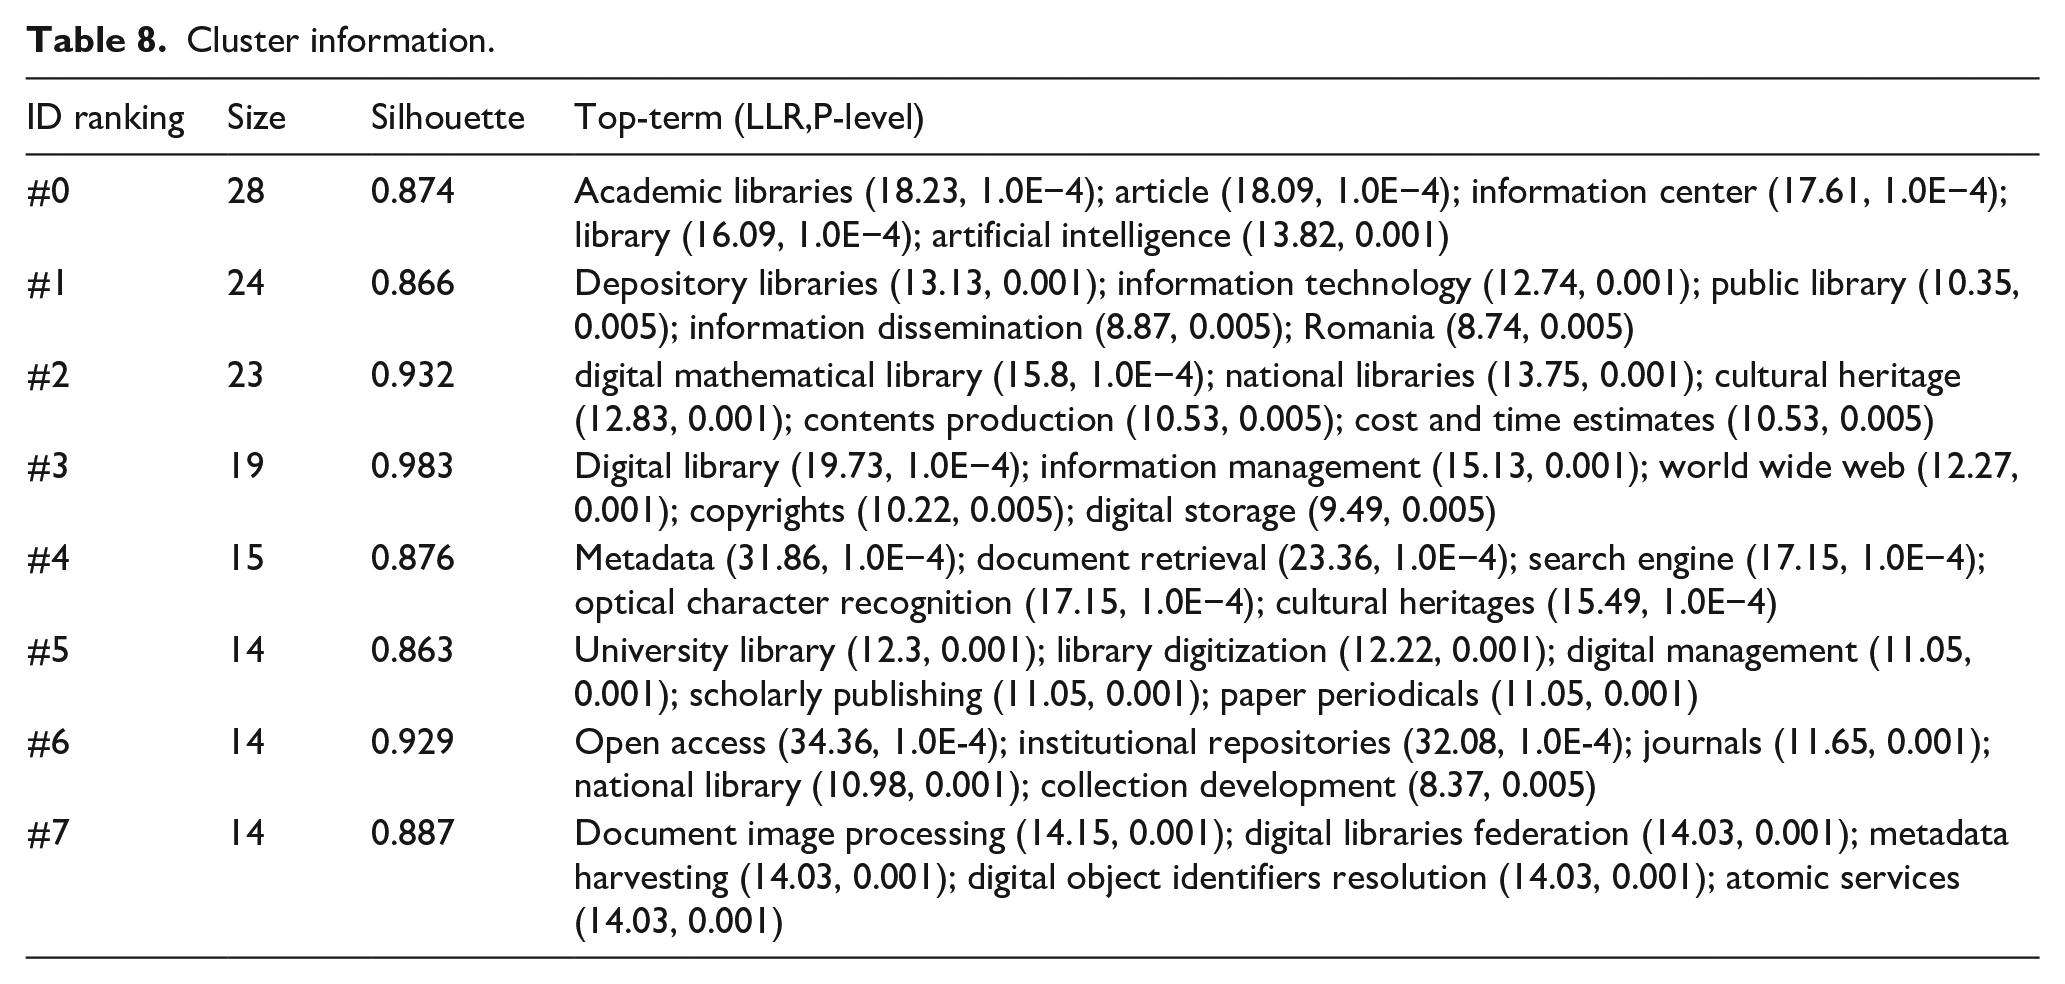
Figure 10 illustrates the landscape map of keyword clusters, presenting the proportion and span of clusters in a timeline. As can be seen from the eight diagrams, in the field of LDT, studies focusing on digital libraries, university libraries, and document image processing started earlier, in the 1990s. Studies focusing on academic libraries, depository libraries, and digital libraries lasted long, from the late 1990s to the present. Studies on digital mathematical libraries lasted long but mainly concentrated between 2007 and 2010.
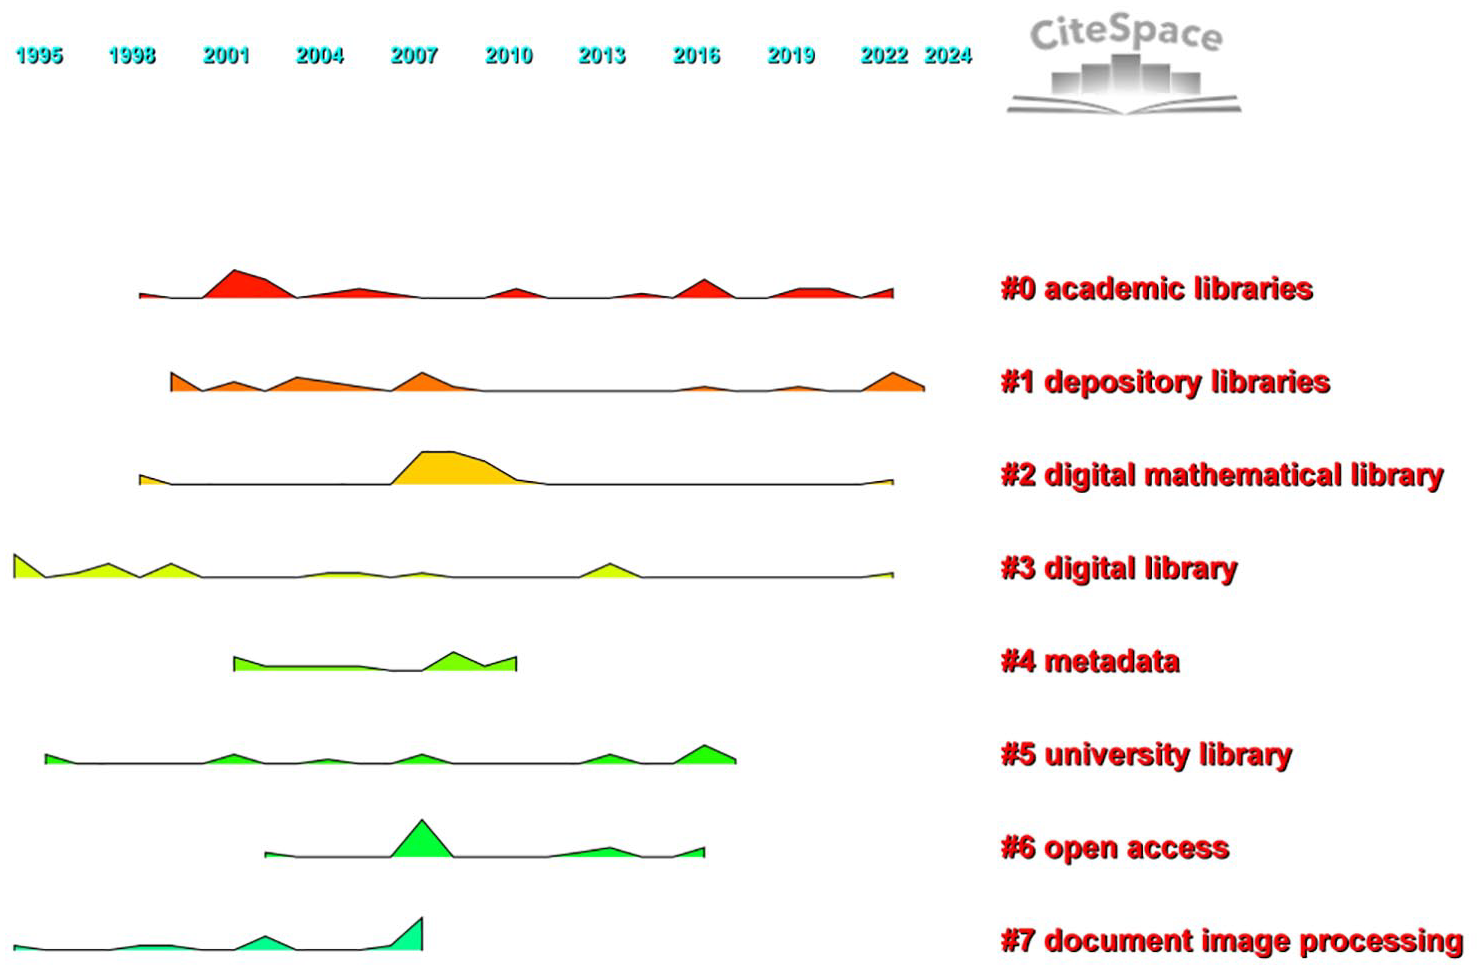
Landscape of keyword clusters.
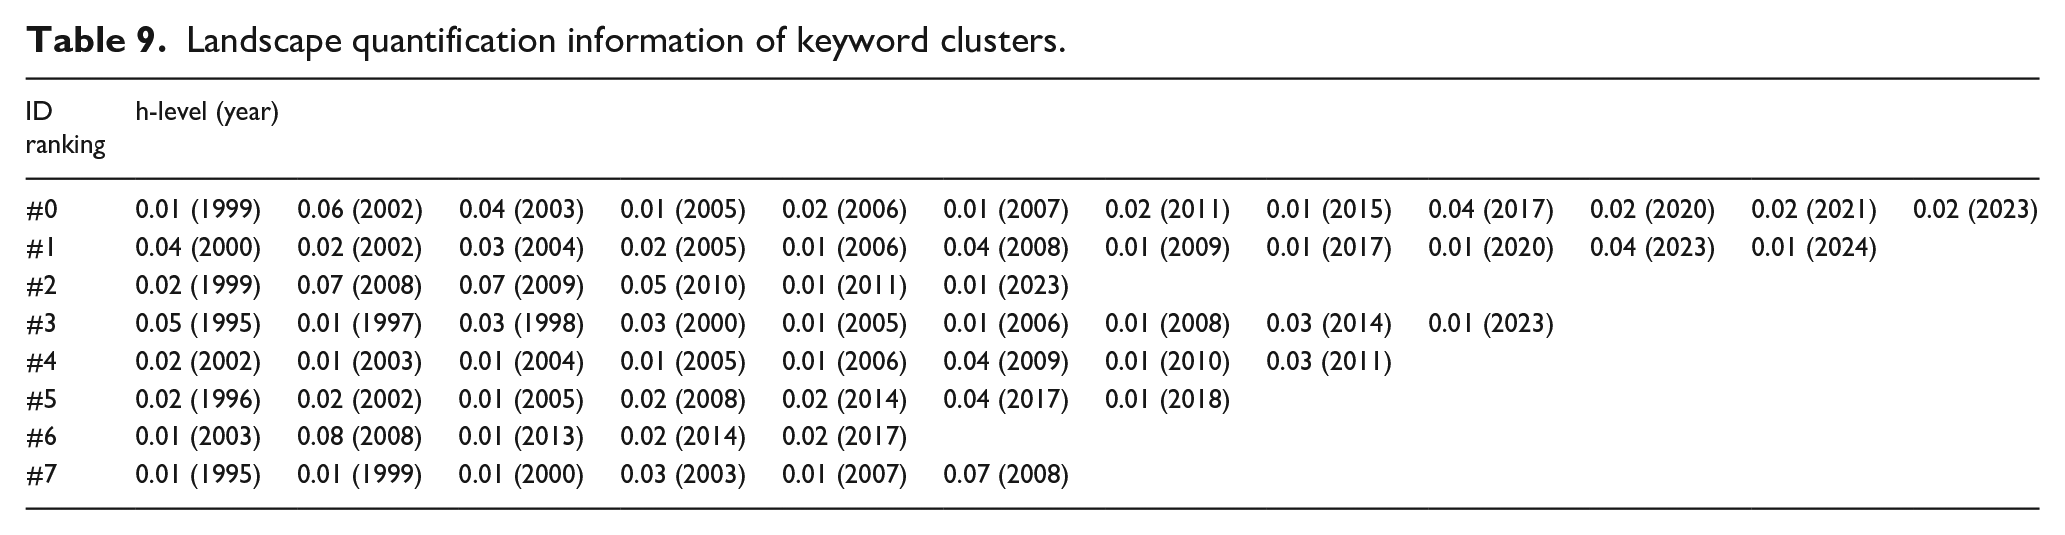
As shown in Figure 10, significant spike signals were observed in the map. To quantitatively characterize these spikes, Landscape quantification information of keyword clusters was provide in Table 9. The quantitative value for Landscape in Table 9 is expressed as {h-level (year)}, where the h-level is calculated as the ratio of the number of keywords clustered at specific temporal nodes to the unified benchmark of 100.Temporal landscape analysis reveals distinct hierarchical peaks across thematic clusters. Cluster #0 exhibits its primary peak in 2002 (h-level = 0.06), with secondary maxima in 2003 and 2017 (both h-level = 0.04). Clusters #1 and #5 demonstrate uniformly distributed peaks, manifesting at 2000/2008/2023 (all h-level = 0.04) and 2017 (h-level = 0.04) respectively. Cluster #2 shows co-dominant maxima in 2008–2009 (h-level = 0.07 for both years), while Cluster #3 presents a singular peak in 1995 (h-level = 0.05). Cluster #4 peaks primarily in 2009 (h-level = 0.04), followed by a subordinate signal in 2011 (h-level = 0.03). Notably, Cluster #6 achieves the global maximum intensity at 2008 (h-level = 0.08), whereas Cluster #7 registers its primary peak in the same year (h-level = 0.07). This hierarchy confirms 2008 as a critical convergence point, influencing four independent clusters (#1, #2, #6, #7) and exhibiting the dataset’s strongest signal (Cluster #6).
Landscape quantification information of keyword clusters.
The eight keyword clusters delineate the intellectual architecture of LDT research, revealing three distinct thematic dimensions. First, clusters such as academic libraries (#0), digital library (#3), and university library (#5), spanning from the 1990s to the present, constitute the traditional core of the field. These clusters reflect sustained scholarly investment in institutional digitization frameworks, metadata standardization, and digital resource management, underscoring the foundational role of infrastructure development in shaping the discipline. Second, clusters like open access (#6) and document image processing (#7), emerging post-2010 with high silhouette values (S > 0.9), signal frontier shifts toward interoperability and AI-driven automation, marking a transition from digitization as a technical process to intelligent service ecosystems. Finally, clusters such as depository libraries (#1) and digital mathematical library (#2) represent localized innovations (such as cultural heritage preservation in Romania), highlighting the field’s geographic fragmentation and niche specialization. Together, these clusters map a trajectory from legacy systems to adaptive paradigms, while exposing tensions between global standardization and context-driven experimentation.
Analysis of keywords bursts
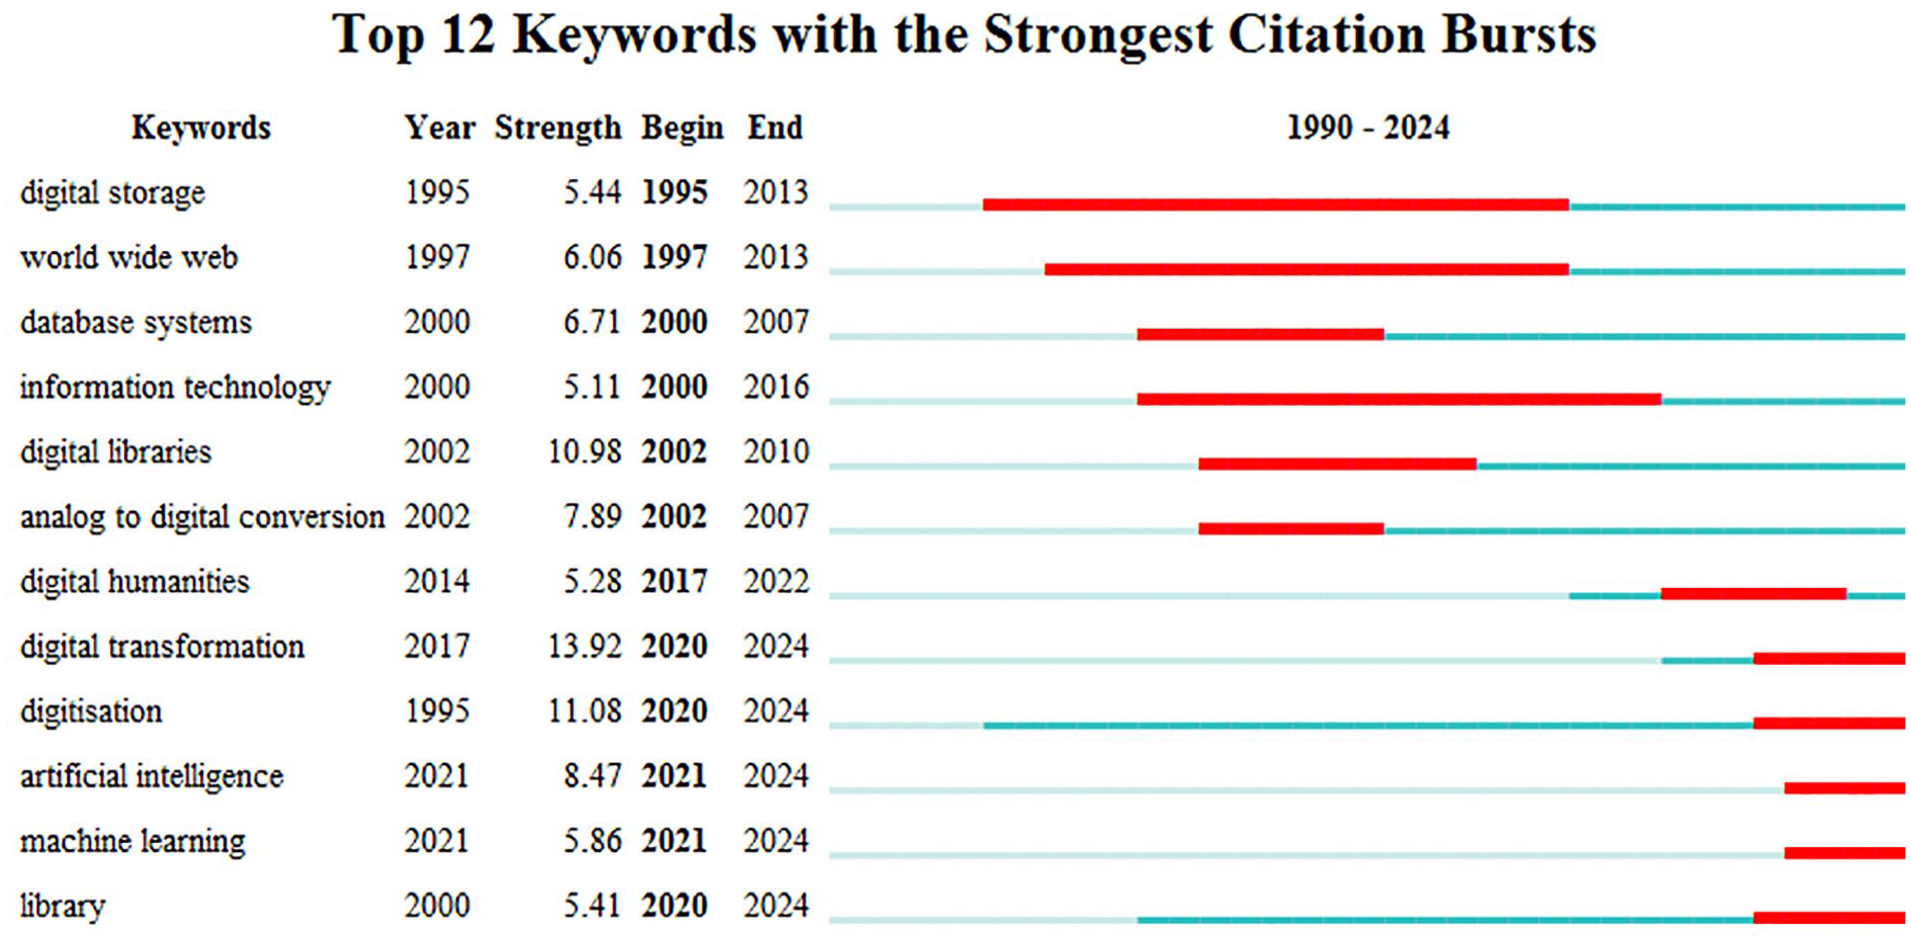
Keyword bursts refer to a sudden and significant increase in the frequency of a keyword within a certain period. This abrupt change typically indicates that the research topic corresponding to this keyword has become a research hotspots or frontier during this pried (Kleinberg, 2002). Clusters represent the what (enduring themes), whereas bursts reveal the when (critical moments of change). While clustering (LLR algorithm) captures stable thematic structures, burst detection (Kleinberg, 2002) isolates temporally concentrated innovations, offering complementary perspectives on knowledge dynamics. To further understand the research hotspots and frontiers in the field of LDT, an analysis was made of keyword bursts. Sorted by time, the authors selected the top 12 keywords, constructing a map of keyword bursts (Figure 11). The Minimum Duration was set to 2 years.The blue bold section in the map indicates the total time period in which the keyword persists, and the red section indicates the duration of the keyword bursts. The red section is a subset of the blue bold section. The keyword “Digital storage” began to burst in 1995 and continued until 2023, with burst strength of 5.44, meaning the longest burst duration. This manifested that digital storage had always been a focus of attention in the field of LDT. Keywords “digital humanities,” “artificial intelligence,” and “machine learning” have been bursting up to now and represent the current research hotspots and future research trends in the field of LDT.
Keyword bursts.
The evolution of LDT research is marked by distinct temporal phases, each driven by technological advancements and shifting scholarly priorities. In the early phase (1995–2010), keyword bursts such as digital storage and optical character recognition reflect foundational efforts to digitize physical resources, largely propelled by the widespread adoption of scanning technologies and early digital archiving tools. These bursts highlight a focus on overcoming technical barriers to digitization and establishing basic infrastructure. By contrast, the current phase (2020–2024) is characterized by bursts in artificial intelligence (strength > 5.0) and machine learning, which align with global debates on AI ethics and the rise of generative models like ChatGPT. This shift signals a paradigm transition from mere process digitization to the development of intelligent, adaptive service frameworks. It underscores the field’s growing emphasis on automation, personalization, and ethical governance in the era of data-driven decision-making. Together, these temporal patterns reveal a trajectory from technological enablement to socio-technical integration, positioning libraries as dynamic hubs of innovation rather than passive repositories.
Discussions
This bibliometric analysis provides a panoramic view of the evolving landscape of LDT research spanning over three decades. The research findings, derived from the visualization of collaboration networks, co-citation patterns, and keyword evolution, reveal distinct characteristics and tensions within the field, offering nuanced insights that both corroborate and extend existing literature.
Crucially, the authors’ analysis confirms the prominence of three thematic pillars identified in prior reviews: the influential factors (funding, skills, infrastructure), the critical role of information technologies, and the burgeoning domain of AI-driven transformation (Cao et al., 2018; Tait and Pierson, 2022; Yang et al., 2023). However, the knowledge mapping approach unveils deeper structural patterns and dynamics that refine this understanding:
(1) The “Influential Factors” Paradox: While the literature consistently identifies barriers like funding shortages, skill gaps, and infrastructure deficits as critical (Adarkwah et al., 2024; Nakaziba and Ngulube, 2024), the network analysis reveals a concerning disconnect. The sparse institutional and author collaboration networks (Figures 4 and 5), coupled with the dominance of individual authors and limited interdisciplinary links, suggest that the field itself may be structurally ill-equipped to overcome the very collaboration and knowledge-sharing hurdles it identifies as key obstacles. This finding amplifies the concerns raised by Nakaziba and Ngulube (2025) and Khoeini et al. (2024) about fragmented disciplinary perspectives, providing empirical evidence of the limited cross-pollination needed to tackle complex systemic challenges like skill development or infrastructure scaling. The literature diagnoses the problem, but the maps show the field’s collaborative structure currently lacks the remedy.
(2) The Lag in Integrating Cutting-Edge IT & AI: The keyword burst detection (Figure 11) clearly signals the recent surge in AI as a frontier topic, aligning with optimistic predictions about its transformative potential (Miao, 2024; Okunlaya et al., 2022). However, the journal co-citation network (Figure 6) presents a contrasting picture. The strong co-citation clusters remain centered on traditional LIS journals (Journal of Academic Librarianship, Electronic Library), while high-impact, technology-focused journals like the Journal of Medical Internet Research (IF = 5.8) exhibit surprisingly low co-citation counts despite their relevance to AI applications. This indicates a significant lag between the emergence of AI as a hot topic within LDT discourse and its deep integration into the field’s core intellectual foundations as reflected in citation practices. It suggests that much of the AI discussion within LDT may still be aspirational or preliminary, lacking strong grounding in the broader, rapidly advancing AI literature, thus potentially hindering the translation of AI concepts into robust LDT frameworks and applications. This observation extends beyond the general recognition of IT’s importance (Malinovsky, 2023; Zharinov, 2020) to highlight a specific gap in engaging with the most advanced technological discourse.
(3) Evolution from Digitization to Intelligence was Confirmed but with Nuance: The keyword cluster timeline (Figure 9) broadly validates the evolutionary narrative from foundational digitization (#3 Digital Library, #7 Document Image Processing) toward more complex themes like open ecosystems (#6 Open Access) and AI-driven processes. This trajectory supports the conceptual progression outlined by Chu et al. (2022) and others. Nevertheless, the persistence of clusters like #0 Academic Libraries and #1 Depository Libraries alongside the newer clusters, and the localized nature of innovations within some (cultural heritage in #2), underscores that digital transformation is not a linear replacement but a layered process. Legacy concerns coexist with and sometimes constrain the adoption of newer paradigms, revealing tensions between standardization and context-specific adaptation that require further theoretical and practical resolution (Sun et al., 2023).
Implications to theory and practice
Theoretical implications
Digital transformation is an inevitable requirement for the sustainable development of libraries, while an action framework and maturity assessment model are important bridges for the transition of LDT from concept to practice (Yang et al., 2023). Theoretically, the action framework is for guiding the transformation process, while the maturity model is for assessing the transformation effectiveness. The two complement each other. First, the action framework for LDT guides a library in planning and designing its digital transformation strategy from a macro perspective, pinpointing specific tasks and transformation directions, and laying the foundation for subsequent action plans. Existing studies on action frameworks for digital transformation mainly focus on specific fields or industries, holding a certain degree of universality, but lacking studies on the action framework tailored to the library sector. Hence, constructing a special action framework for LDT will enrich the theoretical research on LDT and provide a reference for the practical digital transformation of libraries. Second, LDT is a long-term, dynamic, and complex process of change. Its completion cannot be assessed with a clear boundary. Yet, the status and development pathways of key elements in the digital transformation can be described in detail using a maturity assessment model. This model can guide the continuous standardization and improvement of these elements, thereby promoting the continuous optimization and gradual maturation of LDT.
Practical implications
The digital transformation and development of libraries are no longer limited to the mere digitization of resources at the initial stage; rather, they are promoted in all elements of a library based on the early accumulation and experiences of resource digitization. The “five-element theory” of libraries posits that a library consists of five essential elements: books, readers, leaders and cadres, buildings and equipment, and working methods (Chen, 2022b). Digital transformation fundamentally involves a comprehensive overhaul of library resources, spatial configurations, technological frameworks, and staff competencies, aiming to fully realize the library’s multifaceted value as a knowledge hub, collaborative ecosystem, and digital service platform, thereby enabling a holistic digitization of library operations and services (Sun et al., 2023). At the resource level, underpinned by the strategic frameworks of the global intelligent library ecosystem and the policy-driven initiatives within national cultural sectors, libraries are poised to transcend existing constraints by advancing pan-domain digital content ecosystems through comprehensive resource digitization. This transformation will culminate in the establishment of an open-access cultural knowledge repository, fostering global knowledge sharing and interoperability. At the spatial level, the Internet, digital technology, VR, and AR have advanced people’s demands for lifelong learning, blended learning, and mobile reading. Against this background, virtual space emerges as an important manifestation of library space. Information commons, learning commons, maker spaces, and other concepts have been put into practice in the global library community. Therefore, a hybrid space that combines virtual and physical elements should be created in the process of digital transformation to leverage the “spatial value” of libraries (Silver, 2006) and enable a library to enter a new realm of advanced spatial services. At the technical level, a library needs to take digital transformation and development as the core driving force to continuously enhance its ability to supply and serve cultural digital content and create a future-oriented digital environment. Efforts should focus on three key areas: building a digital cultural system based on all media, establishing a platform-based service mechanism oriented toward the future, and constructing a data-factualized driving mechanism. At the librarian level, team that emphasizes both numerical and intellectual capabilities should be constructed to drive the digital transformation and development of a library. Specifically, libraries should focus on cultivating librarians’ abilities in demand perception and analysis, data management and service, intelligent application and innovation, as well as professional and intelligent services (Chu and Zhang, 2022).
Moreover, to address the systemic barriers to LDT, such as chronic funding shortfalls, technological skill gaps, and infrastructural deficiencies, a multi-tiered strategic framework is imperative. First, policy advocacy must be prioritized to secure sustainable funding streams; libraries should collaborate with national and supranational bodies (e.g. lobbying for grants under the EU’s Digital Europe Program) to institutionalize digital transformation as a public policy priority. Second, building skill ecosystems through cross-institutional partnerships can mitigate expertise shortages; establishing regional training hubs would standardize competencies in AI literacy, data governance, and digital curation across library networks. Finally, community-driven innovation models, such as piloting open-source integrated library systems (ILS) or crowdsourced digitization initiatives, can democratize access to advanced tools in resource-constrained settings, fostering grassroots adaptability while minimizing costs. This tripartite approach not only aligns with the socio-technical dimensions of digital transformation but also ensures scalability across diverse institutional contexts.
Limitations
This study acknowledges several limitations inherent to its bibliometric approach. First, reliance on Web of Science (WoS) and Scopus databases, while ensuring citation reliability, may underrepresent significant non-English research and regional innovations (e.g. in Global South contexts like frugal digitization models or Indigenous knowledge initiatives published in platforms like CNKI or SciELO). Second, the focus on high-impact, peer-reviewed journal articles could marginalize valuable insights from smaller-scale pilot studies or localized case reports often found in niche or regional journals. Finally, the g-index threshold settings, though statistically justified to identify dominant patterns, might obscure signals of highly innovative but less cited early-stage research or experimental practices within the field.
Conclusion and recommendation
In the context of the big data environment, research on digital transformation in libraries has become a critical research focus for contemporary information science. This study conducted a comprehensive review of 34 years (1990–2024) of scholarly literature from the Web of Science and Scopus databases, systematically mapping the intellectual landscape of LDT research. By employing bibliometric visualization tools including CiteSpace and VOSviewer, the investigation revealed multidimensional co-citation patterns across spatial, institutional, and disciplinary dimensions, encompassing national contributions, organizational collaborations, co-author networks, core journal distributions, keyword evolution trends, and seminal literature clusters. This multi-layered analytical approach not only delineates the historical development trajectory of the field but also identifies emerging research frontiers, providing systematic insights into the dynamic evolution of digital transformation studies in library science. According to the statistical analysis of the annual number of publications related to LDT, the annual number of publications increased year by year from 1990 to 2024 and is expected to increase continuously. This reflected that this field had been concerned about by stakeholders all the time. Starting from 2022, the increase rate rose markedly, which might be related to the social transformation and changes triggered by digital technologies represented by big data, cloud computing, AI, etc. (Chen, 2022a). The study uncovered that research in this field was mainly conducted in the United States, China, the United Kingdom, India, and Germany. The main research institutions were universities and academic libraries. Close cooperation had been established between countries, but the cooperation between institutions and authors needed to be strengthened. The most productive and influential author was Kratchanov, Ivan. The Journal of Academic Librarianship possessed the highest co-citation count and had significant influence in the field of LDT. Through the analysis of highly cited literature and keywords cluster, the authors identified important and basic knowledge sectors in the field of LDT research, including smart libraries, digital archives, open access, metadata, and document image processing. Future research priorities are anticipated to focus on breaking the obstacles to LDT (including fund investment, facility improvement, information literacy education, professional talent cultivation, and service management enhancement) and the intelligent and personalized applications of artificial intelligence.
Future research should prioritize three interdisciplinary frontiers to address evolving challenges in LDT. First, ethical AI governance requires developing frameworks to mitigate biases in AI-driven recommendation systems, particularly through algorithmic transparency mechanisms in “smart libraries” (Floridi et al., 2018). Such efforts align with broader demands for explainable AI (XAI) in public institutions to ensure accountability and fairness (Wachter et al., 2017). Second, generative AI integration merits exploration, leveraging large language models (LLMs) like ChatGPT for automated metadata tagging and personalized curation. Recent advances in NLP-augmented cataloging (Zhang et al., 2023) and pilot studies demonstrating LLMs’ capacity to reduce metadata labor while preserving accuracy (Gao et al., 2025) underscore their transformative potential. Finally, Global South dynamics necessitate context-sensitive innovation, investigating frugal models (Das, 2016) such as mobile-first digitization kits in sub-Saharan Africa (Opeth, 2014) or crowd sourced OCR tools for Indigenous language preservation (UNESCO, 2025). Collectively, these directions emphasize balancing technological advancement with ethical accountability and equitable access, ensuring libraries evolve as inclusive, adaptive hubs in an increasingly digitized knowledge ecosystem.
Footnotes
Declaration of conflicting interests
The author(s) declared no potential conflicts of interest with respect to the research, authorship, and/or publication of this article.
Funding
The author(s) disclosed receipt of the following financial support for the research, authorship, and/or publication of this article: This study would have been impossible without support by the project of Panzhihua University 2024 Mass Entrepreneurship and Innovation (SC202404) and the project of Panzhihua University in 2024 (2024PYRK02).