
Abstract
This study examines the relationship between collection expenditure, a core financially input in public libraries, and service outcomes as measured by annual circulation. Using panel data from 1112 public libraries in Korea drawn from the National Library Statistics System for 2021–2024, the analysis applies a Random Intercept Cross-Lagged Panel Model (RI-CLPM) to disentangle between-library differences from within-library year-to-year changes. Results showed strong temporal stability in circulation, with prior-year circulation significantly predicting subsequent-year circulation (autoregressive effect). The contemporaneous association between collection expenditure and circulation was statistically significant but modest in magnitude, suggesting the need to consider time-lagged effects. Under an equality-constrained observed-score lagged model (which does not separate between- and within-library components), positive lagged effects were observed: higher collection expenditure in a given year predicted higher circulation in the following year. At the within-library level in the RI-CLPM, year-to-year increases in collection expenditure were significantly associated with increases in circulation. In substantive terms, a 1 million Korean won (KRW 1,000,000) increase in a library’s collection expenditure was associated with an increase of approximately 112 loans in the subsequent year. These findings indicate that expanding collection expenditure is likely to be linked to improved use outcomes and can serve as policy-relevant evidence to inform discussions on budget allocation and performance management for public library collections.
Keywords
Introduction
Do increased investments in library resources lead to greater use? Conversely, does a reduction in inputs translate into declining use? These questions have been repeatedly raised in library and information science (LIS), where researchers have long sought to explain public library performance and to justify public expenditures on library services. Prior studies have documented positive associations between library investment and use outcomes, such as circulation and library visits (Carlozzi, 2018; Park and Park, 2023; Swan et al., 2014). Importantly, emerging evidence suggests that the input–use relationship may not be merely short-lived but can persist over longer time horizons (Enami et al., 2025; Gilpin et al., 2021).
Before discussing the input–use relationship, a more fundamental issue concerns how “library use” should be defined and operationalized. Public libraries have long been positioned as gateways to knowledge and as institutions that support not only information access but also education, culture, and social inclusion (IFLA and UNESCO, 2022). In particular, they have been conceptualized as “meeting-places” where diverse sociocultural groups interact and where social connectedness and inclusion can be fostered (Aabø and Audunson, 2012; Audunson, 2005). If library use is understood as encompassing all actions through which these functions are experienced, then measurement necessarily extends beyond circulation counts to multidimensional indicators—such as participation in educational and cultural programs, the number of users from underserved populations, and the frequency of public-forum events hosted. Along these lines, Stabell (2015) proposed an index of “library use” by standardizing annual visits and annual loans by the service population, while Kim (2016) adapted this approach to the Korean context by replacing service population with the number of registered users. These examples illustrate that the choice of use indicators can vary by research purpose and policy context, making the validation and justification of indicator selection a core component of research design.
Nevertheless, circulation remains a substantively important indicator in discussions of public library performance and roles. Because guaranteeing citizens’ opportunities for access to information is a foundational public library value, lending—through which access to collections is mediated—has historically functioned as a signature activity of modern public libraries (Yoon, 2020). Although circulation does not capture the full breadth of library use, it remains a highly comparable metric, including in the post-pandemic period; accordingly, circulation is used in this study as a proxy indicator of library use. Among potential input measures associated with circulation (e.g. collection size, number of programs, staffing levels), this study focuses on collection expenditure as an input that most directly reflects users’ demand for new titles and diverse materials. Changes in acquisition spending can influence circulation by shaping the currency and diversity of collections, and collection expenditure represent a key policy-lever variable that can be adjusted in practice within public library systems.
Several studies have examined the association between collection expenditure and circulation. Much of the empirical literature, however, has relied on cross-sectional analyses that link inputs and use at a single point in time, thereby failing to fully account for temporal ordering and the possibility of lagged effects (Carlozzi, 2018; Swan et al., 2014). In practice, public funds are not necessarily executed in a lump sum at the beginning of the fiscal year, and the acquisition workflow—selection, purchasing, cataloging/processing, and shelving—requires time. Consequently, changes in collection expenditure may be reflected in circulation within the same year, but they may also materialize with a delay in the subsequent year.
Moreover, analyses based on cross-sectional data tend to capture between-library differences—such as the general pattern that larger libraries circulate more—while offering limited leverage for explaining change within the same library over time. To address the policy-relevant question of whether a given library’s increase in collection expenditure leads to improved use outcomes, a longitudinal analytic framework is required—one that can disentangle within-library variation from between-library differences.
To overcome these limitations, this study uses public library data from the Korean National Library Statistics System (2021–2024) to examine the longitudinal relationship between collection expenditure and circulation. Specifically, by separating stable between-library differences from year-to-year within-library fluctuations, the analysis tests whether collection expenditure exhibit lagged effects on subsequent circulation after controlling for the autoregressive structure whereby prior-year circulation predicts next-year circulation. It also examines whether such lagged effects are evident not only at the between-library level but also within libraries across time. To this end, a Random Intercept Cross-Lagged Panel Model (RI-CLPM) is estimated in Mplus 7. The findings are intended to provide policy-relevant evidence to inform public library collection development budgeting.
Literature review
The relationship between budgets and library use
A substantial body of research has accumulated on the association between library inputs—particularly budgets (including collection budgets)—and library use. Carlozzi (2018), using public library data from Massachusetts, reported a statistically significant positive relationship between municipal funding and library use. Similarly, Choi (2009) analyzed factors influencing annual user counts in public libraries in Seoul and included budget measures (including collection-related expenditures), documenting associations between budgetary inputs and use indicators. In developing financial input metrics related to library use, Stabell (2015) proposed a Total Funding Indicator that incorporates collection budgets, and Kim (2016) applied this approach to public libraries in Busan, finding that increases in library funding were associated with increased use. Taken together, these studies suggest that financial inputs—including collection budgets—may be meaningfully related to public library use outcomes even when “use” is operationalized beyond circulation alone.
At the same time, much of this evidence is based on data from specific regions and/or single years, indicating a need for validation using large-scale, national-level datasets. Swan et al. (2014) provided a national overview using the U.S. IMLS Public Library Survey (FY2012), systematically reporting key resource indicators (e.g. revenues, expenditures, and staffing) alongside service output indicators (e.g. circulation, visits, and program activity). Building on the same dataset, Joo and Cahill (2019) examined the relationship between expenditures and use with a focus on children’s and young adults’ services. Their findings indicate that expenditures are associated with library use, and they further highlight that purchasing new books is closely linked to children’s circulation. However, these studies are limited in two respects: they do not isolate collection expenditure from broader expenditure categories to directly test their relationship with circulation, and they do not systematically evaluate whether prior-year inputs translate into next-year use through lagged effects.
To address these gaps, Park (2020) analyzed national library statistics data from 2015 to 2019 using a latent growth modeling approach. The study estimated trajectories of circulation while examining how collection expenditure shape changes in circulation over time. Results suggested that collection expenditure functioned to attenuate the overall declining trend in circulation. This finding implies that collection expenditure may be a policy-relevant input factor that not only correlates with the level of use at a given point in time but also moderates patterns of change in use over time.
In summary, financial inputs—including collection budgets—appear to be associated with public library use outcomes. Nevertheless, many studies rely on single-year cross-sectional data, which limits their ability to test the temporal structure of effects (i.e. when the effect emerges). Moreover, without separating between-library differences (e.g. size and baseline demand) from within-library variation over time, it remains difficult to answer the policy-relevant question of whether increasing budgets within a given library actually leads to increased use. Finally, even when national datasets are employed, relatively few studies have isolated collection budgets and systematically tested lagged effects on circulation. Therefore, a more rigorous examination of the relationship between collection budgets and circulation requires longitudinal data and analytic strategies that (a) control for autoregressive dynamics, (b) evaluate time-lagged effects, and (c) distinguish between- and within-library variation.
Longitudinal research in library and information science
Longitudinal research has received relatively limited attention in library and information science (LIS). With respect to definitions, Kimberly (1976) adopted a broad conception of longitudinal research, referring to any study that is not cross-sectional. In contrast, other scholars adopt a narrower definition, restricting longitudinal research to studies that collect and analyze data from the same units over multiple years. Under this narrower view, longitudinal research corresponds closely to panel studies, in which the same respondents (or units) are repeatedly measured using the same instruments across multiple waves. Related designs include trend studies, which repeatedly survey the same population (though not necessarily the same individuals), and cohort studies, which follow populations sharing a common defining characteristic. Across these variants, Menard (1991) identifies three core conditions: (1) data must be collected at two or more time points; (2) the units of analysis must be identical or at least comparable over time; and (3) the analysis must include comparisons across time periods. In essence, longitudinal research examines how the characteristics or attributes of a target phenomenon change over time. Beyond improving descriptive understanding, longitudinal evidence is meaningful because it can inform policy decisions about how and in what direction to intervene when the goal is to intentionally change properties of the target system (Korea Education and Research Information Service, 2019: 4).
In LIS, early work that can be viewed as longitudinal in the broad sense dates back to the late 1930s, when Wilson (1938) examined the distribution and status of U.S. libraries across multiple time points. A more refined application of longitudinal design—specifically, a panel approach—can be traced to a graduate alumni follow-up study conducted at the University of Sheffield in the United Kingdom (Roberts, 1973). The study tracked cohorts of graduates (1964–1971) and examined career trajectories and job satisfaction for approximately 2–8 years after graduation. Alumni-tracking studies later expanded to other contexts, including a program in Canberra, Australia (Rochester, 1975), and a follow-up study of participants in a medical librarianship training program of the U.S. National Library of Medicine (Carle, 1995).
As specialized statistical software and modeling techniques for panel data have advanced, longitudinal research has moved beyond simple trend description to the identification and prediction of drivers of change over time. For example, Park et al. (2018) discussed the applicability of latent growth modeling in LIS and examined factors influencing public library users’ borrowing behavior. Subsequently, Park (2020) used national public library data to analyze library-level determinants of circulation, and Park and Park (2023) extended this line of work by applying growth mixture modeling, thereby addressing heterogeneity in circulation-related trajectories.
With respect to longitudinal evidence on budgets and library use, Gilpin et al. (2021) analyzed IMLS Public Library Survey data (1992–2018) using a quasi-experimental design. Libraries receiving large-scale investments (exceeding USD 1000 per capita) were treated as the intervention group and compared with other libraries as controls. Results indicated that treated libraries experienced approximately a 21% increase in visits, a 21% increase in children’s circulation, and an 18% increase in participation in children’s programs, with effects persisting for at least 10 years after the investment. Similarly, Enami et al. (2025) employed a difference-in-differences (DiD) framework to examine service changes following a fiscal shock and to explore underlying mechanisms. After the 2008 financial crisis, the State of Ohio implemented a substantial budget reduction for libraries (approximately 30% in 2009). Using DiD, the authors showed that libraries able to secure local revenue maintained higher levels of circulation and user counts than fiscally constrained libraries, and that these differences persisted for up to 5 years. Although the data sources and levels of aggregation differ, both studies are notable for using panel data and DiD designs to provide empirical evidence on the relationship between fiscal inputs and library service outcomes.
However, while DiD is well suited for identifying policy effects via pre–post comparisons, it is less informative for inferring the structure and dynamics of change processes over time. To address this limitation, Park (2020) applied latent growth modeling to public library statistics from the Korean National Library Statistics System (2015–2019) to estimate circulation trajectories. Although circulation declined over the study period, collection budgets were found to attenuate (i.e. flatten) the negative slope of circulation change. In a related follow-up study, Park and Park (2023) also reported that, in some years, collection expenditure exerted a positive effect on circulation, suggesting that collection expenditure are not independent of lending performance. Nevertheless, latent growth models are primarily designed to characterize trajectories and time-invariant or time-varying predictors of growth and do not directly test reciprocal, wave-to-wave influences without additional modeling.
Accordingly, the present study applies RI-CLPM to more rigorously examine the policy relevance of public library collection expenditure. By disentangling stable between-library differences (e.g. size and baseline demand) from within-library year-to-year fluctuations, RI-CLPM enables a direct test of whether prior-year collection expenditure exert lagged effects on subsequent-year circulation, net of autoregressive carryover in circulation. This approach clarifies how collection expenditure are dynamically linked to circulation and provides policy-relevant evidence on whether budget change precede changes in lending outcomes over time.
Methodology
Research questions
To examine the longitudinal relationship between collection expenditure and circulation more rigorously, this study addresses the following research questions:
Data collection
Institutional context and analytic sample
The analytic sample consists of public libraries included in the Korean National Library Statistics System. In Korea, public libraries may be operated by local governments or by provincial offices of education. Public libraries operated by provincial offices of education are not school libraries embedded in schools; they are public libraries open to local residents, although they are administratively affiliated with education authorities. Some public libraries also use contracted-out management arrangements, in which the library remains publicly established and accountable but day-to-day management is delegated to another organization.
Data source and study period
To examine the effects of collection expenditure on public library circulation, this study uses annual, library-level statistics drawn from the Korean National Library Statistics System. Given the likelihood that patterns of library use changed structurally before and after COVID-19, the analysis focuses on the post-pandemic period to enhance the timeliness and practical relevance of the findings. In addition, because the early phase of the pandemic (2020) involved extensive closures and service restrictions—potentially generating atypical fluctuations in service provision and use—the analytic period is restricted to 2021–2024.
Construction of the analytic dataset
Reflecting the study’s core variables—circulation and collection expenditure—libraries were selected only if both measures were observed annually throughout 2021–2024. The analytic dataset was constructed by starting from the 1296 public libraries listed in the National Library Statistics System (as of 2024) and then applying a stepwise set of exclusion criteria.
First, libraries that opened during the study period and therefore lacked complete 4-year observations were excluded to preserve longitudinal comparability. Although some libraries opened in 2021 and reported values for that year, these figures are unlikely to reflect a full-year measure for the baseline year; thus, they were excluded under the same rule. This step removed 151 libraries. Second, libraries with missing circulation records (n = 23) and missing collection expenditure values (n = 9) were excluded. Third, observations reported as zero (0) for these variables were excluded. Although a value of zero could in principle represent a true zero, nonreporting or measurement error could not be ruled out; moreover, such values may inflate variance and distort model estimation. Finally, one library exhibiting an extremely large circulation value in a particular year—substantially exceeding all others—was excluded as likely reflecting a data entry error. After applying these criteria, the final analytic dataset comprised 1112 public libraries.
Measures and data preprocessing
Two main variables were used in the analysis: annual circulation and collection expenditure. Annual circulation refers to the number of print-material lending transactions recorded for each public library in a given year. It does not include digital material use, such as e-book downloads or other forms of digital resource access. Collection expenditure refers to the settled annual amount actually spent on the acquisition of library materials. Thus, the variable represents realized spending rather than the initially allocated budget. Both variables were measured annually at the library level for the period 2021–2024.
To improve numerical stability and reduce scale-related estimation issues in the RI-CLPM, variables were rescaled before analysis. Circulation is divided by 1000 and therefore is interpreted in units of thousand loans. Collection expenditure is originally reported in units of 1000 KRW in the source system; after additional scaling by 1/1000, the collection expenditure variable is interpreted in units of million KRW.
Data analysis
Analytic approach and estimation
To analyze the longitudinal relationship between circulation and collection expenditure, this study employs the RI-CLPM. RI-CLPM decomposes repeated observations into (a) stable between-library differences and (b) within-library deviations over time, allowing the analyst to distinguish between-library “level” differences from within-library change processes (Hamaker et al., 2015). Models were estimated in Mplus 7 using the robust maximum likelihood estimator (MLR).
Analysis steps
Analyses proceeded in the following sequence aligned with the research questions. First, we computed descriptive statistics for circulation and collection expenditure (2021–2024) and examined year-specific correlations to inspect the basic covariance structure. Second, corresponding to RQ1, we estimated the autoregressive effects of prior-year circulation on subsequent-year circulation; in parallel, we also estimated the autoregressive structure for collection expenditure. Third, corresponding to RQ2, we examined the same-year association of collection expenditure on circulation at each wave. Fourth, corresponding to RQ3, we estimated the RI-CLPM including cross-lagged paths to test whether prior-year changes in collection expenditure predict subsequent-year changes in circulation (i.e. lagged effects).
Model comparison and fit evaluation
To assess whether the lagged effects between collection expenditure and circulation are temporally stable, we compared (a) a constrained model that imposed equality constraints on cross-lagged effects across adjacent intervals and (b) an unconstrained model that freely estimated cross-lagged effects for each interval. Model evaluation was based on standard fit indices (χ2, RMSEA, CFI, TLI, SRMR) and information criteria (AIC, BIC). Interpretation and commonly used benchmarks for fit indices followed Hu and Bentler (1999).
Results
Descriptive characteristics of the sample
To examine the relationship between circulation and collection expenditure over the 2021–2024 period (4 years), the final analytic sample comprised 1112 public libraries. Table 1 summarizes the key characteristics of the libraries included in the analysis. By administrative authority, 229 libraries (20.6%) were affiliated with provincial offices of education, 863 (77.6%) were operated by local governments (hereafter, local governments), and 20 (1.8%) were private libraries, indicating that local-government libraries constituted the largest share. By management arrangement, 880 libraries (79.1%) were directly operated, whereas 232 (20.9%) employed contracted-out management. Regarding library type, 87 libraries (7.8%) were children’s libraries and the remaining 1025 (92.2%) were classified as general public libraries. In terms of regional distribution, the largest shares were observed in Gyeonggi (n = 273, 24.6%) and Seoul (n = 180, 16.2%), followed by Gyeongnam (n = 71, 6.4%) and Jeonnam (n = 69, 6.2%).
General characteristics of libraries included in the analysis (N = 1112).
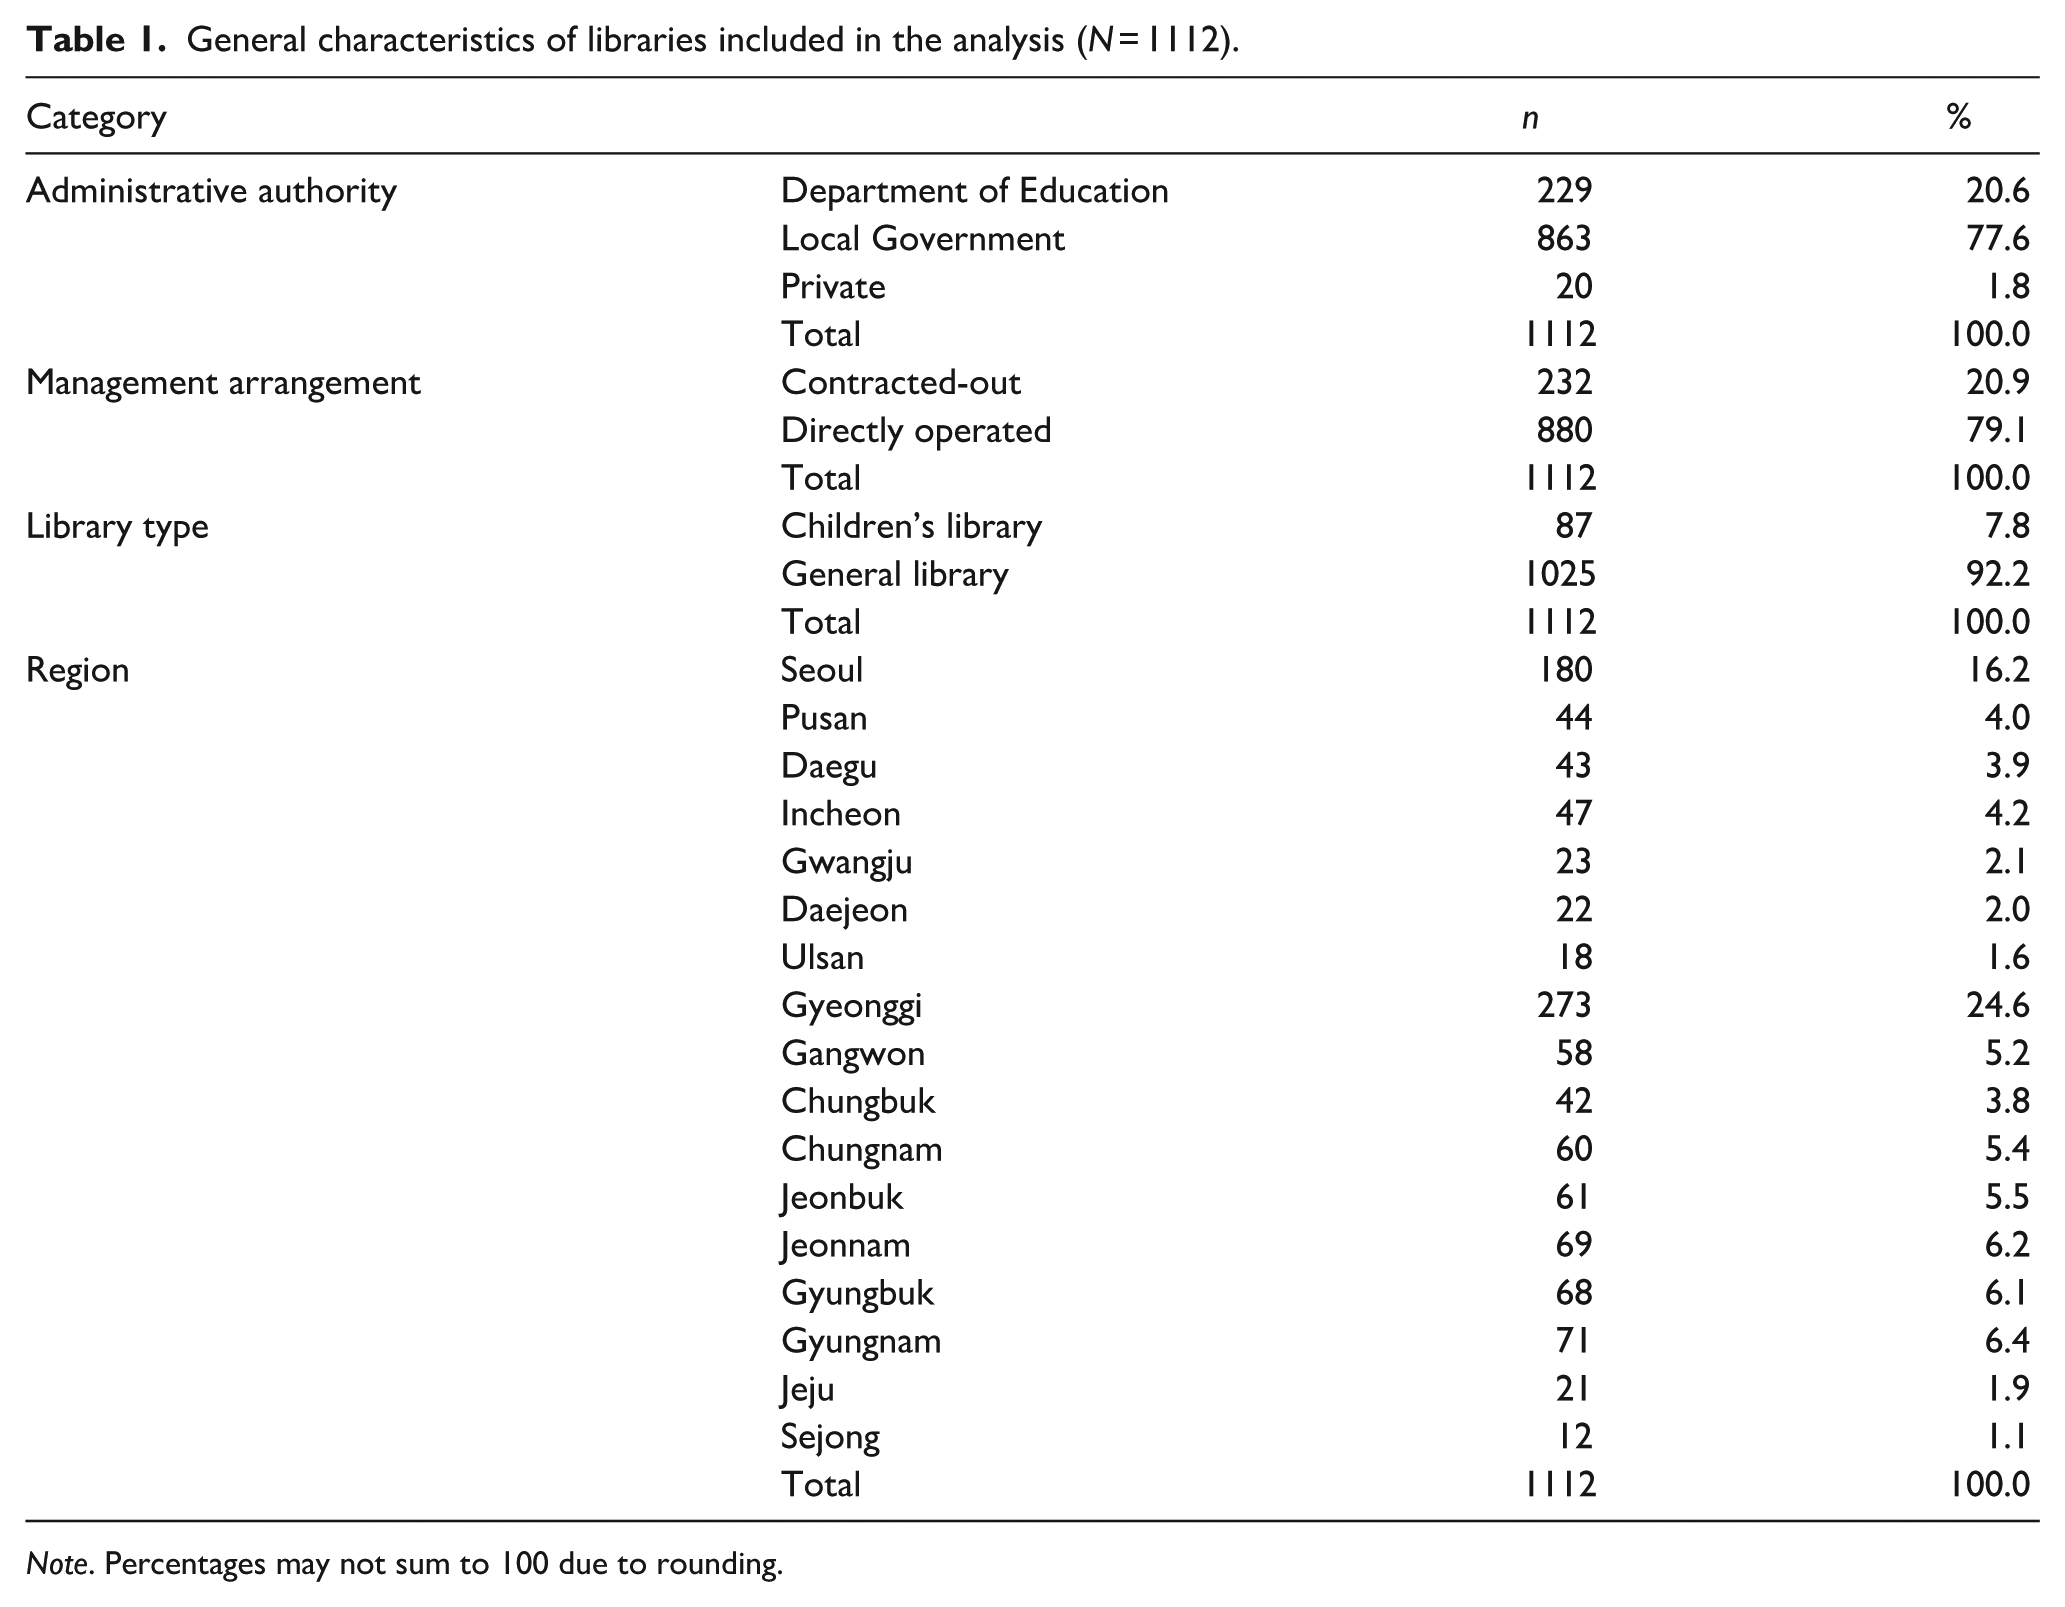
Note. Percentages may not sum to 100 due to rounding.
Distributional characteristics of the variables
To examine the distributional characteristics of the variables used in this study, minimum and maximum values, means, standard deviations, skewness, and kurtosis were computed. As noted in the preprocessing section, the descriptive statistics reported in Table 2 are based on rescaled variables: both circulation and collection expenditure were divided by 1000 to improve estimation stability. Accordingly, circulation is interpreted in units of thousand loans, whereas collection expenditure—given that the original data are reported in units of 1000 KRW—are interpreted in units of million KRW after the additional 1/1000 scaling (approximately USD 783 per 1 million KRW, based on the average USD/KRW exchange rate over 2021–2024).
Descriptive statistics for circulation and collection expenditure (rescaled).
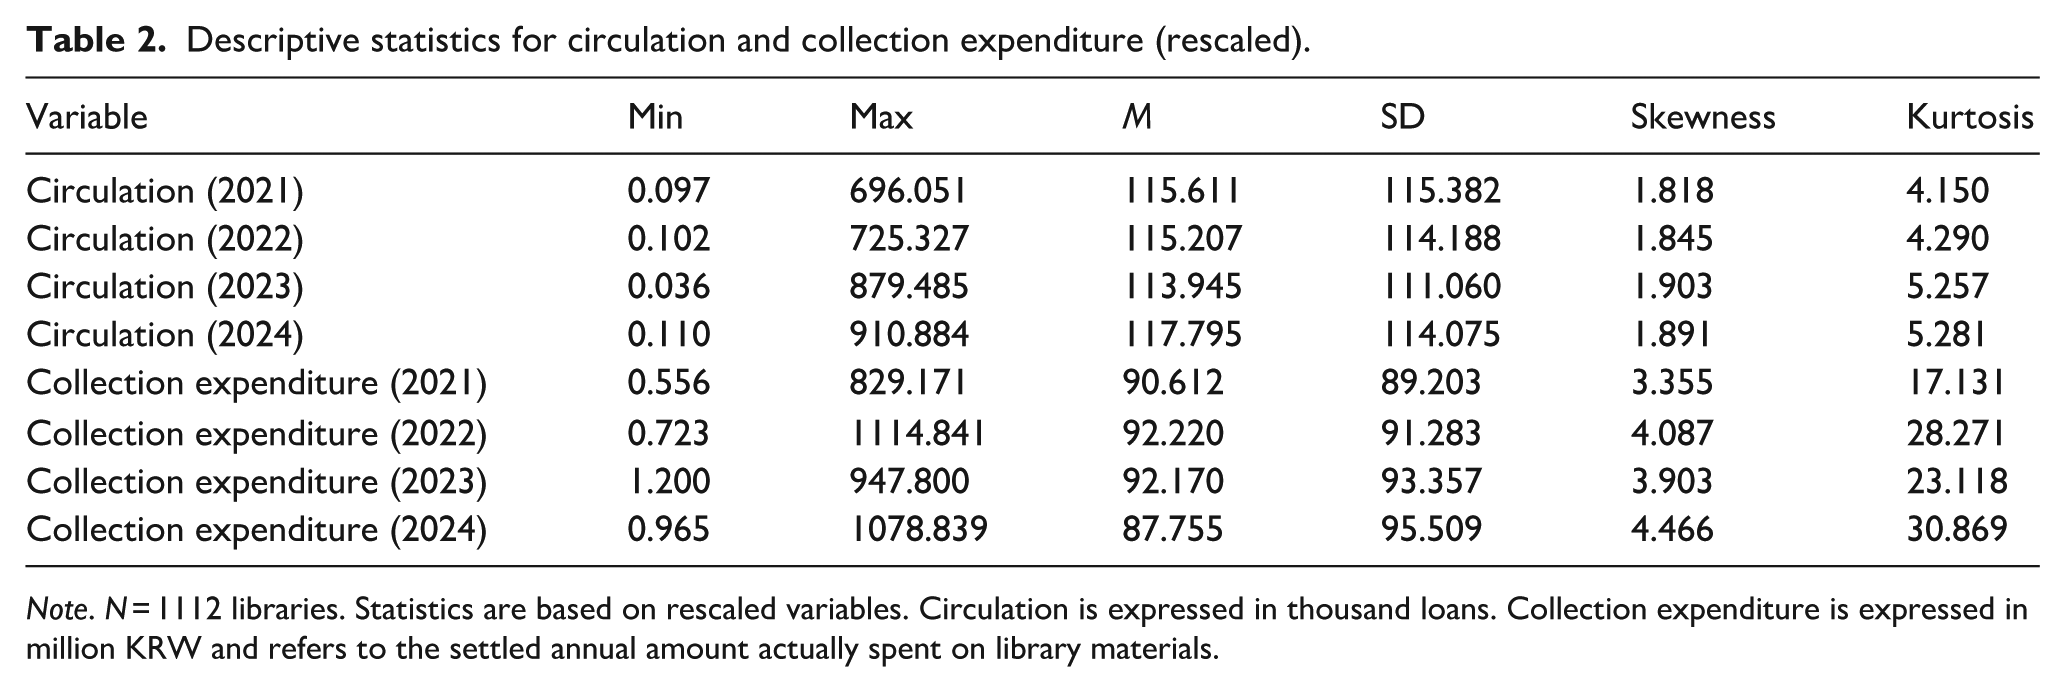
Note. N = 1112 libraries. Statistics are based on rescaled variables. Circulation is expressed in thousand loans. Collection expenditure is expressed in million KRW and refers to the settled annual amount actually spent on library materials.
During the study period, the smallest observed circulation value was 36 loans (in 2023), while the largest was 910,884 loans. Mean circulation declined from 115,611 loans in 2021 through 2023 and then increased to 117,795 loans in 2024. Notably, 2024 showed the highest minimum and a higher maximum circulation value within the observation window, suggesting an overall recovery in lending activity. In contrast, the minimum collection expenditure was 0.556 million KRW in 2021, and the maximum was 1,114.841 million KRW in 2022. Mean collection expenditure peaked in 2022 (92.220 million KRW) and subsequently declined, reaching the lowest mean in 2024 (87.755 million KRW).
Kim (2016) suggested that absolute values of skewness below 3 and kurtosis below 10 indicate no major violation of normality assumptions. This diagnostic is relevant because severely asymmetric distributions may create estimation problems. As shown in Table 2, circulation generally fell within these thresholds, whereas collection expenditure exceeded them across all years, indicating marked non-normality. Given that substantial between-library differences in size are likely to generate large dispersion in both circulation and collection expenditure, non-normality is not unexpected. To mitigate potential distortions in standard errors and model fit statistics due to non-normality, MLR estimation was used.
Pearson correlations among circulation and collection expenditure across the four waves are reported in Table 3. Circulation exhibited high stability across waves (r = 0.912–0.961), and collection expenditure also showed strong cross-wave correlations (r = 0.774–0.897), indicating substantial year-to-year persistence in both variables. Correlations between circulation and collection expenditure were likewise sizeable (r = 0.526–0.647), suggesting a strong bivariate association. However, these correlations may be confounded by between-library differences such as library size and baseline demand. Therefore, subsequent analyses estimate the relationships separately at the between-library and within-library levels.
Correlations between circulation and collection expenditure (2021–2024).
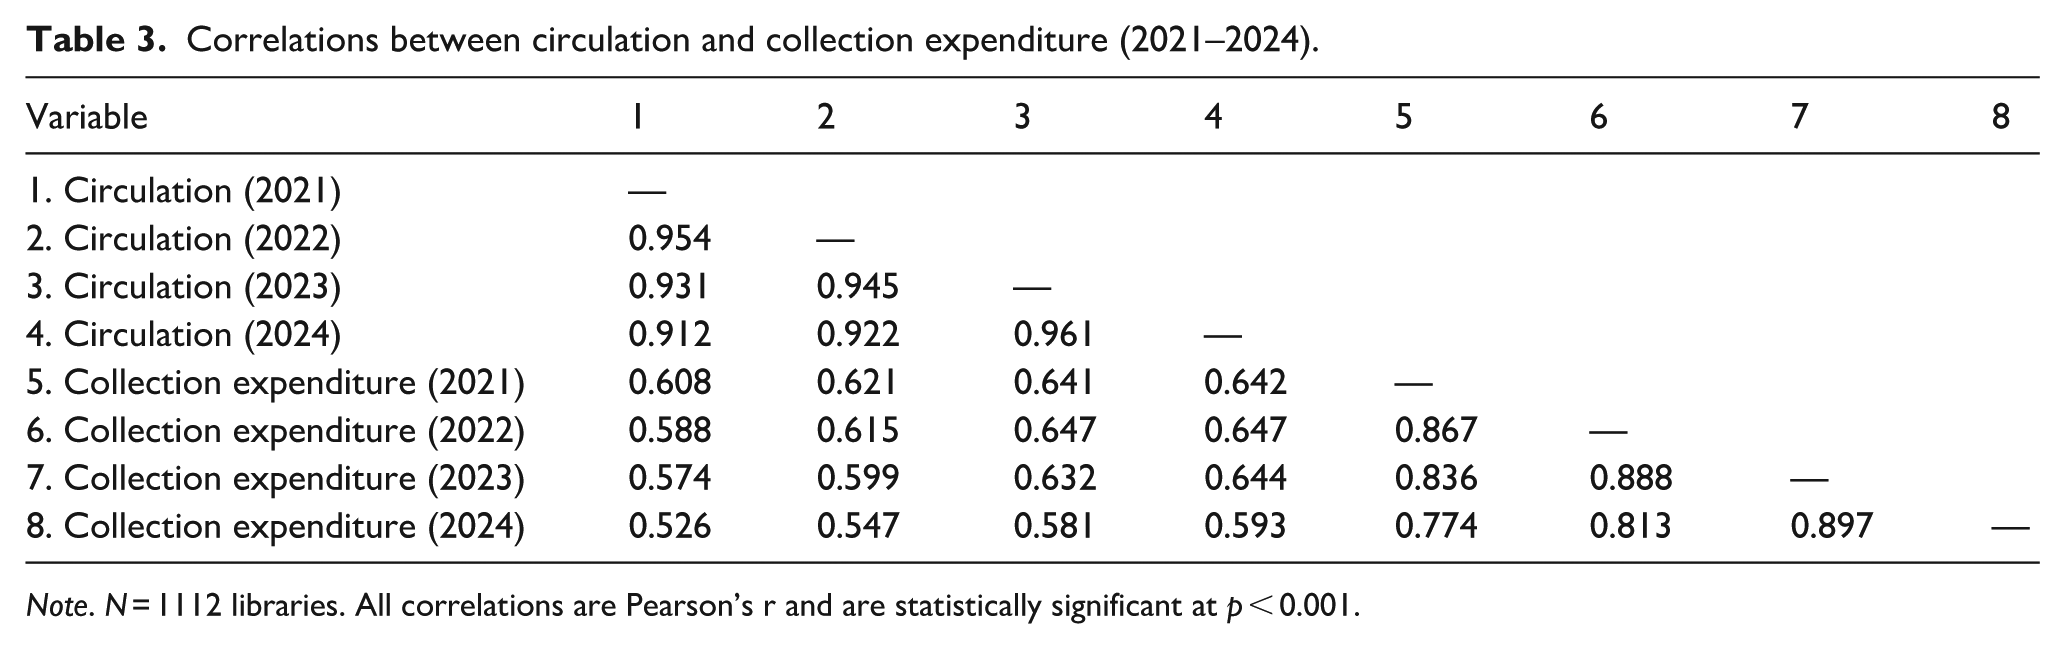
Note. N = 1112 libraries. All correlations are Pearson’s r and are statistically significant at p < 0.001.
Same-year association between collection expenditure and circulation
The same-year association between circulation and collection expenditure was estimated separately for each wave from 2021 to 2024 using MLR. Collection expenditure were positively associated with circulation at every wave. For example, in 2024, the unstandardized coefficient was positive (B = 0.180) and statistically significant (p = 0.001). However, explanatory power was modest (R2 = 0.026 in 2024), and a similar pattern was observed in other waves (R2 = 0.007−0.020). This suggests that same-year collection expenditure alone does not sufficiently explain cross-sectional variation in circulation at each wave.
Model fit was generally poor, χ2(12) = 241.88, RMSEA = 0.131, CFI = 0.863, TLI = 0.750, SRMR = 0.303 (Table 4). Given the high cross-wave correlations in circulation (see Table 3) and the fit statistics, circulation likely exhibits substantial temporal dependence across years, underscoring the need for an explicitly longitudinal modeling framework.
Same-year regression of circulation on collection expenditure (2021–2024).
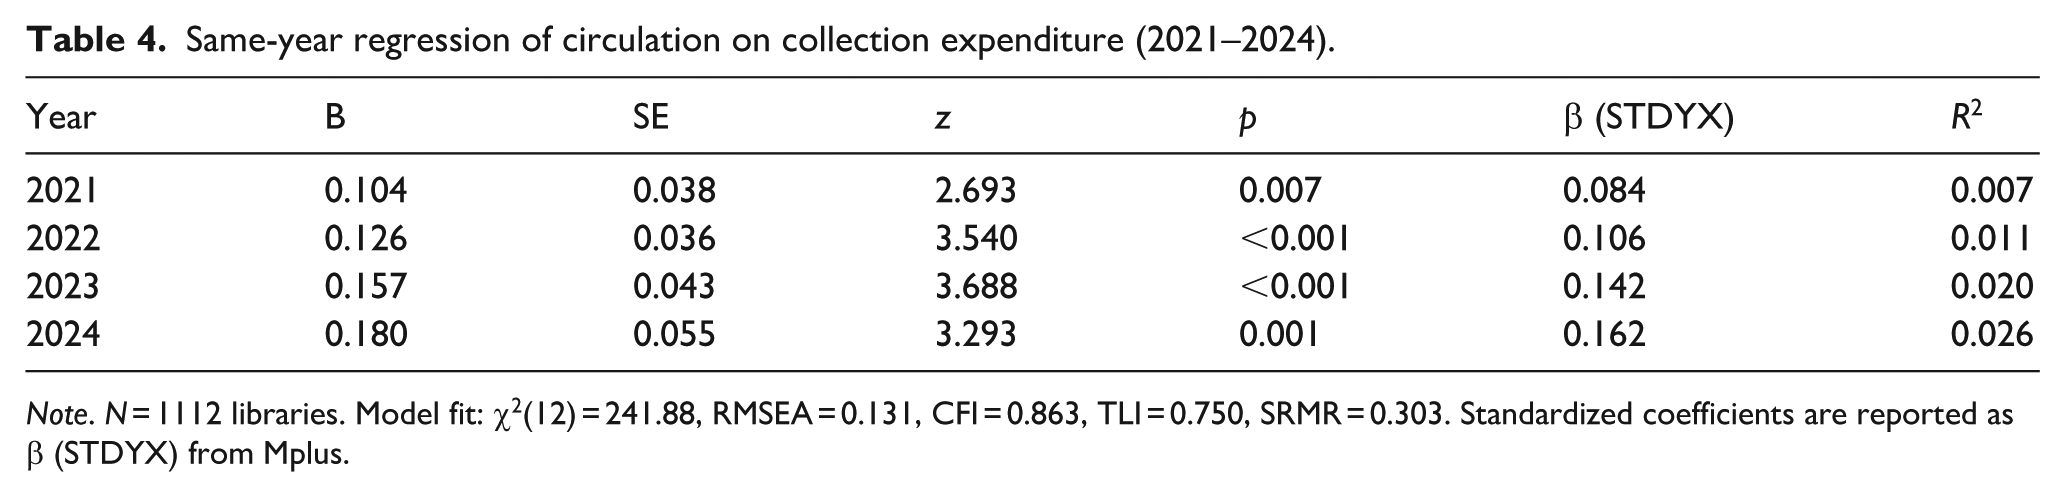
Note. N = 1112 libraries. Model fit: χ2(12) = 241.88, RMSEA = 0.131, CFI = 0.863, TLI = 0.750, SRMR = 0.303. Standardized coefficients are reported as β (STDYX) from Mplus.
Autoregressive model
To assess year-to-year temporal dependence in circulation, an autoregressive (AR) model was estimated (Table 5). Overall model fit was acceptable, χ2(3) = 24.44, RMSEA = 0.080, CFI = 0.971, TLI = 0.941, SRMR = 0.015. Autoregressive effects were very large across all intervals (2021 → 2022: β = 0.954; 2022 → 2023: β = 0.945; 2023 → 2024: β = 0.961) and statistically significant. This indicates strong persistence in circulation from 1 year to the next. Explained variance was also substantial: approximately 89–92% of the variation in each wave of circulation was accounted for by the prior year’s circulation (R2 = 0.909 for 2022, 0.893 for 2023, and 0.923 for 2024). Taken together, these results support the presence of strong temporal dependence in circulation and motivate subsequent longitudinal models (e.g. lagged and cross-lagged specifications) to evaluate temporal ordering of budget effects and within-unit dynamics.
Autoregressive model predicting annual circulation.
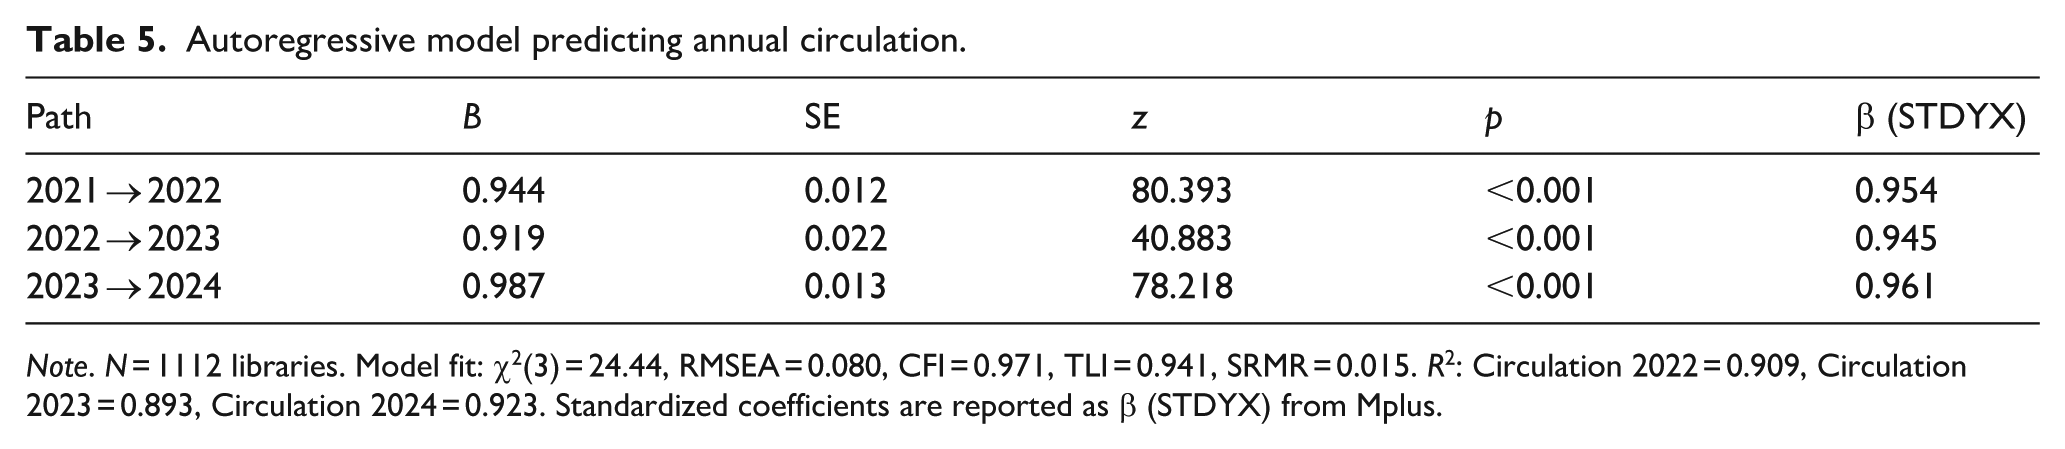
Note. N = 1112 libraries. Model fit: χ2(3) = 24.44, RMSEA = 0.080, CFI = 0.971, TLI = 0.941, SRMR = 0.015. R2: Circulation 2022 = 0.909, Circulation 2023 = 0.893, Circulation 2024 = 0.923. Standardized coefficients are reported as β (STDYX) from Mplus.
Lagged effects of collection expenditure on circulation
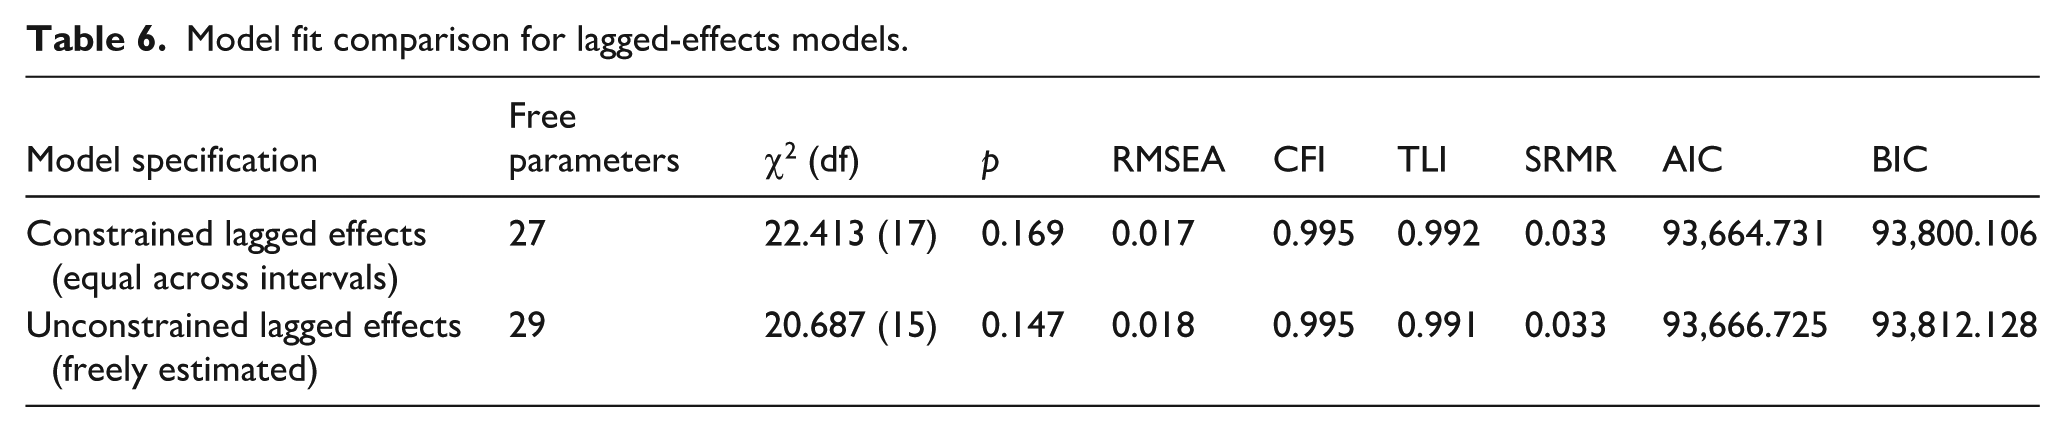
To test whether collection expenditure predict subsequent circulation after accounting for the strong temporal dependence in circulation, a lagged-effects model was estimated in which each year’s circulation was regressed on the prior year’s circulation and the prior year’s collection expenditure (e.g. 2022 circulation on 2021 circulation and 2021 collection expenditure). To provide a parsimonious specification and to clarify the magnitude of lagged effects across intervals, two models were compared: a constrained model that imposed equality constraints on the lagged effects of collection expenditure across time intervals and an unconstrained model that freely estimated the lagged effects by interval. Both models were estimated using MLR.
As shown in Table 6, both models exhibited excellent overall fit. However, despite the additional free parameter(s), the unconstrained model did not meaningfully improve information criteria (AIC and BIC). Interval-specific differences in lagged effects were further examined (Table 7). Although the estimated differences were negative, none were statistically significant. Therefore, for reasons of parsimony, the constrained model with equal lagged effects was retained for interpretation.
Model fit comparison for lagged-effects models.
Tests of interval differences in lagged collection expenditure effects.
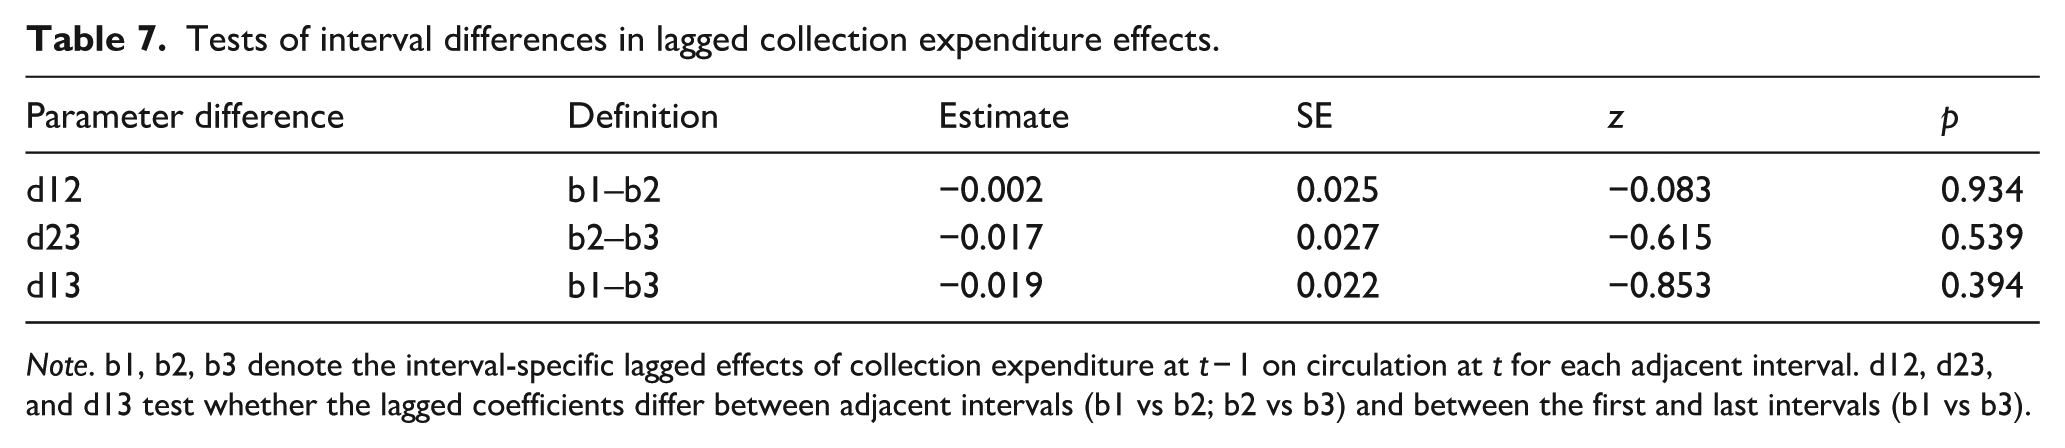
Note. b1, b2, b3 denote the interval-specific lagged effects of collection expenditure at t − 1 on circulation at t for each adjacent interval. d12, d23, and d13 test whether the lagged coefficients differ between adjacent intervals (b1 vs b2; b2 vs b3) and between the first and last intervals (b1 vs b3).
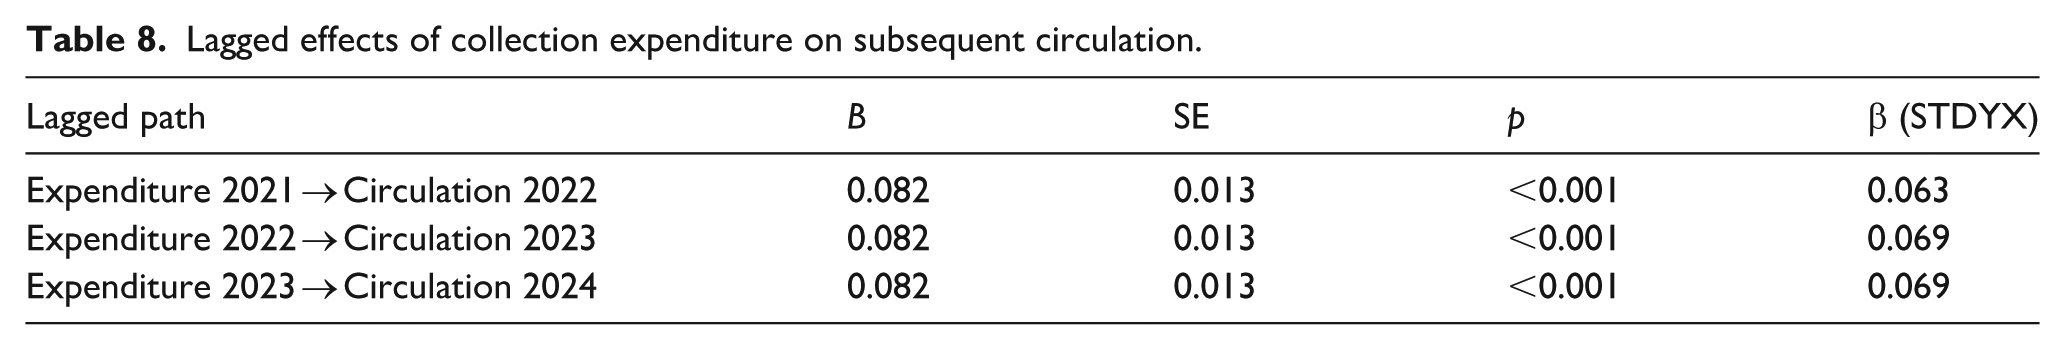
Results from the constrained lagged-effects model are summarized in Table 8. After controlling for prior-year circulation, the lagged effect of prior-year collection expenditure on subsequent-year circulation was statistically significant and positive (B = 0.082, p < 0.001) and was constrained to be equal across intervals. Although the magnitude was modest, the results indicate that increases in collection expenditure are associated with subsequent increases in circulation. Since circulation was measured in thousand loans and collection expenditure was measured in million KRW, the unstandardized coefficient (B = 0.082) implies that a KRW 1 million increase in collection expenditure is associated with an increase of 0.082 thousand loans, or approximately 82 additional loans in the subsequent year. Standardized effects were small but consistent (β (STDYX) = 0.063–0.069; all ps < 0.001) even after accounting for the autoregressive structure in circulation.
Lagged effects of collection expenditure on subsequent circulation.
Within-library lagged effects model (RI-CLPM)
The lagged-effects results reported above (without separating between- and within-library components) indicated that prior-year collection expenditure positively predict subsequent circulation. However, because libraries with high circulation are typically larger and tend to have larger collections, more professional staff, and higher collection expenditure, between-library associations may not explain within-library change. To model within-library fluctuations net of stable between-library differences, RI-CLPM was applied.
Two RI-CLPM specifications were estimated using MLR: a free-lag model that allowed the expenditure → circulation lagged effects to vary across intervals (χ2(18) = 55.963, RMSEA = 0.044, CFI = 0.967, TLI = 0.948, SRMR = 0.017, AIC = 93,654.459, BIC = 93,784.821) and an equalized-lag model that constrained the lagged effects to be equal across intervals (χ2(20) = 21.881, RMSEA = 0.009, CFI = 0.998, TLI = 0.998, SRMR = 0.018, AIC = 93,643.268, BIC = 93,763.602). Both models showed acceptable fit; however, the free-lag model did not yield statistically significant interval differences in lagged effects and did not improve information criteria despite estimating additional parameters. Moreover, overall fit was weaker than that of the equalized-lag model. Accordingly, the equalized-lag RI-CLPM was selected for substantive interpretation (Table 9).
Model fit comparison for RI-CLPM of annual circulation and collection expenditure (2021–2024).
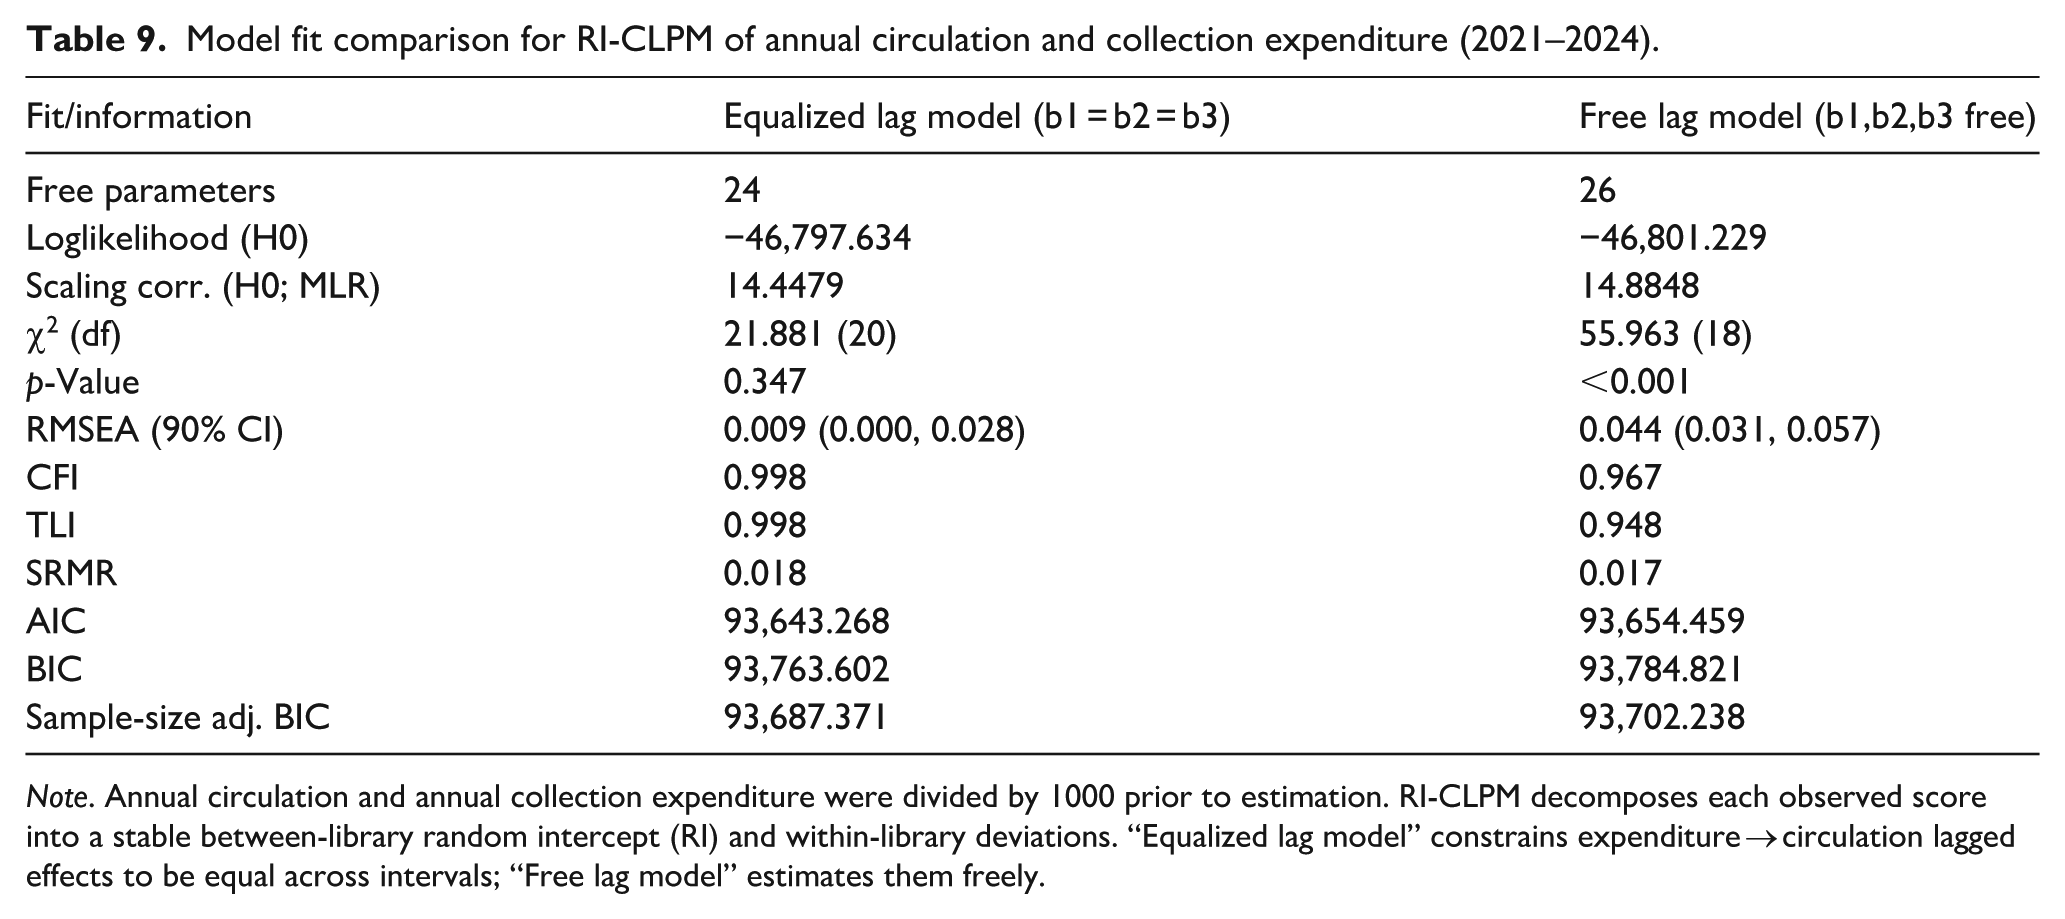
Note. Annual circulation and annual collection expenditure were divided by 1000 prior to estimation. RI-CLPM decomposes each observed score into a stable between-library random intercept (RI) and within-library deviations. “Equalized lag model” constrains expenditure → circulation lagged effects to be equal across intervals; “Free lag model” estimates them freely.
Results for the equalized-lag RI-CLPM are presented in Table 10. The focal path—lagged effects of prior-year within-library deviations in collection expenditure on subsequent-year within-library deviations in circulation—was positive and statistically significant under the equality constraint (B = 0.112, p = 0.001). Standardized coefficients were likewise positive and significant across intervals. The standardized effect for the 2022 → 2023 interval was relatively larger (β (STDYX) = 0.183), whereas the 2021 → 2022 interval was relatively smaller (β (STDYX) = 0.138). Substantively, these results suggest that when a given library spends more than its own typical level on collection expenditure in 1 year (relative to its mean), that library tends to exhibit higher-than-usual circulation in the subsequent year (relative to its mean).
Lagged effects of within-library deviations in collection expenditure on subsequent deviations in circulation (within level).
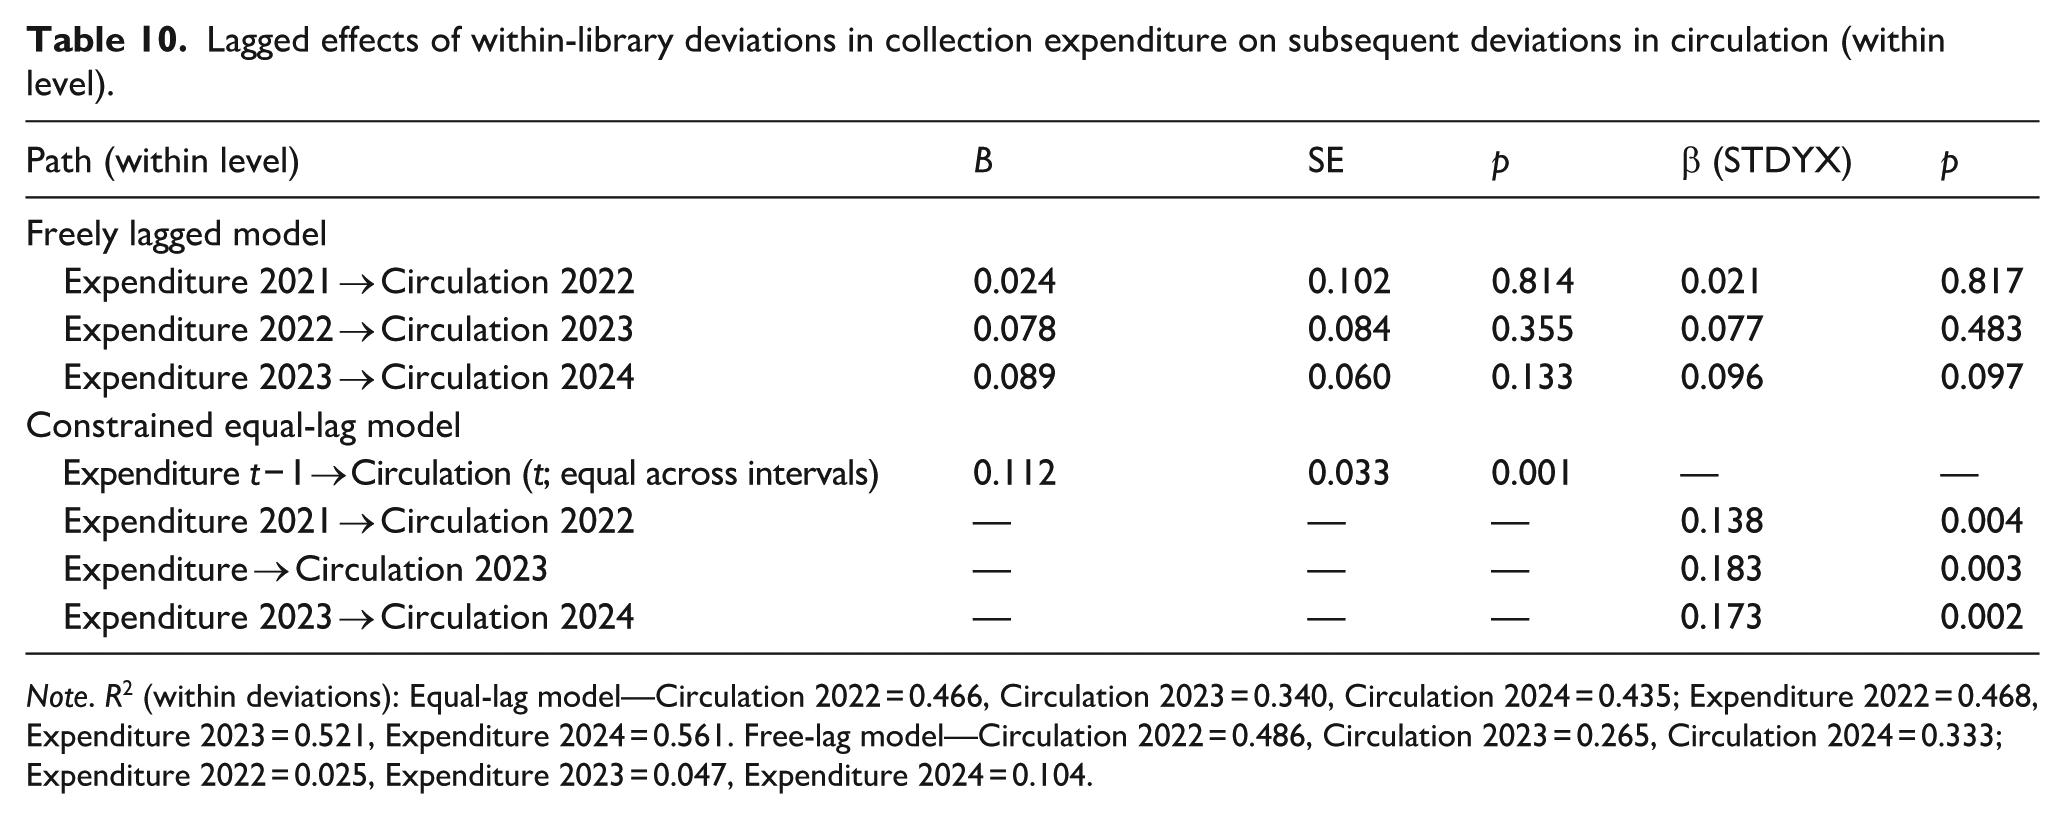
Note. R2 (within deviations): Equal-lag model—Circulation 2022 = 0.466, Circulation 2023 = 0.340, Circulation 2024 = 0.435; Expenditure 2022 = 0.468, Expenditure 2023 = 0.521, Expenditure 2024 = 0.561. Free-lag model—Circulation 2022 = 0.486, Circulation 2023 = 0.265, Circulation 2024 = 0.333; Expenditure 2022 = 0.025, Expenditure 2023 = 0.047, Expenditure 2024 = 0.104.
Given the applied scaling, the equalized-lag unstandardized coefficient (B = 0.112) corresponds to 0.112 thousand loans. Substantively, this means that a KRW 1 million increase in a library’s collection expenditure relative to its own mean is associated with approximately 112 additional loans in the subsequent year relative to its own mean. In terms of explained variance, approximately 34.0%–46.6% of within-year deviations in circulation were accounted for by prior-year deviations in circulation and collection expenditure.
Discussion and limitations
Discussion
Societal changes in the post–COVID-19 period have substantially affected library use. This study uses annual circulation as a core indicator and examines trends in public library lending from 2021 to 2024. Mean circulation declined from 2021 through 2023 and rebounded in 2024, which recorded the highest mean value in the study period, suggesting a gradual recovery in public library lending in the post-pandemic context.
The strong autoregressive pattern indicates that circulation is highly persistent over time. This finding suggests that public library use is not reset annually but is shaped by accumulated patterns of demand, collection use, and local service conditions. Although external environmental shift may also affect circulation, the results indicate that prior use is a central component of subsequent use.
A related practical question is how libraries can attract and retain readers. A plausible answer concerns investments that improve the environment and resources available to users. Prior studies have repeatedly documented that fiscal inputs—including collection expenditure—are significantly associated not only with circulation but also with visits and program participation, and this pattern has been observed across both national library statistics and regional-context studies (Carlozzi, 2018; Choi, 2009; Joo and Cahill, 2019; Kim, 2016; Stabell, 2015; Swan et al., 2014).
Building on this literature, the present study examined the effects of collection expenditure on circulation from two complementary perspectives. First, the same-year analyses indicated a statistically significant positive association between collection expenditure and circulation. However, the explanatory power was very small (R2 = 0.007–0.026), suggesting that same-year collection expenditure alone are insufficient to account for variation in circulation at a given wave. Second, lagged-effects analyses tested whether prior-year collection expenditure predict subsequent-year circulation. Results from the equalized-lag model showed that prior-year collection expenditure were positively associated with next-year circulation. This lagged association was observed in both score lag model and the RI-CLPM. The latter is particularly important because it isolates within-library year-to-year fluctuations from stable between-library differences.
More importantly, the lagged association remained significant after separating stable between-library differences from within-library year-to-year fluctuations. This suggests that increase in collection expenditure within a given library are linked to subsequent increases in circulation, beyond the fact that larger libraries generally tend to spend more and circulate more.
Limitations and directions for future research
The RI-CLPM employed in this study supports stronger causal inference than cross-sectional analyses by separating between-library differences from within-library change. Nonetheless, because the analysis is based on observational data, it is difficult to isolate the effects of policy interventions or external factors that may jointly influence expenditure and circulation. For example, changes in the service-area population or shifts in local governments’ reading and library policies may affect circulation, yet such contextual factors were not fully incorporated as controls in the present models. Future research could extend this work by estimating panel regression models that integrate external covariates or by specifying conditional models that explicitly incorporate operational and environmental context variables, thereby providing a more stringent test of the collection expenditure–circulation relationship.
In addition, circulation was used as the sole indicator of library use. While circulation remains a central performance indicator for public libraries, the expansion of digital resource use (e.g. e-books, audiobooks, and electronic journals) highlights the need to broaden outcome measurement. Future studies could employ composite indicators that incorporate digital use. Such an approach would allow researchers to examine not only total collection expenditure but also how the allocation of budgets across print and digital materials relates to diverse dimensions of library use, thereby offering more directly actionable evidence for policy and budgeting decisions.
Footnotes
Acknowledgements
The author received language-editing assistance using OpenAI’s ChatGPT to improve clarity and readability of the English text. The author reviewed and revised all content and is fully responsible for the final manuscript.
Ethical considerations
Ethical approval was not required for this study because it used publicly available, aggregated secondary data released by the Ministry of Culture, Sports, and Tourism (Republic of Korea) and did not involve human participants, human tissue, or identifiable personal data.
Funding
The author disclosed receipt of the following financial support for the research, authorship, and/or publication of this article: This research was financially supported by Hansung University.
Declaration of conflicting interests
The author declared no potential conflicts of interest with respect to the research, authorship, and/or publication of this article.
Data availability statement
The data supporting the findings of this study are publicly available from the Korean National Library Statistics System (Ministry of Culutre, Sports, and Tourism, Republic of Korea).