






Abstract
Objective
IP-10 and MCP-1 are pro-inflammatory chemokines which are involved in the immunopathogenesis of lupus nephritis and may thus be useful biomarkers.
Methods
SLE patients fulfilling ACR 1997 criteria were included. SLEDAI was calculated and blood and urine samples collected. Active lupus was defined as SLEDAI ≥4. Active patients were divided into active renal (proteinuria ≥ 500 mg/day or active sediment in urine) and active non-renal lupus. Patients with active renal lupus were followed until the nephritis became inactive, when a second sample was collected. Serum and urinary levels of MCP-1 and IP-10 (pg/ml) were measured by ELISA. Urinary values were normalized for urinary spot creatinine (in mg/dL. Thus the values were expressed as pg/mg creatinine × 100 creatinine).
Results
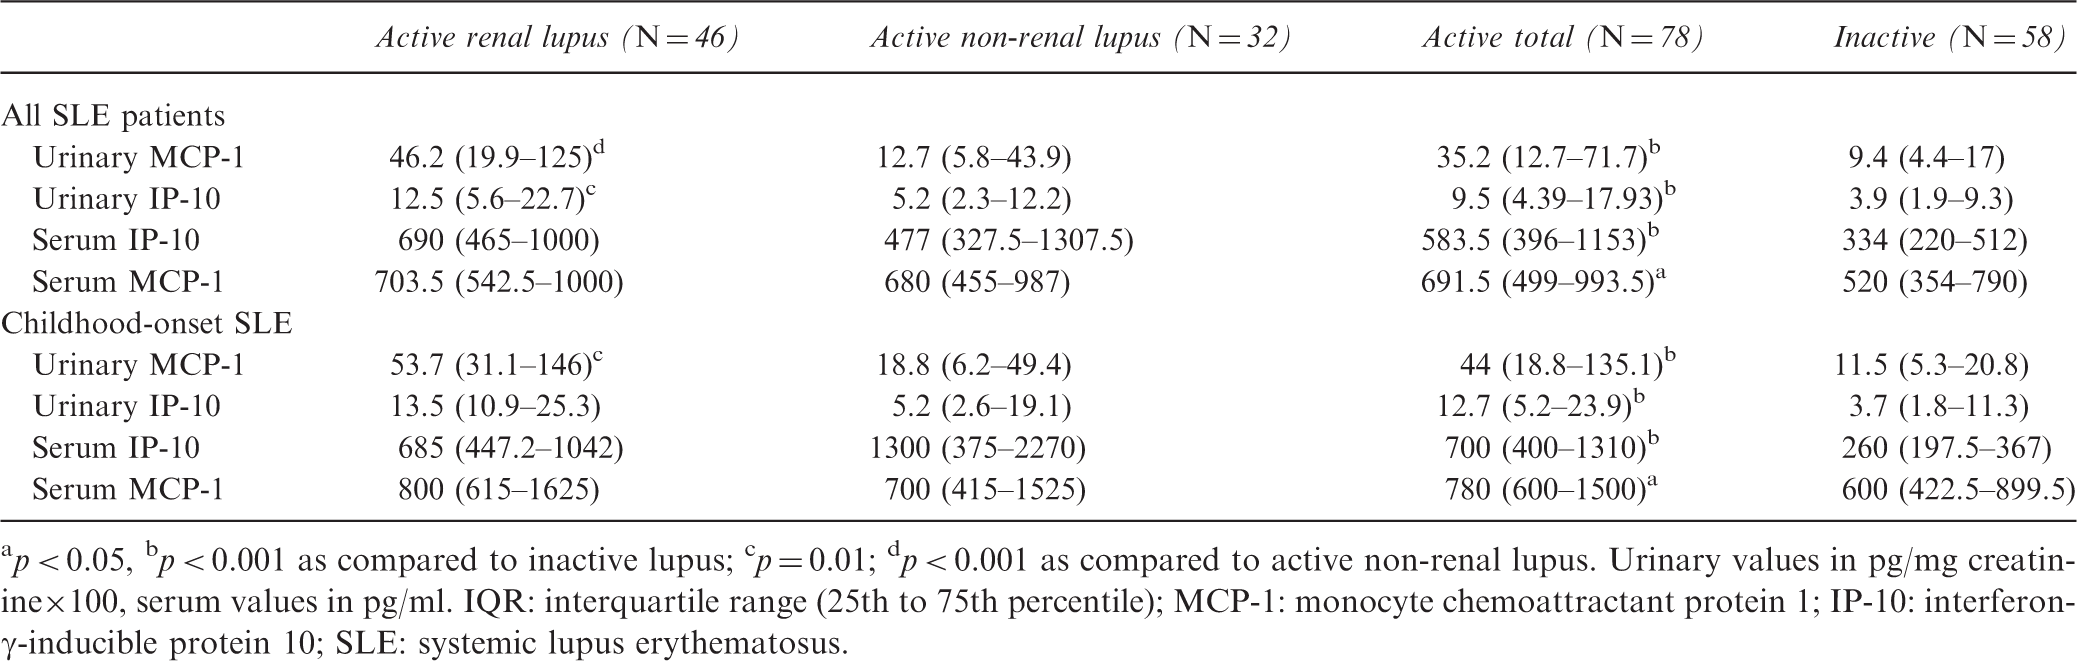
A total of 136 patients with SLE including 78 active (46 active renal and 32 active non-renal) were included. Median age was 25 (10–55) years and SLE duration was 23 (six to 48) months. Both serum (data not shown) and urinary levels of MCP-1 (35.2 (12.7–71.7), 9.4 (4.4–17), p < 0.001) and IP-10 (9.5 (4.4–17.9), 3.9 (1.9–9.3), p < 0.001) were higher in active compared to inactive SLE. However, in active renal compared to active non-renal SLE, there was no difference in serum levels; only urinary levels of MCP-1 (46.2 (19.9–125), 12.7 (5.8–43.9), p < 0.001) and IP-10 (12.5 (5.6–22.7), 5.2 (2.3–12.2), p < 0.05) were higher. On longitudinal follow-up of active renal patients (n = 24), there was a decrease in urinary levels of MCP-1 and IP-10 (p = 0.005). On ROC analysis, urinary MCP-1 outperformed C4 and urinary IP-10, but was similar to dsDNA and C3 in differentiating active renal from non-renal SLE.
Conclusions
Urinary and serum IP-10 and MCP-1 are potentially useful markers of lupus activity; however, only the urinary levels are indicative of renal activity. However, on ROC analysis, they are not better than conventional markers.
Introduction
Lupus nephritis (LN) is one of the hallmark features of systemic lupus erythematosus (SLE), seen in 40%–60% of patients. 1 It is an important cause of morbidity and mortality. Despite an expanding armamentarium of immunosuppressive and biological agents, outcome of nephritis has plateaued. 2 End-stage renal disease (ESRD) still occurs in 10%–15% of nephritis patients in five to 10 years. The five-year survival of patients with nephritis has improved and is now around 95%. 3
One approach to improve outcome is to diagnose patients early. Late diagnosis of LN correlates with a higher frequency of renal insufficiency and ESRD, underlining the importance of early diagnosis.4,5 While kidney biopsy is a valuable tool, it is an invasive procedure that is not always feasible and cannot be performed repeatedly. Moreover, it may not be representative, as only a limited number of glomeruli are sampled. A non-invasive, easily obtainable and accurate marker that can be followed serially may therefore be helpful in monitoring these patients. Urinary biomarkers like chemokines interferon (IFN)-γ-inducible protein 10 (IP-10) and monocyte chemoattractant protein 1 (MCP-1) may be contributory.6–10
MCP-1, or chemokine ligand 2 (CCL2), belongs to the CC chemokine family. It is secreted by glomerular, endothelial, mesangial and tubular epithelial cells in response to inflammatory signals. It plays a role in recruitment of monocytes and lymphocytes, enhancing endothelial and leucocyte adhesiveness and endothelial permeability in kidneys of murine LN models. 11 Genetic depletion or blockade of MCP-1 abrogates glomerular and interstitial inflammation and hence renal damage in murine models of LN.12,13 Increased expression of MCP-1 has been demonstrated by immunohistochemical staining and by in situ hybridization on endothelial cells, renal epithelial cells and infiltrating mononuclear cells in the tubulointerstitial regions in human LN. 14 IFN-γ-inducible protein 10 (IP-10), also known as CXCL10 (chemokine (C-X-C motif) ligand 10), is a chemokine secreted by IFN-γ-stimulated endothelial cells, fibroblasts and monocytes. IP-10 promotes migration of T cells to sites of inflammation and is also known to play a role in the down-regulation of angiogenesis, together with its receptor, CXC receptor 3 (CXCR3). 15 Studies have demonstrated up-regulation of IP-10 mRNA expression in inflamed lungs of MRL/lpr lupus mice with simultaneous increase in levels of CXCR3 in CD4+ T cells, macrophages and double-negative T cells migrating to the lungs.16,17 As there are limited data on levels of urinary IP-10 in SLE patients and particularly in those with nephritis,18,19 we investigated the role of these two promising biomarkers by determining their protein levels in the serum and urine of SLE patients.
Methods
This study included patients with SLE (fulfilling American College of Rheumatology (ACR) 1997 criteria) 20 recruited from the outpatient and inpatient services of a university hospital from January 2010 to May 2011. Childhood-onset and adult SLE patients were recruited. Age- and gender-matched healthy controls were also recruited. The institutional ethics committee approved the study and subjects’ written consent (or legal guardians in case of young children) was obtained according to the Declaration of Helsinki.
Study design
In all patients the Safety of Estrogen in Lupus Erythematosus National Assessment and SLE disease activity index (SELENA- SLEDAI) 21 and renal SLEDAI (sum of four urinary activity components) 22 was calculated. Patients were divided into active and inactive lupus based on SLEDAI ≥4 or <4, respectively. Active patients were further divided into active renal (proteinuria ≥500 mg/day or active sediment in urine) and active non-renal lupus. Active sediments were defined as presence of haematuria (>five red blood cells/high power field (HPF)), pyuria (>five white blood cells (WBCs)/HPF) or casts (heme, granular, or red blood cell (RBCs). Kidney biopsy was performed subsequently in some of the patients by their treating physicians. The general indication for a kidney biopsy in our unit is proteinuria ≥1 gram/day in isolation or proteinuria ≥500 mg/day in presence of active sediments or unexplained renal failure. Patients with any evidence of ongoing infection were excluded. The levels of serum and urinary MCP-1 and IP-10 were compared between the groups. A separate analysis for the childhood-onset subgroup (onset of SLE less than 18 years of age) was performed. In the second part of the study, a subset of patients with active renal lupus were followed until the nephritis became inactive (proteinuria ≤500 mg in 24 hours, WBCs and RBCs ≤5/HPF and no casts) when a second sample was collected.
Sample collection and testing
In each patient and control, a freshly voided urine specimen and blood sample were collected and transported to the lab within two hours. Serum was separated and urine was centrifuged. Both serum and cell-free urine were stored at −80℃. A complete haemogram, chemistry, urinalysis, spot urine analysis (protein and creatinine) and serological tests (double-stranded (ds)DNA, C3 and C4) were performed on every patient. MCP-1 and IP-10 levels in stored serum and urine were determined by sandwich enzyme-linked immunosorbent assay (ELISA) (Opt EIA Systems, BD Biosciences, San Diego, CA, USA) according to the manufacturer's instructions. In brief, the microtiter plate was pre-coated with the capture antibody overnight, followed by blocking using 10% fetal bovine serum. Later after washing, the plate was incubated with diluted plasma and urine for two hours at room temperature. These were washed and peroxidase-conjugated detection antibody was added. After two hours of incubation, substrate was added and subsequently stopped after 30 minutes and read at 450 nm. A standard curve was generated. Values were expressed as pg/ml. Absolute urinary values were normalized to spot urinary creatinine concentration mg/dL. Thus the value is expressed as pg/mg creatinine × 100.
Statistical analysis
Values are represented as median and interquartile ranges (IQRs) as the data were not normally distributed. Mann Whitney U test was used to compare median levels between two groups and the Kruskal-Wallis test was utilized for comparing three or more groups. Paired t test was used to compare longitudinal values of active renal patients. Correlations were performed using the Spearman rank correlation coefficient. Receiver operating characteristic (ROC) analysis and difference between area under the curve (AUC) was performed by MedCalc, version 12:1:4.
Results
Demographic and clinical characteristics of the patient subgroups
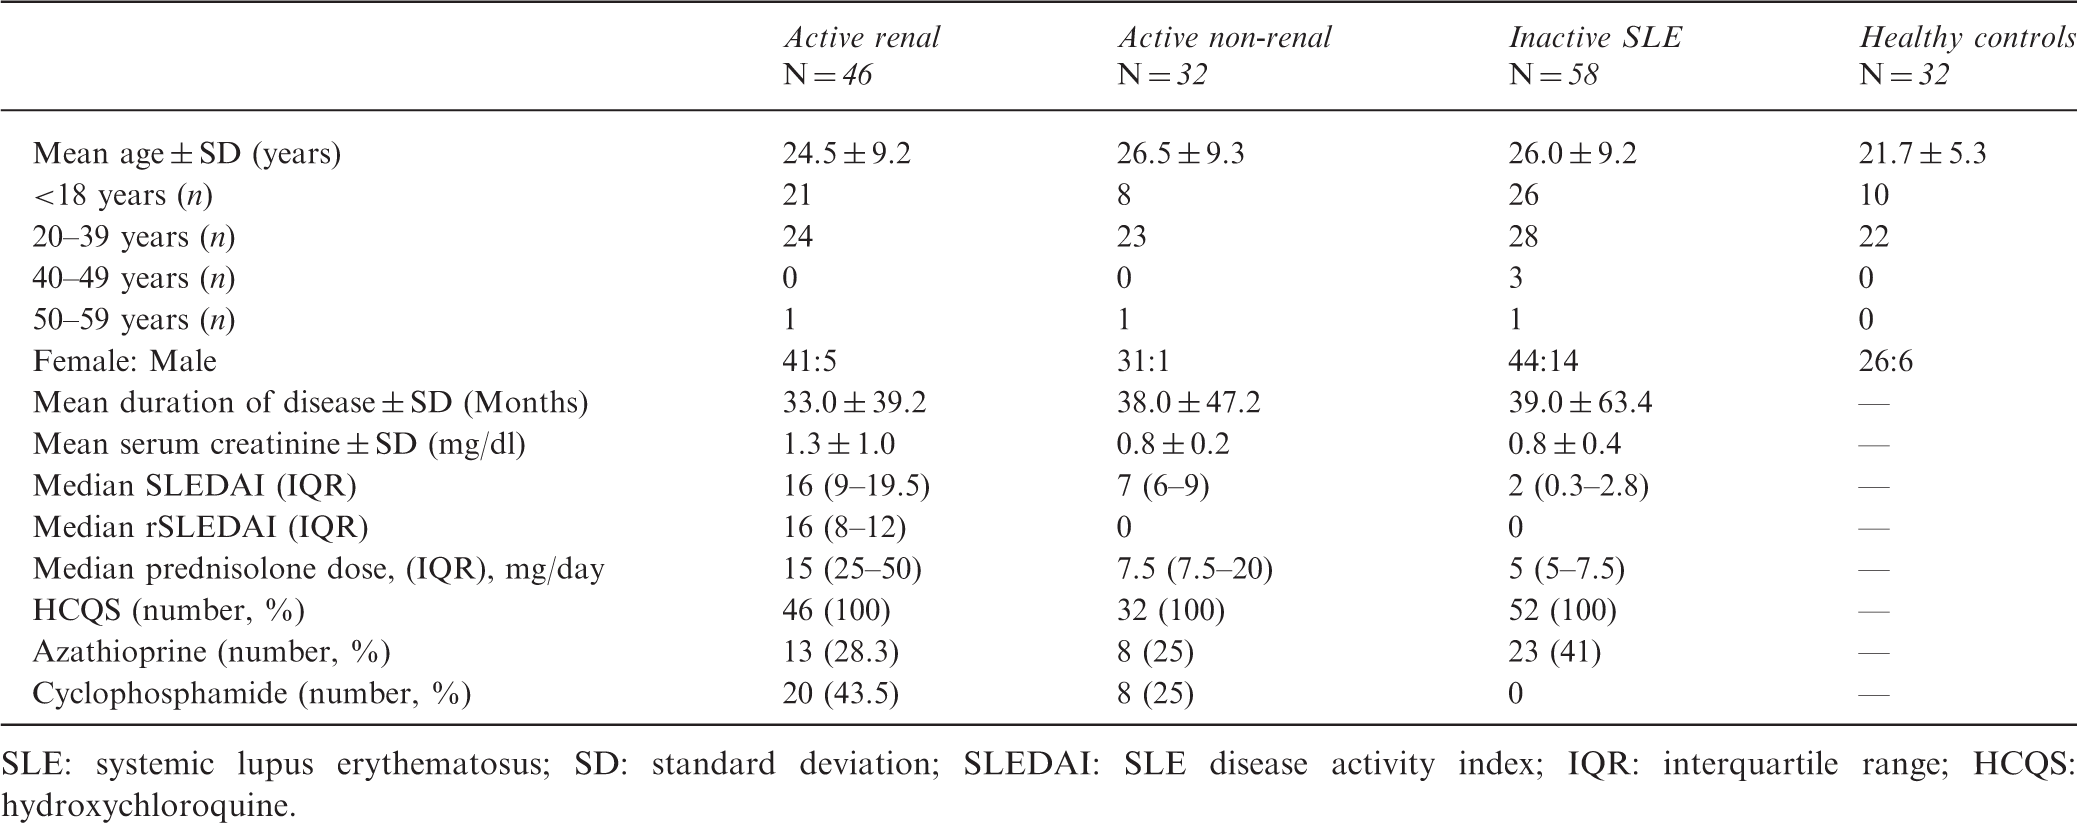
SLE: systemic lupus erythematosus; SD: standard deviation; SLEDAI: SLE disease activity index; IQR: interquartile range; HCQS: hydroxychloroquine.
Urinary MCP-1 and IP-10
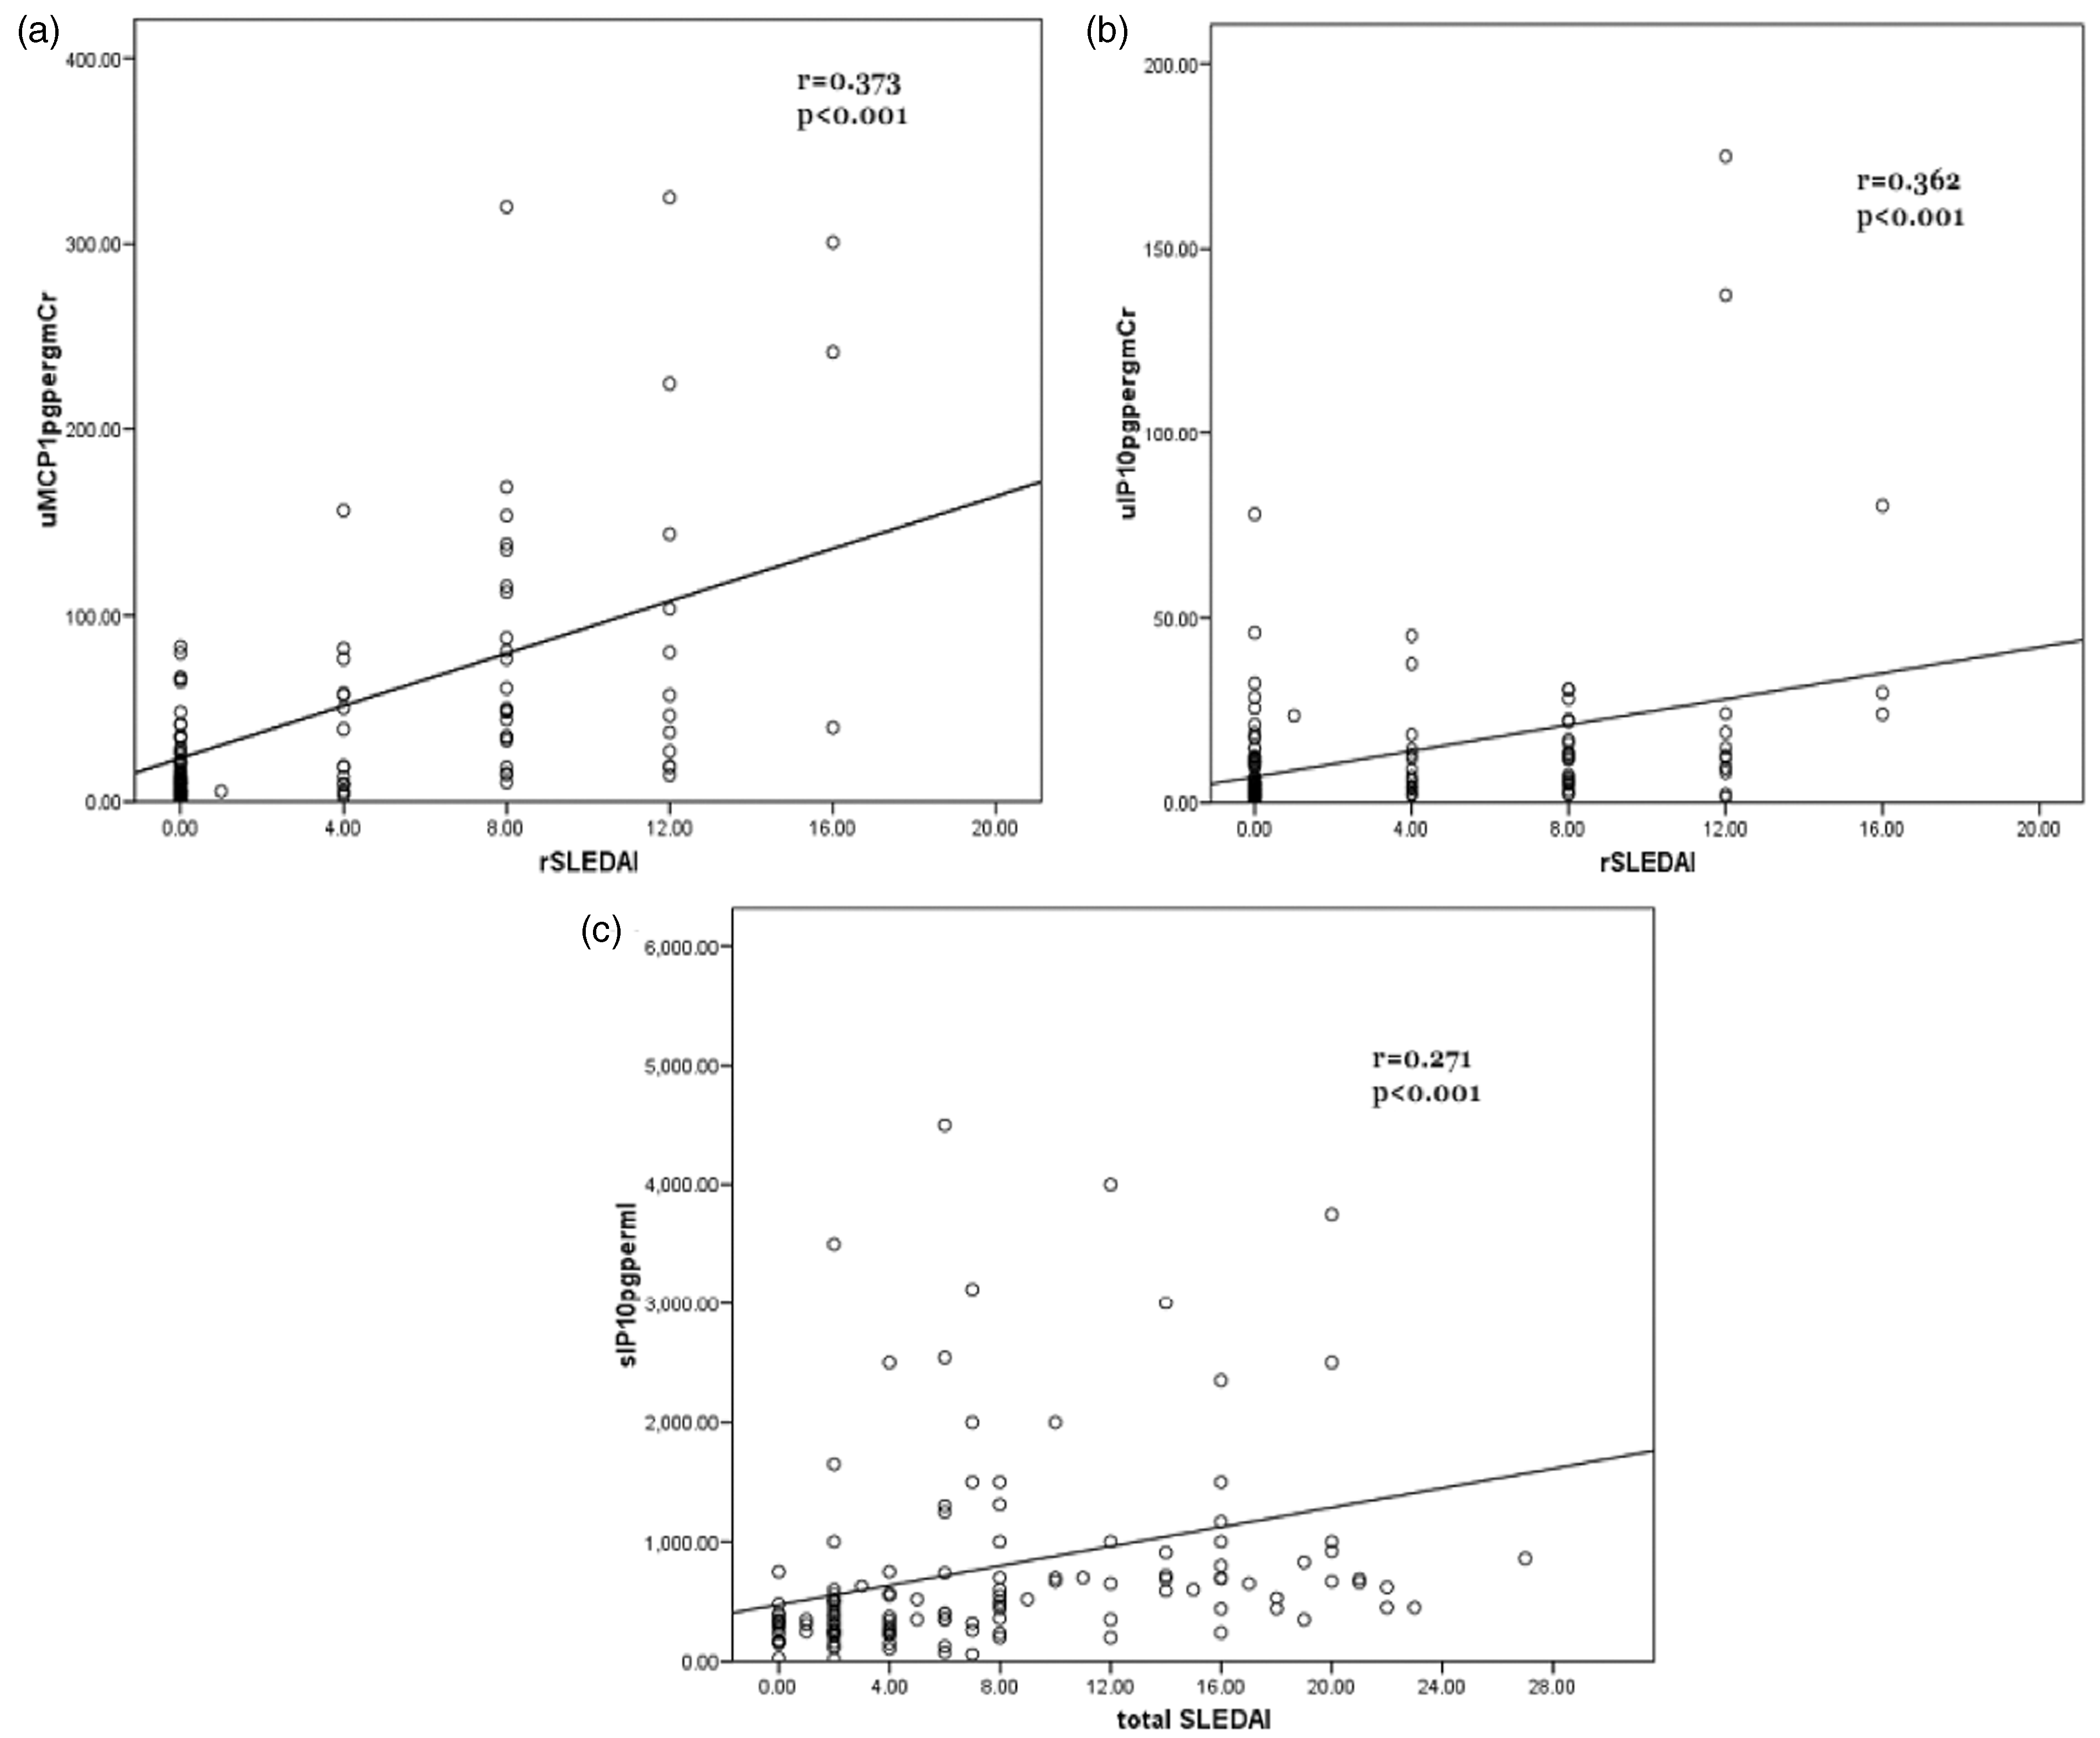
Active SLE patients had significantly increased urinary MCP-1 and IP-10 levels as compared to inactive patients and healthy controls (p < 0.001; Figure 1(c) and (d)). Among patients with active SLE, those with renal activity had significantly higher levels than non-renal patients (p < 0.001; Table 2). Even in the biopsy-proven proliferative nephritis patients (class III and IV), urinary MCP-1 and IP-10 were higher compared to inactive and active non-renal patients (p = 0.003, 0.023). There was a better correlation of urinary MCP-1 and IP-10 with rSLEDAI (r = 0.373, p < 0.001; r = 0.362, p < 0.001, Figure 2(a) and (b)) as compared to total SLEDAI (r = 0.283, p = 0.001; r = 0.191, p < 0.05). Urinary levels were not different between inactive patients and healthy controls.
Boxplot showing levels of chemokines in lupus patients (active and inactive) and healthy controls (a) Serum MCP-1, (b) Serum IP-10, (c) Urinary MCP-1, (d) Urinary IP-10. Scatter plot showing correlation between (a) renal SLEDAI and urinary macrophage chemoattractantprotein-1 (MCP-1), (b) renal SLEDAI and urinary interferon-inducible protein 10 (IP-10) levels, and (c) total SLEDAI and serum IP-10 levels. SLEDAI: systemic lupus erythematosus disease activity index. Median (±IQR) urinary and serum MCP-1and IP-10 levels in patient subgroups and separately in childhood-onset lupus p < 0.05, bp < 0.001 as compared to inactive lupus; cp = 0.01; dp < 0.001 as compared to active non-renal lupus. Urinary values in pg/mg creatinine×100, serum values in pg/ml. IQR: interquartile range (25th to 75th percentile); MCP-1: monocyte chemoattractant protein 1; IP-10: interferon-γ-inducible protein 10; SLE: systemic lupus erythematosus.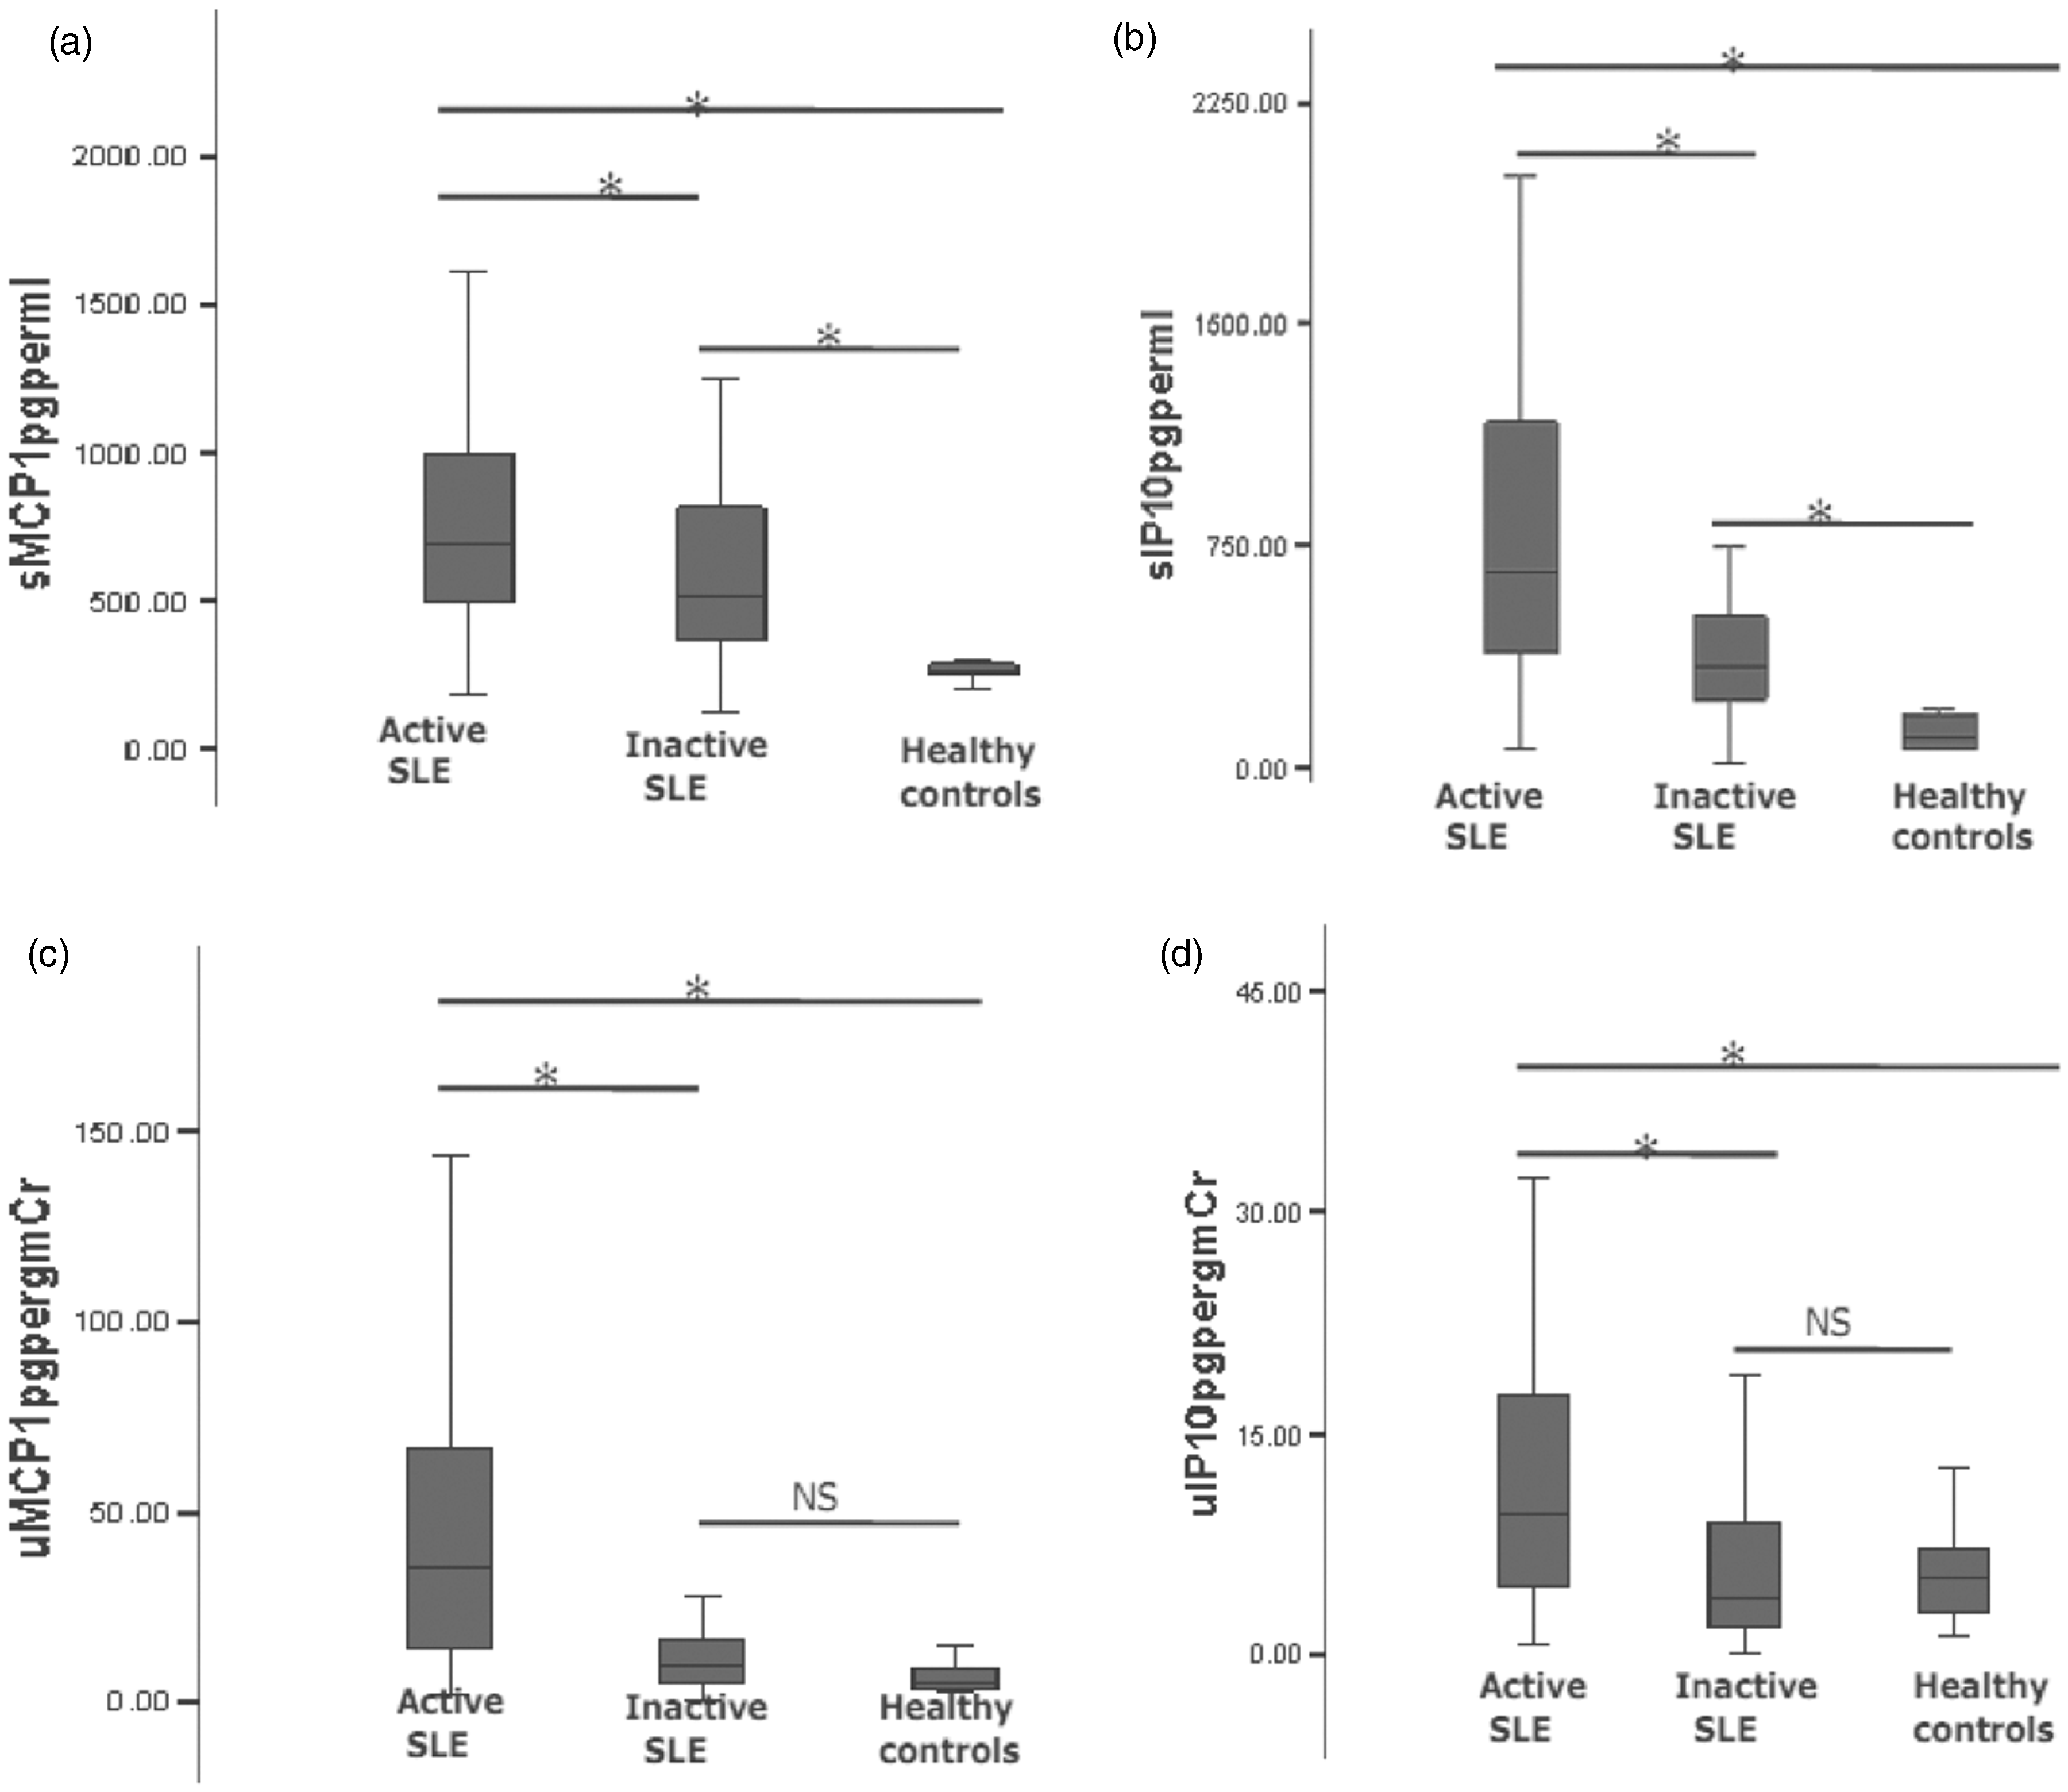
Serum MCP-1 and IP-10 levels
Serum levels of MCP-1 and IP-10 were higher in active as compared to inactive patients and healthy controls (p < 0.001; Figure 1(a) and (b), Table 2); however, there were no differences in serum levels between active renal and non-renal patients (Table 2).Whereas serum MCP-1 levels did not correlate with SLEDAI, serum IP-10 levels correlated significantly with the SLEDAI (r = 0.275, p = 0.001, Figure 2(c)).
Longitudinal follow-up
In the longitudinal study, 24 active renal SLE patients were followed until they became inactive and resampled. The median duration of follow-up was four months (IQR three to 12). The level of serum and urinary MCP-1 and IP-10 decreased significantly with therapy (p < 0.001) (Figure 3). However, there was no direct correlation between change in SLEDAI and change in their levels.
Boxplot showing follow-up measurements of serum macrophage chemoattractantprotein-1 (MCP-1) and serum interferon-inducible protein 10 (IP-10) (a) and urinary MCP-1and urinary IP-10 (b) levels of active renal patients.*represents p < 0.001.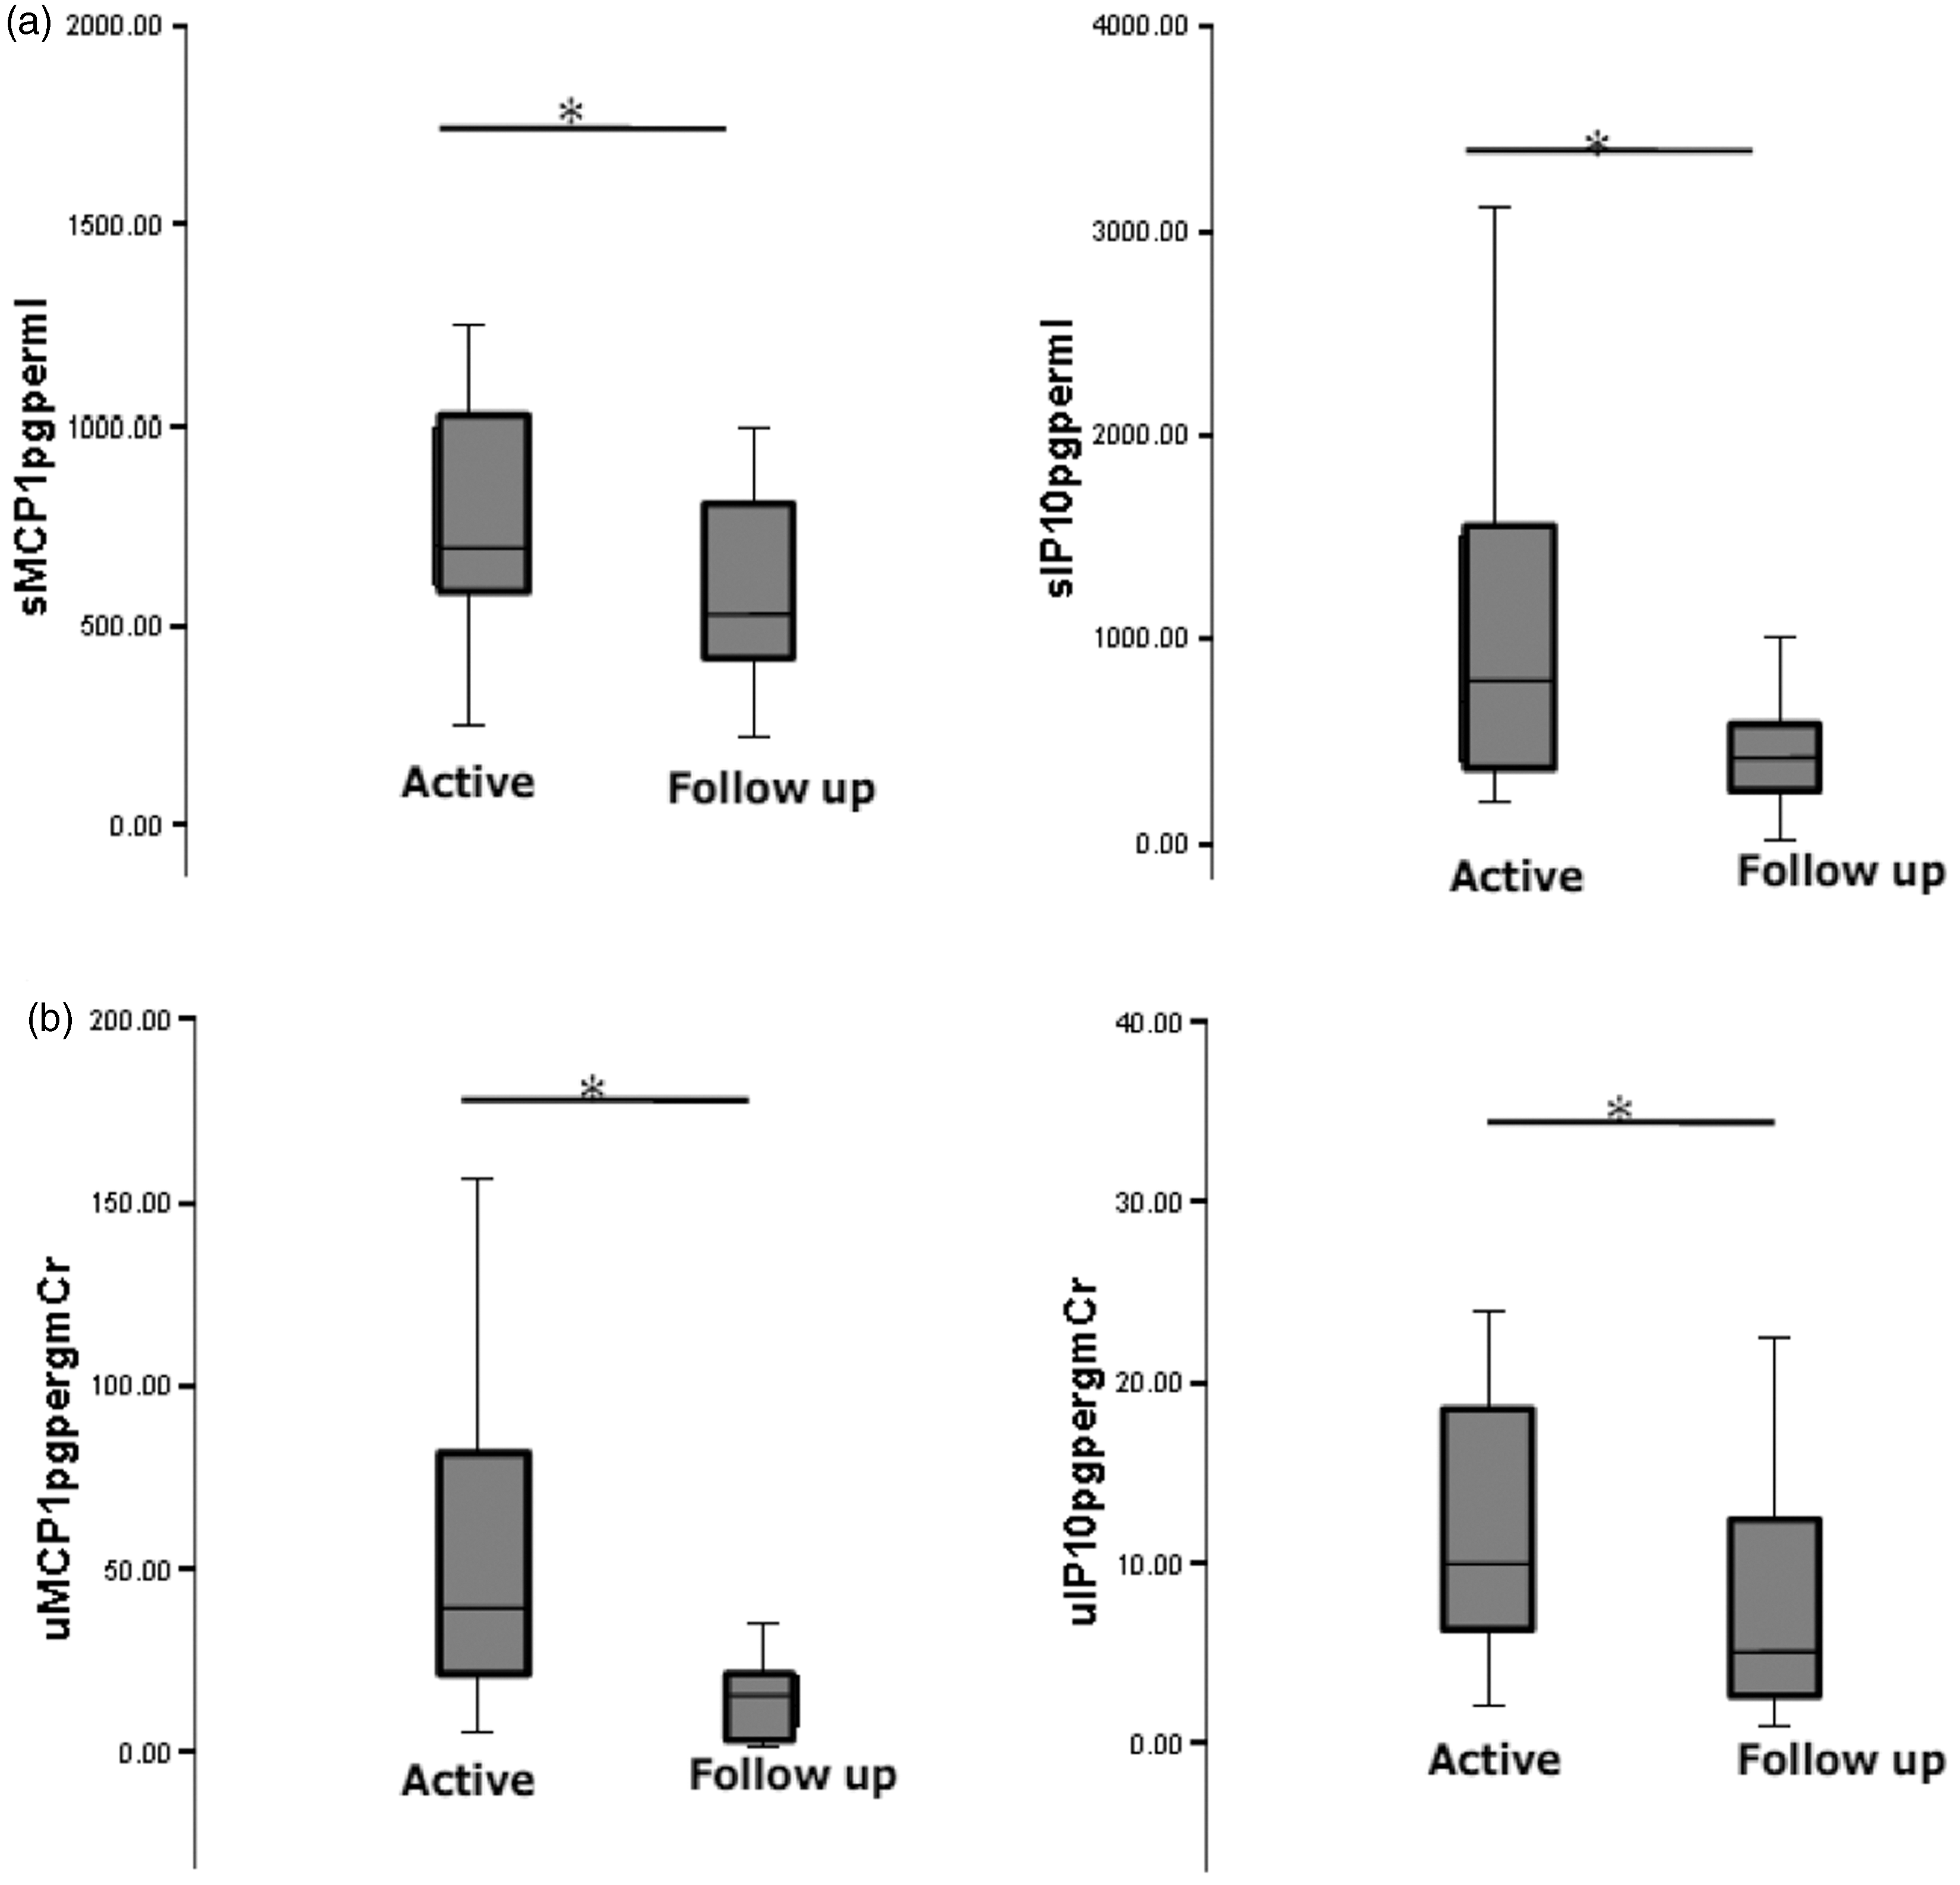
ROC analysis
Serum IP-10 was a better test than serum MCP-1 (p = 0.03) (AUC (95% confidence interval (CI)) = 0.77 (0.68–0.84), 0.63 (0.54–0.71), p = 0.03) in differentiating active from inactive lupus. However, it was not better than the conventional markers: C3, C4 and dsDNA (AUC (95% CI) = 0.76 (0.68–0.84), 0.77 (0.69–0.84), 0.80 (0.73–0.87), p = not significant (ns)) in this regard (Figure 4). On the other hand, urinary MCP-1 performed better than urinary IP-10 (0.78 (0.67–0.87), 0.68 (0.55–0.78), p = 0.03) and C4 (0.61 (0.49–0.72), p = 0.04). However, it was no better than C3 or dsDNA (0.72 (0.60–0.82), 0.76 (0.65–0.86), p = ns) (Figure 4). A value of urinary MCP-1>14.2 pg/mg Cr performed the best for differentiating active renal from active non-renal lupus, with a sensitivity of 93.3%, specificity of 53.1%, positive predictive value of 74.1% and negative predictive value of 85%, respectively. In comparison, proteinuria (>500 mg/day) had a sensitivity of 89.1%, specificity of 53.1%, positive predictive value of 73.2% and negative predictive value of 77.2%.
ROC curves comparing the ability of different markers to differentiate active from inactive and active renal from non-renal SLE.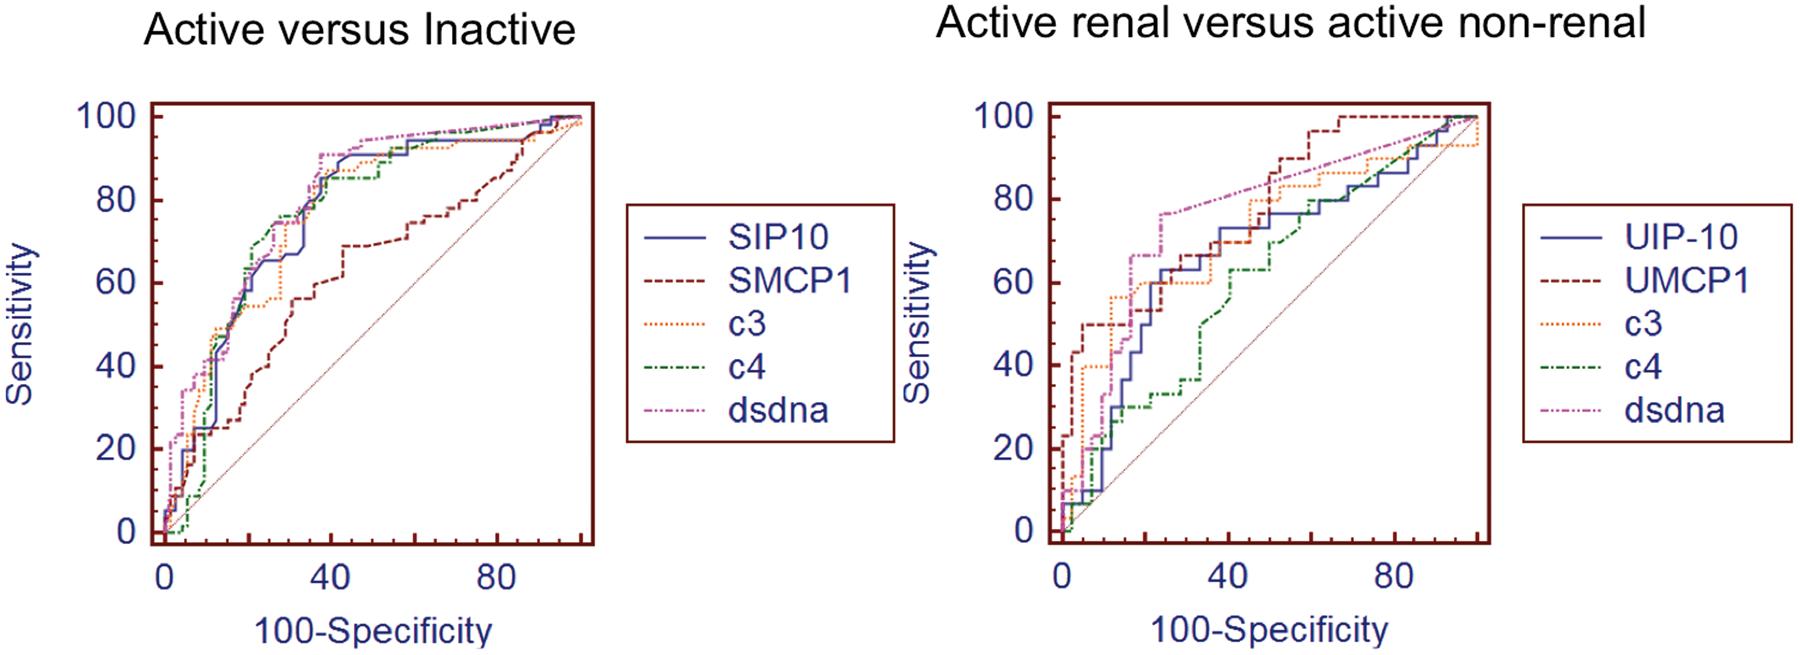
Childhood-onset SLE
We also conducted a subgroup analysis of childhood onset lupus. Of the 61 childhood-onset lupus patients, 35 had active lupus (26 renal, nine non-renal) and 26 had inactive lupus. Levels of both MCP-1 and IP-10 in serum and urine of active lupus patients were significantly higher as compared to the levels of those with inactive childhood-onset lupus. Comparison of active renal and active non-renal lupus yielded a significant difference only for urinary MCP-1 (p = 0.01), which was elevated in active renal lupus (Table 2). Whereas only serum IP-10 levels showed significant correlation with overall SLEDAI (r = 0.270, p < 0.05), both the urinary levels correlated very well with rSLEDAI (MCP-1: r = 0.338, p = 0.001; IP-10: r = 0.412, p = 0.001).
Discussion
This study found higher levels of serum and urinary IP-10 and MCP-1 in active compared to inactive SLE patients and healthy controls. Among those with active SLE, patients with nephritis had higher levels of urinary but not serum IP-10 and MCP-1 than those without renal involvement.
This is the first study that found higher urinary protein levels of IP-10 in active lupus patients with renal involvement as compared to those who were active but without renal involvement. IP-10/CXCL10 predominantly attracts T cells of Th1 specificity, which carry the corresponding receptor CXCR3 on their surface. In renal biopsies with proliferative glomerulonephritis, a high expression of CXCL10/IP-10 is found in glomeruli and in cells infiltrating the interstitium. 23 Further, in a rat model of renal endothelial microvascular injury, it has been demonstrated that treatment with a neutralizing anti-IP-10/CXCL10 antibody significantly reduced the number of infiltrating tubulointerstitial T cells without affecting monocyte migration and led to improved renal function. 24 Subsequently, a study by Avihingsanon et al. looked at urinary mRNA levels of IP-10 in 24 LN patients and found increased levels in class IV nephritis when compared to other classes. 25 However, a recent paper did not find a significant difference in juvenile SLE patients with active renal compared to inactive renal disease. 26
Our data of increased serum IP-10 in SLE patients versus controls and in patients of active SLE as compared to inactive SLE are similar to those reported earlier.27–29 A previous study found active SLE patients to have increased levels of serum IP-10 compared to non-active SLE patients, rheumatoid arthritis (RA) patients and healthy controls. 27 Another study showed that plasma concentrations of IP-10 were higher in SLE patients than in healthy individuals. 28 Further, peripheral blood mononuclear cells (PBMCs) from SLE patients were shown to produce higher amounts of IP-10 in patients with active LN as compared to healthy controls. 29 Increased expression of IP-10 has been found in the basal layers of the epidermis and also in infiltrating leucocyte subsets clustered in perivascular sites in cutaneous lesions of SLE. 30 Thus, in patients with active lupus, there seems to be increased production of the CXCL10 chemokine at the disease site, which may contribute to disease pathogenesis and increased serum levels.
Besides IP-10/CXCL10, the other most up-regulated chemokine in kidneys of nephritic MRl/lpr mice is MCP-1/CCL2.31,32 MCP-1/CCL2 attracts cells that bear the corresponding receptor CCR2, which is found mainly on monocytes/macrophages. High expression of the MCP-1 gene in glomerulus has been associated with activity index, whereas high expression in the tubulointersitium has been associated with chronicity index. 11 High expression of MCP-1 in lupus kidneys is associated with monocyte infiltration, tubulointerstitial inflammation and worse prognosis. 33 In animal models, up-regulation of MCP-1 has been shown to correlate temporally with recruitment and activation of inflammatory cells. 32 MCP-1 antagonists and anti-MCP-1 gene therapy have been shown to halt the initiation and progression of disease in animal models.12,13 MCP-1 enhances renal disease in experimental glomerulonephritis while its increased urinary levels reflect the severity of kidney disease in humans. 34 Apart from SLE nephritis, even in other renal inflammatory diseases like anti-neutrophil cytoplasmic autoantibody (ANCA) vasculitis and crescentic glomerulonephritis, increased glomerular and interstitial expression of MCP-1 have been demonstrated.35,36 There are several cross-sectional studies in human SLE that have demonstrated that urinary MCP-1 levels are elevated in patients with active LN as compared to those with inactive renal disease or healthy controls.26,37–41 In our study, urinary level of MCP-1 positively correlated with rSLEDAI (p < 0.001) and other descriptors of rSLEDAI. An early study by Noris et al. showed that high doses of intravenous (i.v.) methylprednisolone significantly lowered urinary MCP-1 in patients with active LN whose urinary MCP1 levels were significantly higher than patients in the inactive phase of the disease or in healthy volunteers. 42
Our findings of increased serum MCP-1 are supported by previous studies on active SLE patients. 27 In a previous study on 67 lupus patients, chemokine scores created by measuring chemokine serum levels based on IFN-inducible chemokines (regulated on activation, normal T cell expressed and secreted (RANTES), CXCL-11, IP-10, monokine induced by IFN-gamma (MIG), C-C chemokine ligand-19 (CCL-19), MCP-1 and interleukin (IL)-8) were found to correlate with disease activity and also showed a decrease with improvement in disease activity score. In addition, the ex vivo production of chemokines by peripheral blood cells from SLE patients appears to be significantly higher than that of cells from normal control individuals, after stimulation by lipopolysaccharide or phytohaemagglutinin. 28 Therefore, these findings indicate that the immune dysregulation seen in SLE is to some extent contributed by the increased chemokine levels.
On follow-up, patients with active renal lupus showed a decline in serum and urinary MCP-1 and IP-10. A two-year follow-up study found that a rise in urinary MCP-1 levels correlated with flares. 43 Further, Rovin et al. have shown that the mean urinary MCP-1 level at the time of renal flares was significantly higher than that of healthy controls, inactive patients and active non-renal SLE patients. In addition, urinary MCP-1 was also found to be a sensitive indicator for renal flare, with 73% of the flare values above the 95th percentile of disease controls. They also observed that urinary MCP-1 levels were higher in patients with proliferative (World Health Organization (WHO) class III or IV) than membranous (class V) nephritis, suggesting urinary MCP-1 levels vary depending on the class of renal involvement. 38
The childhood-onset group also showed similar results, except only urinary MCP-1 could differentiate active renal from active non-renal SLE. However, if we look at the point estimates, the association between IP-10 and renal activity comes across as very strong, but because of the small sample size of this subgroup, it is not statistically significant. Monitoring by using urinary chemokine levels may help assess the activity of LN, thus obviating the need for repeated blood samples and kidney biopsy, especially in children with lupus.
A reliable biomarker predictive of disease activity, histological and prognostic stratification, and treatment response is the need of the hour in LN. Apart from other MCP-1 and IP-10, other potential urinary biomarkers that have been demonstrated in various cross-sectional and a few longitudinal studies to reflect a relationship between LN and disease activity include tumour necrosis factor-like weak inducer of apoptosis (TWEAK), neutrophil gelatinase-associated lipocalin (NGAL), IL-6, vascular cell adhesion molecule-1 and CXCL16.44–47 Further studies need to be conducted to look at these novel biomarkers in combination. More recently, a study found differential increases in levels of urinary biomarkers forming a pattern reflective of specific histologic features seen in active LN. 48 All these studies suggest that these biomarkers may be part of a panel that in combination may eventually be able to predict histology and in some cases avoid biopsy.
The strengths of our study are the large sample size with inclusion of active as well as inactive patients and a significant representation of childhood-onset lupus patients with estimation of both serum and urinary levels. In addition, our study has defined renal activity as per urinary findings and not on the basis of biopsy, as this would reflect the overall LN group as seen in clinic. Limitations include the possibility of confounding by medication, predominantly higher doses of prednisolone in the active patients, a higher SLEDAI in the renal active patients than the non-renal active patients, fewer number of patients followed longitudinally and absence of kidney biopsy for one-third of the active renal patients and none of the renal inactive patients. In addition, we did not correlate the levels with the activity or chronicity indices. We have longitudinally followed patients from renal active to renal inactive, not the opposite, and did not follow those who did not respond, which will be more clinically relevant in a true test of a biomarker to predict flares before clinically obvious renal flare.
Thus, our study provides evidence that the chemokines MCP-1 and IP-10 are potentially useful biomarkers in SLE, with serum level reflecting overall disease activity and urinary level reflecting renal activity. In conclusion, longitudinal studies of urinary MCP-1 and IP-10 in future can assist in defining their role in prediction of flares and may potentially be used to dictate treatment or change management.
Footnotes
Funding
The study was partly funded by a grant from Department of Biotechnology, Government of India to AA. SSC was supported by a senior research fellowship of Council of Scientific and Industrial research, Government of India.
Conflict of interest
None declared.