
Abstract
Systemic lupus erythematosus (SLE) is a chronic autoimmune disease that involves different organs. Its most important feature is the production of specific autoantibodies against nuclear or cytoplasmic antigens. Proteomic analysis of serum, as one of the most readily available body fluids, can be used as a method for clarifying the pathogenesis of SLE. In this study the serum proteome of 13 patients with SLE was evaluated and compared with seven healthy control participants. A specific kit was used to remove high-abundance proteins. After depletion, the protein expression patterns created by two-dimensional gel electrophoresis (2-DE) and MALDI-TOF/TOF-MS were used to identify disease-associated proteins. We found differential expression of 15 protein spots, including seven up-regulated and eight down-regulated proteins in SLE samples, in comparison with healthy participants. These spots were identified by MALDI-TOF/TOF-MS and classified into three groups include keratins, apolipoproteins and albumin, and individual proteins such as transthyretin, haptoglobin and prothrombin. These findings can help to clarify the pathophysiology and mechanism of SLE.
Introduction
There is a spectrum of human lupus ranging from solely skin involvement to systemic disease, the common denominator being tissue damage. 1 Systemic lupus erythematosus (SLE) is a chronic inflammatory autoimmune disease characterized by nuclear autoantibodies, immune complex formation, and systemic vasculitis. 2 The most involved organs in SLE include skin, joints, lungs, blood cells, kidneys, and the central and peripheral nervous systems. 3 Diagnosis of SLE is based on clinical signs with serological and histological evaluations. Antinuclear antibody (ANA) testing forms the mainstay in serological testing of SLE, but ANA screening yields positive results in many connective tissue disorders and other autoimmune diseases. 4 Recently, new methods such as gene polymorphism assay, DNA microarray and proteomic analysis have been used to clarify the pathophysiology of this systemic disorder.5–7 Affected organs in lupus that have been studied most intensively are the kidneys and the skin, but evaluation of these two organs cannot generate valuable biomarkers specifically for SLE.
Proteome analyses can be described as protein/peptide screening techniques aimed at documenting the overall distribution of proteins in biological samples. 8 Two-dimensional gel electrophoresis (2-DE) coupled with mass spectroscopy (MS) has recently used as a method for identifying proteins in different samples. In terms of disease diagnosis and prognosis, a human or animal body fluid such as blood, urine, or saliva, appears to be more attractive because their testing provides several key advantages including low invasiveness, minimum cost, and easy sample collection and processing. 9 Serum is attracting increasing interest in the field of proteomics, which is currently striving to broadly characterize its protein constituents. It is expected that the characterization of the thousands of individual serum proteins/peptides will enable the discovery of an increasing number of reliable disease biomarkers. 10 Here, we demonstrate serum proteomic changes in patients with SLE by using 2-DE and MALDI-TOF/TOF-MS to help clarify the unknown pathogenesis of SLE.
Patients and methods
Participants
All procedures received approval from the ethics committee of Zahedan University of Medical Sciences and all participants provided written informed consent. We enrolled 20 people, and the SLE to healthy ratio was approximately 2:1 (13 SLE patients and seven healthy people). Thirteen Iranian Caucasian patients with SLE, seven males and six females (mean ± SD age 35.15 ± 2.46 years), and seven healthy Iranian Caucasian control subjects, three males and four females (mean ± SD age 32.28 ± 1.68 years) were enrolled in this study. All patients were diagnosed as having SLE and had no prior history of other diseases or any medications, which may complicate the analysis, in the previous 2 months. Patients, regardless of gender, showed different signs of SLE in skin (84.6%), blood (46.1%), joints (100%), kidney (38.5%) and central nervous system (15.4%), and the involvement of at least two organs was seen in each patient.
Sera preparation and protein measurements
Fasting blood samples were taken from the cubital vein into sterile vacutainers without anticoagulant, and after centrifugation (2000 g, 10 min) the harvested serum was stored at −20℃ until used. The protein concentration of each serum sample was determined according to the method proposed by Bradford, using bovine serum albumin (BSA) as a standard protein 11 before and after removal of high-abundance proteins (HAPs).
Affi-gel Blue and protein A treatment
Serum samples were treated with a mixture of Affi-gel Blue and protein A (5:1) in the form of a spin column. This column selectively binds and removes albumin and immunoglobulin. 12 The spin columns were washed twice with 1 ml of binding buffer (BB), 20 mM phosphate buffer, pH 7.0, by centrifugation (20 s, 1000 g). Next, 60 μl of serum was added to 180 μl of BB and then loaded on the spin columns. Following incubation at room temperature for 1 h, columns were centrifuged (20 s, 1000 g) to collect the eluate. Finally, the columns were washed with 200 μl of the BB and combined with the first eluate to form the depleted serum sample. The total protein concentration of the combined eluate was determined by the Bradford method and stored at −20℃ until further analysis.
Two-dimensional electrophoresis
A volume of 25 μl of depleted serum was mixed with rehydration buffer (8 M urea, 100 mM Dithiothreitol (DTT), 4% 3-[(3-Cholamidopropyl)dimethylammonio]-1-propanesulfonate (CHAPS), 0.5% carrier ampholytes pH 4–7, 0.01% bromophenol blue (BPB) and 40 mM Tris) to a final volume of 180 μl and then incubated for 1 h at room temperature. This mixture was then applied to a Ready Strip (7 cm, pH 4–7, Bio-Rad Laboratories, USA) and passively rehydrated at 20℃ for 14 h. Serum proteins were isoelectrically focused in a five-step program: 50 V for 15 min, followed by a first linear 50–100 V gradient for 30 min and a second linear 100–150 V gradient for 15 min. This was then slowly ramped up to 4000 V for 120 min and then maintained at 4000 V for a total of 12,000 Vh per gel. The IPG Ready Strips were equilibrated in two steps for 15 min in equilibration buffer containing 6 M urea, 50 mM tris-HCl pH 8.8, 30% glycerol, 4% Sodium dodecyl sulfate (SDS), and 130 mM DTT. After that, they were equilibrated for 20 min in the same solution without DTT, but containing 135 mM iodoacetamide. Strips were rinsed in Tris-glycine SDS running buffer (25 mM Tris, 192 mM glycine, 0.1% SDS pH 8.8) and then applied to the top of 12% polyacrylamide gel. Low melting point agarose (0.5% in running buffer containing BPB) was layered on top of the gel for fixing of strips and to help clarify the migration front; molecular weight markers were run simultaneously. Electrophoresis was performed at 30 V for 45 min and then 150 V until the fronting dye reached the end of the gel.
Protein visualization and identification
Resolved proteins were detected by staining with silver nitrate, but omitting the glutaraldehyde fixation. 13 For each sample analyzed, 2-D gels were performed at least in triplicate, with independent protein preparations. 2-D gels were scanned and analyzed by Melanie software (GeneBio, Geneva, Switzerland, version 6.0.2.0). For MALDI-TOF/TOF-MS analysis, the protein spots of interest were excised from the gels manually and dried. One clean refrigerator (4 ℃) without any infected materials was used to dry the protein spots. No-one was not allowed to use the refrigerator until the all spots were dry. MALDI-TOF/TOF-MS analysis was performed by the Technology Facility of Proteomics & Analytical Biochemistry Laboratory, University of York, UK. Database interrogation was performed using the National Center for Biotechnology Information (NCBI) databases on a GPS workstation.
Statistical analysis
In order to highlight the serum proteome changes in patients with SLE, triplicate image analysis was performed for each serum sample and variations in percentage of volume and intensity were confirmed by statistical analysis. Values are expressed as the mean ± SD and differences between the healthy and disease sera and were determined by two independent sample t-test using SPSS statistical package (SPSS16, SPSS Ltd., Woking, Surrey, UK) for Windows. A p-value lower than 0.05 was considered statistically significant.
Results
Mean ± SD of serum protein concentration of subjects before and after high-abundance protein depletion
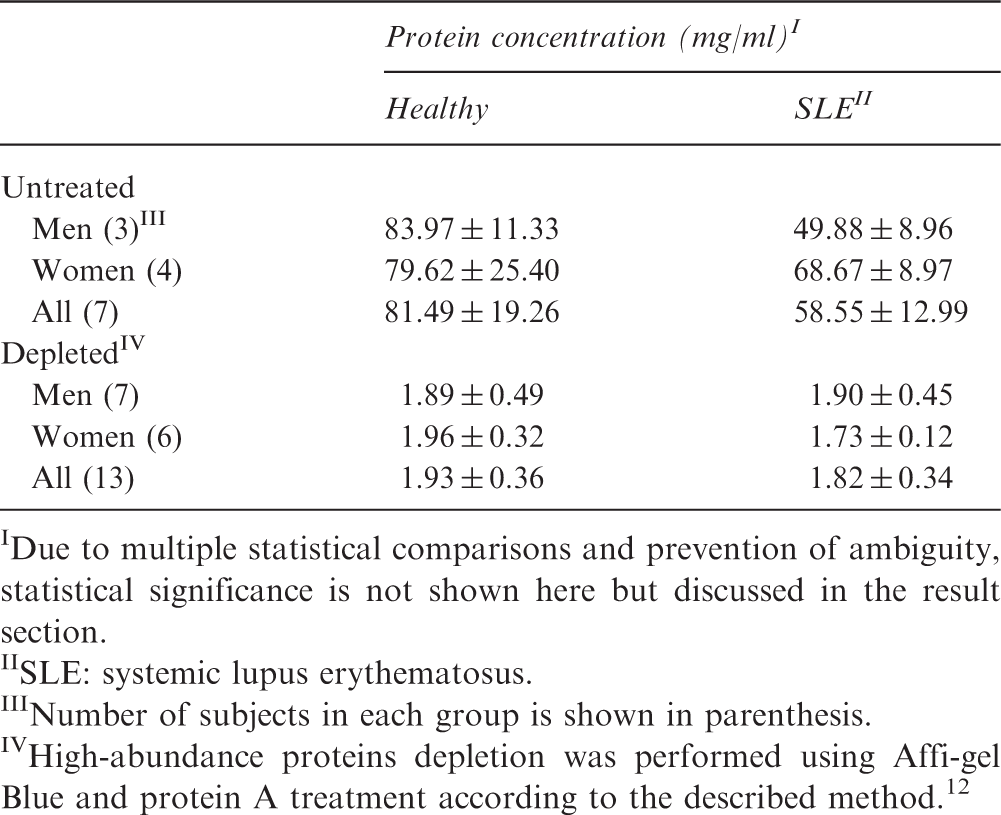
Due to multiple statistical comparisons and prevention of ambiguity, statistical significance is not shown here but discussed in the result section.
SLE: systemic lupus erythematosus.
Number of subjects in each group is shown in parenthesis.
High-abundance proteins depletion was performed using Affi-gel Blue and protein A treatment according to the described method. 12
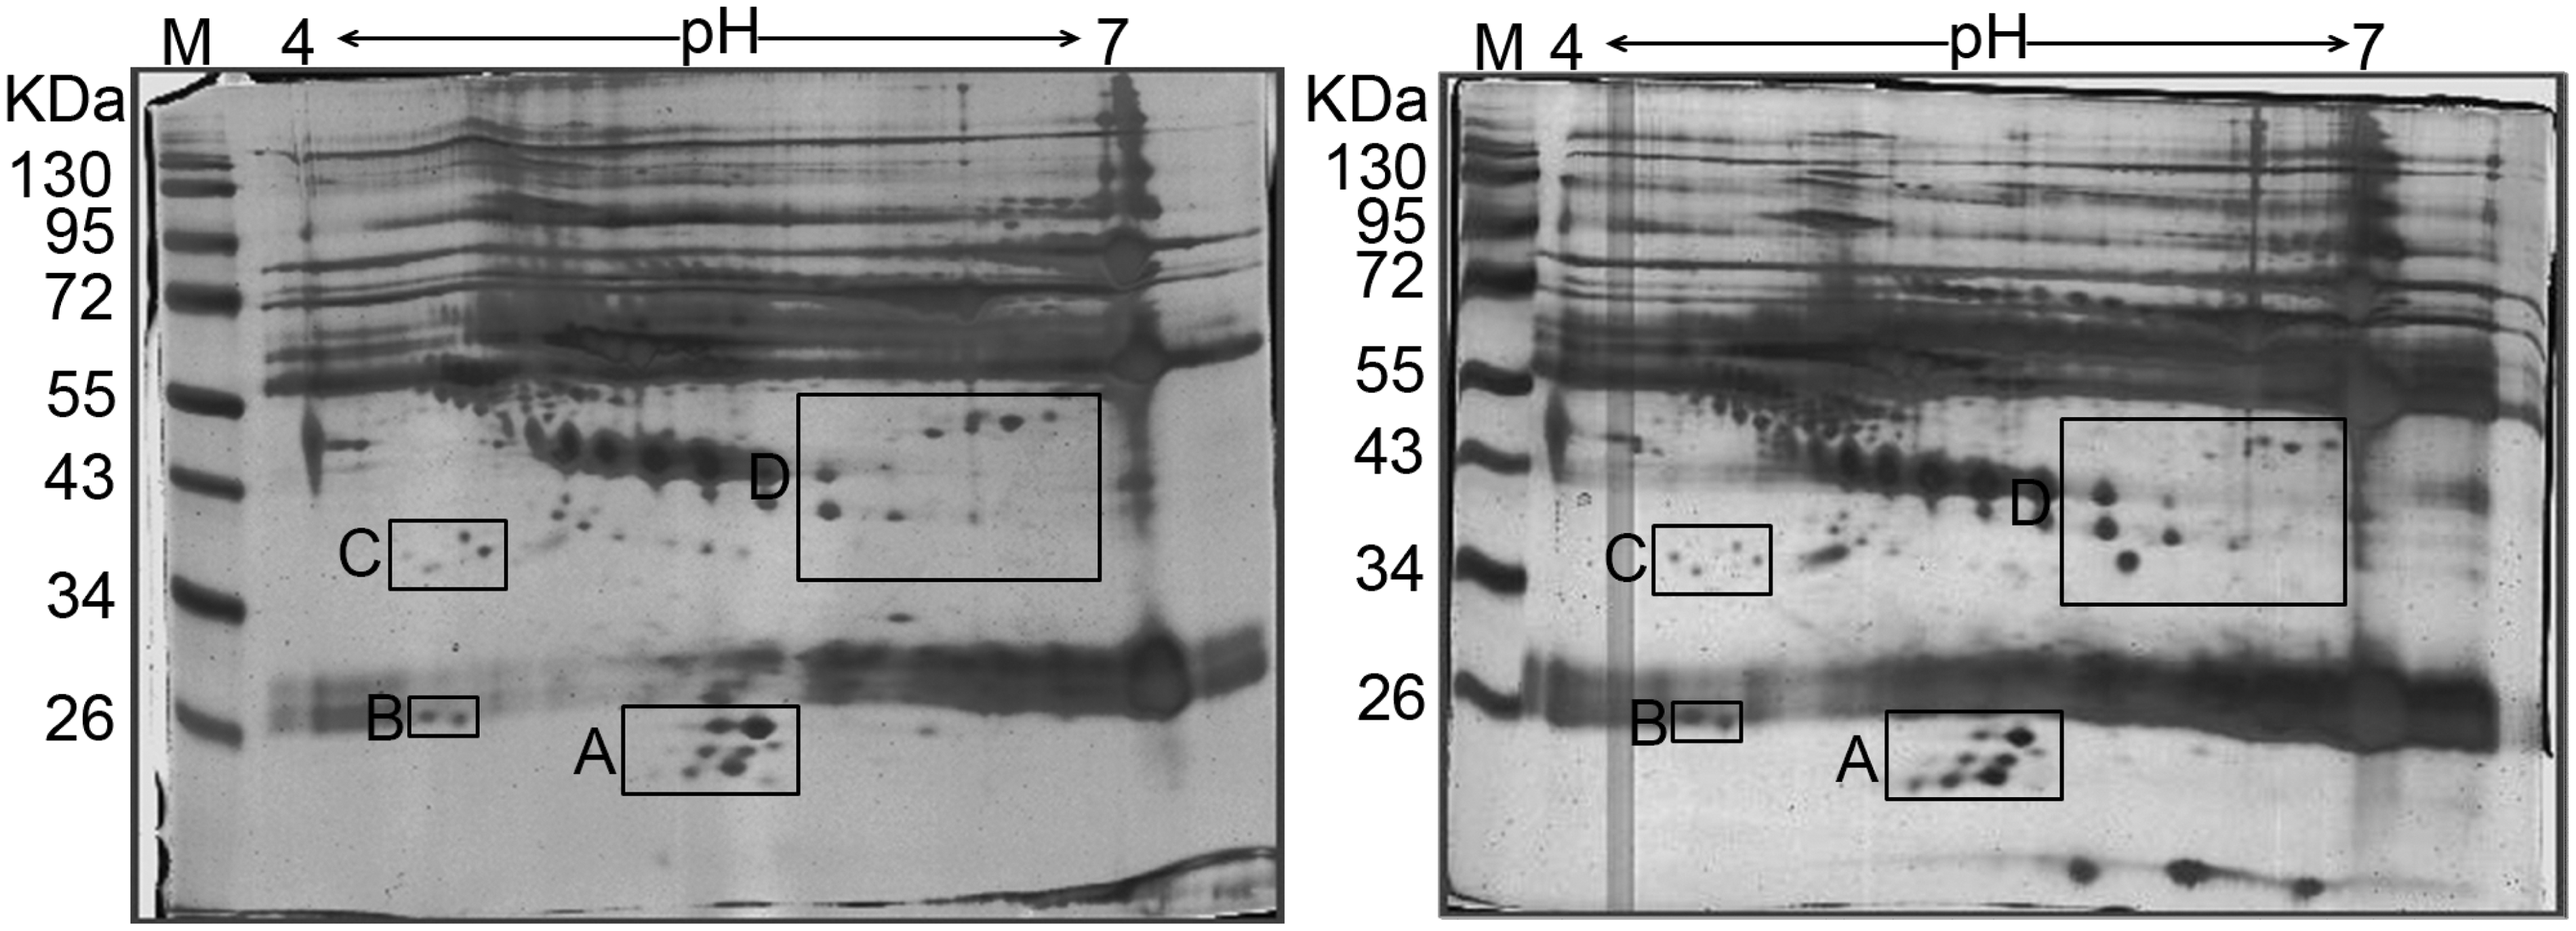
Two-dimensional electrophoresis (2-DE) of serum from health and systemic lupus erythematosus (SLE) subjects. Black boxes show the main differences between two groups. After removal of high-abundance proteins, remaining serum proteins were separated by isoelectric focusing (IPG 4-7) as 1st dimension and 12% SDS-PAGE as second dimension. Protein visualization was done using silver nitrate staining. Left hand: healthy subjects; right hand: SLE patints. M: protein ladder.
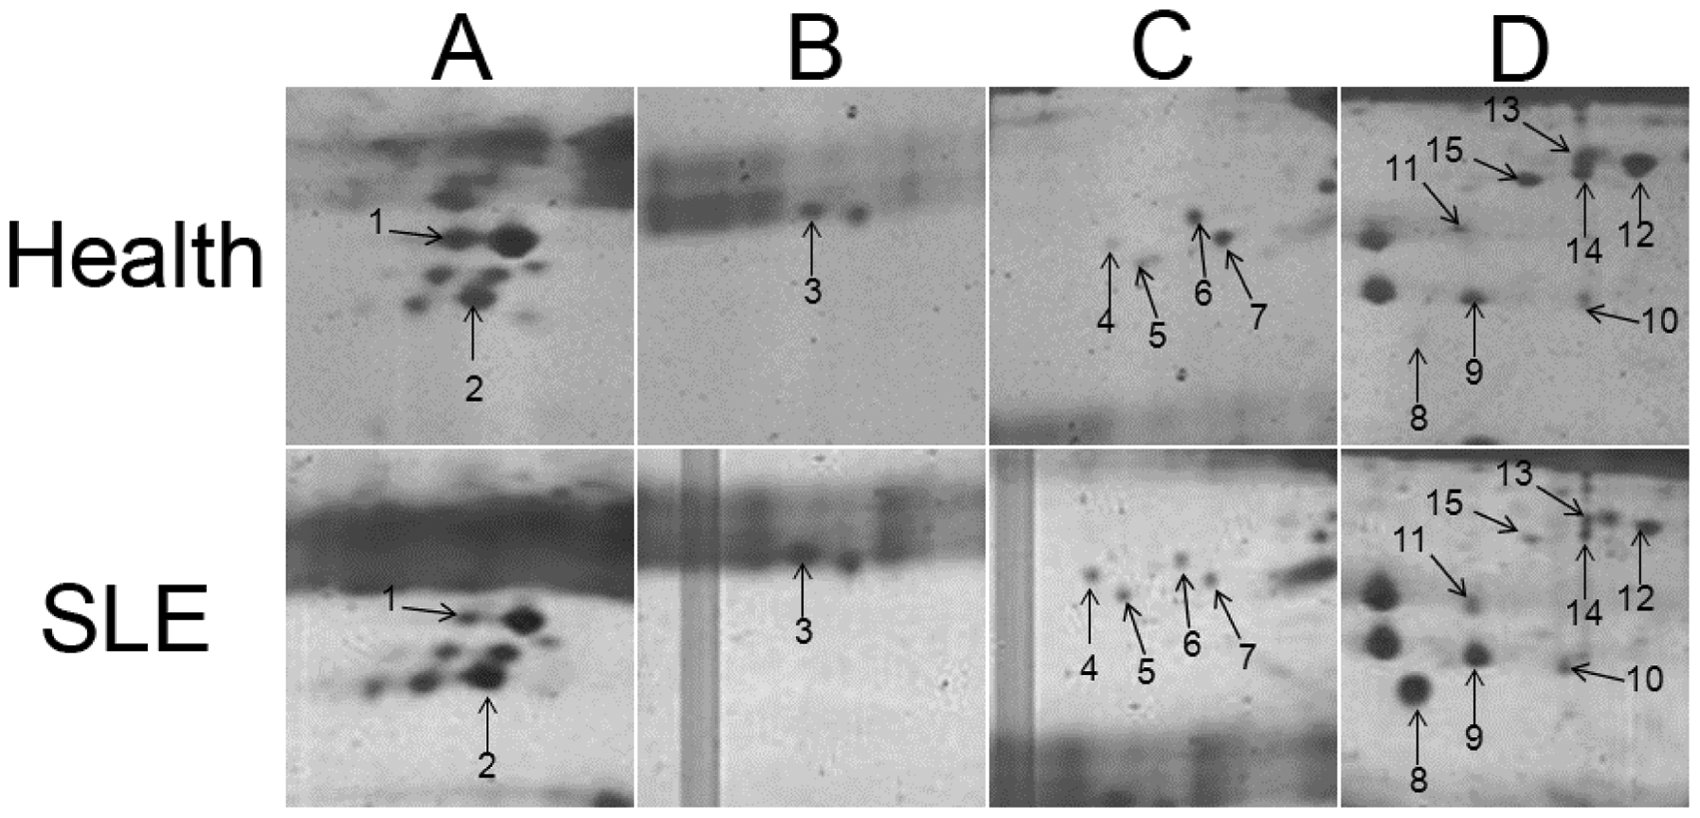
Expression changes of proteins in the serum of systemic lupus erythematosus (SLE) patients compared with serum from healthy volunteers. Image analysis was performed by using Melanie software. A–D were indicated according to Figure 1. All numbered proteins were identified by MALDI-TOF/TOF-MS and are presented in Table 2.
Identification of differential protein species by MALDI-TOF/TOF-MS
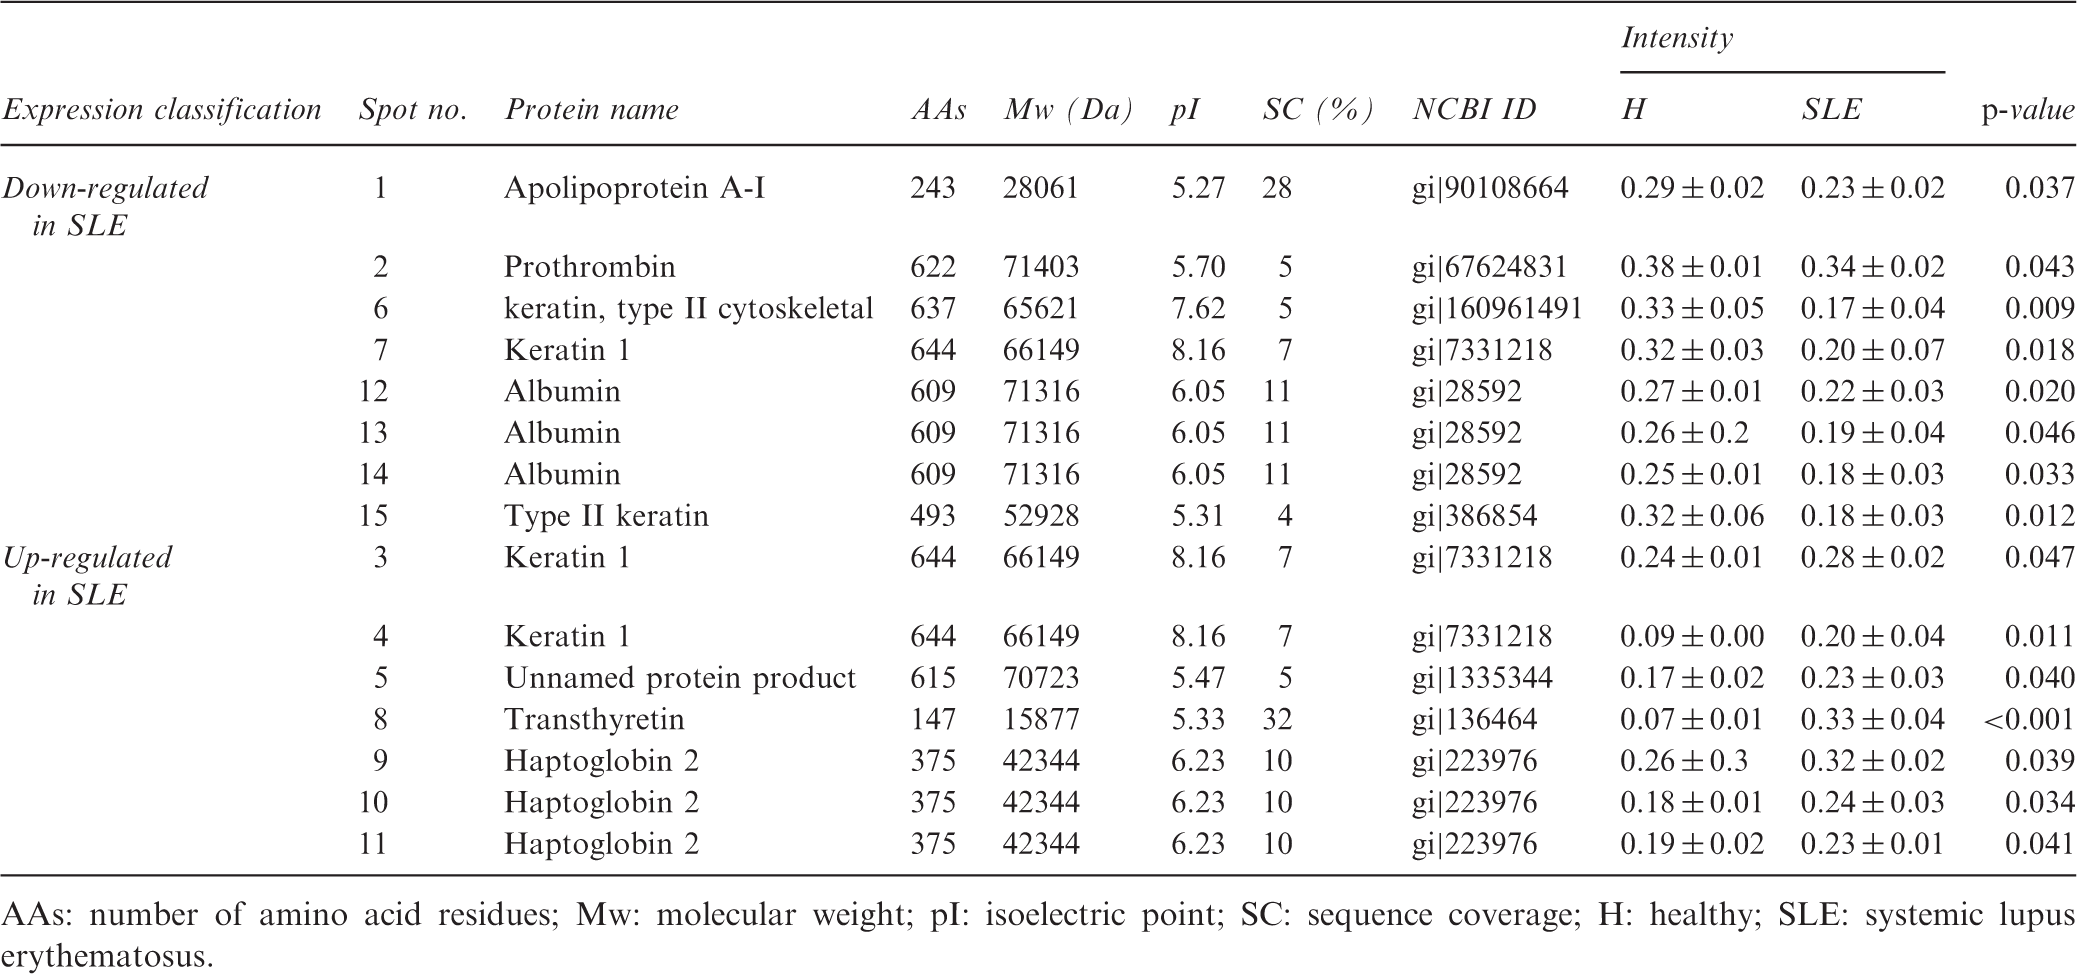
AAs: number of amino acid residues; Mw: molecular weight; pI: isoelectric point; SC: sequence coverage; H: healthy; SLE: systemic lupus erythematosus.
Discussion
Biomarkers are hallmarks for the detection of diseases/disorders, and a patient’s serum proteome is a rich source of biomarkers due to its modification with disease progression. In this study, we evaluated the serum proteome changes in patients with SLE and compared them with healthy people in order to identify useful biomarkers. The protein expression set including apolipoprotein A-I (apo A-I), prothrombin, cytoskeletal keratin, albumin, and some types of keratin was reduced in SLE patients. On the other hand, some types of keratin, transthyretin (TTR) and haptoglubin 2 (Hp-2) were up-regulated in patients with SLE in comparison with healthy people. It has been reported that SLE occurs nine times more often in women than in men; 4 however, we found no significant differences between men and women in the pattern of protein expression.
Hp is a liver glycoprotein found in normal serum. 14 It has been reported that Hp-1 precursor is more than 90% homologous to circulating Hp, and it was recommended as a potential biomarker in the early diagnosis of ovarian cancer. 15 Also, Pavon et al. reported that preferential Hp-2 expression in patients with SLE may contribute to some of the clinical manifestations of the disease, such as hypergammaglobulinemia, as in this study, systemic vasculitis, and cardiovascular disorders. 16 Regarding hypergammaglobulinemia, it has been demonstrated that Hp can bind to the CD22 receptor on human B cells and cause their activation and survival, and Hp and Igs elevation is seen at the same time, 17 similar to our study.
Apo A-I is a protein that in humans is encoded by the APOA1 gene 18 and has a specific role in lipid metabolism. This protein is the major protein component of high-density lipoprotein (HDL) in plasma. Chylomicrons secreted from intestinal enterocytes contain apo A-I, but they transfer their apo A-I to HDL in the bloodstream quickly. 19 The correlation between autoimmune disease and atherosclerosis with plasma HDL apoA-I raises the possibility of a common link involving all three factors. 20 It has been reported that apoA-I prevents lymphocyte cholesterol accumulation, activation and proliferation in skin-draining lymph nodes in mice, and taken together with previous reports this suggested a direct link between apoA-I and inflammation and autoimmunity. In human patients suffering from autoimmune disorders HDL levels are significantly decreased,21–23 but proinflammatory HDL levels in patients with SLE are higher than in healthy people, and this type of HDL also contains large amount of apo A-I. 24 Our results regarding reduction in apo A-I are in agreement with all other previous reports, but further studies may be necessary for confirmation of these results by assaying levels of HDL and proinflammatory HDL.
TTR, formerly prealbumin, binds T4 and forms a complex with retinol-binding protein (RBP). This protein is found in serum and cerebrospinal fluid, and transports the thyroid hormone and retinol. 25 Previous studies reported that TTR had potential importance as a biomarker for lung 26 and ovarian cancer.27,28 Also, by proteomic study, it has been demonstrated that TTR is significantly up-regulated in pediatric SLE (pSLE). 29 The presence of this protein in our study suggests that SLE patients have the potential to develop secondary amyloidosis, because TTR is known to be associated with amyloid diseases such as senile systemic amyloidosis, familial amyloid polyneuropathy, and familial amyloid cardiomyopathy. 29 Sequential quantitation of this protein in patients with SLE and investigation of its relationship with the development of pathological signs of SLE should be addressed in future studies.
The proteomics-identified biomarkers in the serum of patients with SLE are highly dependent on the type of organ or tissue involvement. These changes are reported by Korte and his colleagues for some types of SLE complication. 30 However, there are no reports about down-expression of prothrombin, albumin, and cytoskeletal keratin in patients with SLE to date. Changes in prothrombin levels have been reported in cardiovascular disease and disorders. Also, changes in keratin levels seem likely due to the nature of this disease. Finally, researchers should note that this work is a preliminary study and further and complementary studies are highly recommended for confirmation of these results using other methods such as western blotting, immunohistochemistry and/or real-time PCR.
Footnotes
Funding
This research received no specific grant from any funding agency in the public, commercial, or not-for-profit sectors.
Conflict of interest statement
The authors have no conflicts of interest to declare.
Acknowledgment
The authors would like to thank the College of Science, University of Sistan and Baluchestan, Zahedan, Iran for financial and technical support of this study.