
Abstract
Objectives
To quantify signal abnormalities in the hippocampus (Hsig) of patients with systemic lupus erythematosus (SLE) and to determine if Hsig predict hippocampal atrophy (HA) in SLE.
Methods
We included all SLE patients and healthy age- and sex-matched individuals with two magnetic resonance imaging (MRI) scans performed with a minimum of 1 year interval. All individuals underwent a standardized neuropsychological evaluation. Individual results were converted into standard scores and compared to normative data. SLE patients were additionally assessed for disease activity (SLE Disease Activity Index (SLEDAI)), damage (Systemic Lupus International Collaborating Clinics/American College of Rheumatology Damage Index (SDI)), and the presence of antiphospholipid antibodies. MRI was performed on an Elscint 2 T scanner and T1 inversion recovery and T2 coronal images were used for analysis. Volumetric (HV) and signal quantification (Hsig) were determined by standardized protocols.
Results
We included 54 SLE patients (48 women; mean age 32.2 ± 10.56 years). Hsig were found at study entry in 15 (45.5%) patients. Hsig in the body and tail of non-atrophic hippocampi correlated with progression of volume loss during the follow-up period (r = 0.8, p < 0.001). The presence of Hsig in the head of atrophic hippocampi correlated with progression of HA (r = 0.73, p = 0.005) during the same period. No correlation of Hsig and disease activity or prednisone dose was observed.
Conclusion
HA is frequently observed in SLE patients and volume loss is progressive in a subgroup of patients. The evaluation of Hsig is an easy tool to determine patients that may have progressive hippocampal volume loss and should be followed more closely with MRI and cognitive evaluation.
Introduction
Systemic lupus erythematosus (SLE) is a systemic autoimmune disease with abnormalities in immune regulation. 1 Disease activity is characterized by intense inflammatory activity and treatments include corticosteroids and other immunosuppressive agents. 2
Cerebral atrophy, both localized and diffuse, is frequently observed in SLE patients.3,4 Our group has previously analyzed the hippocampus in SLE patients and observed that hippocampal atrophy (HA) is not only frequently observed and progressive, but also associated with cognitive impairment in SLE patients. 5
Hippocampal sclerosis (HS) is histologically defined by selective neuronal loss and gliosis within the hippocampus.6,7 The use of quantitative magnetic resonance imaging (MRI) techniques provides objective data and can be a useful tool for the understanding of the underlying mechanisms involved in hippocampal damage.6–15 MRI features that characterize HS are HA, loss of hippocampal internal structures, and increased hippocampal T2 signal.6–8 Previous studies have shown that reduced hippocampal volumes are associated with neuronal loss.6,8 The presence of hyperintense T2 signal in the hippocampus is more likely to reflect gliosis in hippocampal formation.6,15
In our previous study we observed that a subgroup of SLE patients with cognitive impairment and normal hippocampi volumes at study entry progressed to hippocampi volume loss after a period of follow-up. Therefore we hypothesized that hippocampal signal abnormalities (Hsig) could help to identify SLE patients with progressive hippocampi volume loss. The aim of this study is to quantify Hsig and to determine the clinical significance of Hsig in SLE.
Subjects and methods
Subjects
We selected 77 SLE patients that had two MRI scans performed within a minimum interval of 1 year. All patients fulfilled four or more criteria for SLE, 16 and were seen regularly at our rheumatology unit, University of Campinas, São Paulo, Brazil. All patients with SLE were followed using a standardized protocol by the same investigators in the rheumatology unit (LTLC, SA). We excluded patients who had clinical conditions that could influence cerebral and hippocampal atrophy, such as a history of stroke (n = 5), epilepsy (n = 2), arterial hypertension (n = 5), diabetes mellitus (n = 5), alcohol and drug misuse (n = 1), and malignancy (n = 1). None of the patients had renal insufficiency or other disease that could influence cerebral atrophy. Patients who fulfilled the American College of Rheumatology (ACR) criteria for rheumatoid arthritis, systemic sclerosis, Sjögren’s syndrome (primary or secondary; n = 4), or other connective tissue diseases and with drug-induced SLE were also excluded.
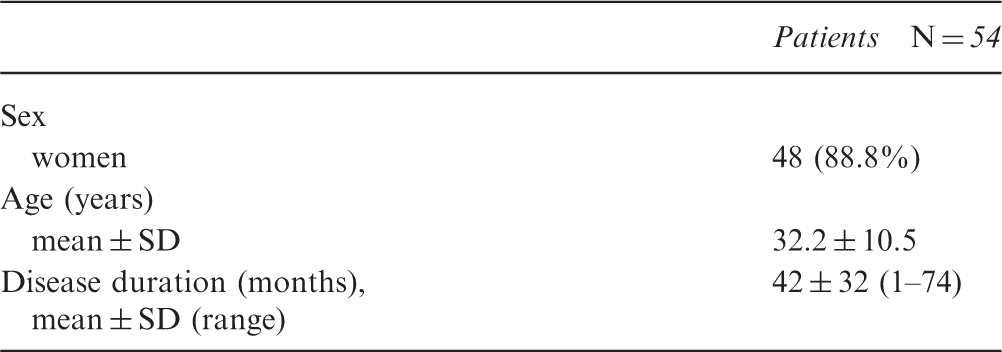
Demographics SLE patients
This study was approved by the local ethics committee of our institution and informed written consent was obtained from each subject.
Clinical, serological, and treatment features of patients with SLE
Data on sex, age at onset of disease, and disease duration were collected for each patient. Disease duration was defined as the time from initial manifestation clearly attributable to SLE until the day of MRI acquisitions. All clinical manifestations and laboratory test findings were recorded. Clinical and laboratory manifestations were analyzed according to the ACR. 16 Central nervous system (CNS) manifestations, which were recorded following ACR case definitions, 17 were divided into present (active or past CNS involvement) or absent (never presented CNS involvement).
A complete neurological examination, and cognitive and psychiatric charts, was applied to all patients to identify CNS involvement at time of MRI acquisition. The Mini-Mental State Examination was applied to all participants. 18 All participants were submitted to a battery of standardized neuropsychological tests to screen for possible impairment in one or more of the following cognitive domains: simple attention, complex attention, memory, visuospatial processing, language, reasoning or problem solving, psychomotor speed, and executive functions.19–22 The individual test results were converted into standard scores, which were compared with the available normative data.19–22 Regarding any of the eight cognitive domains, subjects with a total score ≤2 standard deviations (SD) below the normative value were considered to be impaired. Cognitive dysfunction was classified as mild if there were deficits in less than three dimensions, as moderate if there were deficits in three or four dimensions and as severe if there were deficits in at least five dimensions.23,24
Assessment of depression was based on the Beck Depression Inventory.24,25 Scores from 10 to 17 on the Beck Depression Inventory were considered to indicate mild depression, from 18 to 24 moderate depression, and >24 severe depression. Anxiety was evaluated using the Hospital Anxiety and Depression Scale. 26
The presence of psychosis was determined by the Brief Psychiatry Rating Scale. 27
For past history of CNS involvement, we reviewed the medical charts of patients.
Disease activity was measured by the Systemic Lupus Erythematous Disease Activity Index (SLEDAI) and was considered to be active if scores were >8 points. 28 Adjusted SLEDAI score over time were calculated by careful review of the medical charts and preview exams. 29
Cumulative SLE-related damage was determined by the Systemic Lupus International Collaborating Clinics/American College of Rheumatology Damage Index (SLICC/ACR DI) in all patients with SLE at the time of MRIs. 30
Total doses of corticosteroids and other immunosuppressant drugs used since the onset of disease were calculated by careful review of the medical charts. Doses of oral and parenteral corticosteroids were analyzed and converted to the equivalent doses of prednisone. The cumulative dose of corticosteroids used was calculated by the sum of daily dosages versus time (days) of treatment.
MRI acquisition
All subjects underwent two MRI acquisitions using the Elscint Prestige 2 T scanner (Haifa, Israel) with a minimum interval of 12 months. Coronal T1-inversion recovery (3 mm thick, flip angle = 200°, TR = 2800, TE = 14, inversion time = 840, matrix 130 × 256, FOV = 16 × 18 cm2) and coronal T2-weighted “fast spin echo” (4 mm thick, flip angle = 120°, TR = 4800, TE = 129, matrix 252 × 320, FOV = 18 × 18 cm2) images were analyzed using anatomical guidelines obtained from a standardized protocol for manual segmentations of hippocampal and total brain volumes. 27 Quantification and analysis were carried out by one investigator (ATL) blind to the patients’ clinical data. The evaluation was cross-checked by other investigators with experience in MRI analysis (SA). This method has been previously compared with other segmentation programs, and intraobserver (r = 0.90) and interobserver (r = 0.85) variations were determined. 5
Image processing
Hippocampi volumes
Manual delineation of hippocampi boundaries was carried out using the Scion Image program (NIH, Bethesda, MD, USA). Anatomical guidelines for outlining the hippocampus followed a specific protocol previously described.6,31 Once the outline had been defined, the slice area was calculated automatically by the computer program. We then calculated the total volumes (mm3) as the sum of each area multiplied by the slice thickness. To determine HA even in the presence of diffuse atrophy, and also to correct for individual variation of the size of the head, we corrected all hippocampal absolute volumes for each respective individual cerebral volume. This correction consisted of dividing the mean total brain volume of the control group by the patient’s brain volume. In each patient, the calculated hippocampal volume was then multiplied by this ratio.6,32 This correction for brain volume assumes a linear relationship between hippocampi and brain volumes.6,32 In addition, the asymmetry index was determined by the ratio of the smaller to the larger structure for each subject. Atrophy was determined when corrected volumes or asymmetry index were ≤2 SD from the mean of the control group. The control group used in this study for this purpose consisted of 56 healthy volunteers without history of any chronic disease. The healthy volunteers were matched by age and gender to the patients.
Hippocampi signals
Hippocampi signals were also determined at the same areas used for manual delineation of the hippocampi boundaries using the Scion Image program (NIH, Bethesda, MD, USA). The Scion Image program provides the average gray value within the selected regions of interest and this value is the sum of the gray values of all pixels in the selection divided by the number of pixels. Hippocampal signal was determined in T1 inversion recovery and T2 coronal slices. The inner boundaries of the hippocampal formation were manually delineated throughout the extension of the structure. In addition to the determination of the hippocampal signal from the whole hippocampal formation, we calculated the hippocampal head signal (Hip-head-signal), determined as the mean value for the first three slices of the hippocampal formation. Values were corrected by the signal measured on the midline portion of the pons, and transformed into Z-scores. An abnormal T2 hippocampal signal (hyperintense) was determined for values for values above 2 SD from the mean of the control group.
Statistical analysis
In order to determine variables associated with Hsig we divided our original SLE group in two subgroups: (1) SLE patients with atrophy or Hsig; and (2) SLE without any signs of hippocampal pathology at any time point of analysis.
We performed analysis of variance (ANOVA) to assess differences in continuous variables among groups, with post hoc pairwise comparisons (Tukey test). The chi-square test was used to determine the differences in the frequency distribution of abnormalities between groups. Multiple regression was used to determine predictors of hippocampi atrophy or progression of hippocampi atrophy.
Results
Demographic data
We included 54 SLE patients (48 women; mean age 32.2 ± 10.56 years) and 56 controls (40 women; mean age 33.7 ± 15.85).
Clinical, laboratory, and treatment features
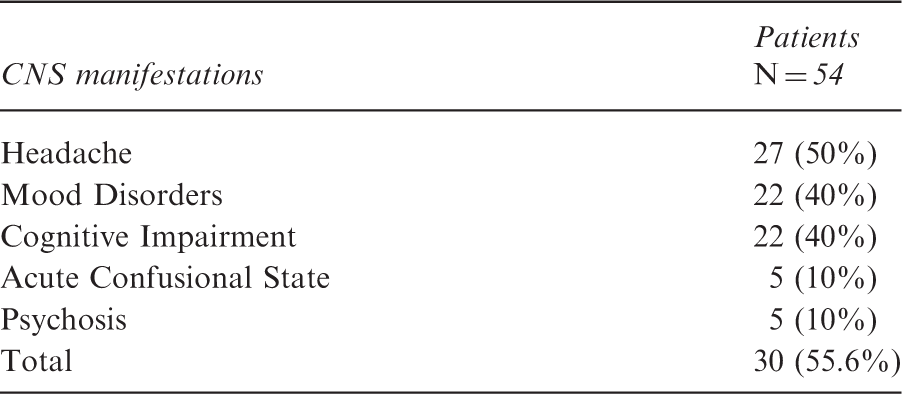
CNS manifestations observed in patients with SLE
Antiphospholipid antibodies were observed in 16 (29.6%) SLE patients.
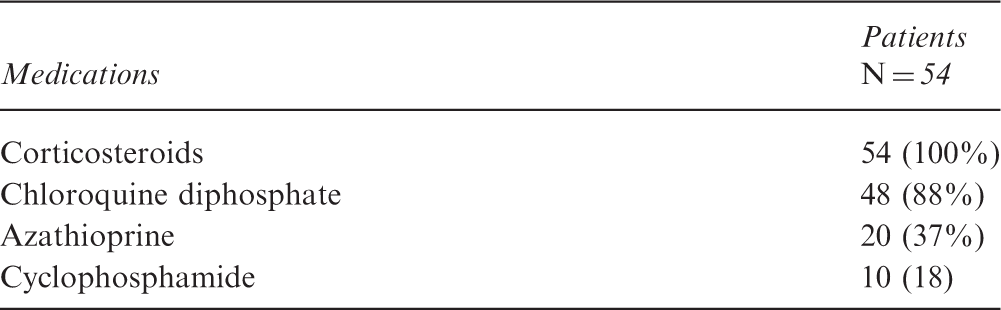
Medications more frequently prescribed in patients with SLE
Hippocampal volumes
At study entry, right (mean volume 2194 mm3; SD ± 265.81) and left (mean volume 2081 mm3; SD ± 235.56) Hippocampal volumes (HV) were significantly smaller in SLE patients when compared to right (mean volume 3379 mm3; SD ± 278.38; p < 0.05) and left (mean volume 3214 mm3; SD ± 269.48; p < 0.05) HV of controls (Figure 1). After a mean follow-up time of 16 months (SD 4.2) we observed significantly smaller right and left HV in SLE patients (p < 0.05). No difference in HV was observed in controls.
Magnetic resonance image showing the segmentation of a patient with SLE and control.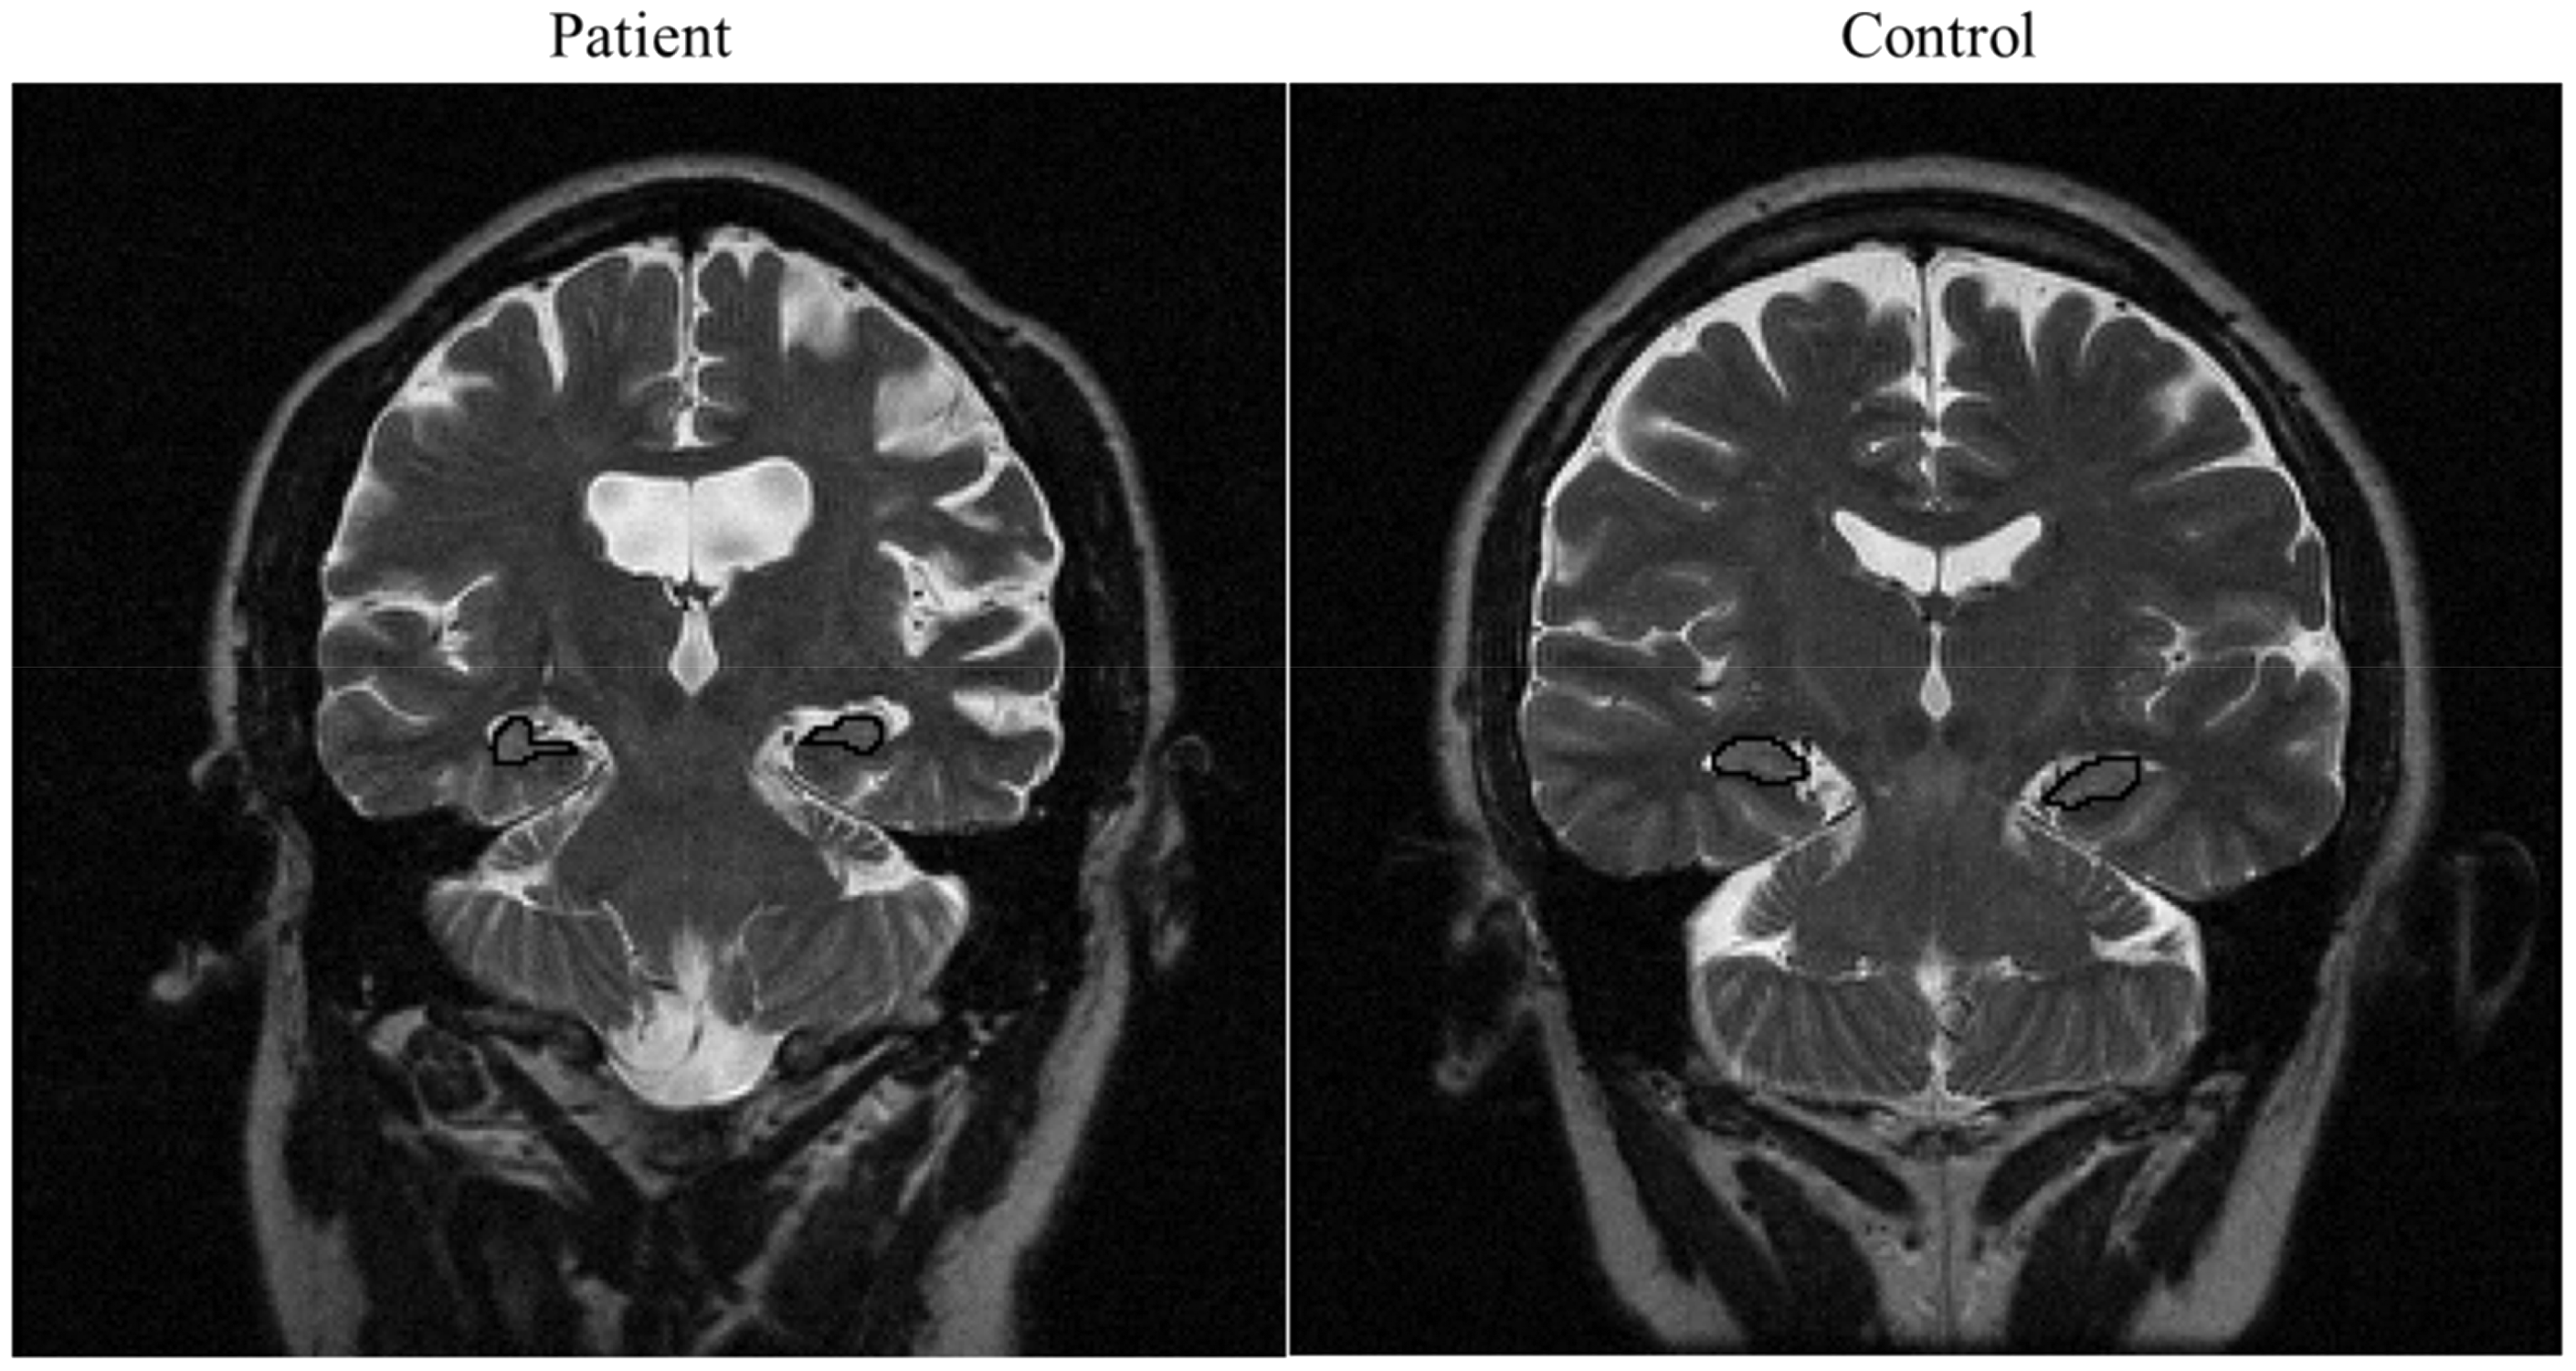
At study entry, HA was identified in the left hippocampus in 4 (7.4%) and in the right hippocampus in 2 (3.7%) patients and in no control. In the follow-up MRI, HA was identified in the right hippocampus in 12 (22.2%) and in the left hippocampus in 13 (24.1%).
Hippocampal signal abnormalities
Hippocampal signal abnormalities in each hippocampal region. More than one region can be abnormal
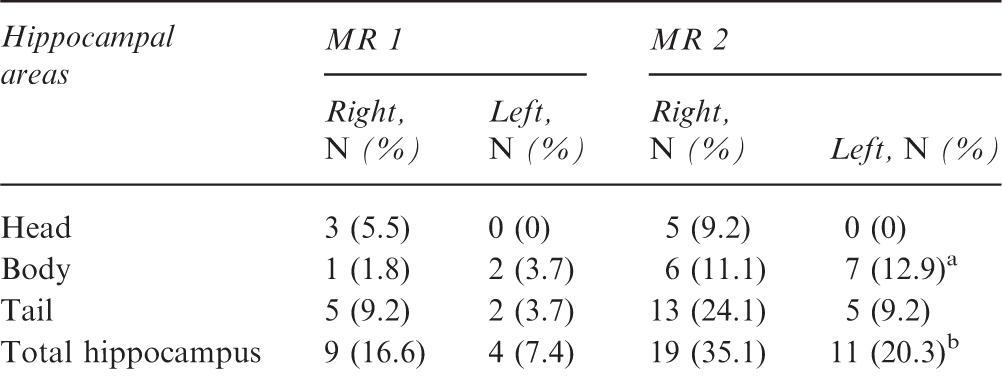
p = 0.015.
p = 0.023.
In order to determine variables associated with Hsig we divided our original SLE group in two subgroups: (1) 19 (35.2%) of SLE patients with atrophy or Hsig; and (2) 35 (64.8%) without any signs of hippocampal pathology.
Variables associated with hippocampal signal abnormalities
Hsig in the head and body of non-atrophic hippocampi were predictive for HA (odds ratio (OR) = 3.2; 95% confidence interval (CI) = 1.9–5.6). The presence of Hsig in the head of atrophic hippocampi were predictive of progression of HA (OR = 4.2; 95%CI = 1.1–14.2) during the same period.
The presence of Hsig in non-atrophic hippocampi was associated with the presence of cognitive impairment at study entry (p = 0.01). Both cumulative prednisone dose (p = 0.001) and disease activity over time (p = 0.02) were associated with the presence of Hsig at study entry.
Discussion
The hippocampus, located in the temporal lobe, is a structure intimately associated with certain aspects of learning and memory consolidation. 33 Cognitive impairment is frequently observed in SLE patients and has been shown to be associated with HA.5,33–36 Both corticosteroid dose as well as autoantibodies have been associated with HA in SLE.5,33,37
Neuroimaging studies have become an important tool in evaluating SLE patients with neuropsychiatric manifestations.34,37 However, MRI is an expensive exam to perform routinely in patients. It is necessary to determine prognostic markers to justify the routine use, especially in oligosymptomatic patients.
In this study we have shown that Hsig can identify SLE patients that progress to hippocampal volume loss. We could demonstrate that Hsig in the head of normal hippocampi were associated with progressive hippocampal volume loss after a minimum of 12 months of follow-up. In patients that already had HA, the presence of Hsig in the head was predictive of progression of hippocampal volume loss. These results allow us to determine patients that would benefit from repeated MRI studies.
It is established that hippocampal volumes reflect neuron cell counts.9,38–41 In contrast, the pathological correlate of increased signal on T2-weighted images is still controversial. It has been suggested that signal change reflects unspecific increased concentration and mobility of water. 42 This can be found in edema,43,44 demyelination, 43 or gliosis. 44 The physiopathology of CNS manifestations in SLE is not yet entirely clear. 34 Cytokine-mediated inflammation and antibodies related to neuronal dysfunction and death have been described.33–36 Unfortunately, we did not have serological or cerebrospinal fluid (CSF) analysis of these patients at the time of MRI. In addition corticosteroid also plays an important role in atrophy in SLE, especially involving gray matter and in cognitive dysfunction.5,33
The signal increase measured by T2 relaxometry in established HS correlates with changes in the glial cell number, particularly in the dentate gyrus, where about 30% of all glial cells present are reactive astrocytes. In the dentate gyrus, neuron loss may be variable, and gliosis is the more typical histopathologic feature. 44 Associated with gliosis, there is often an extensive sprouting of the mossy fiber system.44–47
In epilepsy, the hippocampal volume loss correlates well with the signal change and can be used interchangeably for clinical purposes, whereas in other diseases, such as Alzheimer disease, there is volume loss unassociated with signal change.47,48 We observed in SLE patients that Hsig increase may occur prior to HV loss, and may be a predictor of HV loss, both in normal and atrophic hippocampi.
In conclusion, we observed in a group of SLE patients with progressive hippocampal volume loss that Hsig was a useful marker to determine subgroup of patients with progressive hippocampal volume loss and that could benefit from repeated MRIs. In addition, Hsig was useful to identify patients that had cognitive impairment despite normal hippocampal volumes. These patients presented cognitive impairment during the follow-up period. If this finding could be generalized to other brain structures has still to be determined.
Footnotes
Declaration of conflicting interests
The authors declared no potential conflicts of interest with respect to the research, authorship, and/or publication of this article.
Funding
The authors disclosed receipt of the following financial support for the research, authorship, and/or publication of this article: Fundação Amparo À Pesquisa Estado São Paulo-Brasil (FAPESP 2008/02917-0 and 2009/06049-6, 2009/11076-2, 2013/07559-3), Conselho Nacional Pesquisa Desenvolvimento-Brasil CNPq (300447/2009-4 and 471343/2011-0 and 302205/2012-8 and 473328/2013-5 and 157534/2015-4).