
Abstract
The relationship between serum concentration of complement C4 ([C4]) and C4 gene copy number (GCN) was investigated in 56 systemic lupus erythematosus (SLE) patients and 33 age and sex-matched controls in a Western Australian population. C4A and C4B gene copy numbers (C4A & B GCN) together with the presence or absence of the ≈6.4-kb human endogenous retroviral element type K (hereafter HERV-K) in intron 9 were estimated by two TaqMan™ real-time PCR (RT-PCR) assays that measured total C4 and HERV-K GCNs, respectively. There was good correlation between the two methods; however, the HERV-K GCN method showed a positive bias (≈6%) relative to the C4A & B total GCN. Despite individual variation, excellent correlation between total C4 GCN and mean [C4] per GCN was observed for both the SLE and control cohorts (R2 = 88% and R2 = 99%, respectively). It was noted that serum [C4] was significantly lower in the SLE patients than the controls (p = 0.006) despite there being no difference between C4A and C4B GCN in both cohorts. The data therefore confirm previous reports that the C4A genes are preferentially associated with the presence of the HERV-K insertion relative to C4B genes and does not support the hypothesis that low [C4] in SLE is explained by low C4A GCNs. There was no evidence also that the presence of the HERV-K insertion in C4 genes influenced [C4]. This study supports the view that low [C4] in SLE patients is due to consumption rather than deficient synthesis related to lower C4A & B GCN.
Introduction
Complement C4 genes (C4), located within the central region of the major histocompatibility complex (MHC) on the short arm of chromosome 6 (C6p), display strong linkage disequilibrium with neighbouring loci 1 and contribute to the identity of extended haplotypes that characterize this genomic region. 1 C4 proteins are synthesized from the mRNAs of two expressed paralogous genes, designated C4A and C4B, 2 resulting in the synthesis of proteins, sharing 99% identity and differing by four isotype-specific amino acids in exon 26. 3 Complement C4 genes are part of a sub-genomic region designated ‘RCCX’.4–6 An RCCX module contains loci for serine/threonine nuclear protein kinase RP (STK 19, OMIM*604977), complement C4 (C4A &/or C4B, OMIM*120810 & 120820, respectively), steroid 21-hydroxylase CYP21 (CYP-21, OMIM*613815) and the extracellular matrix protein tenascin X (TNX, OMIN*600985); up to four copies of the module may be present on each copy of C6p, although most individuals have only one per haplotype and hence two copies of each of the C4A and C4B genes. 6
Both loci may also exhibit size polymorphism due to the presence of a ≈ 6.4-kb HERV-K retroviral insertion in intron nine, resulting in ‘long’ (presence of the retroviral element) and ‘short’ (absence of the retroviral element) C4 gene variants.7,8 The antisense insertion and lack of promoter activity from the 5’ LTR (both sense and antisense) and the 3’ LTR sense orientation preclude a deleterious effect on the host genes, in this case complement C4. 7 Nevertheless, Yang and colleagues 8 recently reported that the presence of the retroviral element is associated with lower C4 serum concentrations and decreased hemolytic titres of complement activity.
Furthermore, C4A is associated with the presence of a CT insertion in exon 299 that results in a frameshift mutation and a stop codon that effects translation of a non-functional C4 protein. 10 Reports suggest that the CT insertion is associated with C4A pseudogenes, 10 is present in some C4B genes10,11 and predisposes to systemic lupus erythematosus (SLE). Paakkanen and colleagues have demonstrated the presence of this CT insertion in more than 70% of the individuals exhibiting C4A deficiency states, and that its prevalence is increased in SLE patients relative to controls. 12 However, the association between the CT insertion and C4A deficiency has not been demonstrated in a recent study of populations from the United Kingdom and Spain. 13
The purpose of this study was to evaluate the levels of complement C4 protein in a cohort of West Australian individuals with SLE and a sex/age matched control cohort. The relationship between serum C4 protein concentrations and C4A and C4B gene copy numbers (C4 GCNs) was investigated together with the frequencies of the presence of the HERV-K retroviral element and the exon 29 CT insertion in C4A and C4B genes. In a previous study complement C4 reference ranges for varying C4 GCNs were published to assist clinicians in the interpretation of chronically low serum C4 concentrations in SLE patients. 14 The present study extends this work.
Materials and methods
Populations and sample collections
Human ethics approval was received from Curtin University, Sir Charles Gairdner Hospital and Royal Perth Hospital Human Ethics Committees (approval numbers HR 202/2013, HREC 2013-174). Written informed consent was obtained from all study participants. Fifty-six treated SLE patients aged 47 ± 15 years (mean ± SD) were recruited from Sir Charles Gairdner (SCGH) and Royal Perth Hospitals (RPH; Perth, Western Australia) between March 2014 and December 2015. The diagnoses were based on the American College of Rheumatology classification criteria. Except for two patients with active disease, this population of SLE patients was well managed, with no evidence of acute disease activity based on clinical assessment. In addition to the SLE diagnosis, patients had co-morbidities including renal disease, liver pathologies as well as Sjögren and Raynaud’s syndromes. These are summarized in a previous publication. 15 SLE patients in this cohort were treated with various therapeutic regimens including steroids (low-dose prednisolone ≤5 mg/day), steroid-sparing immunosuppressant therapies (azathioprine, cyclosporine, cyclophosphamide, methotrexate, mycophenolate mofetil) and antimalarial therapy (hydroxychloroquine). Thirty-three age and sex-matched healthy control subjects (47 ± 15 years) (mean ± SD) were recruited from the Perth metropolitan area.
Peripheral blood samples from SLE patients were collected at one time point during the clinical management of this cohort of pre-diagnosed SLE patients. Blood was collected into ethylenediaminetetraacetic acid (EDTA), heparin and serum collection tubes at PathWest collection centres. Serum samples were separated by centrifugation at PathWest laboratories within one hour of collection and frozen to between −70 and −86℃. Samples from healthy human controls were collected into EDTA, heparin and serum vacutainer tubes (Beckton Dickinson (BD), San Jose, USA) and processed in the same manner at Curtin University laboratory (Perth, WA).
We have previously reported the assay methods used to measure C4 concentrations in the serum of the SLE and control cohorts. 15
Determination of complement C4, C4A and C4B gene copy number, HERV-K retroviral element in intron 9 and CT insertion in exon 29 of the C4 genes
The C4 GCN was assessed using Taqman™ real-time PCR methodology, which has been previously described elsewhere. 14 The presence of the HERV-K retroviral element in intron nine of the C4 genes was assessed by real-time PCR on a VIIA 7 thermocycler (ThermoFisher Scientific) using Taqman™ (Life Technologies) custom copy number assay designed from published primers (C4L: C4Fin95 5’-TTGCTCGTTCTGCTCATTCCTT-3’ and C4L-3LTR-R 5’-GTTGAGGCTGGTCCCCAACA-3’; C4S: C4Fin95 5’-TTGCTCGTTCTGCTCATTCCTT-3’ and C4Sin9R-2 5’GGCGCAGGCTGCTGTATT-3’) and probe (C4in95 FAM/MGB – 5’-CTCCTCCAGTGGACATG-3’). 16 It was performed according to the manufacturer’s instructions in 96-well plates containing 4µL of test DNA, together with 10µL of 2X TaqMan Genotyping Master Mix, 1µL of 20X TaqMan C4 – long (C4L) or TaqMan C4 – short (C4S) custom GCN assay and 1µL of 20x TaqMan copy number reference assay (RNase P component H1) as well as 4µL of nuclease free water for a total volume of 20µL per reaction. PCR assays were performed with cycle parameters set at 95℃ for 10 minutes and 40 cycles at 95℃ for 15 seconds followed by 60℃ for 60 seconds. Data collected were analyzed using Copy Caller version 2.1 software and GraphPad PRISM 7. In each plate controls were added that consisted of MHC samples (cell lines WT100BIS, MOU, SAVC, JESTHOM, HOM-2, CBG-IB CB6B kindly donated by the Immunology department at Fiona Stanley Hospital, Perth, Western Australia).
The CT insertion in exon 29 was detected by sequencing after PCR amplification in PCR microfuge tubes containing 4µL of test DNA, 10µL of 5x My Taq reaction buffer (Bioline, USA), 1µL each of the forward and reverse primers at a concentration of 20µM, 0.5µL of My Taq HS DNA polymerase (Bioline, USA) and 33.5µL of nuclease free water for a total volume of 50µL per reaction. PCR assays were performed with cycle parameters set at 95℃ for 1 minute (1 cycle) and 35 cycles at 95℃ for 15 seconds followed by 53℃ for 15 seconds. The primers were as follows: forward 5’TTGCCCACA ACAACCTCATG 3’ and reverse 5’CCTACTTGGGTACTGCGGAA 3’ with a product size of 770 bp (GeneWorks, Australia). The PCR products were then sent for sequencing (MACROGEN, Seoul, Korea) and the sequences were assessed for the presence of the CT insertion.
Serum C4 concentration normal ranges (g/L)
Previously defined normal serum C4 mean concentrations and ranges 14 for two, three, four and five total C4 GCNs, respectively, were as follows: (0.197; 0.059–0.343), (0.256; 0.117–0.383), (0.296; 0.159–0.439) and (0.425; 0.279–0.571).
Data analysis
Sequences were analyzed using Geneious version 10 software. 17 Statistical analysis was performed using the program GraphPad PRISM 7 (GraphPad Software Inc, California, USA). Tests included Mann–Whitney ranking U-test, ANOVA (analysis of variance), Bland–Altman analysis and linear regressions. P values of <0.05 were considered statistically significant.
Results
Quantitation of serum C4 concentrations in SLE patients and controls
Serum samples for the SLE patients and controls were obtained at the time of recruitment. Serum [C4] for the SLE patients shows a non-Gaussian distribution with lower concentrations than the controls (Figure 1(a)). Mean [C4] shows statistically a significant difference between the groups (p = 0.0060; Figure 1(b)).
Serum[C4] in SLE patients and controls. (a) The figure shows the frequency distribution of the serum [C4] (x axis) for the SLE patients (dark bars) and the control cohort (light bars). (b) Distribution of [C4] showing the mean and standard deviation for each group; p = 0.0060 (Mann–Whitney rank test). Mean concentrations: SLE patients 0.1928 g/L (range 0.033–0.580); controls: 0.2342 g/L (range 0.072–0.415). Median concentrations: SLE patients 0.1664 g/L; controls 0.2350 g/L. Serum C4 concentrations (0.160–0.520 g/L) = reference ranges in the healthy population.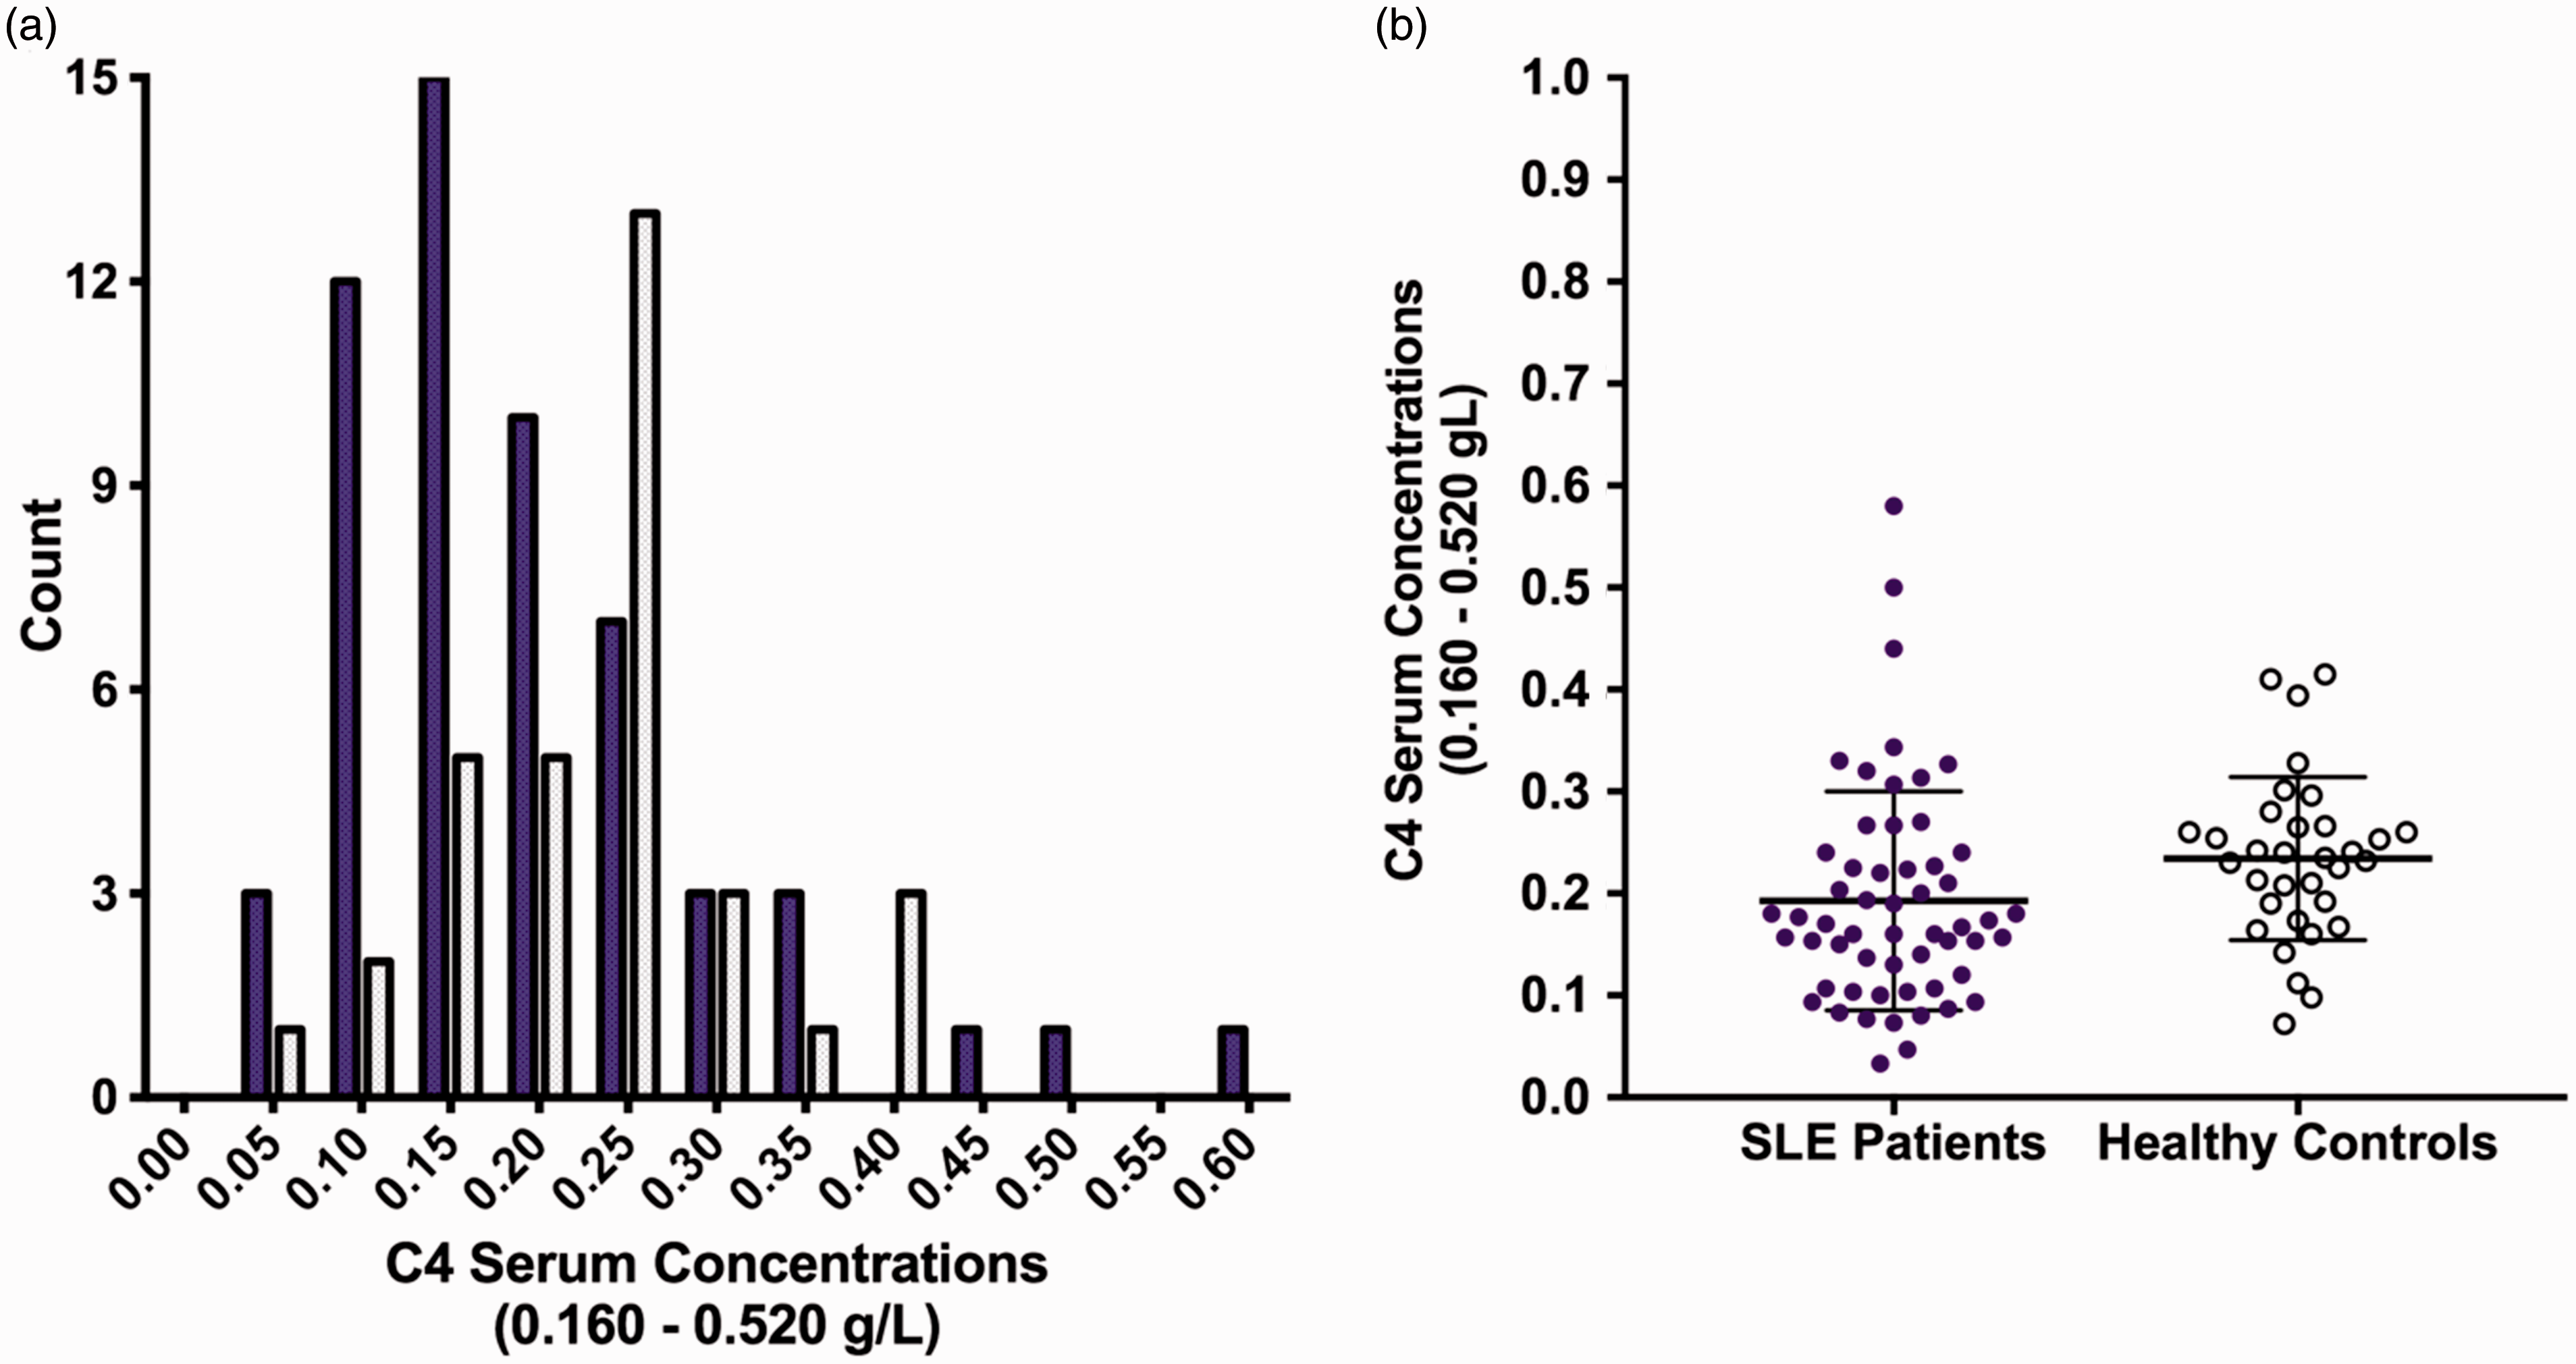
Measurement of C4 GCN
Summary table of the C4 protein and GCN quantitation data
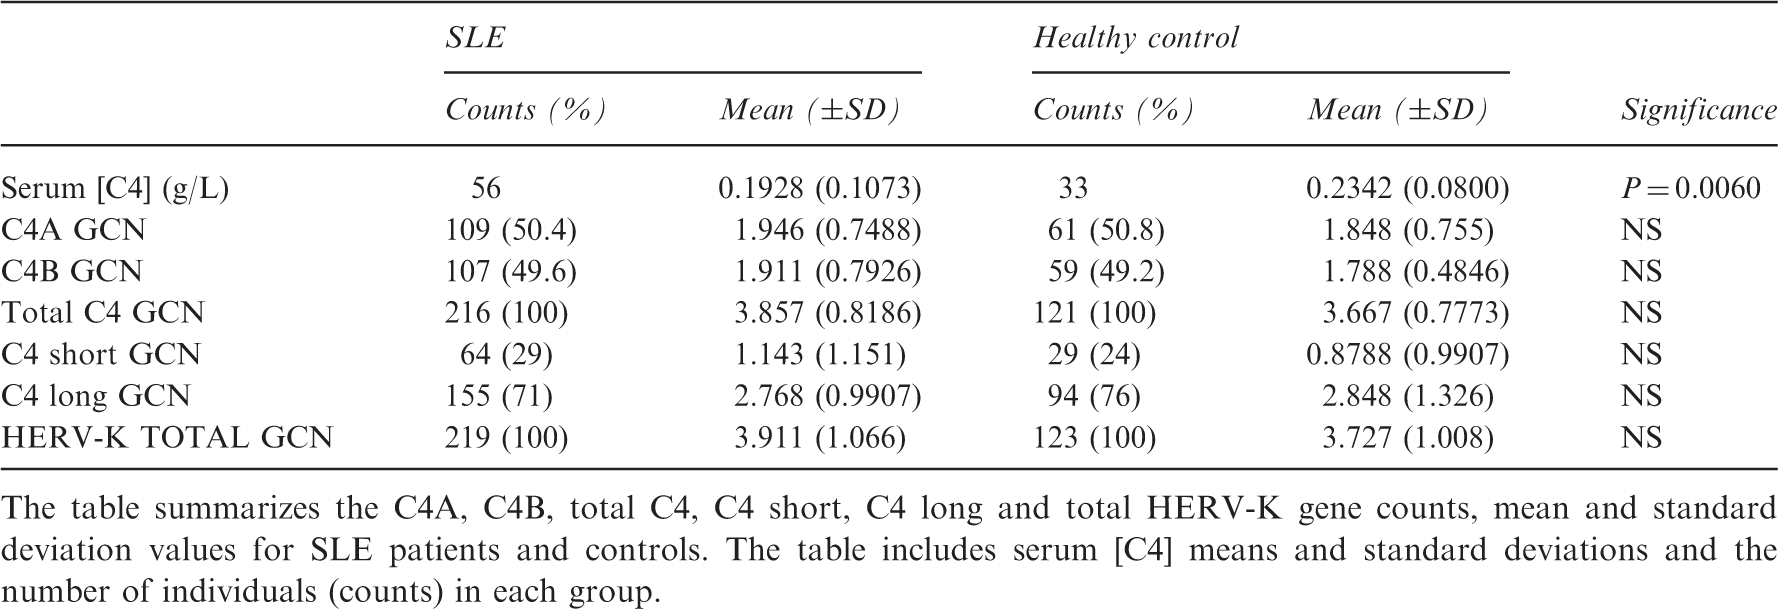
The table summarizes the C4A, C4B, total C4, C4 short, C4 long and total HERV-K gene counts, mean and standard deviation values for SLE patients and controls. The table includes serum [C4] means and standard deviations and the number of individuals (counts) in each group.
Comparison of C4 GCN by Taqman™ C4A and C4B assay and detection of the HERV-K retroviral insertion by custom Taqman™ assay
As would be expected, there was a good correlation between C4 GCNs by both methods (see supplementary Figure S2) in the SLE and control cohorts. There was also good ‘agreement’ in GCN count between the two methods, as determined by estimating the ‘bias’ between the two methods using the method of Bland and Altman (see below). Bias for the C4 GCN assays described herein was low (≈6%). Bias is defined as the average difference between the two methods of assay over the range of data; bias would be nil if there was perfect concurrence between methods. These data are shown in Figure 2 and supplementary Figure S1.
18
A Bland–Altman analysis plot of the difference versus average of the Taqman™ C4A + C4B and the Taqman™ Custom for HERV-K retroviral element in C4 genes assays. The figure shows the mean difference, i.e. bias (dashed line) and 95% confidence intervals (CI) of the limit of bias (dotted lines) between the two assays.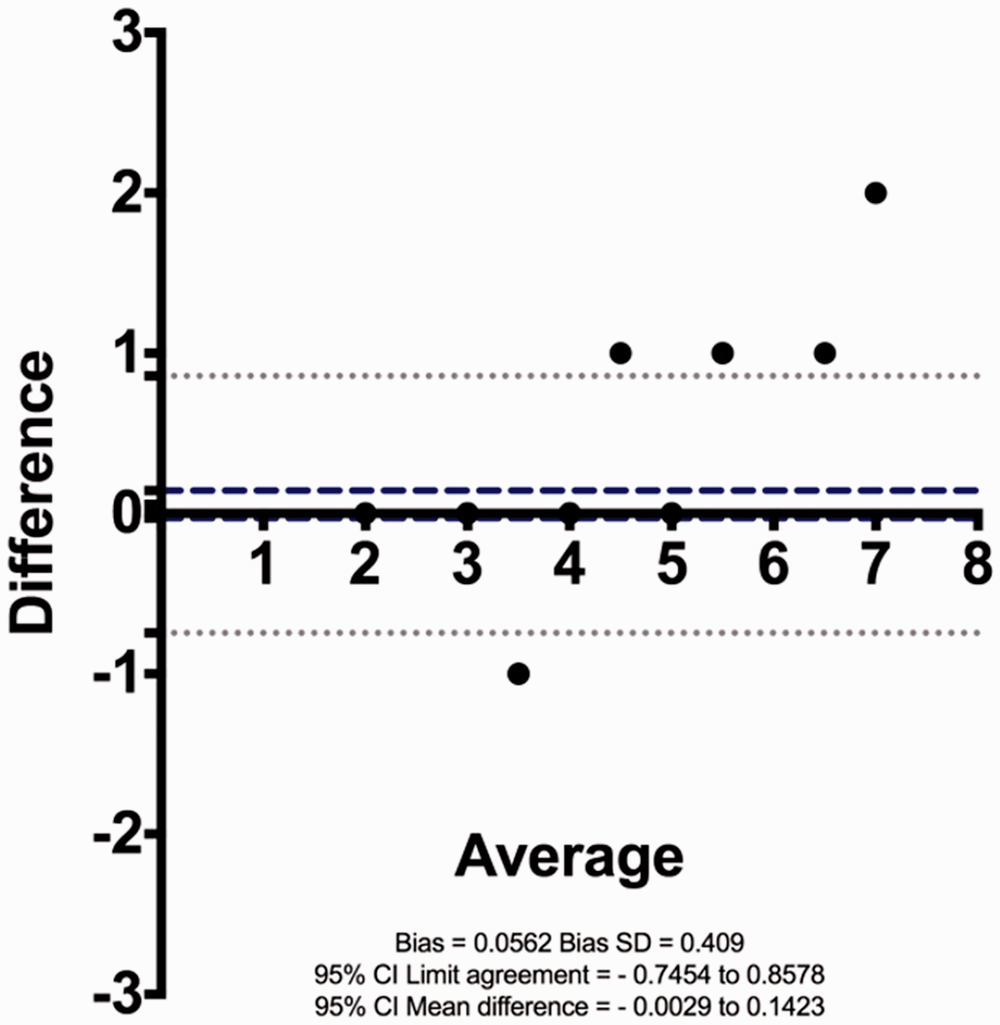
Distributions of C4A and C4B and C4 long and short genes in SLE patients and controls
Distributions of C4A, C4B and C4A + C4B with and without the HERV-K retroviral insertion are shown in Figure S3 together with comparable data from Yang et al. 2 The distributions of C4A, C4B and total C4 GCNs and of the long and short variants of these C4 genes were similar to those reported by Yang et al. and more recently by Chen and colleagues 19 in a predominantly East Asian population. No significant differences in GCN between SLE patients and control cohorts were found in our study.
HERV-K insertion is more frequent in C4A genes than C4B genes
Analysis of the 89 combined SLE patients and controls showed that ≈74% of the total C4 genes counted contained the HERV-K insertion. In contrast, the ratio of C4A to C4B genes was ≈1. When the 26 subjects without the HERV-K insertion, or individuals exhibiting only C4 genes with the HERV-K insertion
2
were analyzed, the proportion of C4A genes with the HERV-K insertion was 55%. This indicates that the HERV-K insertion is more frequent in C4A genes than C4B genes (1.25:1). Linear regression revealed a positive correlation between C4A genes and the presence of the HERV-K insertion (r = 0.561, p = 0.0001), while there was no significant correlation between C4A genes and the absence of the HERV-K insertion (r = 0.038, p = 0.726 NS). In contrast, absence of the HERV-K insertion correlated with the C4B gene (r = 0.473, p ≤ 0.0001). There was no significant correlation between C4B genes and the presence of the HERV-K insertion (see Figure 3 and Figures S4 and S5). These findings are consistent with those of Yang and colleagues who also reported a preferential association of the HERV-K insertion in C4A genes.2,19
Linear relationship between C4 long and C4A/C4B genes (top graphs), and C4 short with C4A/C4B genes (bottom graphs) for the 89 subjects in this study. Regression equations and r2 values are indicated on the graphs.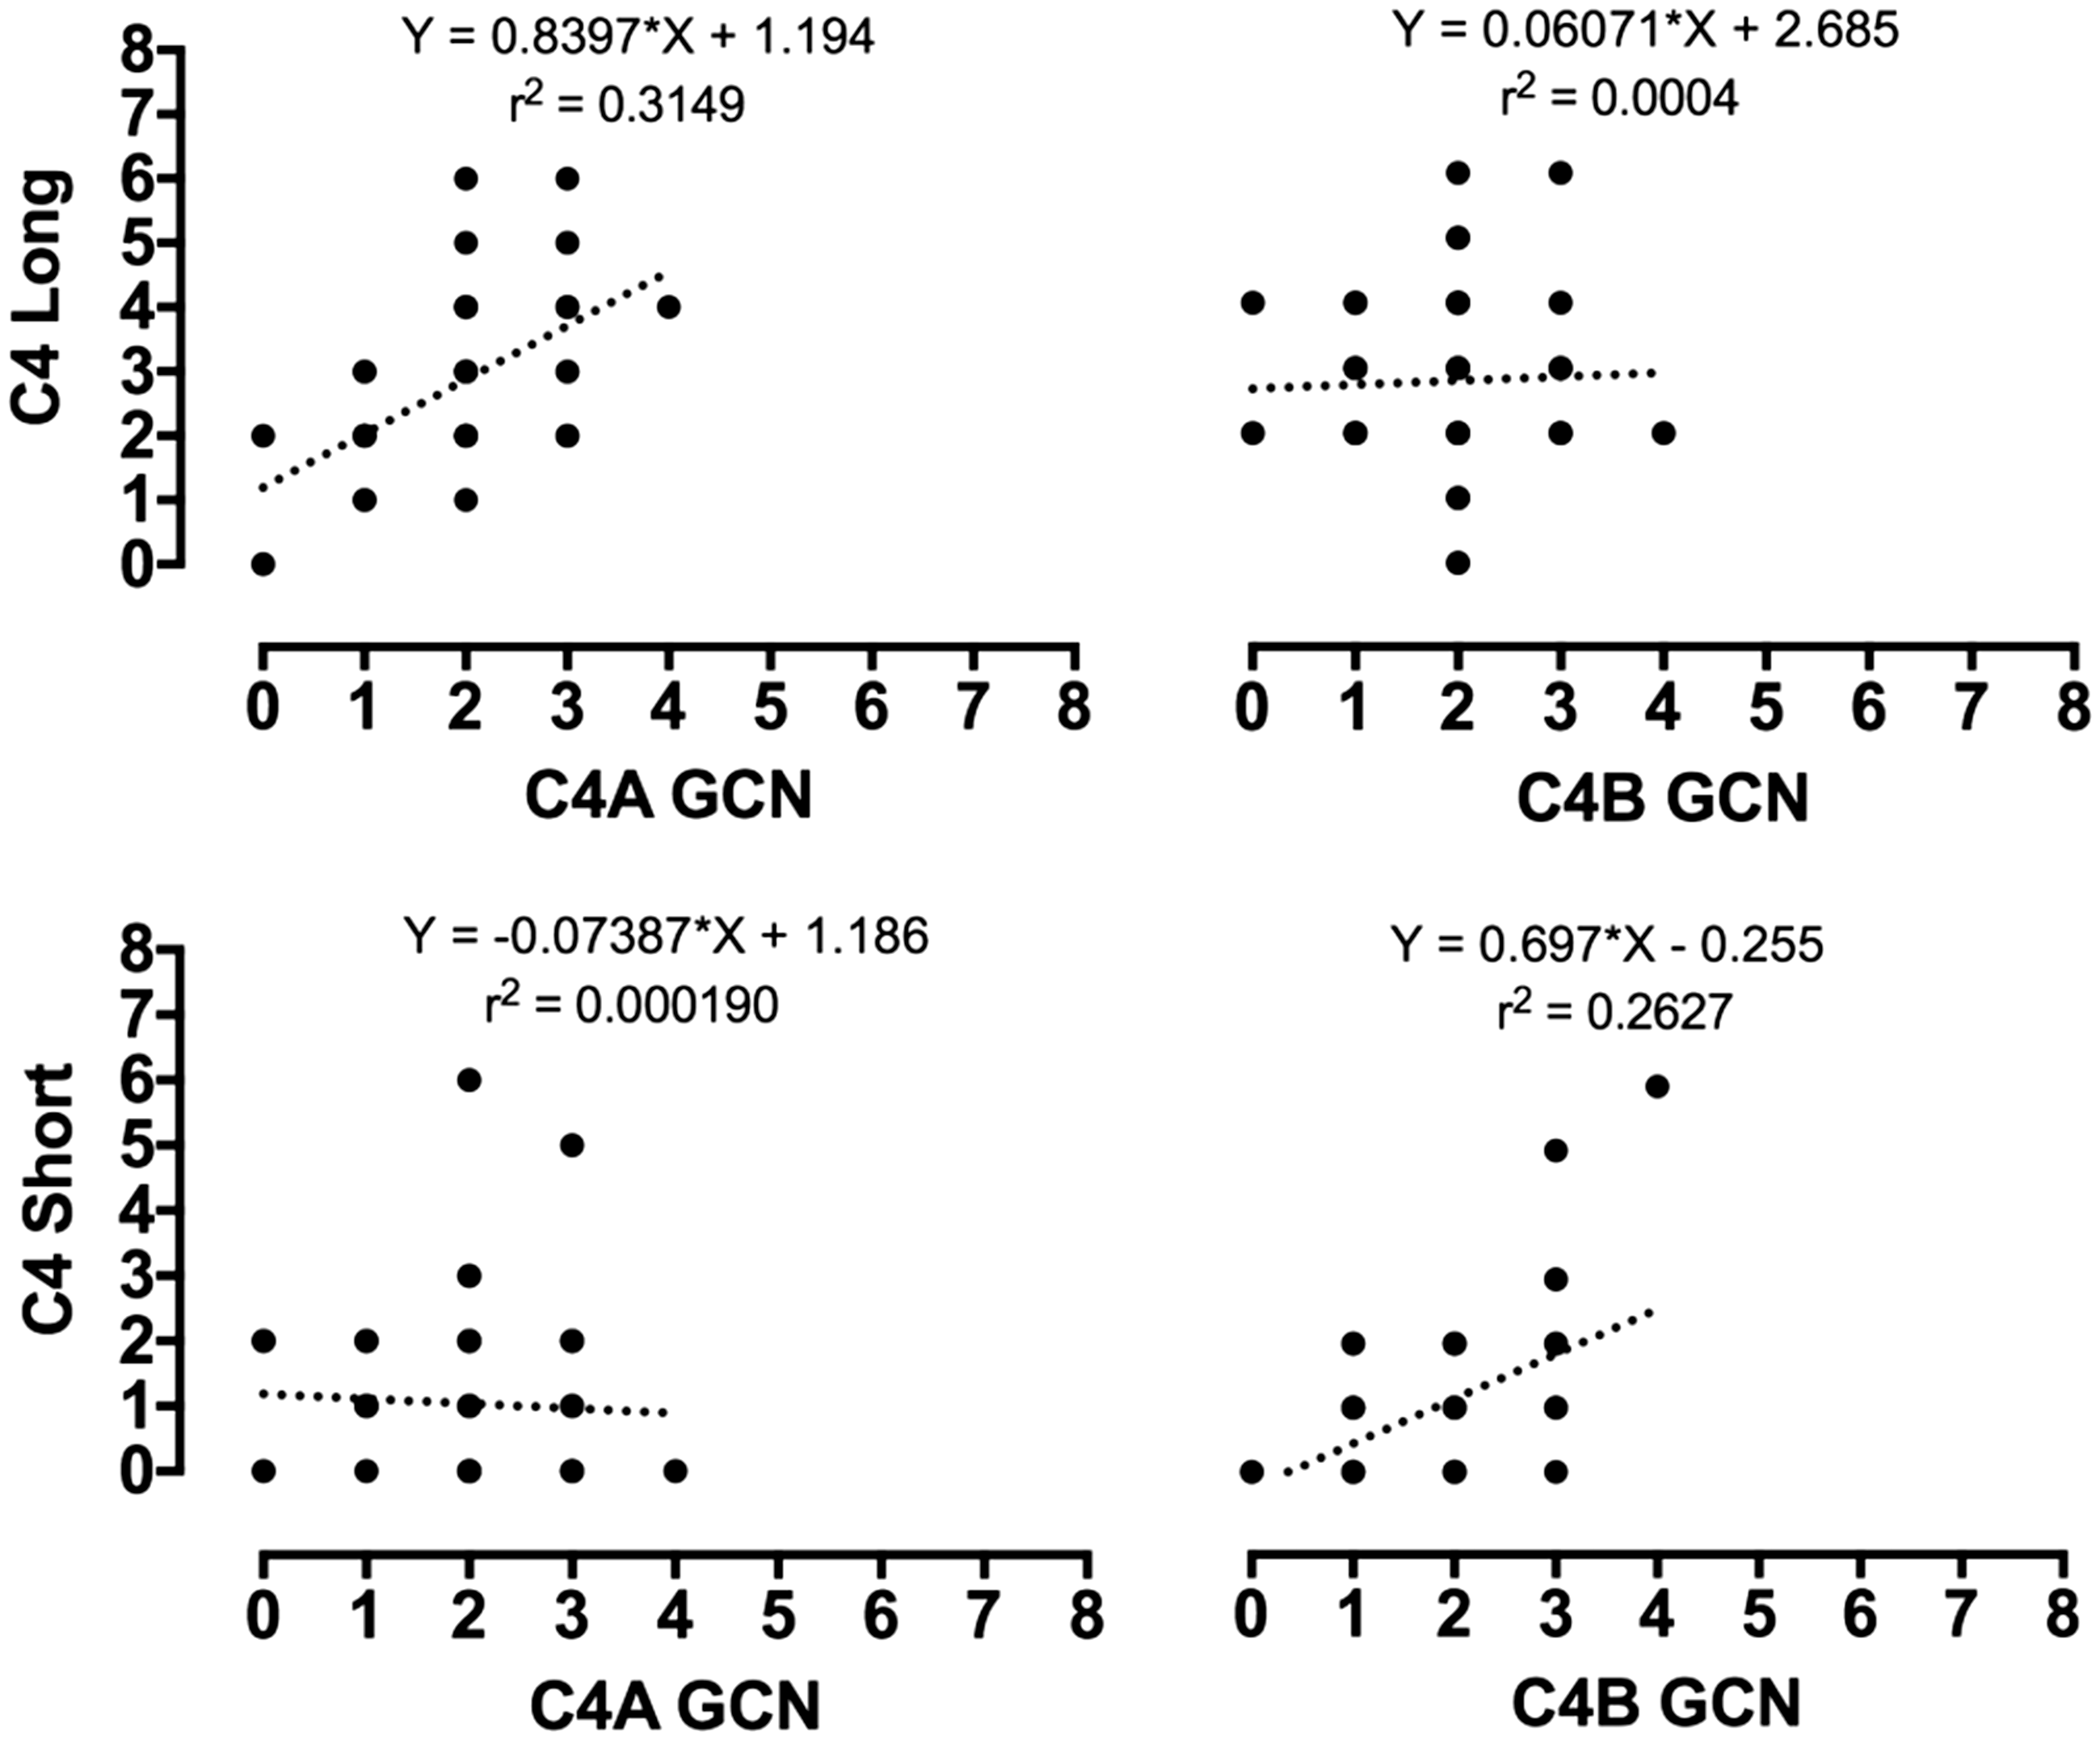
Serum C4 concentration as a function of GCN variation
The relationship between serum [C4] and C4 GCN in SLE patients and controls was investigated using regression analysis. The intercept of the regression line passes close to the origin with a coefficient of determination of ≈40% in healthy controls (y = 0.0647*X −0.003077). This is consistent with a linear overall relationship between serum [C4] and total C4 GCN with variability between individuals. If the data are aggregated within each GCN, the relationship once again is linear, passing through the origin indicating that (and for which) all variation in serum [C4] is accounted for by GCN (r2 = 99%; y = 0.06305*X +0.001332; Figure 4).
The figure shows a stratification of the gene copy number for total C4 (x axis) with serum C4 concentrations (y axis). The top graphs show the linear regression based on independent values whereas the bottom graphs are the mean values (aggregated) with standard deviation and 95% confidence intervals of the mean of the data. Serum C4 concentrations (0.160–0.520 g/L) = reference ranges in the healthy population.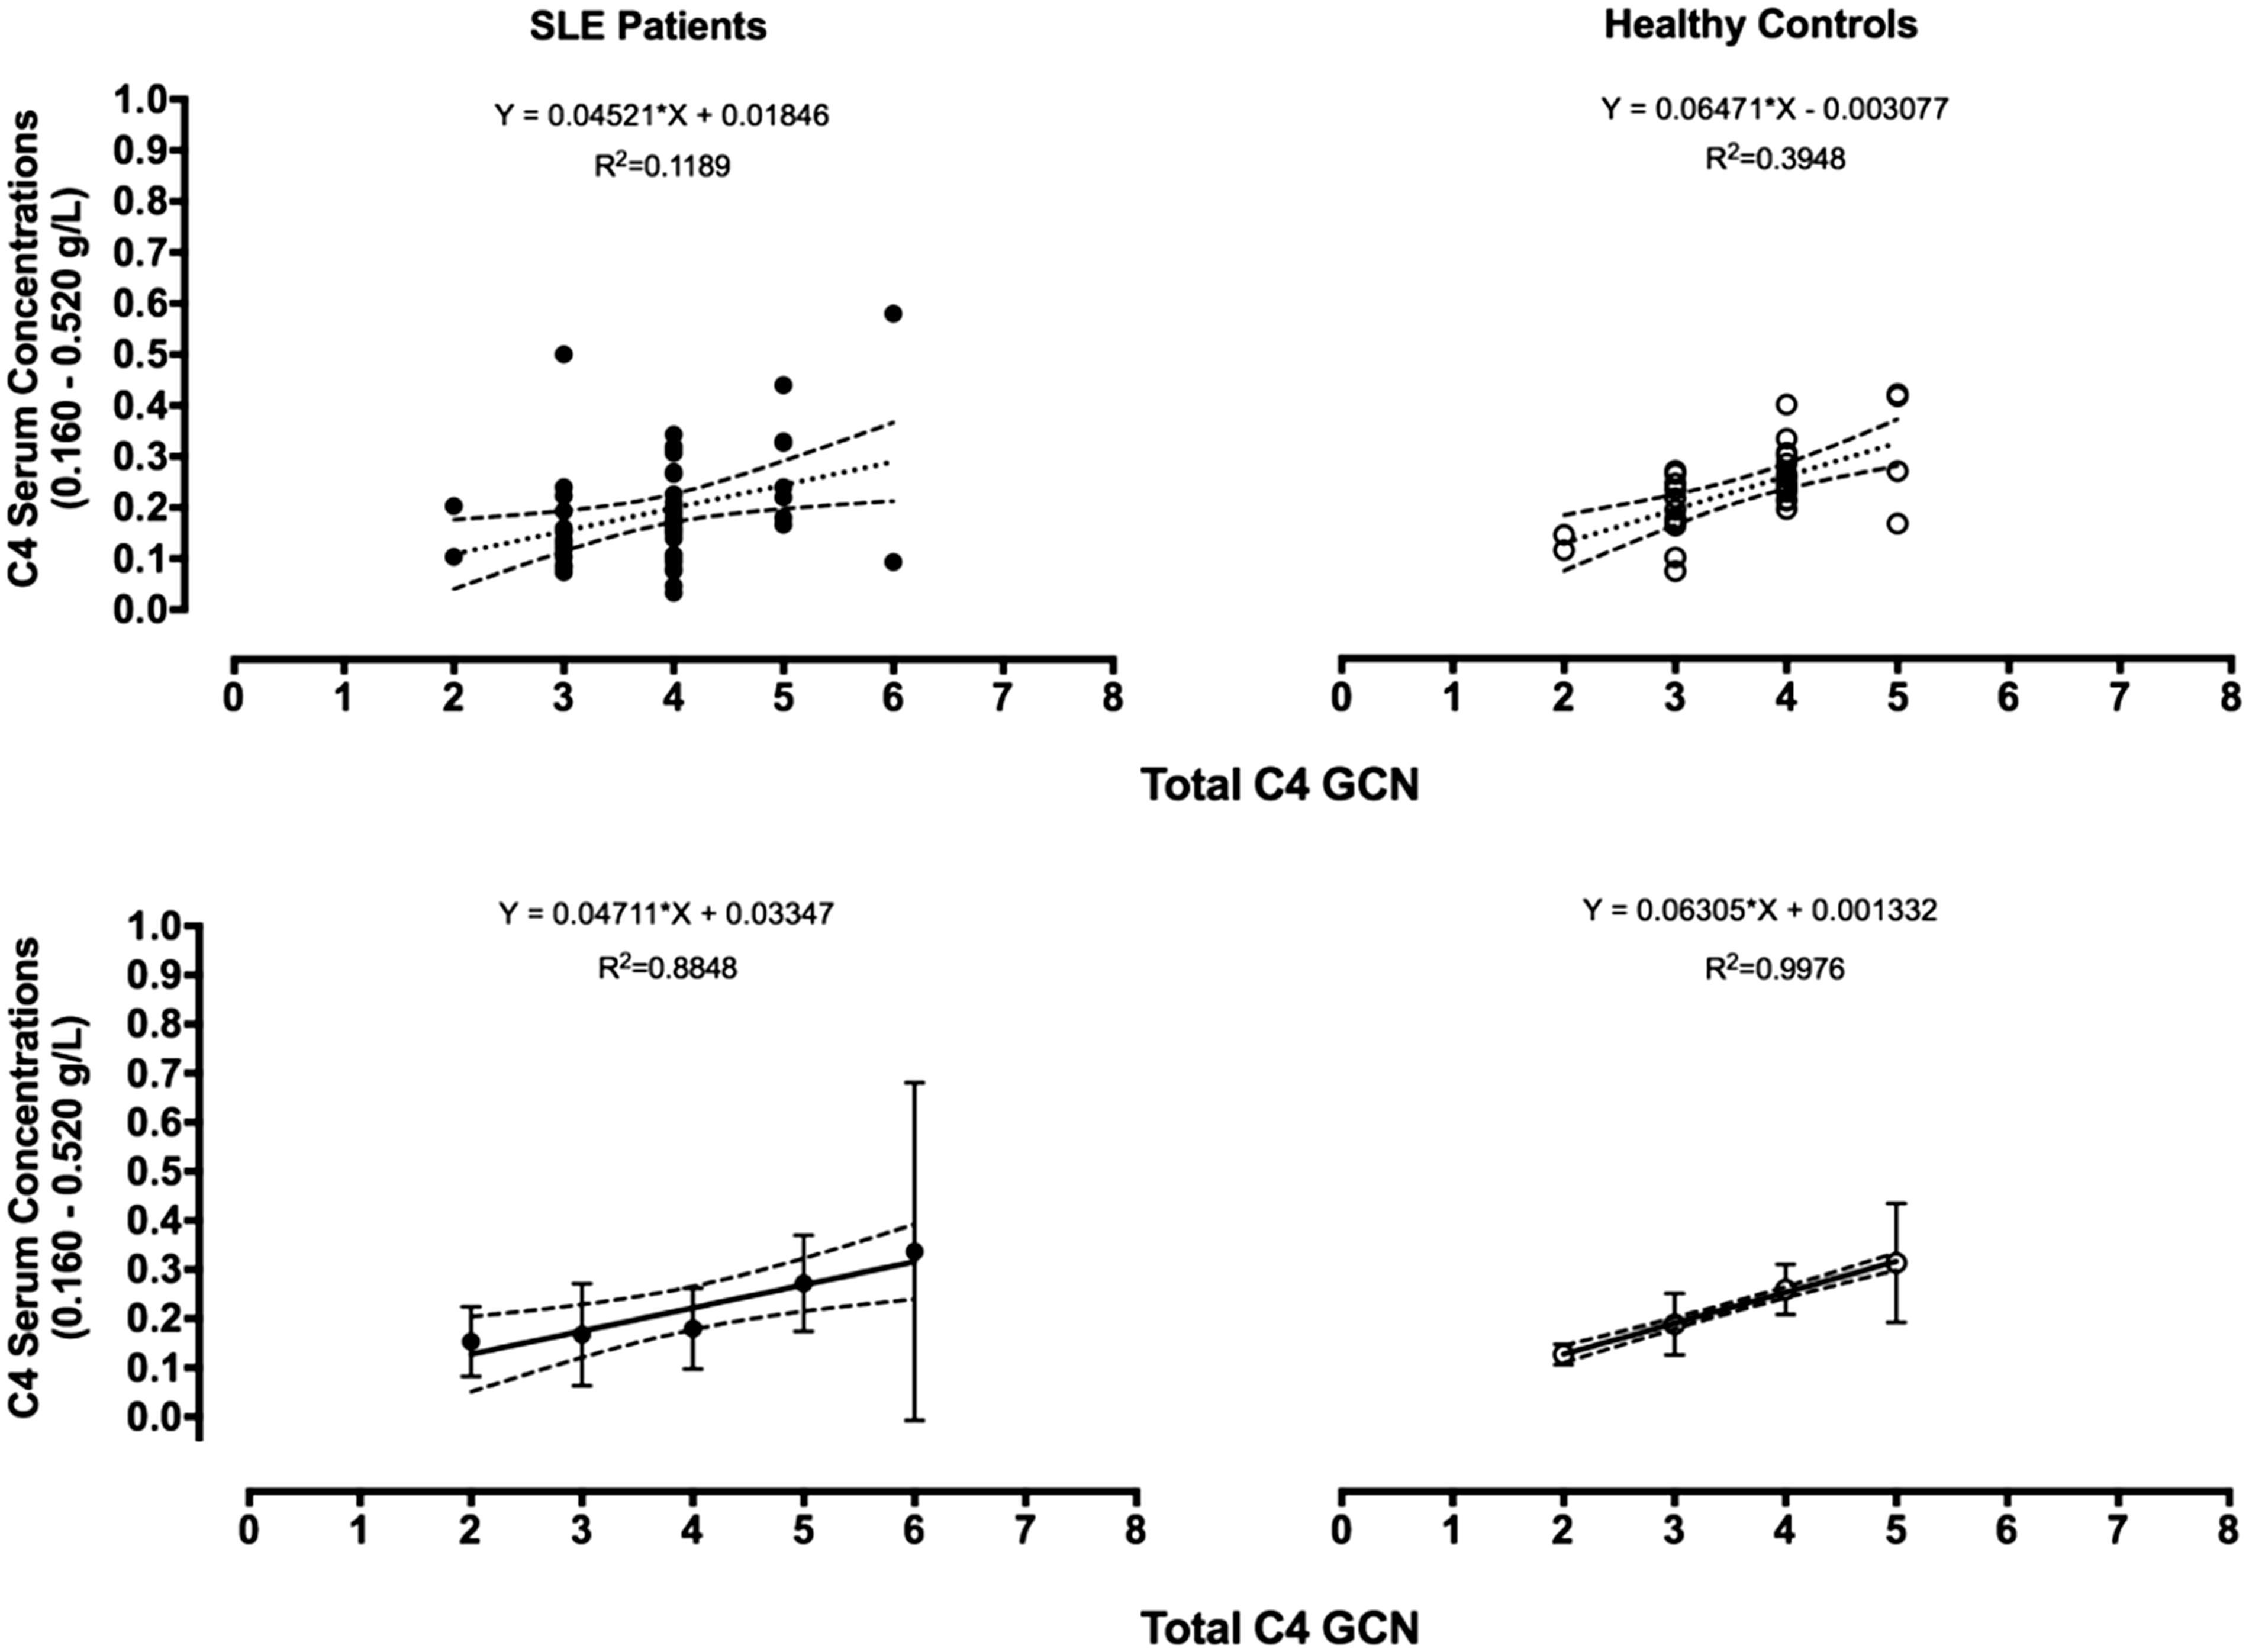
An equivalent analysis in 56 SLE patients revealed a similar relationship but with increased individual variation in [C4]. In this analysis, ≈12% of the variability in individual serum [C4] was accounted for by total C4 GCN (y = 0.00452*X + 0.01846), while for the aggregated data 88% of the variation in [C4] was related to C4A + C4B GCN (y = 0.04711*X +0.03347; Figure 4).
The relationship between serum [C4] and C4 genes with the insertion of the HERV-K retroviral element (long) in SLE patients and controls (aggregated data) was investigated using regression analysis. The intercept of the regression line passes close to the origin with a coefficient of determination of ≈25% (y = 0.04461*X −0.01661; Figure S6). This is consistent with a linear relationship between serum [C4] and C4 long with variation between. If the data are aggregated within each GCN, the relationship once again is linear, passing through the origin (and for which) all variation in serum [C4] is accounted for by GCN (r2 = 98%; y = 0.04524*X +0.02175; Figure S6). Interestingly, a Mann–Whitney analysis (Figure S6) demonstrated no significant difference in the mean GCN of the C4 genes with the HERV-K element within this subgroup (p = 0.9595). However, the analysis demonstrated a statistically significant difference between the mean [C4] of the two subgroups (p = 0.0087) with the SLE patients demonstrating much lower serum concentrations.
The serum C4 concentrations in previously established ranges for two, three, four and five C4 GCN
We have previously established serum C4 concentration reference ranges for the C4 GCN.
14
We compared the data obtained herein with our previously reported data and found that the mean serum C4 concentrations were generally within the ranges previously established in both cohorts with individual variations (see Figure 5). In the SLE cohort, 27 (48%) patients have serum C4 concentrations below the internationally used normal range (0.160–0.520 g/L). Of these 27 individuals, only 16 (28%) have a serum [C4] that is still lower than our previously defined ranges (for the C4 GCN determined). One of these patients with quiescent disease activity has a total of six C4 genes (for which we have no ranges) and a chronically low serum [C4] of 0.0933 g/L together with a low serum C3 concentration. However, the antibody profile for anti-C1q, ANA and dsDNA is within the reference range. Therefore, chronically low serum C4 concentrations in this patient are likely to be attributed to other factors.
The figure shows a stratification of the total C4 gene copy numbers (x axis) for the SLE patients and control cohort (as indicated on the graph) with serum C4 concentrations (y axis) as well as the previously defined normal reference ranges
14
for two, three, four and five GCNs. Data shown indicate mean values for the SLE and control cohort, and mean values and standard deviations for the ranges previously described.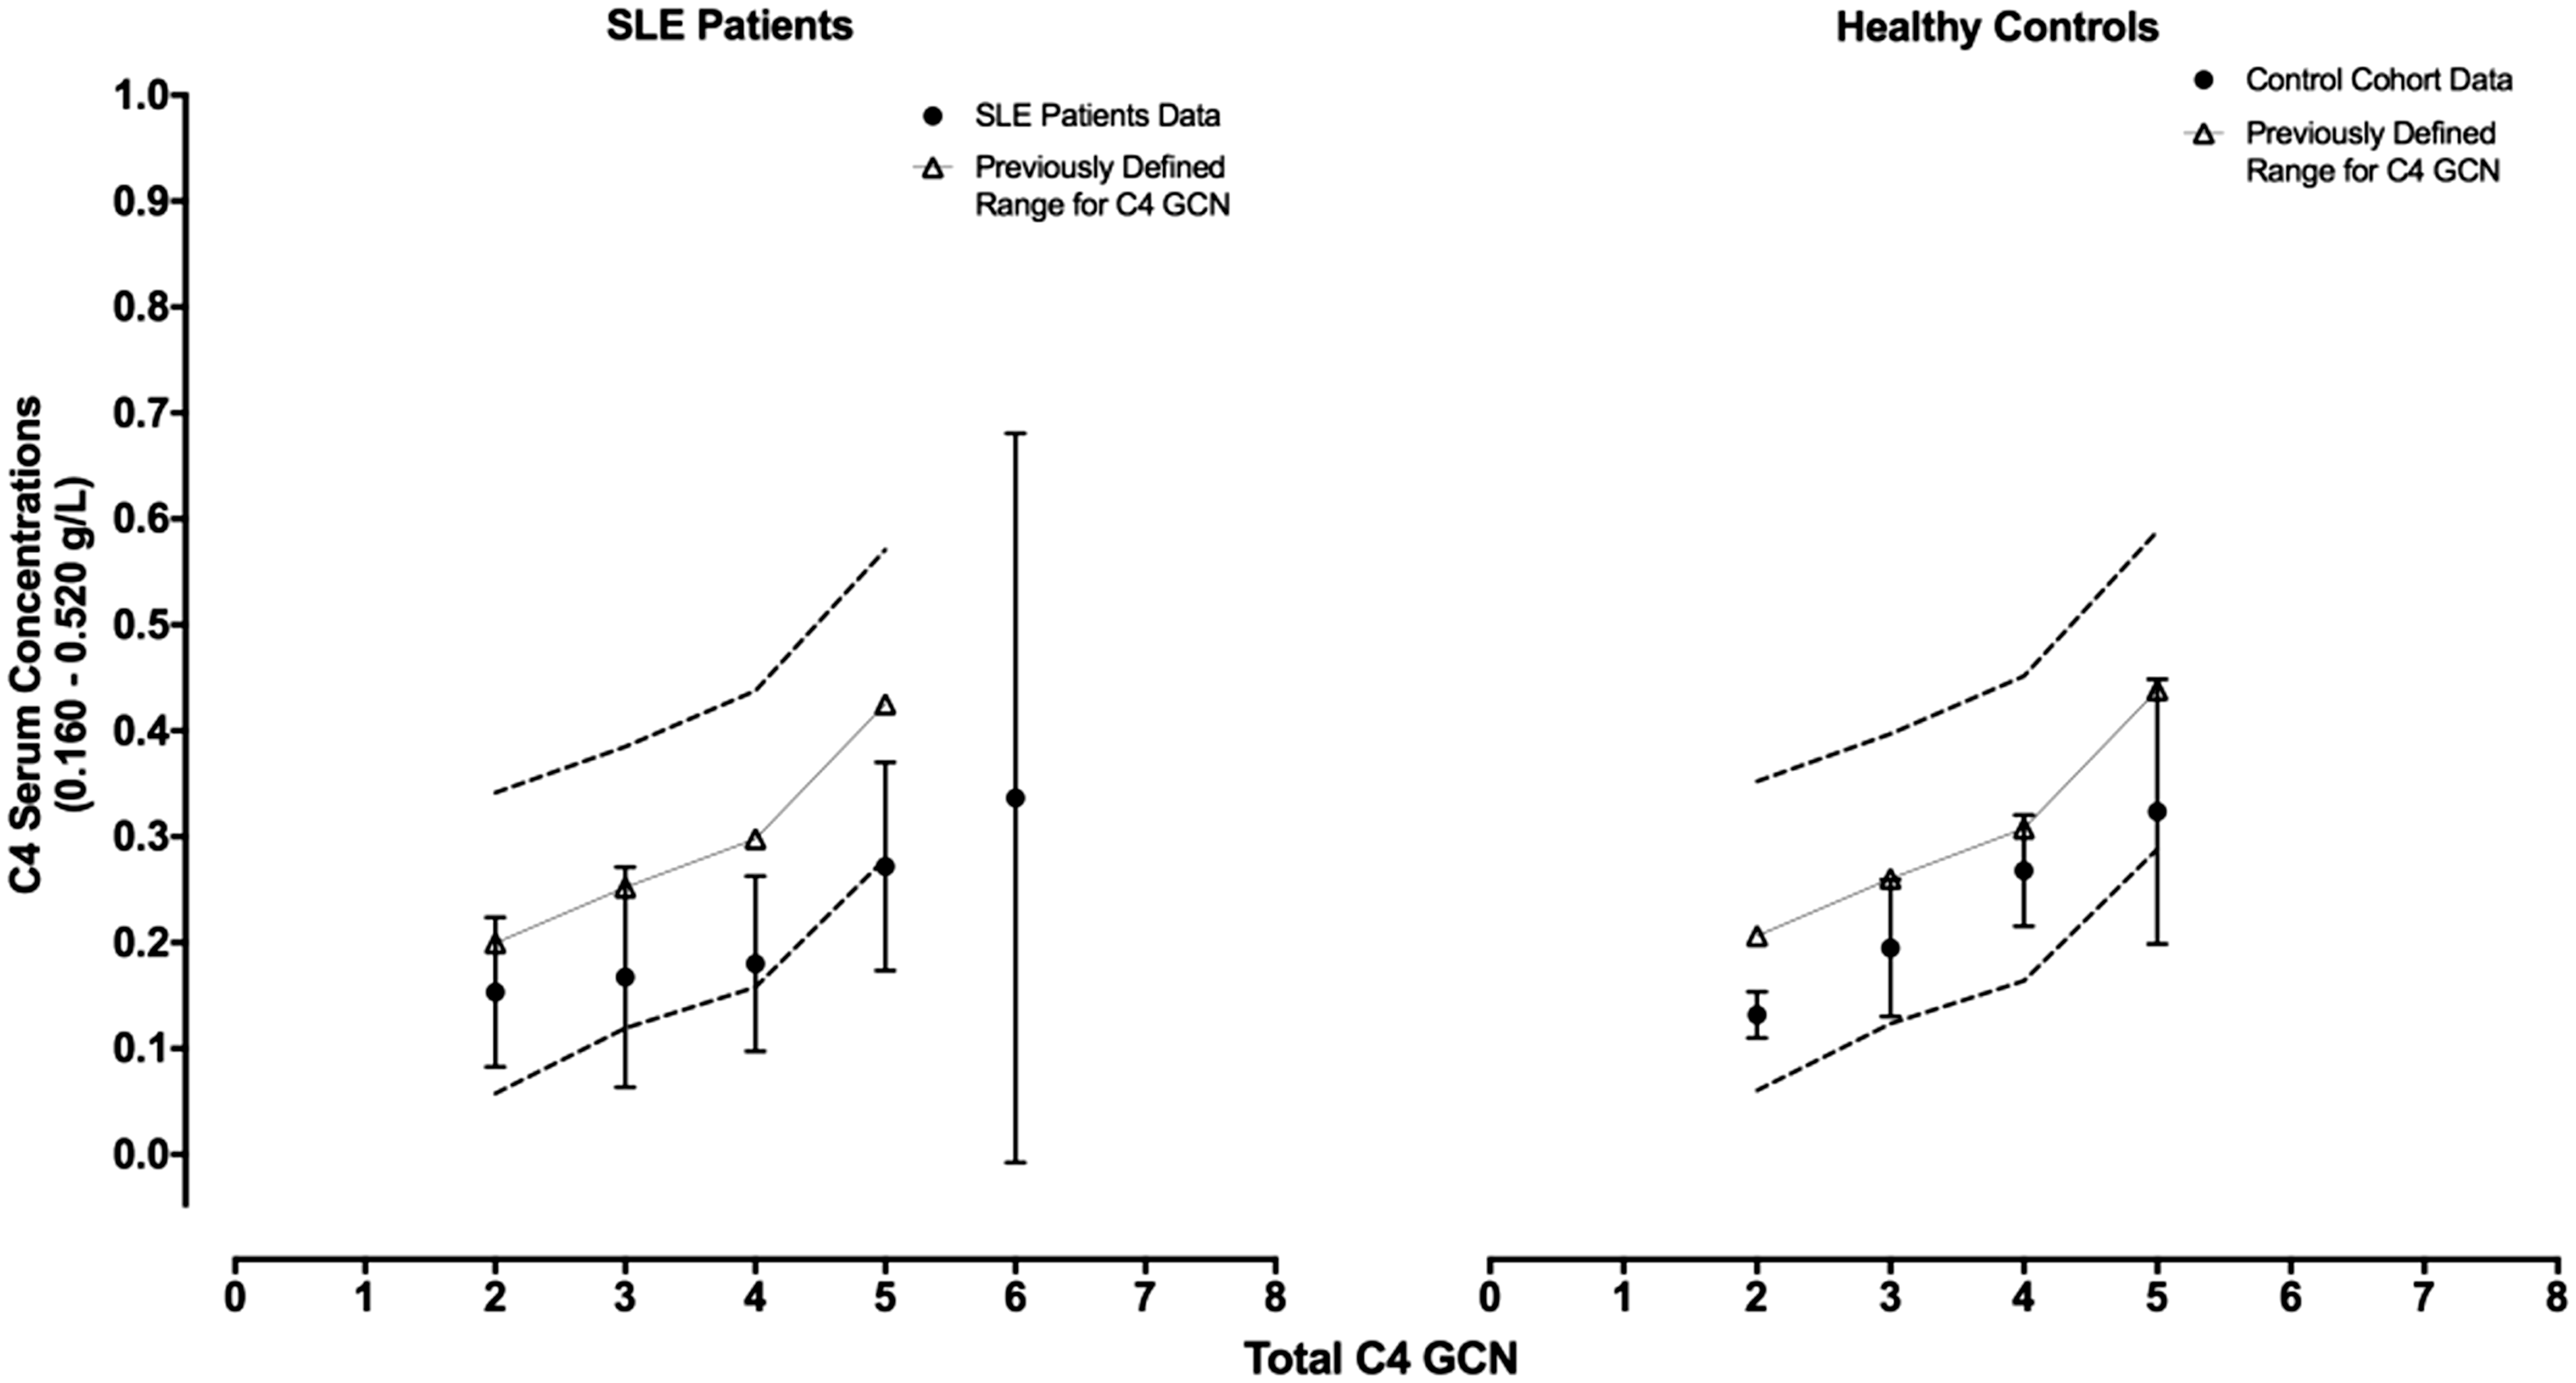
The CT insertion is not a risk factor in the Western Australian population
All 89 subjects were tested for the presence of the CT insertion in exon 29 of C4 genes, presence of which precludes C4 protein synthesis. 20 Only one of 56 SLE patients (1.8%) and no healthy controls was shown to have this insertion.
Discussion
Decreased serum concentrations of complement component C4 have long been a valuable aid in the diagnosis and management of SLE. 21 The presence of two polymorphic C4 genes, designated C4A and C4B, within the central MHC has added much interest to the role of these proteins in the pathogenesis of SLE. 22 Further, interpreting serum [C4] in the diagnosis and management of SLE may be difficult because low concentrations may reflect consumption or low GCNs and/or the presence of null alleles. 21 In this study, serum C4 concentrations were significantly lower in 56 confirmed SLE patients than in 33 sex- and age-matched controls (p = 0.006). Importantly, there was no evidence that lower serum C4 concentrations in the SLE cohort was due to paucity of C4A and/or C4B GCNs. Only one SLE patient was C4A-gene-deficient compared with two control individuals; there were two SLE patients and no control individuals deficient in C4B genes. Our results do not support C4A deficiency being a risk factor for SLE, although this link was expected. This conclusion differs from the reports by Yang et al. and Chen and co-workers2,19 who identified C4A deficiency as a risk factor for SLE in both American and East Asian populations. However, an extensive investigation by Boteva and colleagues 13 demonstrated that partial C4A or C4B gene deficiencies and the loss-of-function exon 29 CT insertion were not risk factors predisposing to SLE in large United Kingdom and Spanish cohorts. We suggest that C4A deficiency and the presence of the exon 29 CT insertion may be ethnicity-restricted risk factors for SLE and that the generality of these genetic predispositions should be subject to further confirmation. Further, there was no evidence that the presence of the HERV-K insertion in either C4A or C4B genes was associated with decreased serum C4 concentration in these Western Australian cohorts. This observation differs from earlier reports proposing that the presence of the HERV-K retroviral element decreases the rate of C4 transcription and therefore serum C4 concentration. 8 Clinically low serum C4 concentrations can be explained by immune complex-mediated activation of the classical complement pathway with subsequent loss of C4 protein in tissues where the rate of consumption is higher than that of synthesis. 22 Low serum C4 concentrations in SLE patients may result therefore from ongoing consumption and hence represent a measure of autoimmune pathology.
This work confirms other reports that C4A genes are preferentially associated with the presence of the HERV-K retroviral element relative to C4B genes (with the absence of the insertion). 8 There were no significant differences between the SLE and control cohorts in mean number of C4A, C4B, C4A + C4B genes and C4 genes with and without the HERV-K insertion. Mean C4 concentrations in persons with long C4 genes, and short C4 genes, were not significantly different (see Figure S5).
The positive correlation between C4A genes and the presence of the HERV-K insertion in the combined cohorts contrasted with the lack of correlation between C4A genes and the absence of the HERV-K insertion. Correspondingly, the absence of the HERV-K insertion correlated positively with the C4B gene and contrasted with absence of any significant correlation between C4B genes and the presence of the HERV-K insertion.
Previous reports20,23 have indicated the presence of a CT insertion in exon 29 that leads to non-functional C4A and C4B genes. Only one SLE patient (and no control persons) in this study was shown to have the CT insertion in exon 29. These data agree with the results of Boteva et al., 13 described above, and also of Puah and colleagues 24 who found no evidence for associations between SLE and the CT insertion (as well as three other known mutations in exons 13 and 20) in C4 genes in the Malaysian population.
Two independent methods were used to count C4 GCNs in all subjects tested. These was a commercial TaqMan™ assay that detected nucleotide sequences specific for either C4A or C4B and a custom quantitative PCR assay that detected the presence or absence of the ≈6.4-kb retroviral HERV-K insertion in intron 9 of both C4A and C4B genes. Good agreement between both methods was observed for total C4 gene counts, although the total count by the HERV-K method showed a GCN-dependent positive bias relative to the C4A & B total GCN. We reported previously that the TaqMan™ assay tends to underestimate total C4 GCNs when there are ≥three C4A or C4B genes per person tested. 14 Wu and colleagues reported similar observations 16 whereby at high GCN of C4A/C4B/C4 short and/or C4 long genes the TaqMan™ assay reported equivocal results with a propensity to underestimate GCN. Laboratory manipulation of DNA, including repeated freeze-thawing, may compromise the quality and quantity of DNA tested14,16 in these technically exigent assays, especially when high GCNs are present. Nevertheless, as shown by the Bland–Altman analysis, the bias in the data is relatively small (≈6%) and both assays were in complete agreement around median values for GCN.
It was of considerable interest that serum C4 concentrations in SLE patients and healthy controls correlated strongly with the C4A and C4B GCNs. In SLE patients and healthy controls, approximately 88% and 99%, respectively, of the variability in serum C4 concentrations could be attributed to C4 GCNs despite considerable individual variability in [C4]. This result indicates that for healthy persons expected serum C4 concentrations may be estimated from GCN. While a similar relationship exists in SLE patients, the co-existence of a pathological process consuming C4 may result in more variable serum [C4] such that GCN is not a reliable predictor of concentration for individual SLE patients; however, in conjunction with the serum [C4] expected reference ranges, it may still provide insights into disease management of SLE patients with well-managed disease. The results of this study are consistent with and supplement our earlier study of C4 GCNs in the WA Busselton population. 14 A direct correlation between GCN and protein concentration in body fluids is the default expectation unless other mechanisms act to distort this relationship. For example, it has long been known that serum C2 concentrations are proportional to the number of expressed genes for this single dimorphic locus. 25 Pouw and colleagues have also shown that the complement factor H-related protein 3 serum levels are determined by GCN variation at the CFHR3 locus. 26 In this respect, the complex C4 genomic locus behaves similarly to other gene systems where protein synthesis correlates with GCN variation.
In conclusion, this report confirms the utility of serum [C4] in the diagnosis and management of SLE. Low C4 concentrations relative to C4 GCN are best explained by a mechanism involving consumption of C4 protein rather than decreased synthesis. Paradoxically, individuals manifesting complete deficiency in both C4A and C4B genes (a rare phenomenon 27 ), and consequently lacking C4 protein, are also predisposed to SLE. Hence, in these individuals, the mechanisms resulting in the symptoms of SLE must exclude consumption of complement C4 protein. There is no evidence from this study that C4A GCN, the presence of the CT insertion, and/or the HERV-K insertion are significant risk factors for SLE.
Supplemental Material
Supplemental material for Insights on the relationship between complement component C4 serum concentrations and C4 gene copy numbers in a Western Australian systemic lupus erythematosus cohort
Supplemental material for Insights on the relationship between complement component C4 serum concentrations and C4 gene copy numbers in a Western Australian systemic lupus erythematosus cohort by A A Margery-Muir, C Bundell, J D Wetherall, R Whidborne, P Martinez and D M Groth in Lupus
Footnotes
Acknowledgments
We acknowledge and thank the Goodeye Foundation (WA), the Australian Government Research Training Program Scholarship and Curtin University (Bentley, Western Australia) for their contribution in supporting this project.
Declaration of conflicting interests
The authors declared no potential conflicts of interest with respect to the research, authorship, and/or publication of this article.
Funding
The authors disclosed receipt of the following financial support for the research, authorship, and/or publication of this article: The authors received no financial support for the research, authorship, and/or publication of this article.
References
Supplementary Material
Please find the following supplemental material available below.
For Open Access articles published under a Creative Commons License, all supplemental material carries the same license as the article it is associated with.
For non-Open Access articles published, all supplemental material carries a non-exclusive license, and permission requests for re-use of supplemental material or any part of supplemental material shall be sent directly to the copyright owner as specified in the copyright notice associated with the article.