
Abstract
Renal injury in lupus nephritis (LN) does not manifest as one uniform entity. The clinical presentation, management, and prognosis of membranous LN (MLN) differ from that of the proliferative LN (PLN). Differentiating the molecular mechanisms involved in MLN and PLN and discovering the reliable biomarkers for early diagnosis and target therapy are important. We compared the kidney protein expression patterns of 11 pure MLN and 12 pure PLN patients on formalin-fixed paraffin-embedded (FFPE) kidney tissues using label-free liquid chromatography-mass spectrometry (LC-MS) for quantitative proteomics analysis. FunRich software was used to identify proteins in differentially expressed pathways. Quantitative comparisons of differentially expressed proteins in each patient were further analyzed based on protein intensity levels determined by LC-MS. The protein–protein interaction (PPI) network of the differentially expressed genes (DEGs) was established through Search Tool for the Retrieval of Interacting Genes database (STRING) website, visualized by Cytoscape. A total of 5112 proteins were identified. In total, 12 significantly upregulated (fold change ≥2, p < 0.05) proteins were identified in the MLN group and 220 proteins (fold change ≥2, p < 0.05) were upregulated in the PLN group. Further analysis showed that the most significant upregulated pathway involved in MLN was histone deacetylase (HDAC) class I pathway, and the three most significant upregulated pathways in PLN were interferon signaling, interferon gamma signaling, and the immune system. Next, we selected sirtuin-2 (SIRT2) in MLN, and vascular cell adhesion protein 1 (VCAM1) and Bcl-xl in PLN for further mass spectrometry (MS) intensity and PPI analysis. SIRT2 expression was significantly increased in the MLN group compared with the PLN group, and VCAM1, Bcl-xl expression was significantly increased in the PLN group compared with the MLN group, based on MS intensity. These results may help to improve our understanding of the underlying molecular mechanisms of MLN and PLN and provide potential targets for the diagnosis and treatment of different subclasses of LN.
Introduction
Lupus nephritis (LN) affects approximately 40%–70% of patients with systemic lupus erythematosus (SLE) and is an important driver of mortality and morbidity in SLE. 1 Clinical manifestations in LN include hematuria, proteinuria, or decreased renal function. Renal biopsy is essential to confirm the diagnosis of LN, establish pathologic patterns, evaluate disease activity, guide therapeutic strategy, and provide information about prognosis. 2 The 2003 International Society of Nephrology/Renal Pathology Society (ISN/RPS) classification system for LN recognized six different classes of lupus glomerulonephritis and provided an unequivocal description of the various lesions. 3 In the released 2018 ISN/RPS classification, new definitions were provided, and some terms, such as endocapillary proliferation, were eliminated. 4
Membranous LN (MLN), known as ISN/RPS class V LN, is characterized by glomerular subepithelial deposits, whereas proliferative LN (PLN) or ISN/RPS class III and class IV LN is characterized by heavy immune complexes deposition in the mesangium and subendothelial spaces. 5 Pure MLN has distinct clinical presentations compared with PLN. The former mainly reflected in the clinical presentations of nephrotic syndrome or subnephrotic proteinuria, whereas the latter is predominantly being dominated by a nephritic process. 6 MLN is managed generally with antiproteinuric and antihypertensive medications and in some situation immunosuppressants. 7 In contrast, PLN is recommended to be initially treated with potent immunosuppressive agents. 5 Regarding prognosis, compared with MLN, PLN has a worse renal prognosis given the risk of progression to end-stage renal disease. However, MLN still have a high probability of transition into PLN.6,8
Studies reported proteins related to specific histopathlogical classes in LN were limited. Based on immunohistochemistry (IHC) of kidney samples from LN patients, Rezende et al. found that the expression of several molecular markers of podocytes was lower in proliferative forms of LN than in MLN, reinforcing the possibility that the PLN caused more severe structural podocyte damage. 9 Researchers found that Cmaf-inducing protein (CMIP), which induces podocyte signaling disorders, was selectively expressed in the cytoplasm compartment of podocytes in class II and class V glomerulopathies rather than proliferative forms. 10 In addition, the lack of CMIP expression might be due to NF-κB activation, which is known to repress CMIP expression. 11 Based on the differences between the two subtypes of LN, it is critically important and highly necessary to differentiate the underlying molecular mechanisms.
Large proteomics analyses have been attempted for diagnosis and treatment for the LN with a significant number of biomarkers being found. 12 However, due to the heterogeneous nature of LN, the class-specific panel of biomarkers involved in biologically relevant pathways might be more meaningful, which also remained as a knowledge gap to be addressed.
Mass spectrometry (MS)-based proteomics analyses help direct identification and quantification of thousands of proteins/peptides in tissue or body fluids samples. 13 Filter-aided sample preparation (FASP) utilizes centrifugal ultrafiltration devices for protein purification and digestion, efficiently generating high purity of tryptic peptides. 14
Herein, in order to differentiate more precise molecular mechanisms between MLN and PLN and identify the reliable biomarkers for early diagnosis and possible target therapy, we performed FASP protocol combined with a single LC-MS run analysis to quantitatively compare kidney samples between patients with MLN and PLN. The study may improve our comprehension of the underlying molecular pathogenesis involved in these conditions.
Material and methods
Patients’ samples
Renal biopsies of 23 LN patients from Peking University First Hospital between 2012 and 2015 were included for primary proteomic analysis. The lesions were assessed according to the 2003 ISN/RPS Classification. 3 In total, 12 patients were classified with PLN (4 with pure focal proliferative class III; 8 with pure diffuse proliferative class IV), and 11 patients were classified with pure membranous class V. For the next validation process by immunofluorescence, another 14 LN patients in our center were enrolled, including seven PLN and seven MLN patients. We conducted our studies in compliance with the Declaration of Helsinki. The design of this work was approved by the local ethics committee of Peking University First Hospital (No. 2017 (1333)). The written informed consents were obtained from all participants.
Clinicopathological evaluations of lupus nephritis
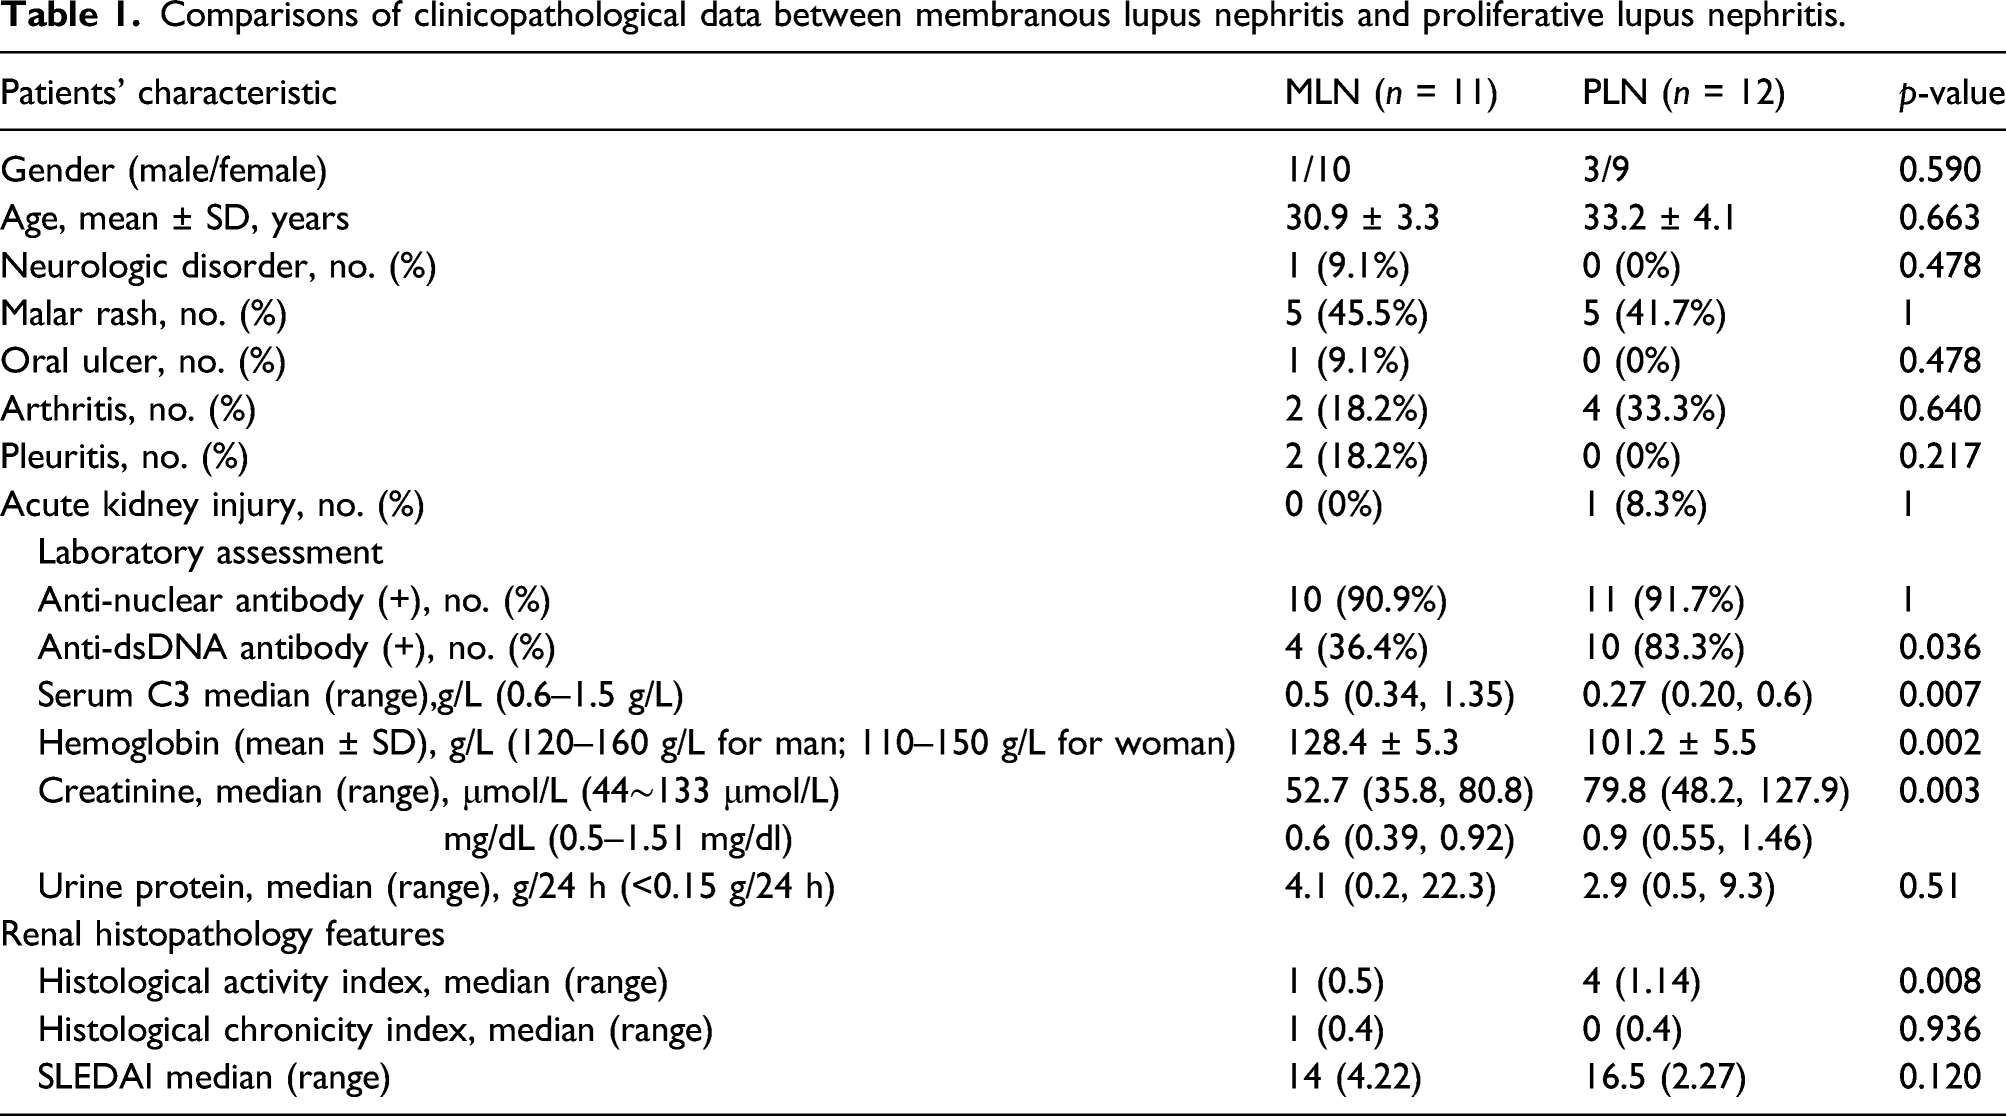
The following clinical data at the time of biopsy were collected and analyzed: age, sex, neurologic disorder, malar rash, oral ulcer, arthritis, pleuritis, and acute kidney injury. Clinical disease activity was assessed using the Systemic Lupus Erythematosus Disease Activity Index (SLEDAI). 15
Serum anti-nuclear antibodies (ANAs) were detected using an indirect immunofluorescence assay. Anti-dsDNA antibodies were detected using a Crithidia Luciliae indirect immunofluorescence test. Serum C3 levels were measured by nephelometry using a rate nephelometry assay. Activity indices (AI) and chronicity indices (CI) were pathologically assessed as previously described. 16
Formalin-fixed paraffin-embedded (FFPE) kidney tissues
The kidney samples were obtained from embedded tissue remaining after cores were sectioned for routine clinical purposes. Kidney tissue specimens were fixed with 4% buffered formalin overnight. Then dehydrated through a series of graded alcohols and xylene and embedded in paraffin.
Protein extraction from FFPE kidney tissues
Five serial slides from 10-μm-thick FFPE kidney tissues were used per patient sample. Samples were deparaffinized with xylene, hydrated in absolute ethanol, lysed in a buffer consisting of 0.1 M Tris-HCl (pH 8.0), 0.1 M DTT, and 4% SDS, and then sonicating for 10 s thrice. Next, extractions were placed in a heating block with agitation (600 r/min) for 20 min at 95°C. Finally, the crude extract was centrifugated at 16,000 g at 18°C for 10 min and stored in a freezer.
Protein digestion by FASP
After heat-assisted protein extraction, lysates were washed, and the protein concentration was determined using a reducing agent-compatible BCA assay kit (Thermo Fisher Scientific). Overall, 200 μg of the lysate were digested with trypsin followed by the FASP using ultrafiltrafugation spin filter with a nominal molecular weight cut of 30 KDa. Briefly, samples were washed with 200 μL 8 M urea in 0.1 M Tris/HCl, pH 8.5 and transferred to the filter, and centrifuged at 14 000g at 20°C for 15 min, and this step was performed twice. Then proteins were alkylated with 50 μL of 0.05 M iodoacetamide in 8 M urea and incubated in darkness for 20 min. Filters were then washed twice with 100 μL of 8 M UA followed by two washes with 100 μL of 50 mM NH4HCO3 to remove the detergent and DTT. Next, samples were digested with trypsin to release the peptide fragments from the filter. Finally, samples were incubated overnight and collected released peptides by centrifugation. After quantifying peptides concentration by Pierce™ Quantitative Colorimetric Peptide Assay kits, samples (2 mg each) were loaded for MS analysis.
LC-MS analysis
LC was performed on an Easy-nLC System (Thermo Fisher Scientific). Peptides were separated on a 20 cm fused silica emitter packed in-house with the reverse phase material ReproSil-Pur C18-AQ, 1.9 μm resin with a 200-min gradient from 2 to 38% of 100% (v/v) CH3CN, and 0.1% (v/v) formic acid. Samples were analyzed with a Q Exactive mass spectrometer (Thermo Fisher Scientific). Data acquisition was done with a DDA Top-20 method with HCD fragmentation. MS1 and MS2 resolution were set at 70K and 17.5 K, respectively. AGC and max IT were set at 3 × 10⁶ and 50 ms, respectively, for MS1, 1 × 10⁵ and 100 ms for MS2.
Data Analysis
Spectrometry data was analyzed using freely available MaxQuant software 1.3.0.5 (www.maxquant.live) against the human Uniprot database (released in January 2020; http://www.uniprot.org). An initial search was set at a precursor mass window of 6ppm. The search employed an enzymatic cleavage sites and a mass tolerance of 20ppm for fragment ions. During database searching, cysteine carbamidomethylation was defined as a fixed modification, while protein N-terminal acetylation and methionine oxidation were defined as variable modifications.
Label-free quantification was carried out in MaxQuant as described in previous literature. 17 The peptide spectrum match was filtered by posterior error probability (PEP), which was allowed to be as high as 0.1. Peptides were included in further analysis if they showed an andromeda score >0 and false discovery rate <0.01.
Co-fragmentation was performed according to the default algorithm in MaxQuant software. Protein abundance was calculated on the basis of the normalized spectral protein (LFQ) intensity.
Gene Ontology and Pathway Enrichment Analysis and Protein–Protein Interaction network (PPI)
FunRich is a software used mainly for gene functional classification that provides a comprehensive set of functional annotation for researchers to understand biological characteristics. 18 Gene Ontology (GO) function and Kyoto Encyclopedia of Genes and Genomes (KEGG) pathway enrichment analyses of the differentially expressed genes (DEGs) were performed through FunRich. Significantly altered proteins between MLN and PLN patients were functionally assessed via FunRich. The significant pathways in the upregulated proteins in MLN and the upregulated proteins in PLN were exhibited as bar charts. The string database (http://www.bork.embl-heidelberg.de/string) is a computerized and powerful global resource for studying the interaction between the predicted and experimental interactions of proteins. 19 DEG protein interaction was performed on the string online website. Subsequently, Cytoscape was applied for further visualization. 20
Paraffin immunofluorescence
Immunofluorescence staining of sections cut from FFPE tissue was performed as follows 21 : Tissue sections were deparaffinized in xylene and hydrated in serial alcohol solutions, respectively. Then, appropriate antigen retrival was performed in a steam pressure cooker with Tris-EDTA buffer 9.0 for 4 min. After antigen retrival, 3% bovine serum albumin was used to block non-specific staining for 30 min at room temperature. Then, all sections were incubated with primary antibody anti-SIRT2 (Proteintech, 19,655-1-AP, dilution 1:100), anti-VCAM1 (Proteintech, 11,444-1-AP, dilution 1:100), and anti-Bcl-xl (Proteintech, 26,967-1-AP, dilution 1:100), both overnight at 4°C. FITC-labeled goat anti-rabbit lgG (Invitrogen 656,111, dilution 1:200) was used as secondary antibodies for 30 min at 37°C and then visualized using a fluorescence microscopy. As isotype control, normal rabbit lgG (beyotime, A7016, dilution 1:100) replaced the primary antibodies.
Statistical analysis
All data were analyzed using SPSS 20.0 ((SPSS, Chicago, IL, USA)). Continuous variables are presented as mean ± standard deviation or median and interquartile range. The categorical variables are expressed as frequencies and percentages. The t-test or Mann–Whitney U-test was used to compare the differences between the two groups. The chi-square (χ2) test was used for comparison of categorical variables. For each comparison, the p-value for differentially expressed proteins between MLN and PLN patients was corrected for multiple comparisons using the approach of Benjamini and Hochberg to control the false discovery rate (FDR). 22 Associations with a Benjamini-Hochberg adjusted p-value <0.05 were considered to be statistically significant.
Results
Clinical characteristics of lupus nephritis patients
Comparisons of clinicopathological data between membranous lupus nephritis and proliferative lupus nephritis.
Identification of proteins in LN
A total of 5112 proteins were detected in the kidney samples of 23 LN patients (more details in Supplemental Table S1–S2). Of the identified proteins, 16 proteins were exclusively found in patients with MLN, whereas 85 proteins were exclusively found in the PLN group (Figure 1(a), Supplemental Table S3–S4). Identification of proteins from the membranous lupus nephritis (MLN) and proliferative lupus nephritis (PLN). (A) Yellow area represented the profile of MLN, and blue area represented the profile of PLN. The cross area meant the common proteins. (B) Volcano plot of MLN to PLN ratios for all quantified proteins. Of the 5011 robustly identified and quantified proteins in the MLN and PLN proteins, 12 proteins were deemed upregulated by meeting criteria of P-value <0.05 and fold change ≥2 in MLN group (red) and 220 proteins were downregulated in MLN group (green) compared to their counterparts in PLN.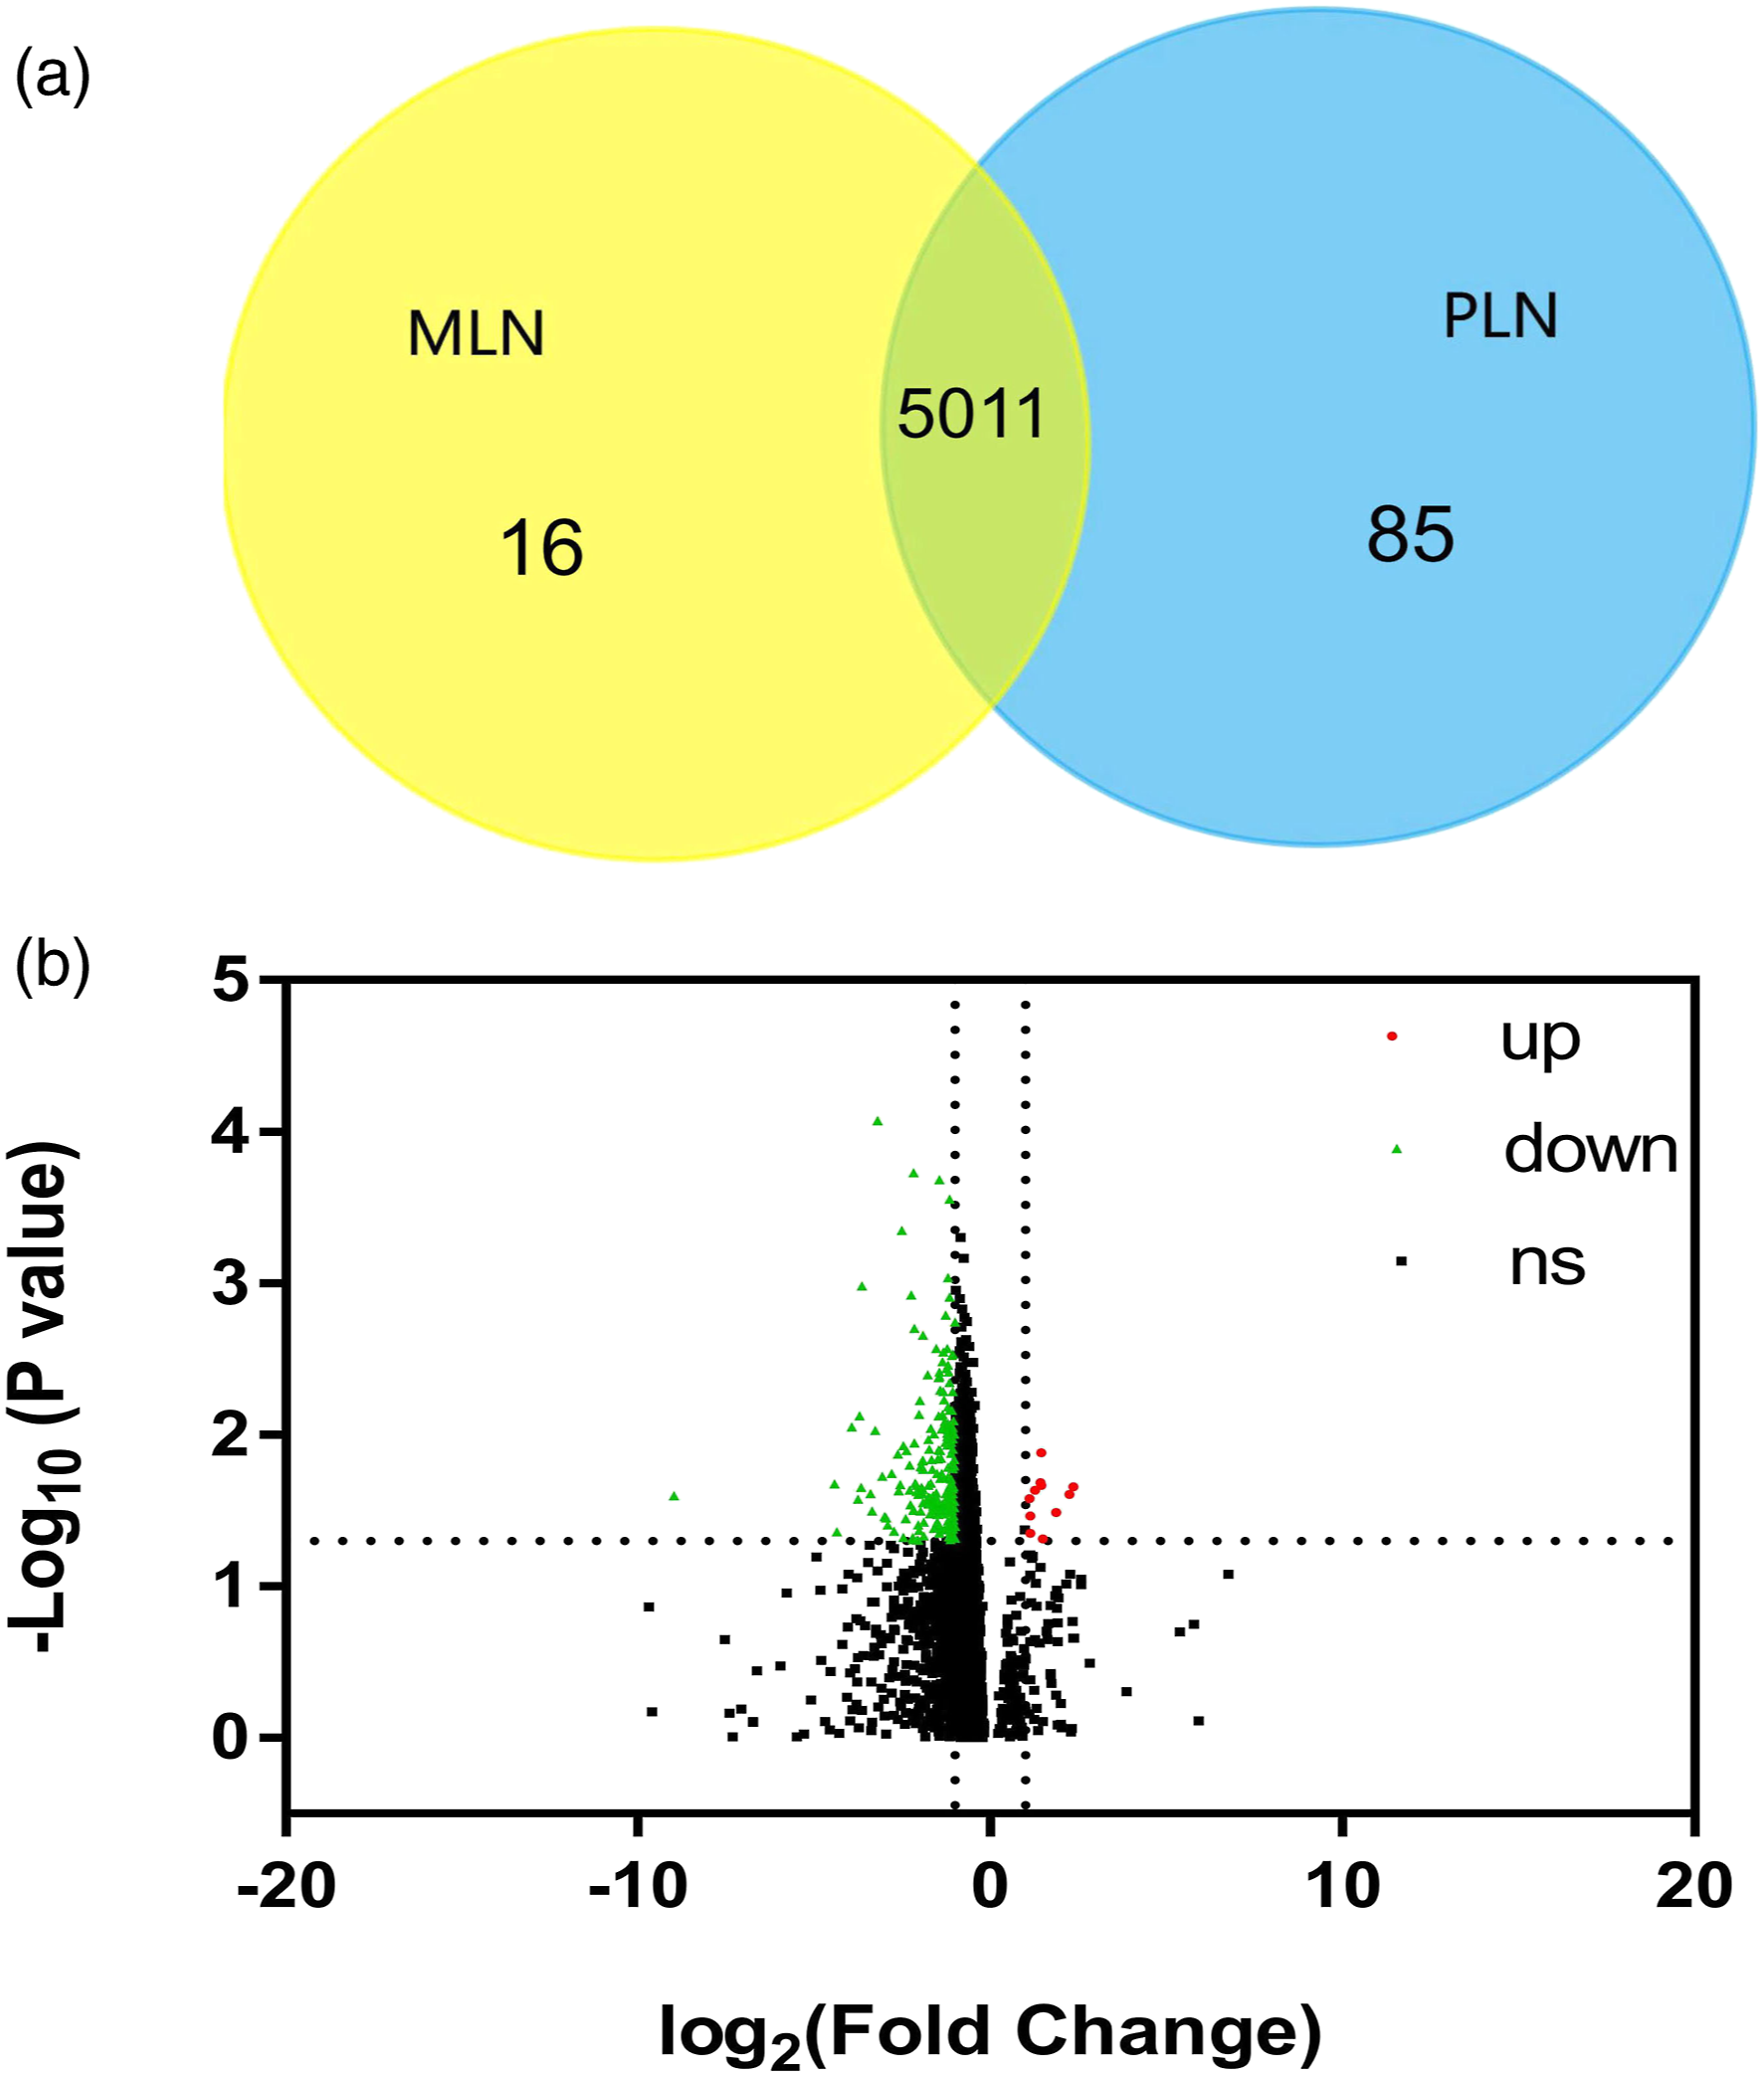
The adjusted p-values were adopted to avoid the occurrence of false-positive results. Among the 5011 robustly identified and quantified proteins in MLN and PLN, when the criteria of adjusted p-value <0.05 and |FC| ≥2 were applied, 12 proteins were relatively upregulated and 220 proteins were relatively downregulated in MLN patients compared to their counterparts in PLN based on the kidney sample protein profiling (Figure 1(b) and Supplemental Table S5–S6).
Pathway enrichment analysis of upregulated proteins
List of the biological pathways identified as upregulated in the kidney sample from membranous lupus nephritis and proliferative lupus nephritis patients by the label-free LC/MS experiment, and the percentage and genes involved in the biological pathway.
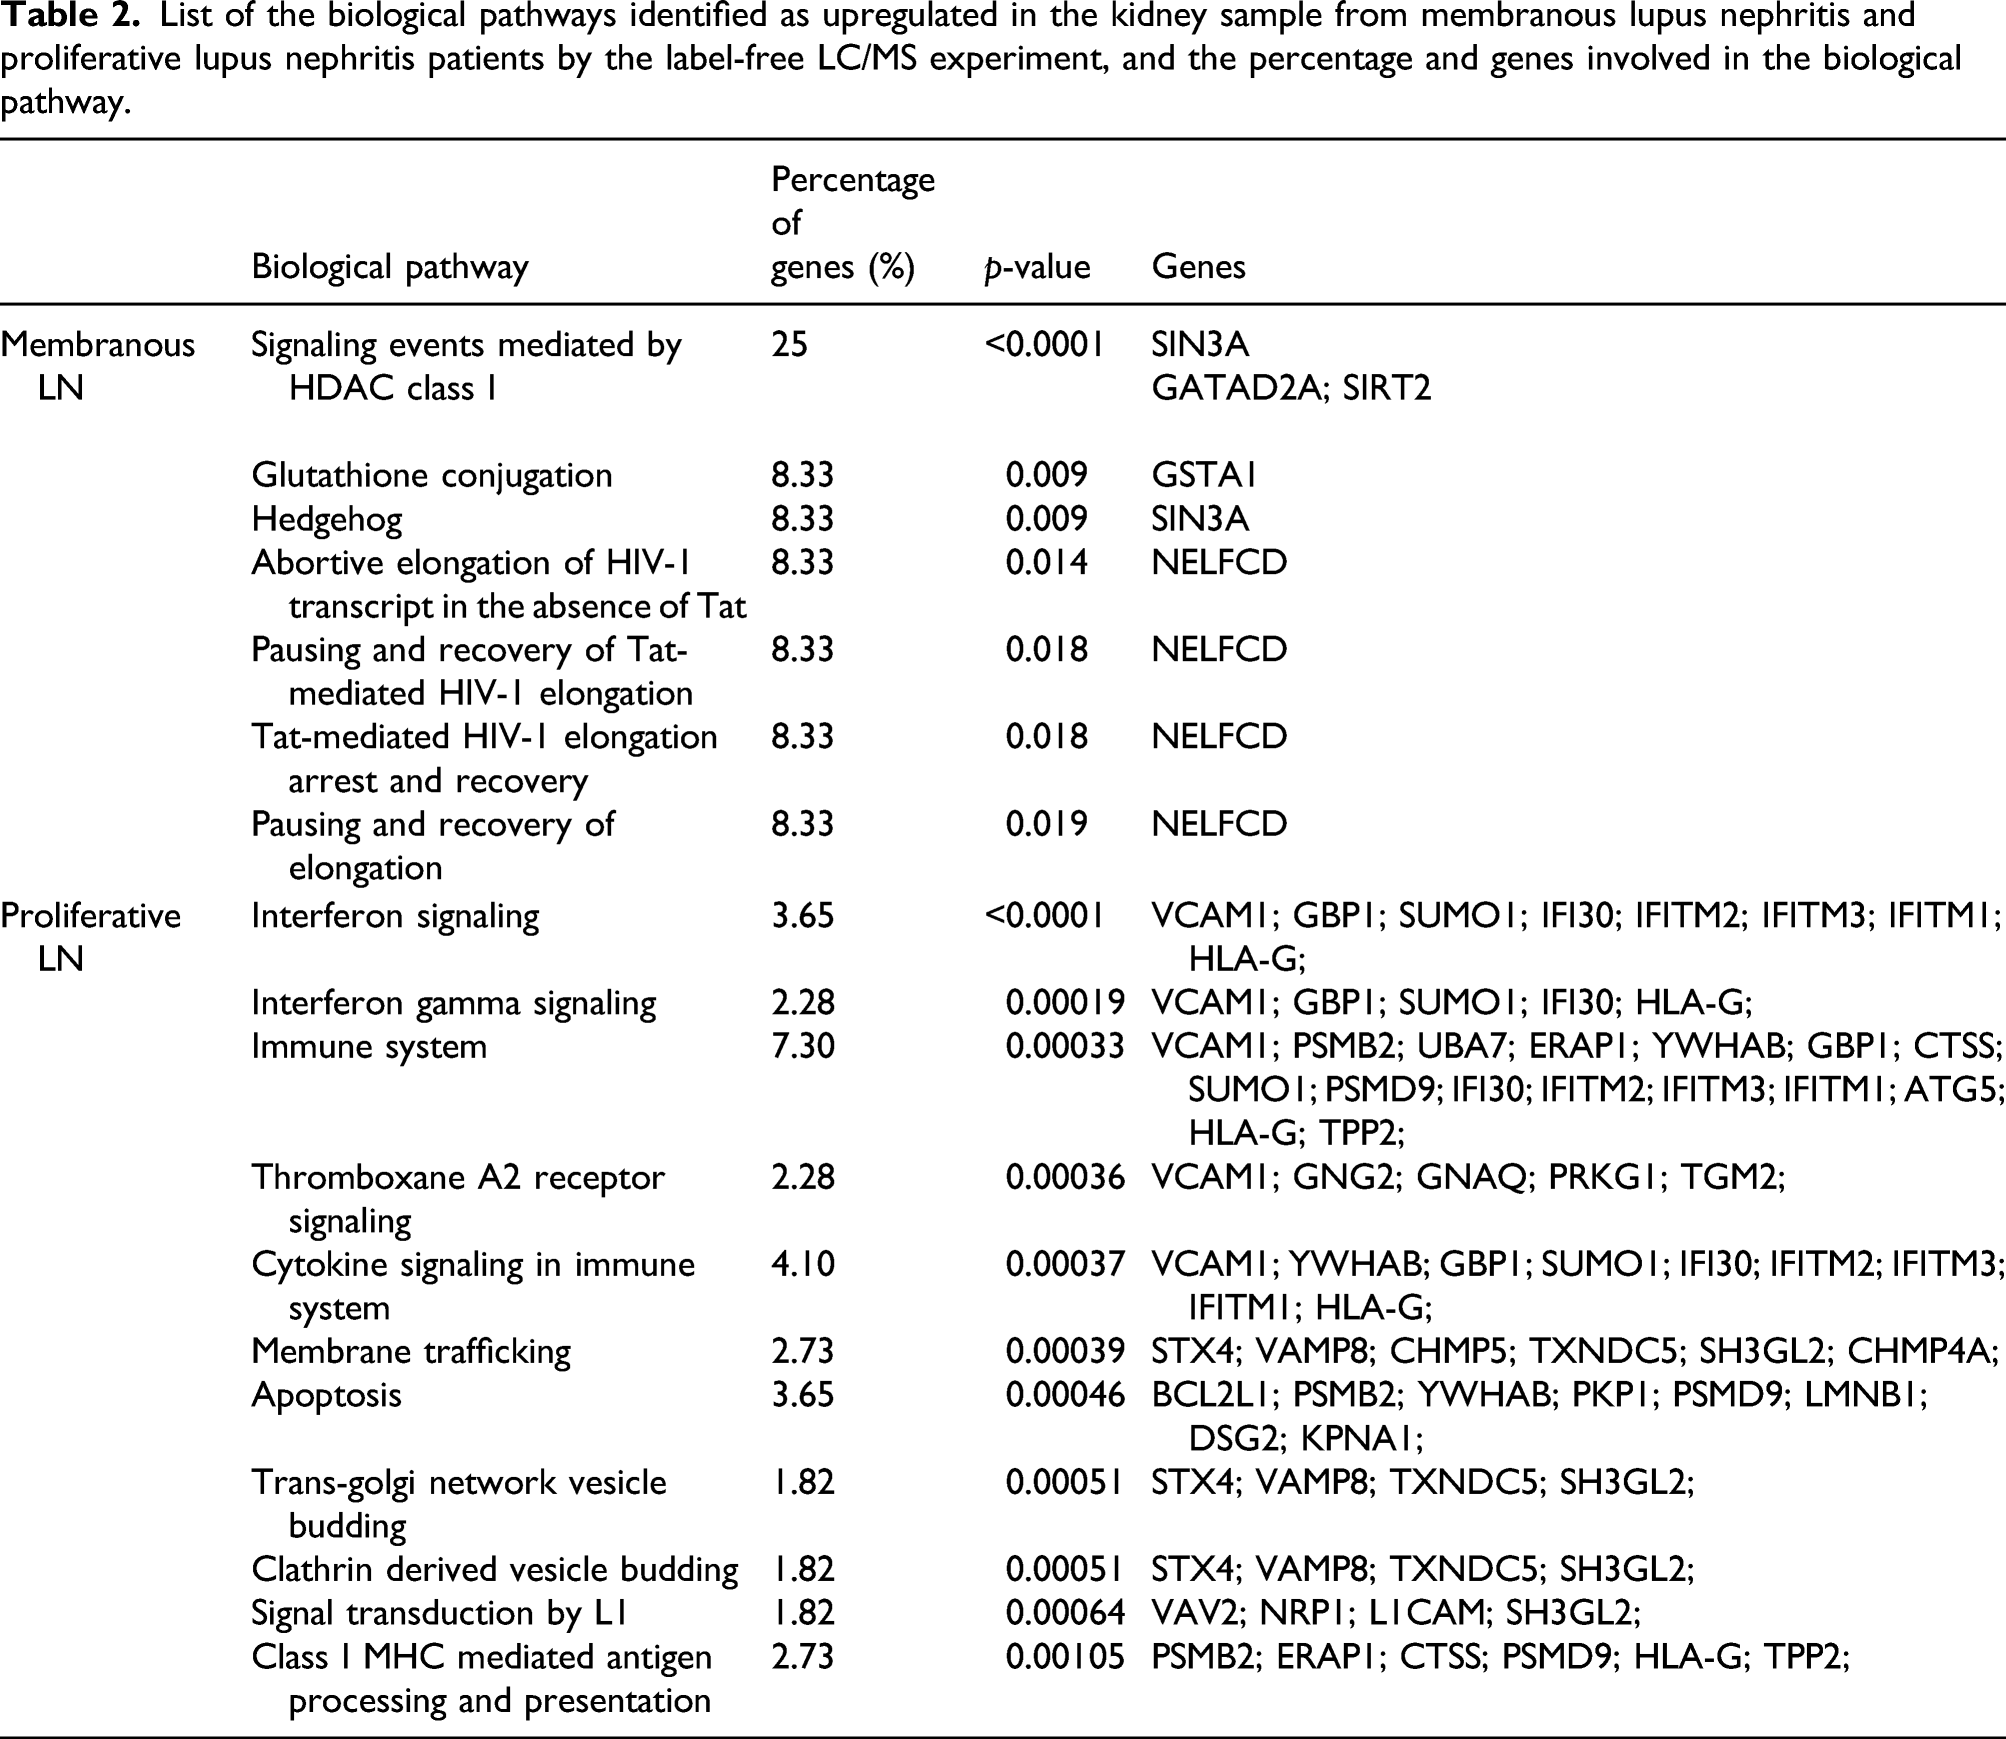
In the proliferative group, more pathways were significantly affected (p < 0.001), including interferon signaling, interferon gamma signaling, immune system, thromboxane A2 receptor signaling, cytokine signaling in immune system, membrane trafficking, apoptosis, class I MHC mediated antigen processing and presentation, and the adaptive immune system (Table 2).
The selected biomarkers in MLN and PLN patients
Candidate proteins were selected for further investigation. SIRT2, which is one of the 12 upregulated proteins in MLN, and one of three proteins involved in the HDAC class I pathway, the most significantly upregulated pathway of MLN, was selected for analysis. Regarding PLN, proteins which had been studied in the autoimmune disease especially in LN were suggested as the potent biomarkers, and two biomarkers from 220 upregulated proteins in proliferative group were selected: VCAM1 (vascular cell adhesion protein (1) and Bcl-xl. Based on the perspective upregulated pathways in PLN, VCAM1 was the most involved protein in PLN enriched pathways including interferon signaling, interferon gamma signaling, immune system, thromboxane A2 receptor signaling, and cytokine signaling in immune system pathways. Another biomarker, Bcl-xl, which was well studied given its role in apoptosis, was chosen for potential candidate in the PLN.
As an initial assessment for large variations in the quantities of proteins, MS intensities for selected proteins were compared. As shown in Figure 2, a significant (p < 0.05) difference in increasing signal intensities for SIRT2 was noted in the MLN group compared with the PLN group. Significant enhancements in the signal intensities for VCAM1 (p < 0.01) and Bcl-xl (p < 0.001) were noted in the PLN group. Quantitative comparison of three selected biomarkers expression between membranous lupus nephritis (MLN) (n = 11) and proliferative lupus nephritis (PLN) (n = 12) based on the mass spectrometry signal intensity. The dots represented the density of protein expression. Mann–Whitney test verified statistical difference among groups comparing MLN to PLN. Note: MLN: membranous lupus nephritis. *P < 0.05; **P < 0.01; ***P < 0.001.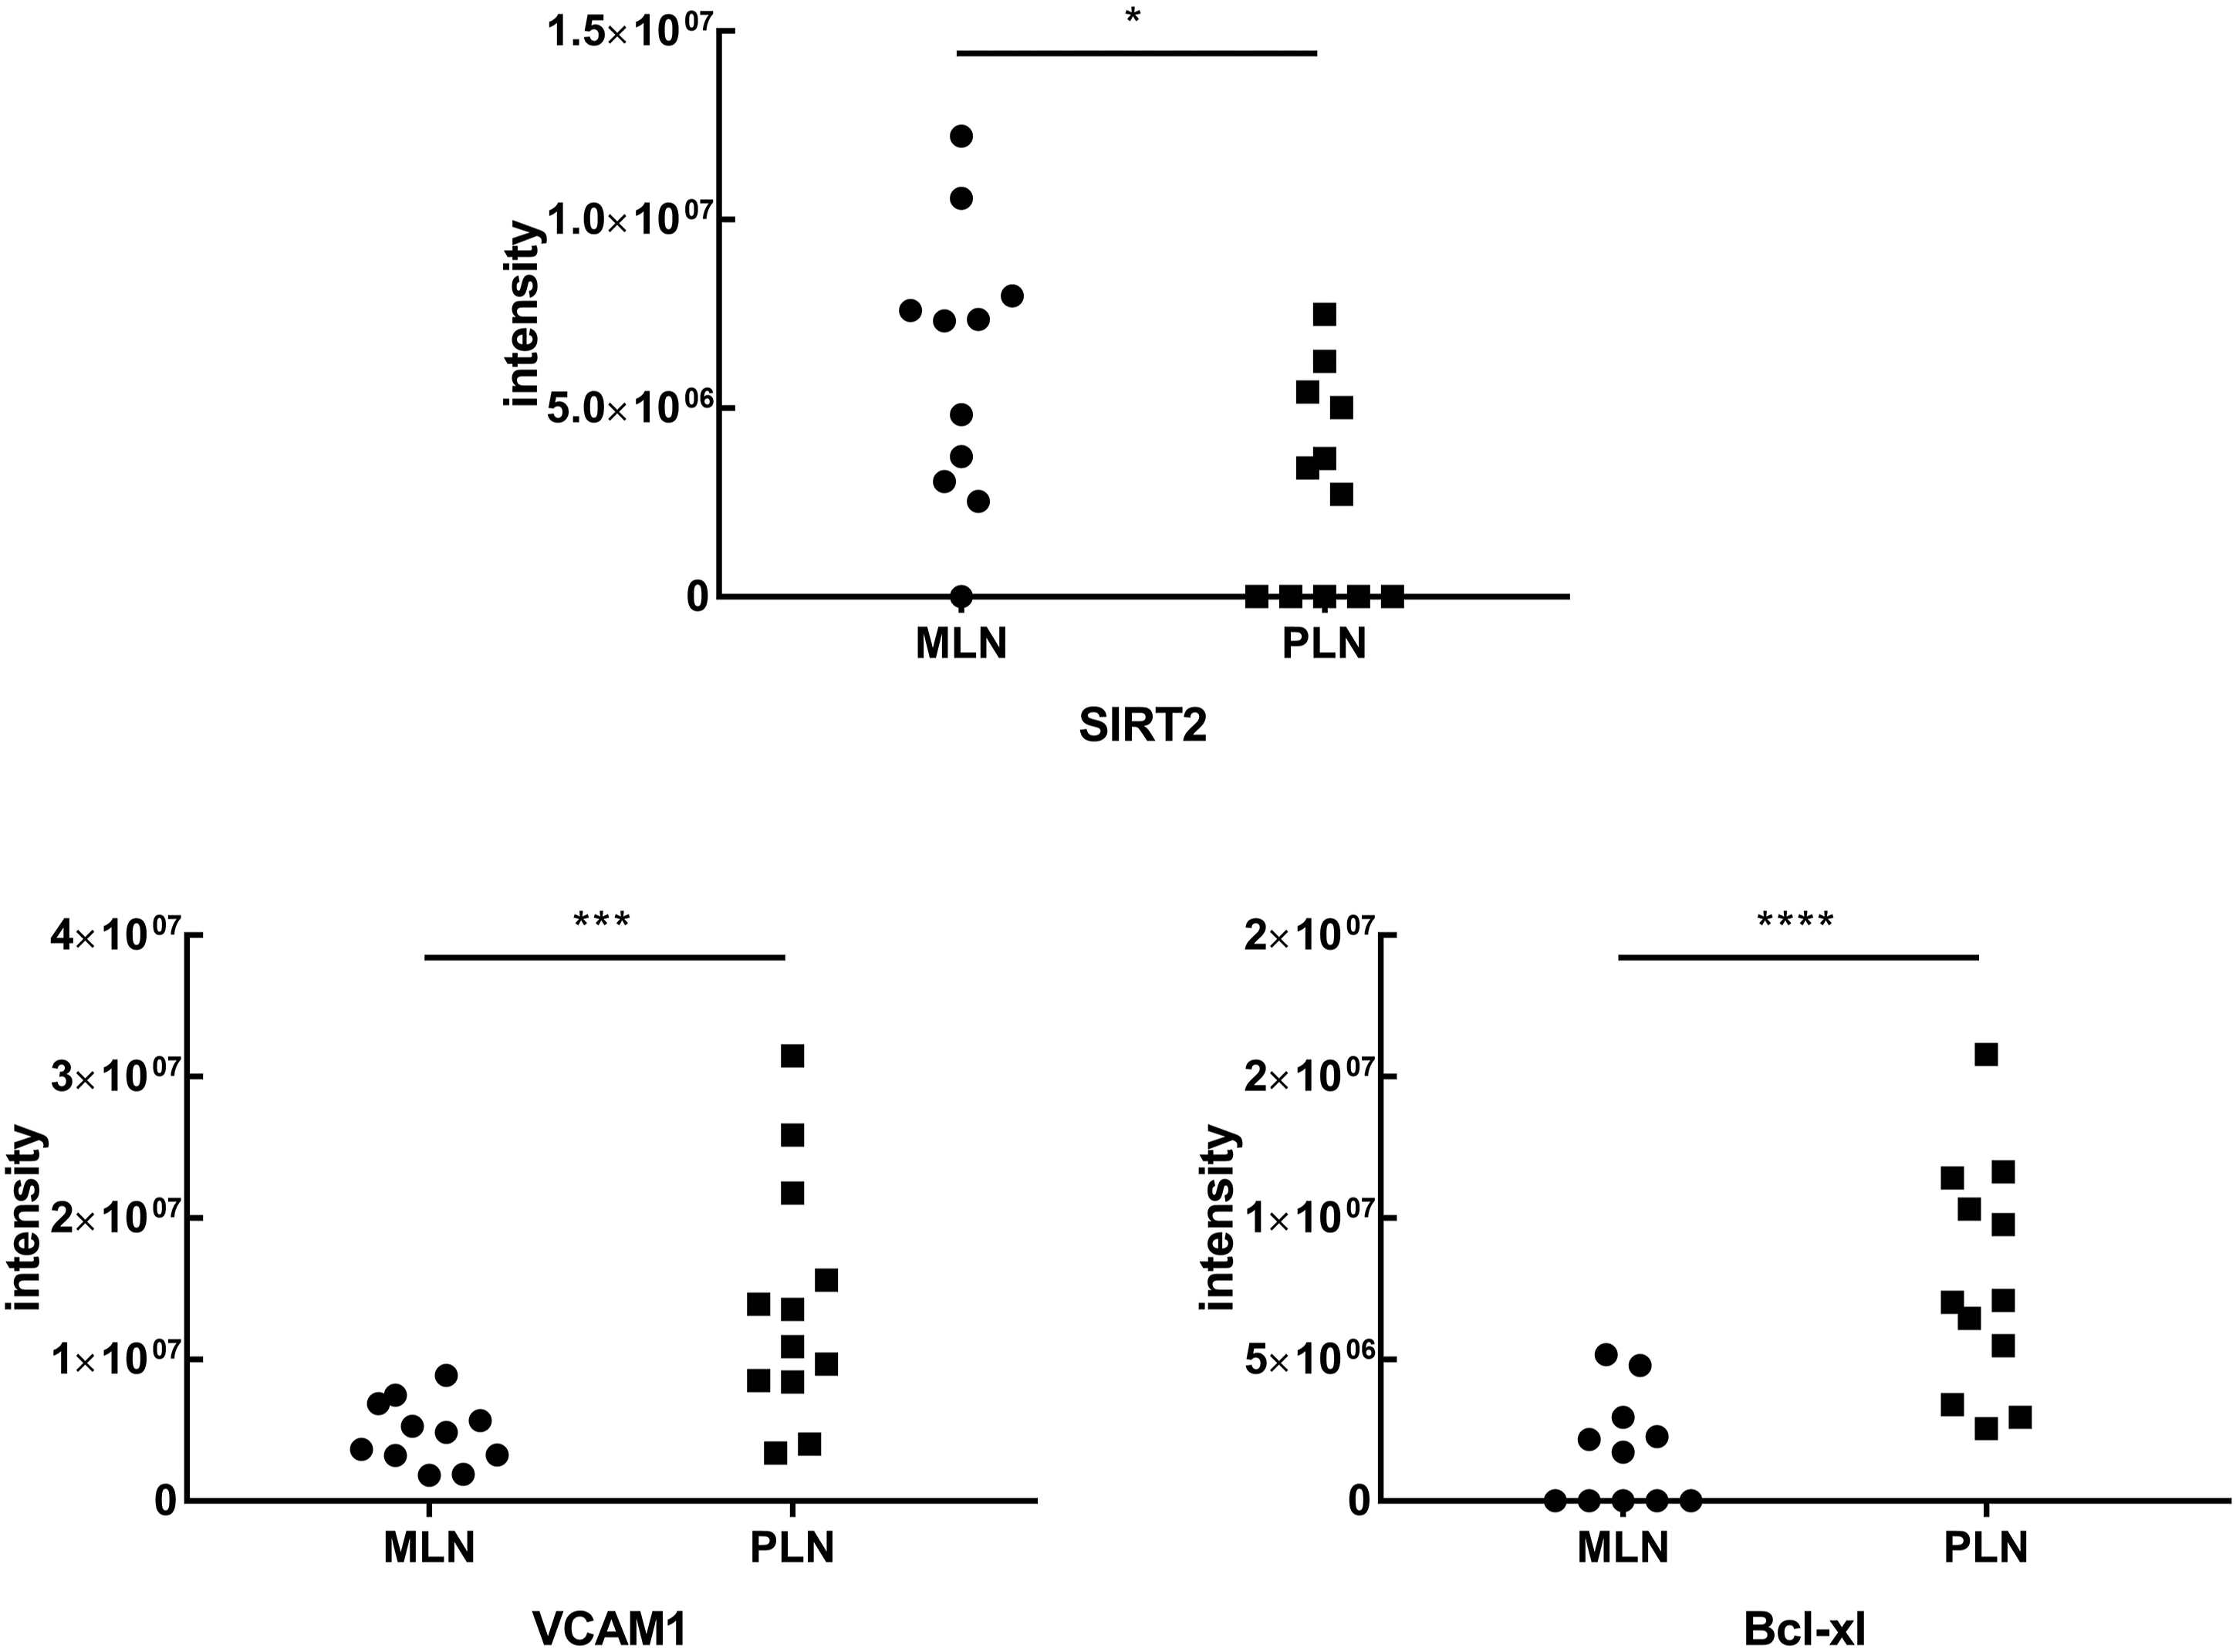
The immunofluorescence of candidate biomarkers in MLN and PLN patients
We further compared the above candidate protein levels of SIRT2, VCAM1, and Bcl-xl in renal biopsy specimens between MLN and PLN patients by immunofluorescence staining in the validation group (Figure 3 and Supplemental Table S7 for cohort descriptions of the validation group). Renal biopsies from MLN patients were presented with intense staining of SIRT2 in the glomeruli and tubulointerstitium areas than that in the PLN group, although not reaching significant difference (Figures 3(a)–(c)). The MLN group presented with less intense staining of VCAM1 in the glomeruli area (p = 0.026) and Bcl-xl in the tubulointerstitium area (p = 0.002) than those in the PLN group, respectively (Figures 3(e) and (i)). SIRT2, VCAM1, and Bcl-xl protein stainings by immunofluorescence in renal biopsies from patients with membranous lupus nephritis (MLN) and proliferative lupus nephritis (PLN). (A) Representative images of SIRT2 stainings in the glomeruli and tubulointerstitium areas from renal tissues of MLN and PLN patients. Bars = 50 μm. (B) Glomerular SIRT2 staining in MLN patients (n = 7) and PLN patients (n = 7) showed no difference. (C) Tubulointerstitial SIRT2 staining in MLN patients (n = 7) and PLN patients (n = 7) showed no difference. (D) Representative images of VCAM1 staining in the glomeruli and tubulointerstitium areas from renal tissues of MLN and PLN patients. Bars = 50 μm. (E) Glomerular VCAM1 staining in MLN patients (n = 7) and PLN patients (n = 7) showed no difference. (F) Tubulointerstitial VCAM1 staining in MLN patients (n = 7) were significantly lower than that in PLN (n = 7). (G) Representative images of Bcl-xl staining in the glomeruli and tubulointerstitium areas from renal tissues of MLN and PLN patients. Bars = 50 μm. (H) Glomerular Bclxl stainings in MLN patients (n = 7) were significantly lower than that in PLN (n = 7). (I) Tubulointerstitial Bclxl staining in MLN patients (n = 7) and PLN patients (n = 7) showed no difference. Isotype control was conducted in the corresponding group by replacing the primary antibodies by normal rabbit IgG. Data analyses were performed by Student’s t-test for the between MLN and PLN groups. Data expressed as median (IQR). *P < 0.05; **P < 0.01; ***P < 0.001.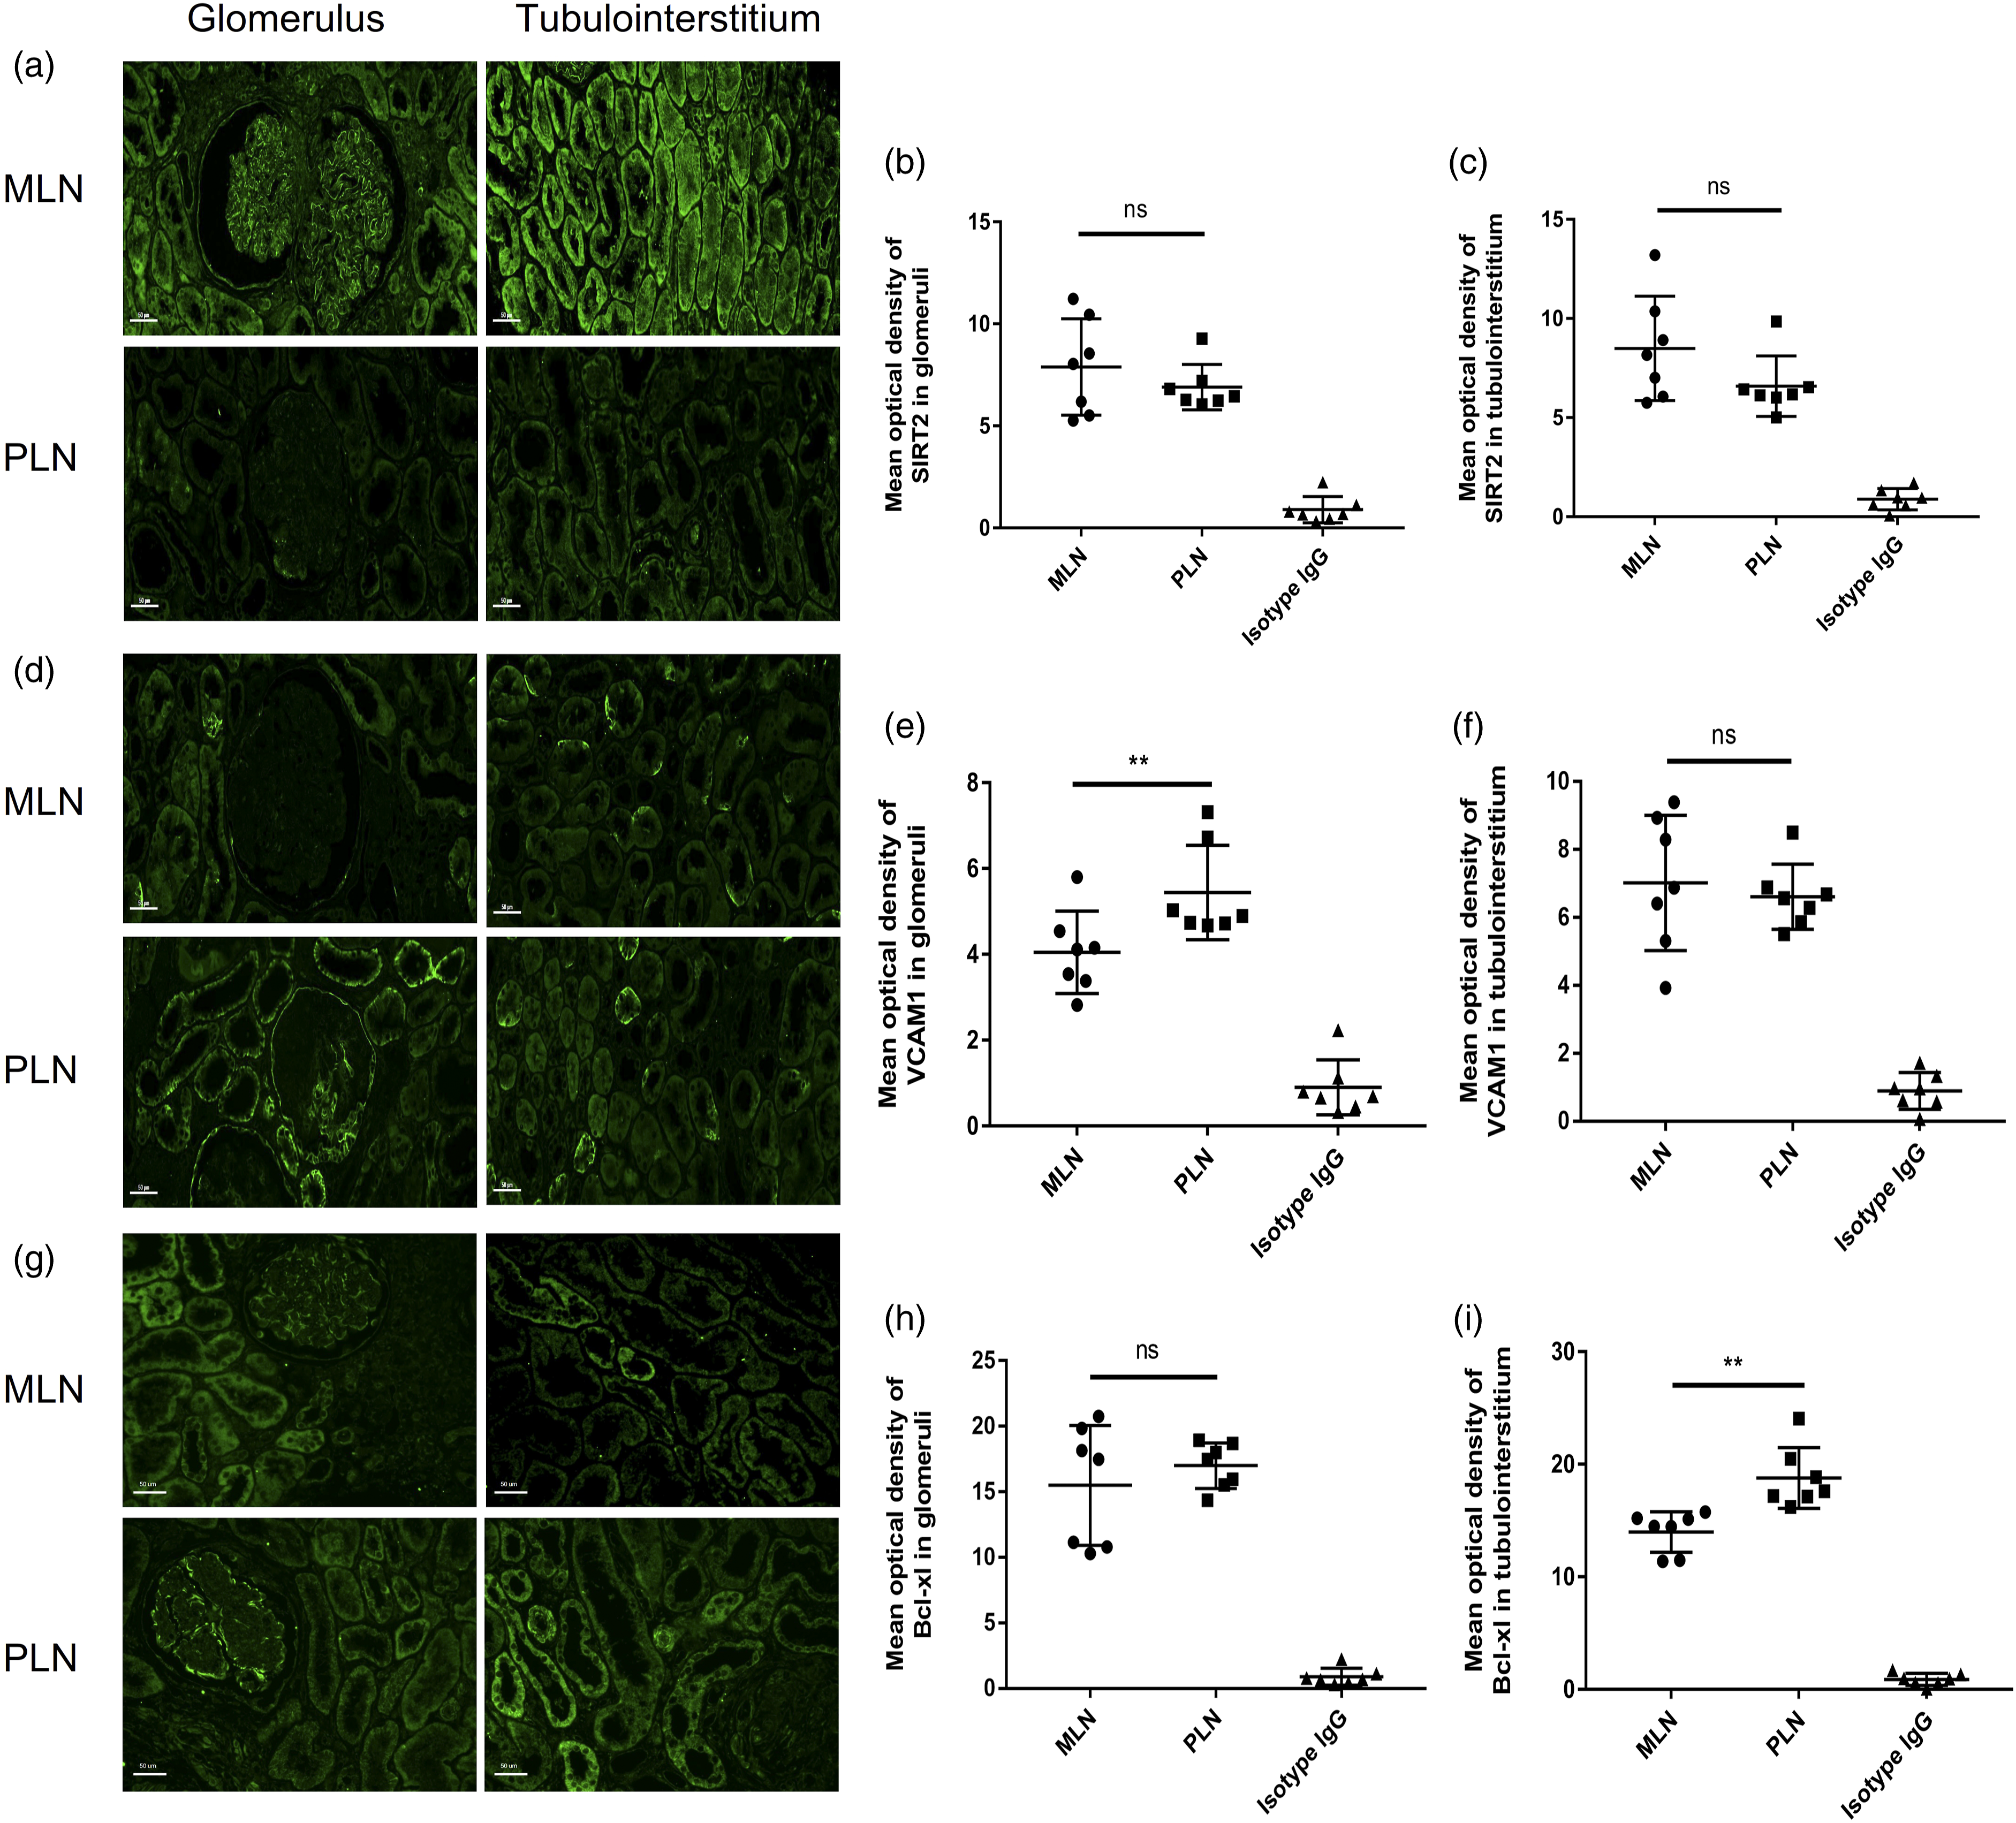
PPI network of candidate biomarkers
A total of 232 consistently expressed DEGs (12 upregulated in MLN and 220 upregulated in PLN) were individually filtered into the PPI network to discover the interaction between the predicted and experimental interactions of proteins, which could help to learn how distinct signaling pathways communicate with one another based on our previous pathway enrichment analysis (Figure 4). In the MLN network, three nodes and three edges were obtained, and the selected biomarker SIRT2, which had a degree of 2, interacted with GATAD2A and DNAJB6 directly (Figure 4(c)). From the 176 nodes in PLN, there were 355 edges in the network. Among the selected biomarkers of PLN, VCAM1 with 10 of directed edges and BCL2L1 with four directed edges (Figures 4(a) and (b)). Visualization for the upregulated proteins was used by the Cytoscape tool. Each node represented a protein and each line referred an interaction. Blue nodes represented the upregulated proteins in two disease groups. Red nodes represented the selected biomarkers. Yellow nodes represented the first neighbors of biomarkers. (A) In the PPI network of 220 proteins, which were upregulated in proliferative lupus nephritis group, the selected biomarkers were VCAM1, Bcl-xl, respectively. (B) The PPI network of VCAM1, Bcl-xl and their first neighbors from the upregulated proteins. (C) In the PPI network, SIRT2 was selected from the upregulated proteins in membranous lupus nephritis group.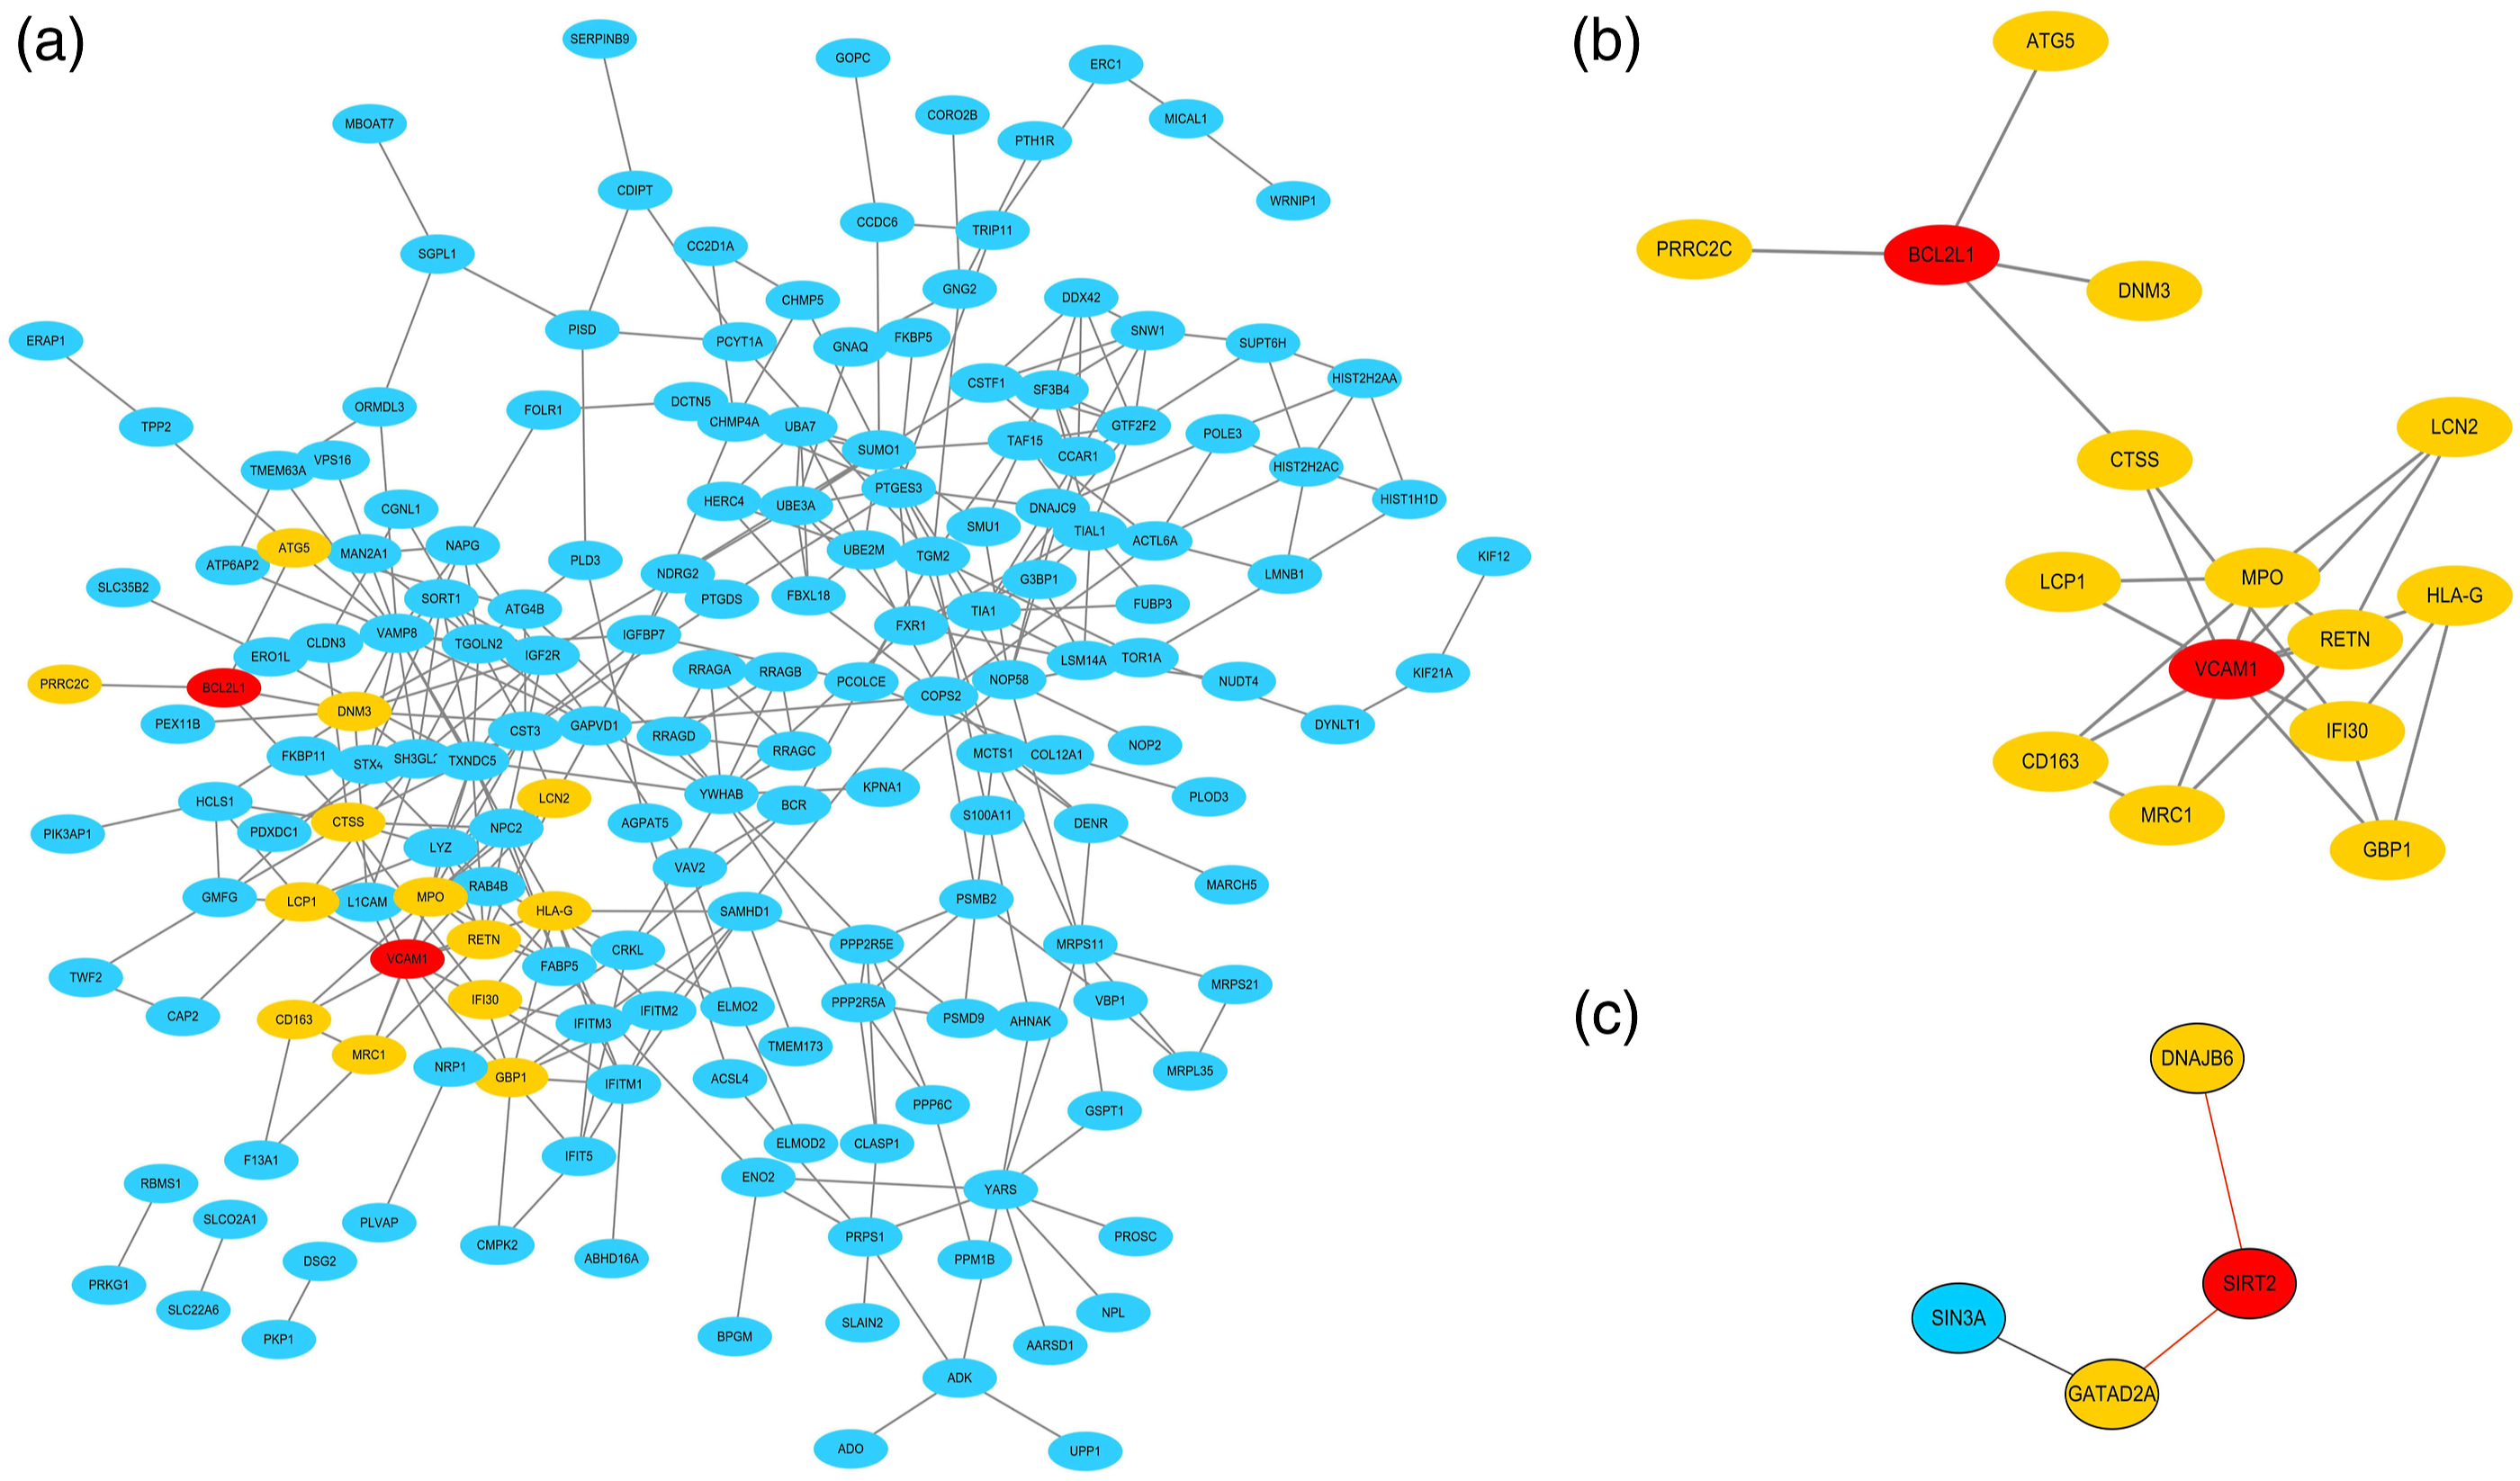
Discussion
In this study, the comparative proteomic profiling applied to renal biopsies from patients with pure MLN and PLN subjects identified different pathways and potential biomarkers associated with the disease. We proposed that the novelty of our work was that we analyzed LN class-specific proteomic profiling, which might provide the potential targets for the precision treatment of LN.
Our MS analysis discovered significantly elevated pathways, especially HDAC class I pathway in MLN compared to PLN, indicative of a systemic response to HDAC. Previous research found that HDAC-inhibitor inhibited CD4 T-cell proliferation in a dose-dependent manner and further inhibited activation-induced CD25 and CD154 expression on CD4 cells. 23 In a mouse model of LN, treatment with specific class I and II HDAC inhibitor decreased the TH17 phenotype while increasing the percentage of Tregs, thus decreasing the disease. 24 The role of HDAC pathway on renal epithelial, tubular cell, fibroblasts, and podocytes has been reported in mouse models.25,26 Especially, Wang X et al. observed upregulation of HDAC2, HDAC4, and HDAC5 in paraffin-embedded sections of human diabetic renal tissues and unraveled the contribution of HDAC4 to podocyte injury in a diabetic rat model. 27 Recently, Inoue K et al. also found that podocyte-associated HDAC1 and HDAC2 genetic ablation improved proteinuria and glomerulosclerosis in mouse models. 28 Thus, the specific role of HDAC class I pathway in membranous LN needs to be further clarified.
More significantly elevated pathways such as antigen processing and presentation, interferon signaling, immune system, and apoptosis were identified in renal biopsies obtained from PLN. These pathways had previously been proven to play important roles in the pathogenesis of SLE or LN.29–32
The underlying molecular mechanisms in different histological LN classes remain largely unclear. In several studies, PLN patients were found upregulated to some immune-related pathways, including type-I IFN and TNF family signaling in tubular cells, type-I IFN signaling, and antigen presentation in keratinocytes, were upregulated in PLN patients and differentiated them from patients with the membranous class of LN. 33 In our study, the IFN pathway, especially the type II IFN, was also elevated in kidney samples of PLN patients.
Our dataset provides an opportunity to explore pathways in kidney samples to improve diagnostics and potentially therapies in specific class of LN. It should be noticed that LN has a high probability of type transition, looking at serial biopsy samples from patients who remained pure MLN compared to those who transitioned from MLN to PLN or assessing biomarker expression in serial biopsies from patients who start with a mixed PLN/MLN class and then transition to pure MLN as they respond to therapy could refine the list of class-specific protein biomarkers extracted from this research. In addition to the differential pathways, biomarkers for diagnosing LN in kidney biopsies of MLN and PLN, including SIRT2, VCAM1, and Bcl-xl, were identified based on differentially expressed proteins and data from the literatures.
SIRT2, one of seven members of sirtuin family 34 , coordinates disparate metabolic processes such as adipocyte differentiation, gluconeogenesis, insulin sensitivity, and inflammatory pathways. 35 SIRT2 deficiency ameliorated inflammatory signaling through the MKP-1 and MAPK axis. 36 Recently, the role of SIRT2 in the activation of fibroblasts and tubulointerstitial fibrosis was described, and this process is mediated via regulation of the E3-ubiquitin ligase murine double-minute 2 (MDM2) pathway. SIRT2 inhibition attenuates TGF-β1-induced fibroblast activation. 37 The biological role of SIRT2 in the development of LN remains largely unknown. In our study, SIRT2 expression was elevated in MLN patients compared with PLN patients, suggesting that SIRT2 might be involved in the pathogenesis of MLN.
VCAM1, a member of the immunoglobulin superfamily, is an adhesion molecule involving in the inflammatory response by recruiting leukocytes to inflammatory sites. 38 A large body of research has suggested the relationship between VCAM1 and LN. In the murine model of LN, VCAM1 was found increased in the endothelium, cortial tubules, and glomeruli compared with normal mice. 39 Recent studies focused on patients with LN, and the soluble VCAM1 levels in plasma were measured as a biomarker of renal vascular lesions. 40 Urinary VCAM1 was also found correlating with SLEDAI scores and pathological activity index. 41 Based on findings obtained from the kidney specimens of various subsets of LN, our results suggested the pathogenic role of VCAM1 in PLN, especially in the glomerulus of PLN.
Bcl-xl, a member of Bcl-2 family, encoded by BCL2L1, is a common anti-apoptotic protein that promotes cell survival. 42 Dysregulation of the Bcl-2 or Fas pathways can lead to severe SLE-like disease. 43 A study demonstrated that a Bcl-2 family antagonism was efficacious in treating animal models of arthritis and lupus. 44 Bcl-2 antagonists can selectively kill plasmacytoid dendritic cells and reduce IFNα production in a mouse model of lupus. 45 These results combined with our study findings highlight the possible specific therapeutic targets of the Bcl-2 family, especially Bcl-xl, in the pathogenesis of PLN in the tubulointerstitium.
Nevertheless, the clinical implications of these proteins need to be further considered, and further studies are warranted for evaluating the disease specificities of these proteins. Furthermore, the prognostic value of these proteins in LN progression should be clarified with functional studies.
There are some limitations of our study. First, the differential expression of the proteins shown between PLN and MLN group only indicated their relative relationship due to the lack of healthy control. Second, the downregulated proteins in either PLN or MLN were not explored in the present work. Third, our study only demonstrated the difference between MLN and PLN at the time of the renal biopsy.
Collectively, our results help to understand the molecular basis of in the pathogenesis of MLN or PLN and provide valuable novel markers and targets for the diagnosis and treatment of these diseases. To confirm the diagnostic/therapeutic potential of the identified proteins, future validation studies are warranted.
Supplemental Material
sj-xlsx-1-lup-10.1177_09612033221094711 – Supplemental Material for Proteomic profiling of kidney samples in patients with pure membranous and proliferative lupus nephritis
Supplemental Material, sj-xlsx-1-lup-10.1177_09612033221094711 for Proteomic profiling of kidney samples in patients with pure membranous and proliferative lupus nephritis by Yun-Ying Chen, Ying Ding, Lin-Lin Li, Sha-Sha Han, Min Huang, Catherine C. L. Wong, Feng Yu and Ming-hui Zhao in Lupus
Supplemental Material
sj-xlsx-2-lup-10.1177_09612033221094711 – Supplemental Material for Proteomic profiling of kidney samples in patients with pure membranous and proliferative lupus nephritis
Supplemental Material, sj-xlsx-2-lup-10.1177_09612033221094711 for Proteomic profiling of kidney samples in patients with pure membranous and proliferative lupus nephritis by Yun-Ying Chen, Ying Ding, Lin-Lin Li, Sha-Sha Han, Min Huang, Catherine C. L. Wong, Feng Yu and Ming-hui Zhao in Lupus
Supplemental Material
sj-pdf-3-lup-10.1177_09612033221094711 – Supplemental Material for Proteomic profiling of kidney samples in patients with pure membranous and proliferative lupus nephritis
Supplemental Material, sj-pdf-3-lup-10.1177_09612033221094711 for Proteomic profiling of kidney samples in patients with pure membranous and proliferative lupus nephritis by Yun-Ying Chen, Ying Ding, Lin-Lin Li, Sha-Sha Han, Min Huang, Catherine C. L. Wong, Feng Yu and Ming-hui Zhao in Lupus
Footnotes
Declaration of conflicting interests
The author(s) declared no potential conflicts of interest with respect to the research, authorship, and/or publication of this article.
Funding
The author(s) disclosed receipt of the following financial support for the research, authorship, and/or publication of this article: This study was supported by the National Natural Science Foundation of China (81870479) and the Beijing Natural Science Foundation (7212114).
Supplemental Material
Supplemental material for this article is available online.
References
Supplementary Material
Please find the following supplemental material available below.
For Open Access articles published under a Creative Commons License, all supplemental material carries the same license as the article it is associated with.
For non-Open Access articles published, all supplemental material carries a non-exclusive license, and permission requests for re-use of supplemental material or any part of supplemental material shall be sent directly to the copyright owner as specified in the copyright notice associated with the article.