
Abstract
Objective
To analyze the characteristics of peripheral blood lymphocyte subsets in systemic lupus erythematosus (SLE) patients with infection and non-infection group. Explore the risk factors of infection in SLE patients and establish a risk matrix model to predict the occurrence of co-infection.
Methods
total of 333 SLE patients without infection, 163 patients suffering from infection, and 132 healthy controls (HCs) were recruited. General clinical data and disease activity indicators were collected. The levels of total T, B, CD4+T, CD8+T, NK, Th1, Th2, Th17, and Treg cells in peripheral blood of HCs, SLE patients (including infected and non-infected group) were analyzed by flow cytometry. The risk assessment model was constructed, and the receiver operating characteristic curve was drawn. 39 SLE patients with infection and 20 patients without infection were randomly selected to evaluate the predictive power of the regression model.
Results
The levels of T, B, CD4+T, CD8+T, and NK cells in the infected patients were significantly decreased when compared with that of both non-infected patients and HCs (p < .05). The non-infected patients had a higher level of Th17 than that of HCs (p < . 05), but the absolute numbers of Th17 in infected patients was the lowest among the three groups (p < .001). The number of Treg cells in SLE patients was significantly lower than that of HCs (p < .01), and the infected patients had the fewest Treg cells among all these groups (p < . 05). A risk assessment model for SLE with infection was established, p = 1/(1−e−y), Y = 1.763-0.004 × Absolute number of CD4 + T cells-0.005 × Absolute number of NK cells −0.005 × Platelet count(×1012/L) + 1.033 × Absolute number of lymphocytes (×109/L) + 0.023 × C-reactive protein (mg/dL), whose predictive sensitivity is 77.5%, and specificity is 78.3%.
Conclusion
The new risk assessment model exhibits good predictive ability to assess co-infection risk in SLE patients. T cells, NK cells, and CD4 + T cells along with other parameters help in differentiating Lupus with infection from Lupus alone.
Introduction
Systemic lupus erythematosus (SLE) is a heterogeneous autoimmune disorder characterized by a variety of autoantibodies production that affects multi-system in the body with a vast array of clinical manifestations. 1 Its pathogenesis and mechanism are complex, and it can occur at any age, especially in women. 2 Despite advanced awareness of this disease and multiple autoantibodies, infections are a most common cause of morbidity and mortality in this patient population.3–5 It is estimated that at least 50% of patients with SLE suffered with infections during the course of their disease 6 and around 30% of deaths are related to infections.7,8 The possibility of co-infection in active SLE patients should arouse our vigilance.
The pathogenesis of SLE patients predisposed to infection is complex. Viruses, bacteria, fungi, and protozoa can trigger SLE disease activity through bystander activation, molecular mimicry, and antigenic spreading. 9 The deregulation of intrinsic and adaptive immune system plays a central role in the susceptibility of patients to infections. Recent studies revealed that SLE patients with infection had immunologic abnormalities, especially those treated by immunosuppressive agents.10–14 Studies have shown that dysregulation of lymphocyte subpopulations plays an important role in the carcinogenesis and progression of SLE. CD4 + T cells play an important role in orchestrating immune responses, 15 and CD8+ T cells responses are essential for efficient anti-tumor and anti-viral immunity.16,17 Previous investigators have reported that the inhibitory induction effect of CD4+T cells and the function of CD8+T lymphocytes in SLE patients are decreased. Immune disorders cause the continuous activated B cells to produce autoantibodies, which are involved in the occurrence and development of SLE disease.18,19 However, the characteristics of lymphocyte subsets in patients with SLE and their relationship with infection remain unclear, and no further study was performed in elucidating the risk factors for infection in patients with SLE.
The interaction between SLE and infection is complicated. SLE renders its affected patients vulnerable to infection, and infection can induce the aggravation of SLE. However, no study has built an effective risk assessment model for prediction in SLE patients with infection. In this retrospective study, we mainly measured the absolute counts of peripheral blood (PB) lymphocytes and CD4+T cell subsets of SLE patients with infection to those without infection and/or those of healthy controls (HCs) to elucidate the immune mechanism of SLE. This study further explored the clinical characteristics of SLE patients with co-infection, and evaluated the risk of infection in SLE patients by establishing a matrix model for early prevention and identification.
Methods
Recruitment of participants
Between July 2014 and December 2016, 495 patients with SLE from the inpatient population of the Second Hospital of Shanxi Medical College were enrolled in the study, including 446 females and 49 males, 333 non-infected groups, and 162 infected groups. All patients fulfilled the 2019 SLE revised classification criteria of the American College of Rheumatology. 20 Age- and sex-matched 132 healthy individuals were recruited from the physical examination center of the Second Hospital. Exclusion criteria: (1)Patients with incomplete clinical data; (2) Patients complicated with other autoimmune diseases; (3) Patients during pregnancy and lactation; (4) Patients with other autoimmune diseases, malignant tumors, or serious dysfunction of heart, liver, or kidney; (5) Patients with a recent history of surgery or trauma; (6) age < 18 years old. All subjects recruited for this study provided prior written informed consent and this study was approved by the Ethics Committee of the Second Hospital of Shanxi Medical College (Taiyuan, China).
Infection defined
The history, physical examination, and auxiliary examination were based to determine whether infection is bacterial or viral. The presence of an infection was confirmed by a positive pathogen test from various specimens (blood, sputum, pus, stool, and urine) or clear evidence of infection, such as an abscess on computed tomography. If patients had fever (body temperature over 38.0°C) for at least 3 days caused not by disease activity, and effectively reversed by anti-infective treatment were also considered as infected.21–23 Infection is not recorded if there is no supporting evidence of infection or doubt about the cause of the current symptoms.
Research methods
The total T, B, CD4 + T, CD8 + T, natural killer cell (NK), Th1, Th2, Th17, and Treg lymphocyte subsets in peripheral blood were analyzed by flow cytometry (FCM). The patient’s gender, age, course of disease, infection site, pathogen type, clinical manifestation, systemic lupus erythematosus disease activity index (SLEDAI) score, hormone, immunosuppressant use, and auxiliary laboratory indexes were recorded. We assessed the activity of the disease using the SLEDAI score: no activity (SLEDAI = 0–4), mild activity (SLEDAI = 5–10), moderate activity (SLEDAI = 11–14), and high activity (SLEDAI ≥ 15). 24 All patients were on prednisone and/or other immunosuppressive medications to control disease activity.
Flow cytometric analysis
Materials
Phorbol myristate acetate (PMA), Anti-human FoxP3-PE and IL-17-PE, permeabilization buffer 10 × fixation/permeabilization diluent, and fixation/permeabilization concentrate were from Invitrogen, eBioscience, Affymetrix Inc. (by Thermo Fisher Scientific, San Diego, CA 92121, USA). GolgiStop was from BD Biosciences Pharmingen (10975, Torreyana Road, San Diego, USA). Monoclonal antibodies including CD3FITC/CD8PE/CD45PercP/CD4APC, CD3FITC/CD16+56-PE/CD45 PercP/CD19APC, CD4-FITC, IL-4PE, IFN-γ-APC, CD25-APC, and Trucount tube (contain a set number of beads) were from Becton-Dickinson (USA).
Absolute lymphocyte count
Briefly, the absolute number of T cell subsets (cell/μL) were established from fresh blood samples using reference beads in the Trucount tube from BD as internal standard for cell concentration. This BD Trucount tube with beads is ready to use and avoids variation produced by adding standard beads one by one.
Analysis of lymphocyte surface and intracellular markers
The total absolute number of CD4+T cells was assessed by flow cytometry (FACS Calibur, Becton Dickinson) according to our modified stain-and-then lyse-and-wash protocol in manufacturers’ directions of BD Trucount TM tubes. Briefly, 50 μL of EDTA-anticoagulated venous blood was added into the Trucount tube A and B separately by reverse pipetting and stained by 20 μL of antiCD3-FITC/CD8-PE/CD45-PercP/CD4-APC antibodies in tube A and 20 μL of CD3-FITC/CD16+56-PE/CD45-PercP/CD19-APC antibodies in tube B (do not touch the blood). Then cells were mixed with 450 μL of 1X FACS. Fifteen thousand cells were acquired and detected by MultiSET software within 24 h. The absolute number of T, B, CD8+T, and NK cells could also be count by the same way.
Analysis of Th1/Th2/Th17 cells
Cells in 80 μL of heparin-anticoagulated venous blood were stimulated by 10 μL PMA, 10 μL ionomycin (final concentration was 750 ng/mL), and 1 μL GolgiStop, respectively, at 37°C for 5 h and then divided into two tubes (tube A and tube B) followed by staining with human anti-CD4-FITC antibodies in room temperature away from light for 30 min. Using 1 mL fresh fixation/permeabilization to fix and permeabilize cells and then stained them by IL-4-PE and IFN-γ-APC in tube A and human anti-IL-17-PE in tube B. The cells were washed with PBS and analyzed using flow cytometry.
Analysis of CD4+CD25+Foxp3+Treg cells
Cells in 80 μL of heparin-anticoagulated vein blood were surface-labeled with anti-CD4-FITC and anti-CD25-APC and fixed and permeabilized by 1 mL fresh fixation/permeabilization followed by staining with human anti-FOXP3-PE.
Statistical analyses
All statistical analyses were performed with SPSS 26.0 software (IBM, USA). The categorical demographic characteristics of the patients were compared with the use of the χ2 test. Continuous data that satisfy the homogeneity of normality and variance are presented as mean (±SD). An independent Student’s t-test was used for comparisons between two groups, and one-way analysis of variance (ANOVA) was used for comparisons among three or more groups. Data that does not satisfy the homogeneity of normality or variance are presented as median (range) and compared by Mann–Whitney U test. Spearman correlation test was used for correlation analysis. Statistically significant variables were included in the multi-factor logistic regression analysis, and the variables of measurement data were first converted into classification variables and then analyzed. The risk assessment model building was based on a logistic regression model, the receiver operating characteristic (ROC) curve was drawn, and the samples of clinical SLE patients were randomly selected to determine the predictive efficacy of the model. All statistical tests were conducted by bilateral test, and p < .05 was considered statistically significant.
Results
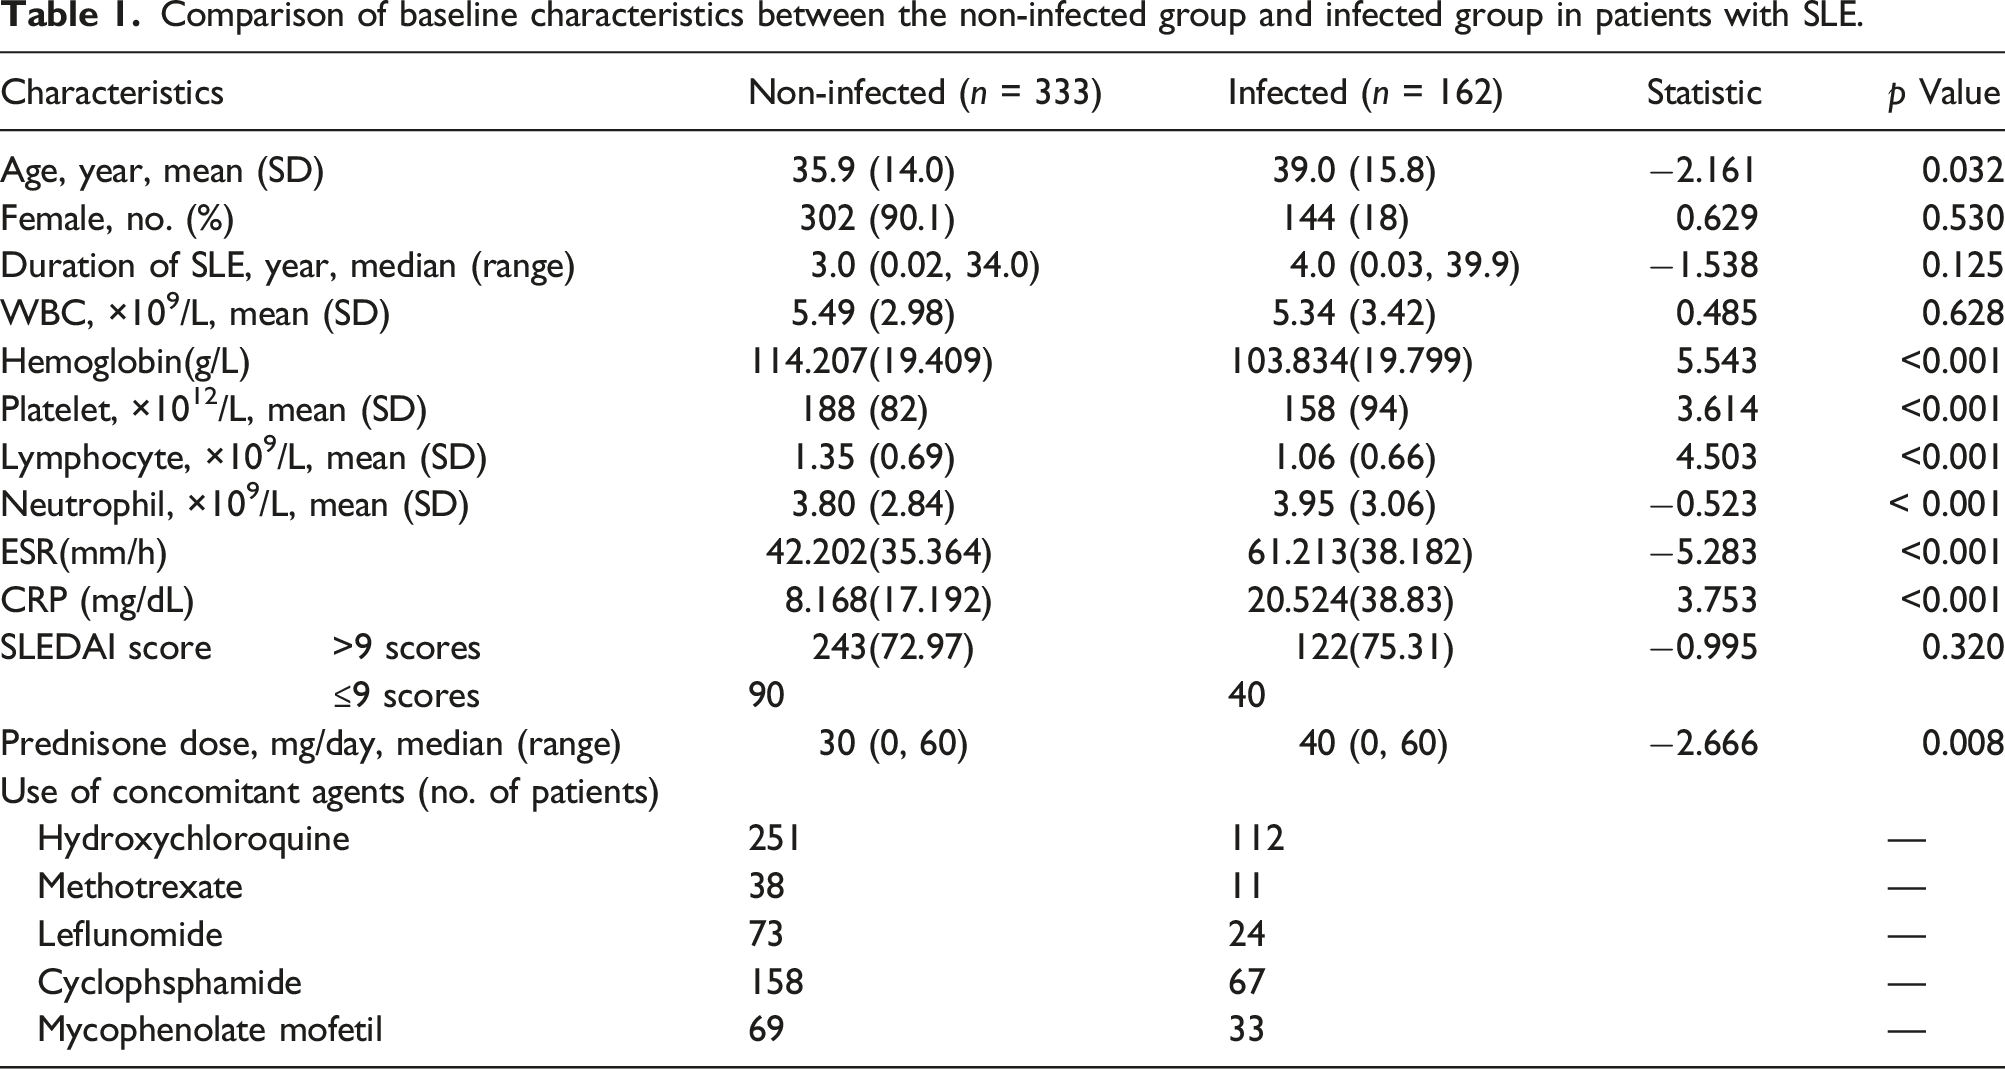
Demographic and clinical characteristics of SLE patients in the non-infected and infected groups
Comparison of baseline characteristics between the non-infected group and infected group in patients with SLE.
Comparison of peripheral lymphocyte subsets in the SLE infected group, non-infected group, and healthy control group
The absolute numbers of T and CD4+T cells in the non-infected group were significantly lower than that of HCs (p < .001), but still dramatically higher than that in infected patients (p < .001). The levels of B, CD8+T, and NK cells in the infected patients were significantly decreased when compared with that of both non-infected patients and health controls (p < . 01), while there was no significant difference in these cells between health controls and the non-infected patients (p > .05) (Figure 1(a)). As for CD4+T cell subsets, the numbers of Th1 and Th2 cells in the infected group were lower than that of non-infected patients and health controls (p < . 001), though there was no significant difference in these cells between the non-infected patients and HCs (p > .05). The non-infected patients had a higher level of Th17 cells than that of HCs (p < . 05), but the absolute numbers of Th17 cells in infected patients were the lowest among the three groups (p < . 05). The number of Treg cells in SLE patients was significantly lower than that of HCs (p < .01), and the infected patients had the fewest Treg cells among all these groups (p < . 05) (Figure 1(b)). Multiple subpopulations of lymphocytes decreased in peripheral blood of SLE patients with infection. Absolute numbers of peripheral lymphocytes subpopulations were analyzed by flow cytometry. Data were presented as mean ± SD and statistical analysis was determined by one-way ANOVA. *p < 0.05, **p < 0.01, ***p < 0.001. (a) shows that SLE patients (n = 495) have lower levels of T, B, NK, CD4+T, and CD8+T cells in PB compared with that of health controls. The numbers of PB lymphocytes in the infected groups (n = 162) was also much lower than those in non-infected patients (n = 333). (b) shows the comparison of numbers of CD4+T cell subsets among different groups. Patients with SLE have lower levels of Th1 cells, Th2 cells, Th17 cells as well as Treg cells compared with those in health donors (n = 132), especially the infected groups.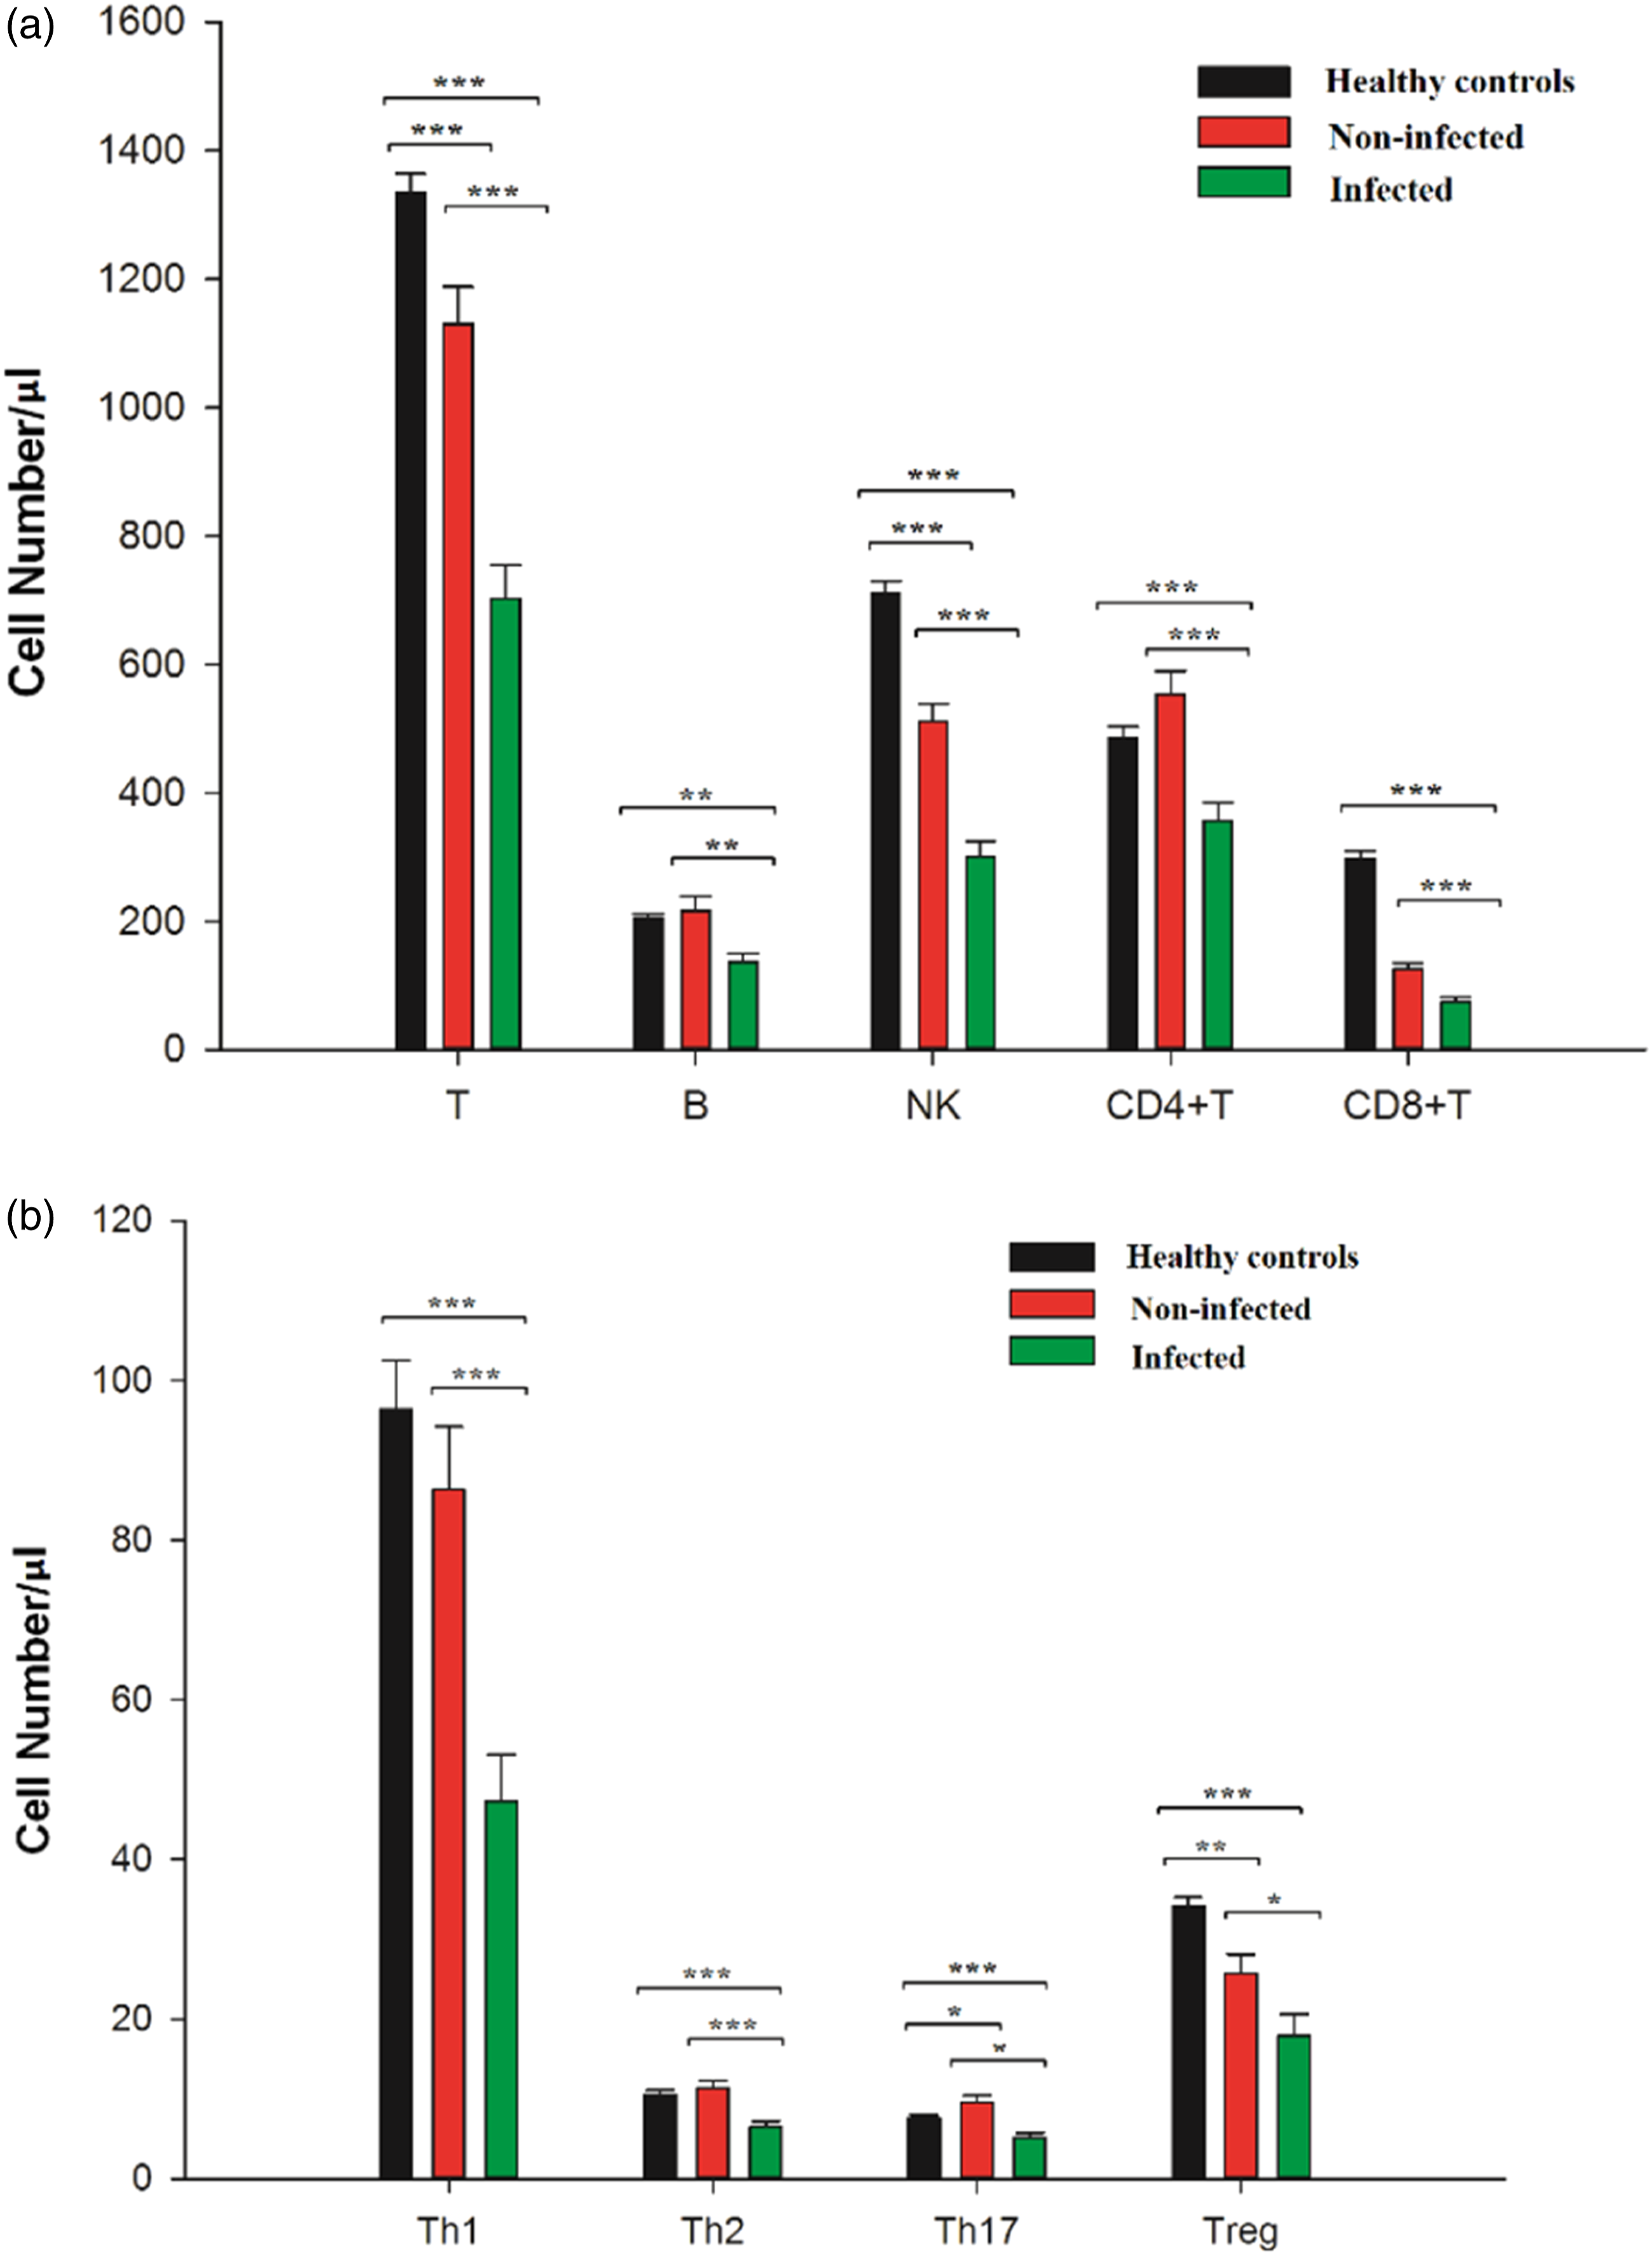
Correlation analysis between peripheral lymphocyte subsets count and disease activity in SLE-infected patients
Correlation analysis between peripheral lymphocyte subsets count and disease activity in SLE-infected patients.
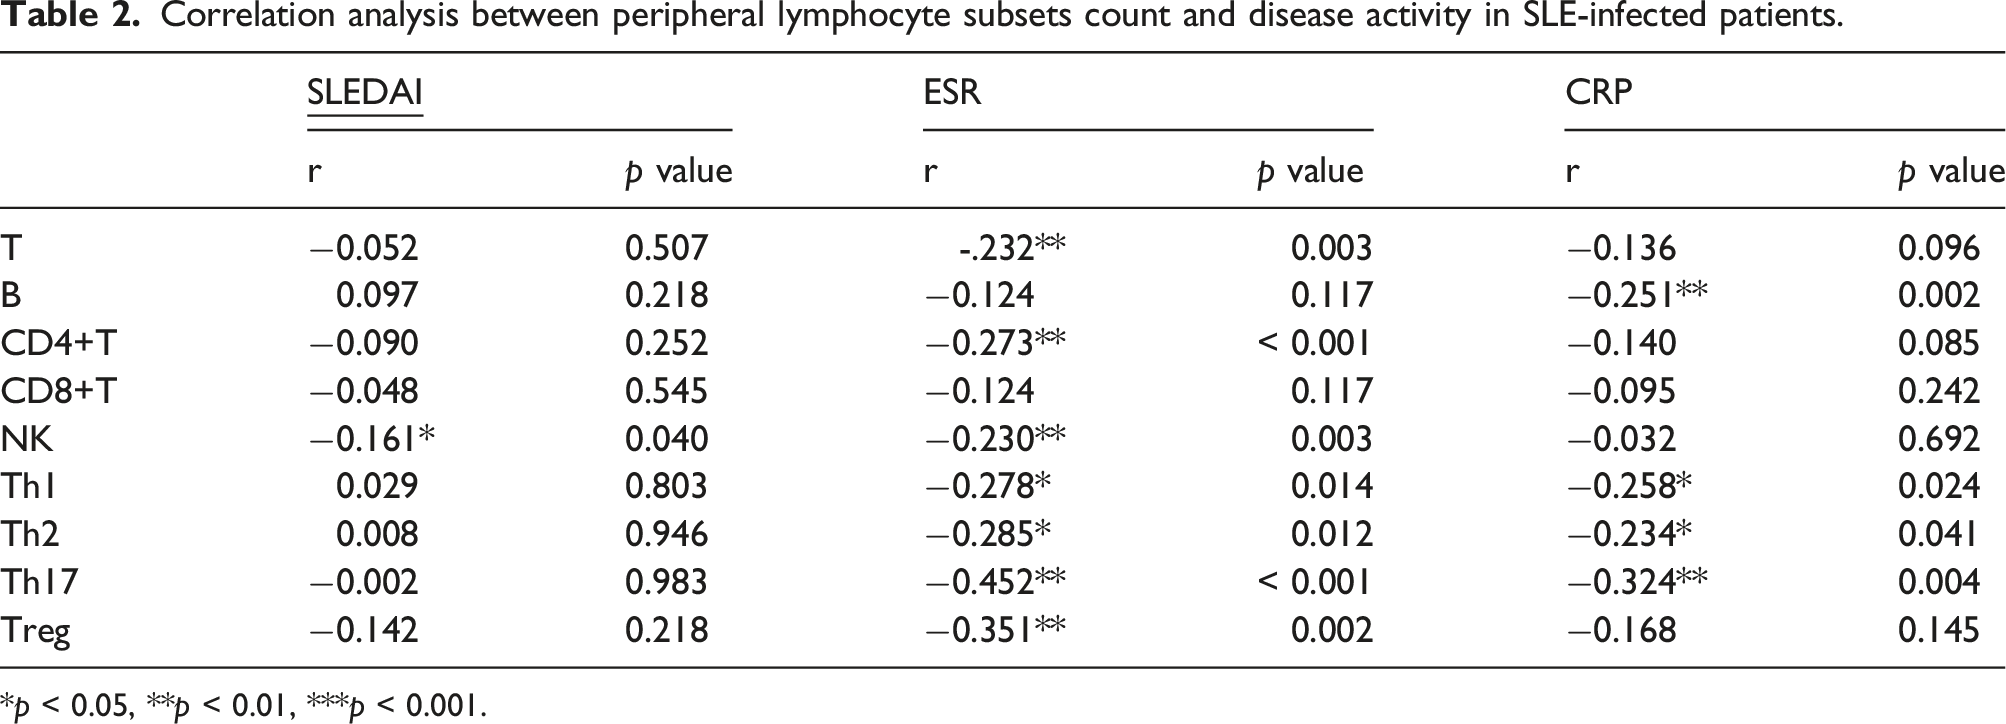
*p < 0.05, **p < 0.01, ***p < 0.001.
Prediction of peripheral lymphocytes in patients with SLE infection
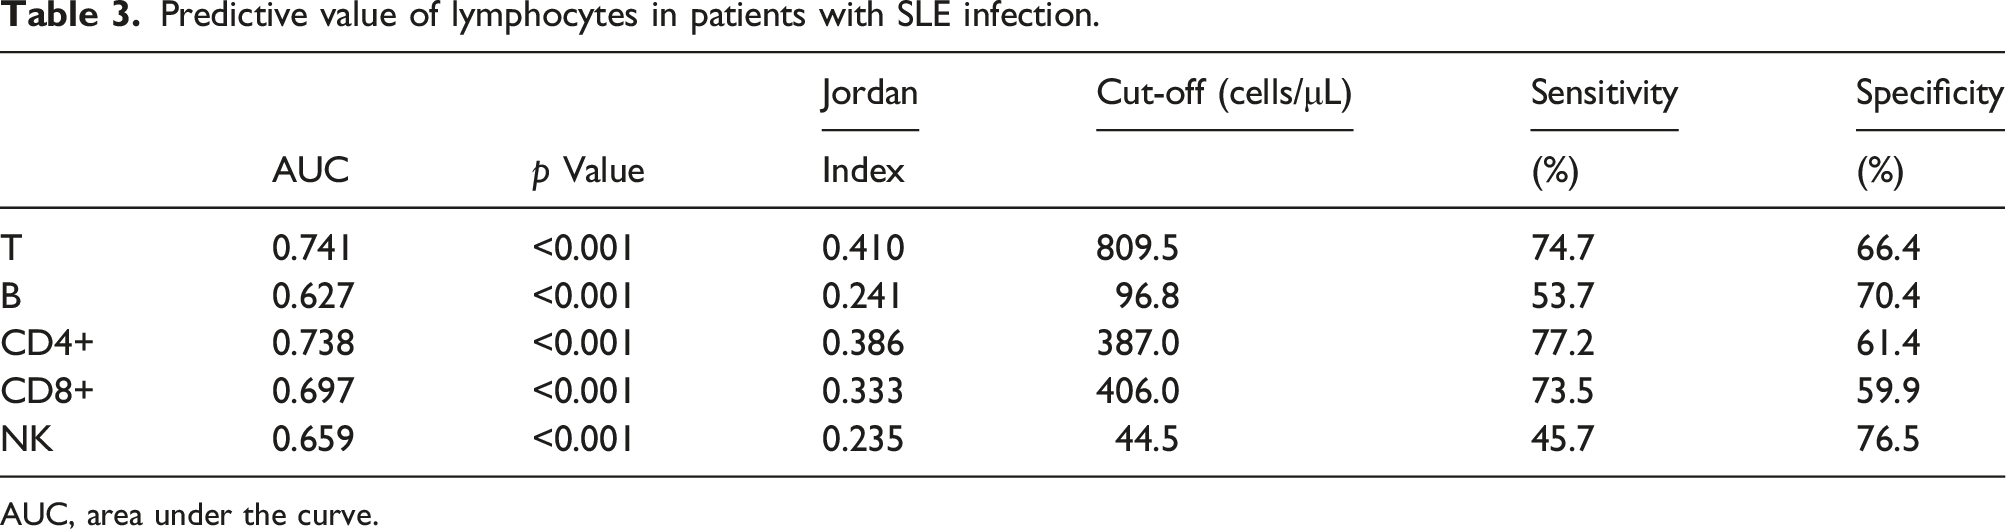
Analysis of clinical characteristics of SLE patients with infection showed that CD4+T, CD8+T, and NK cells were statistically different from those of the uninfected group (p < .001). The predicted infection value of single peripheral lymphocyte was analyzed by drawing ROC curve. The area under the ROC curve (AUC) of T cell count was the largest, with 809.5 cells/μ L as the critical value, and its sensitivity and specificity for predicting SLE infection are 74.7% and 66.4%, followed by CD4+T, CD8+T, and NK cell counts. The critical values of 387/μ L, 406/μ L, and 44.5/μ L, respectively, showed low sensitivity and specificity in predicting SLE infection (Figure 2(a) and Table 3). New prediction models should be further explored. The receiver operating characteristic (ROC) curve (a) ROC curve of lymphocytes for predicting SLE co-infection. (b) ROC curve of SLE co-infection. Predictive value of lymphocytes in patients with SLE infection. AUC, area under the curve.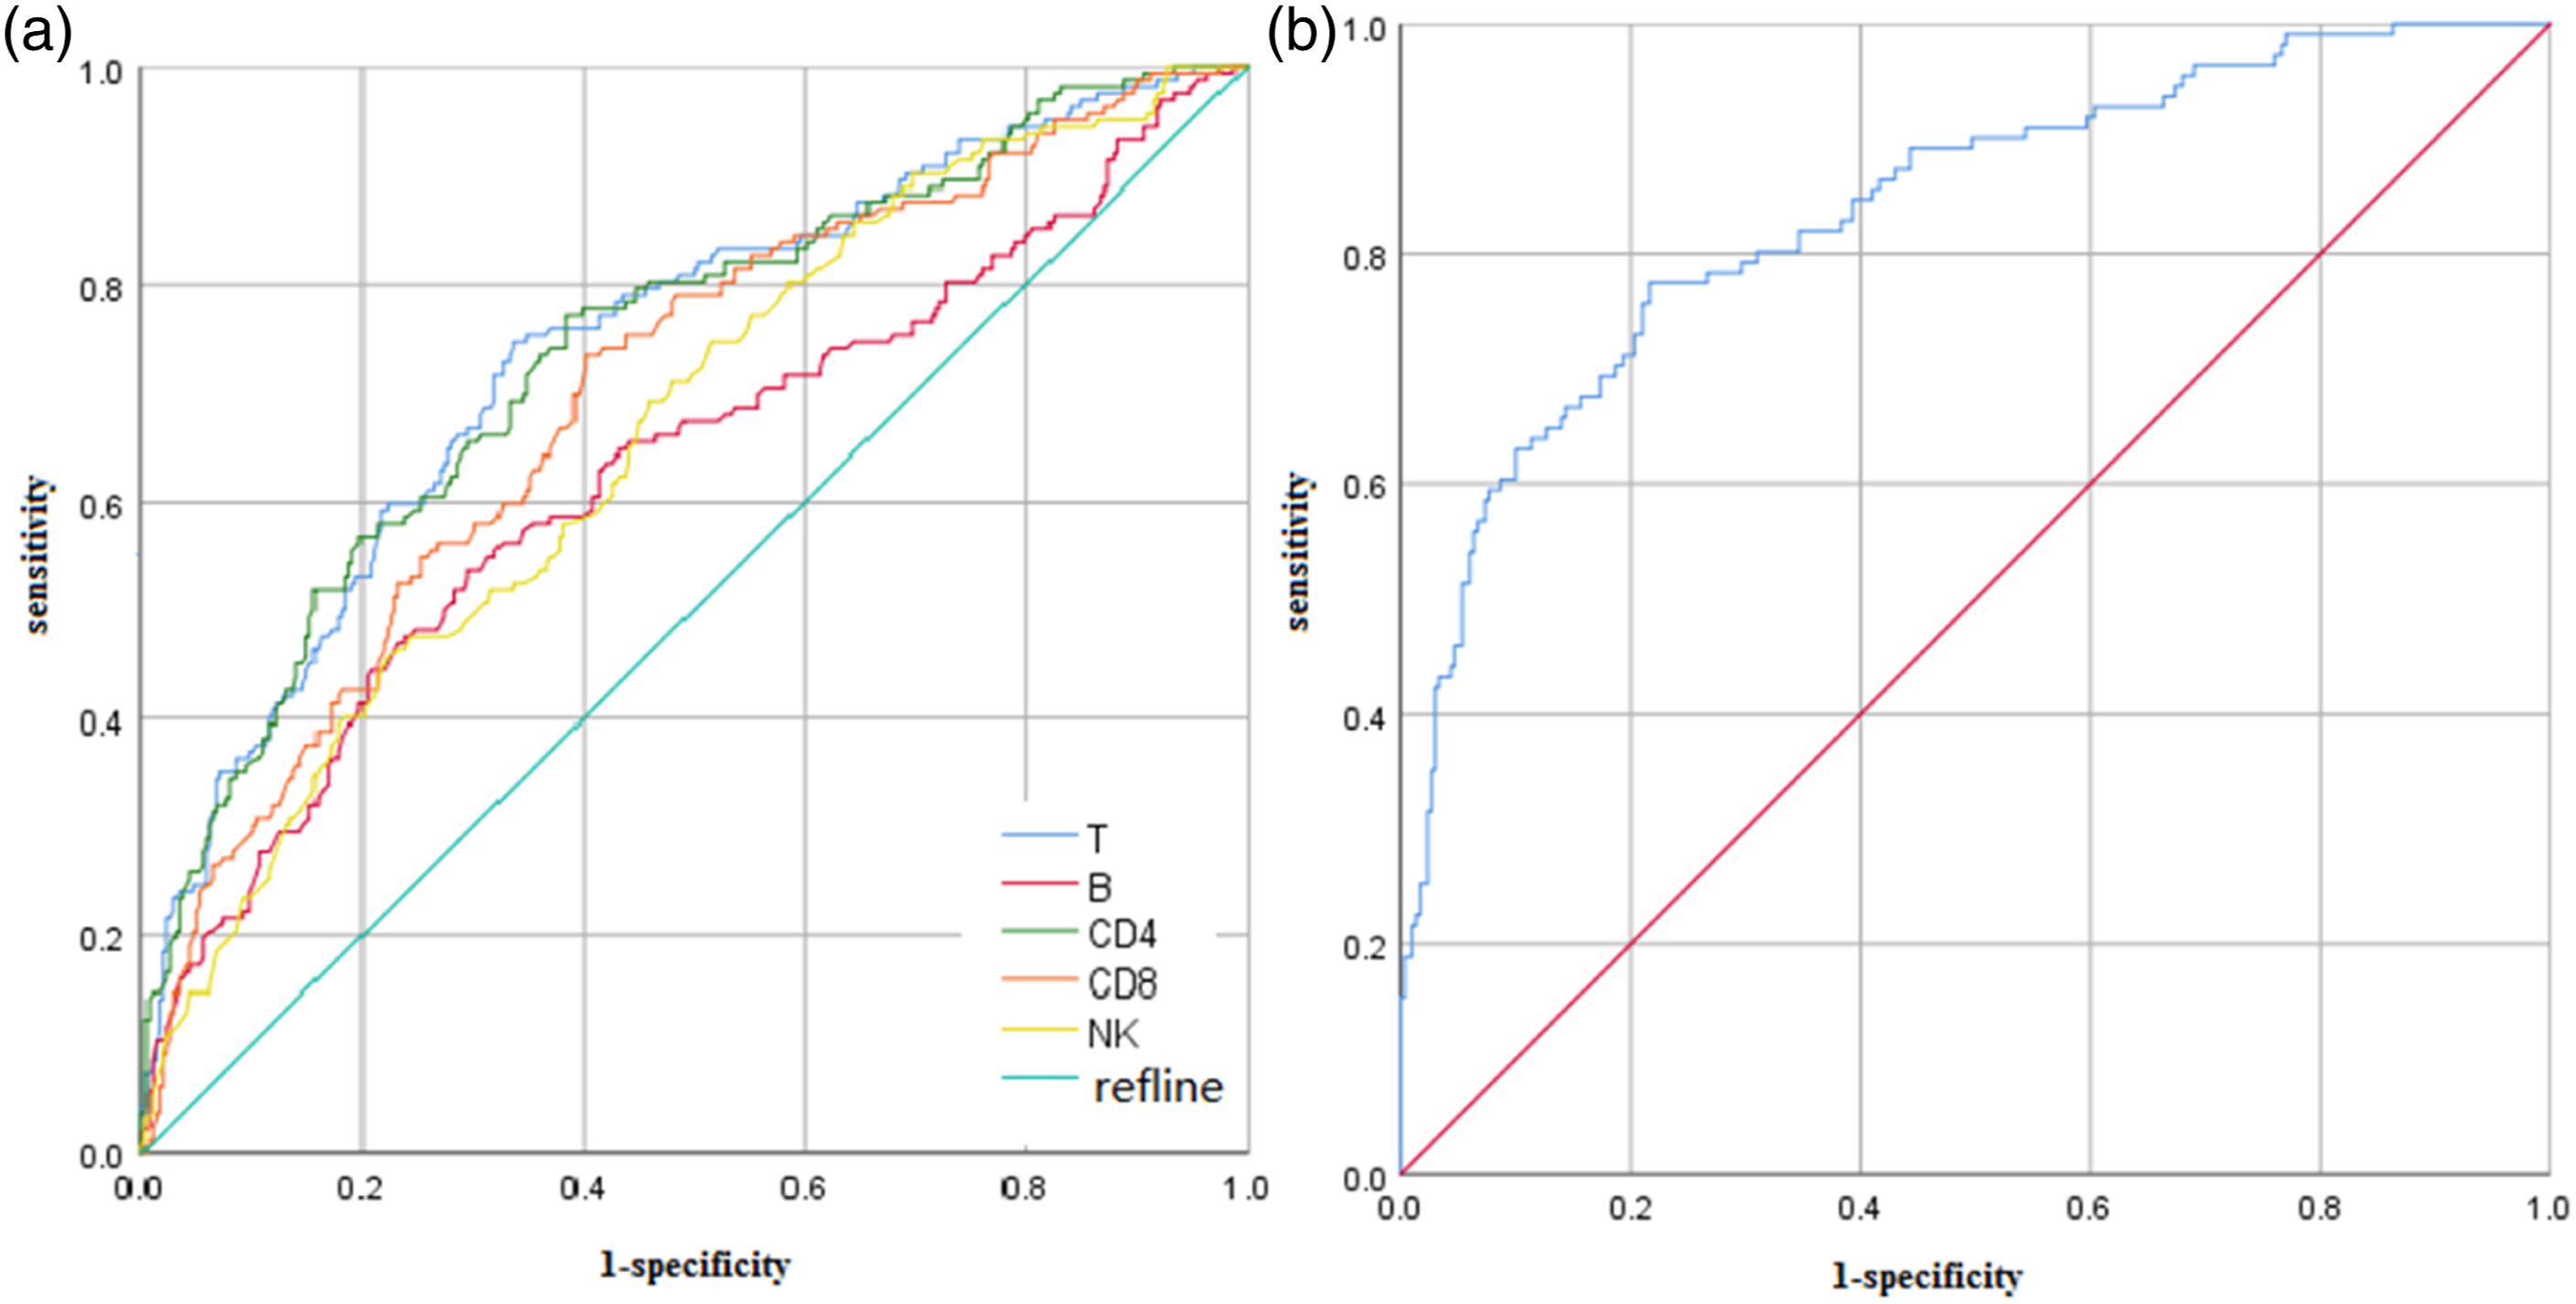
Multivariate logistic regression analysis of SLE patients with infection
Multivariate logistic regression analysis of SLE patients with infection.
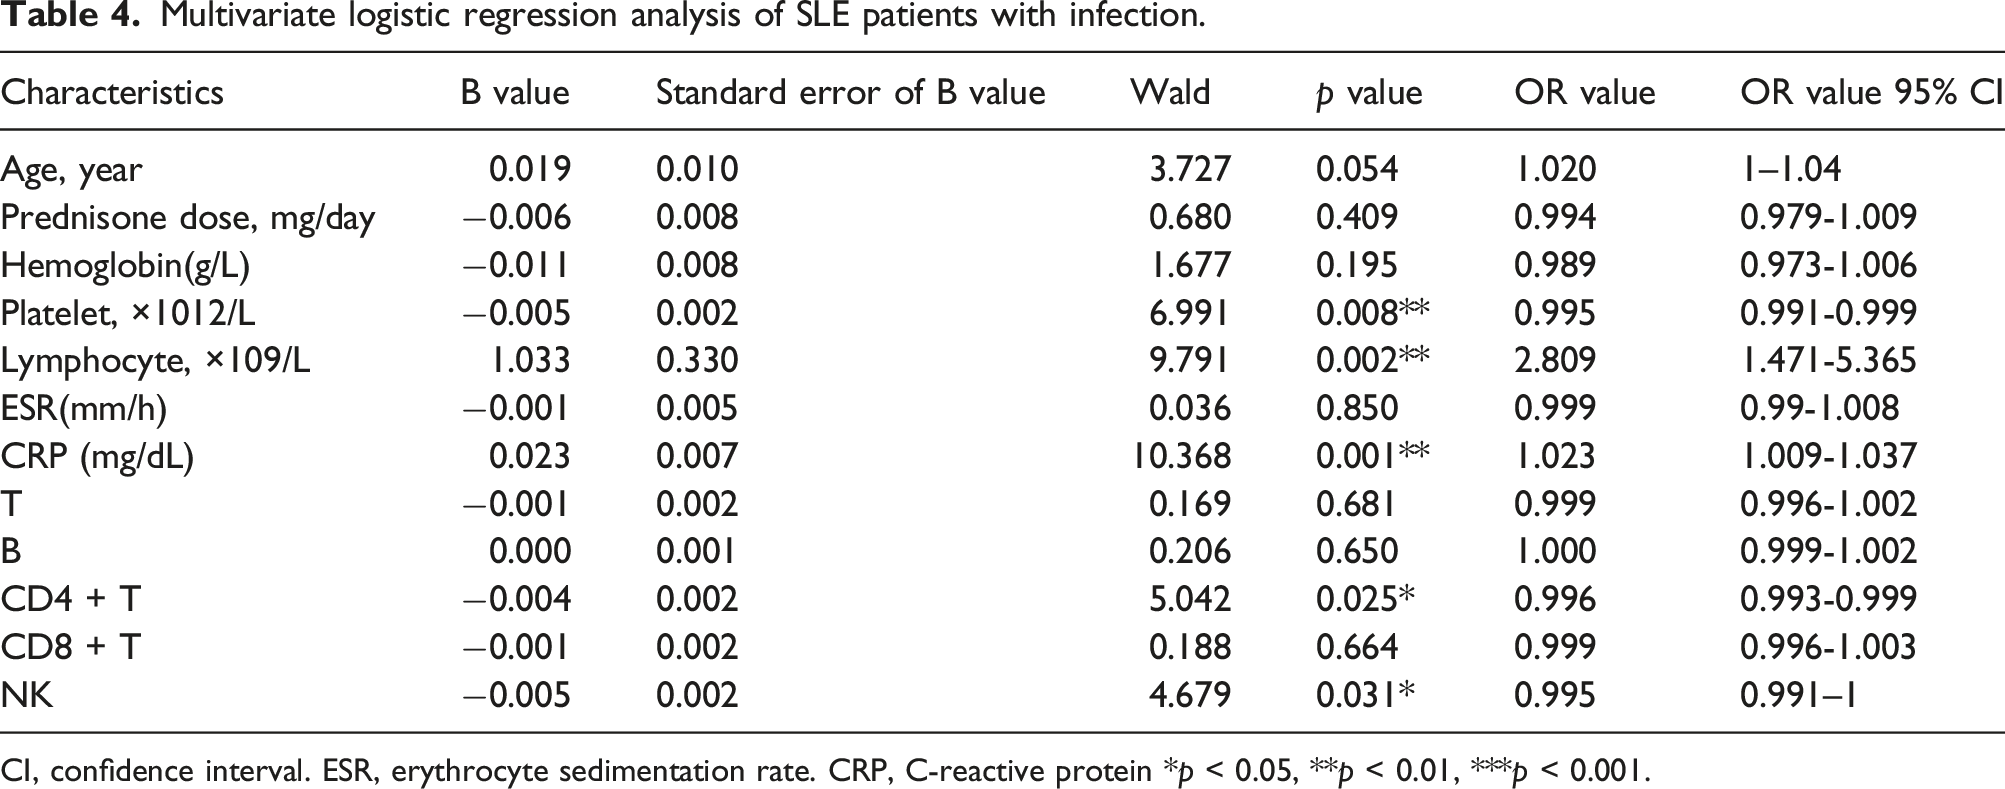
CI, confidence interval. ESR, erythrocyte sedimentation rate. CRP, C-reactive protein *p < 0.05, **p < 0.01, ***p < 0.001.
Build a risk assessment model
The risk assessment model of SLE with infection was constructed by logistic coefficient and constant terms, p = 1/(1−e−y), Y = 1.763-0.004 × absolute number of CD4+T cells −0.005 × absolute number of NK cells −0.005 × platelet count (×1012/L) + 1.033 × absolute number of lymphocytes (×109/L) + 0.023 × C-reactive protein (mg/dL), where p is the probability of SLE patients with co-infection, and each indicator value is the actual detected value. ROC curve was drawn according to the constructed regression equation (Figure 2(b)), and AUC value of the area under the curve was 0.838 (95% CI: 0.793, 0.883). The point closest to the upper left corner of the ROC curve was selected. According to each coordinate point, the value at Jorden index (sensitivity + specificity −1) is 0.558, and cut-off = 0.282 is the best diagnostic threshold value. The predicted sensitivity is 77.5% and the specificity is 78.3%. This regression equation has better goodness of fit.
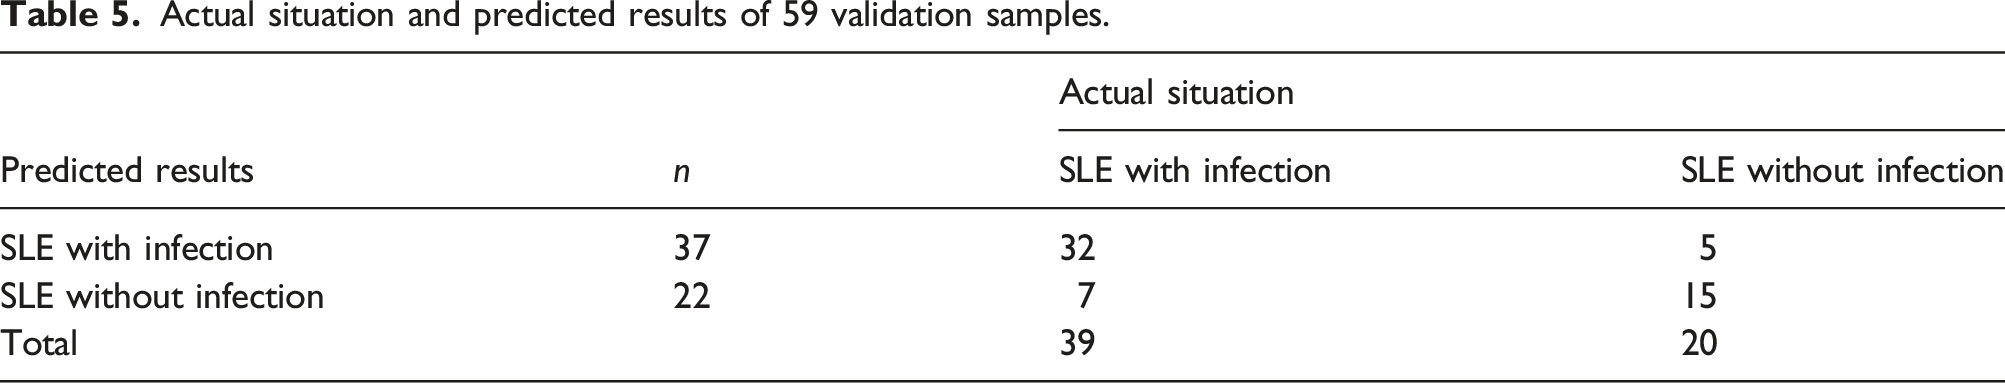
Evaluation of predictive value of regression model
Actual situation and predicted results of 59 validation samples.
Discussion
SLE is a chronic autoimmune disease with multiple organ involvement. Infection is the main cause of death in SLE patients under the immune disorder, disease activity, and the use of hormones and immunosuppressants. 7 Epidemiological studies have found that the hospitalization rate of SLE patients with infection is 11%–23%, 25 which is 12 times higher than that without infection. 26 Our results show that patients with older age or longer course of disease are more susceptible to infection. There is no significant difference between the total infection rate of SLE (32.7%) and previous reports (11%–45%).27,28 We should be highly vigilant about the possibility of co-infection in SLE patients with active disease. Viruses, bacteria, and protozoa lead to immune dysfunction through epitope diffusion, molecular simulation, and bypass activation. 9 Our data confirm that SLE co-infection occurs in a wide range of sites, in which respiratory tract infection is the most common site, mainly bacteria, followed by fungi, viruses and other infections, which is consistent with previous studies.25,29 Streptococcus pneumoniae is the most common pathogenic microorganism of respiratory tract infection. Staphylococcus aureus can cause bacteremia, skin, and joint infections. Escherichia coli mainly causes urinary tract infection. Epstein–Barr virus, cytomegalovirus, and respiratory syncytial virus are common viral infections.
The possible cause of infection is lymphocyte disorder and immune system abnormality.30,31Our results show that the absolute number of T, B, NK, CD4 + T, CD8 + T, Th1, Th2, Th17, or Treg cells in peripheral blood of SLE patients is in low level. Moreover, the decrease of these cells was more obvious in SLE patients with infection, suggesting that both innate and adaptive immune systems in SLE patients are disturbed. 32 Studies have shown that the levels of CD4+T, CD8+T, and NK cells in SLE patients with co-infection are lower than those in SLE patients without co-infection, indicating that the immune disorders in SLE patients with co-infection are more significant. The low absolute number of all these lymphocytes in infected SLE patients may serve as an indicator of infection in SLE patients, and monitoring the lymphocyte subsets in SLE patients may provide a reference for the prevention and treatment of infection.
In our study, the number of T cells has interesting sensitivity and specificity of 74.7% and 66.4%, with apparent clinical utility. It is well-known that T cells play a central role in modulating host immune responses to pathogens. CD4+ T cells and CD8+ T cells make up the majority of T cells. 33 CD4+T cells mainly play an auxiliary role in coordinating the interaction between immune cells. 15 CD8+T lymphocytes are mainly involved in anti-virus, anti-tumor immunity, and suppression of immune response.16,17 According to previous reports,18,19 the inhibition and induction of CD4+T cells and the function of CD8 + T lymphocytes in patients with SLE are reduced. Immune imbalance makes continuously activated B cells produce autoantibodies, which is involved in the occurrence and development of SLE disease. Infections are prone to develop in SLE patients with severe lymphocytopenia, especially CD4+ T cell depletion.34,35
SLE patients themselves have a high risk of infection, and infection can induce the exacerbation of SLE. Clinically, it is difficult to distinguish disease activity and co-infection in SLE patients. 36 Therefore, the absolute number of peripheral blood lymphocytes in SLE patients showed that CD4+, CD8+, and NK cells with co-infection were significantly lower than those without co-infection, which could be an important indicator for the clinical differentiation or diagnosis of SLE co-infection. Monitoring of related indicators during the diagnosis and treatment of SLE patients can be used to assess the degree of disease activity and as a potential standard for predicting SLE co-infection. To clarify the risk factors of SLE patients with infection and establish a preliminary risk assessment model based on logistic regression analysis may provide help for the early diagnosis of SLE patients with co-infection, so as to carry out active intervention and effective treatment. Therefore, in order to control the disease of SLE patients and reduce the hospital length of stay, it is necessary to keep an eye out for the clinical and laboratory indicators of patients, rationally use glucocorticoids and immunosuppressants, improve the immunity of patients, and control the condition of SLE.
In conclusion, autoimmune disorders are mainly manifested by reduced number of various peripheral lymphocyte subsets in SLE patients. The absolute number of peripheral lymphocyte subsets in infected SLE patients was significantly reduced compared with that in uninfected patients, and the low absolute number status of these cells can be used as an indicator of a higher risk of infection in SLE patients. A risk assessment model for SLE with infection was established, p = 1/(1−e−y), Y = 1.763-0.004 × absolute number of CD4+T cells −0.005 × absolute number of NK cells −0.005 × platelet count (×1012/L) + 1.033 × absolute number of lymphocytes (×109/L) + 0.023 × C-reactive protein (mg/dL), this may be a new method to identify SLE patients with co-infection.
Footnotes
Acknowledgements
We acknowledge and appreciate our colleagues for valuable efforts and comments on this paper.
Author contributions
Study design and manuscript writing: JZ and SZ. Data extraction, quality assessment, analysis, and interpretation of data: JQ and MQ. All authors were involved in drafting the article or revising it critically for important intellectual content, and all authors approved the final version to be published. Xiao-Feng Li had full access to all of the data in the study and takes responsibility for the integrity of the data and the accuracy of the data analysis.
Declaration of conflicting interests
The author(s) declared no potential conflicts of interest with respect to the research, authorship, and/or publication of this article.
Funding
The author(s) disclosed receipt of the following financial support for the research, authorship, and/or publication of this article: This project was supported by the National Natural Science Foundation of China (No. 82001740) and Graduate Students Outstanding Innovation Project Foundation of Shanxi Province (2C592020079). The funding body had role in the design of the study and collection, analysis, and interpretation of data.
Data Availability
All data generated or analyzed during this study are included in this published article.
Ethics approval
This study was approved by the Ethics Committee of the Second Hospital of Shanxi Medical University (2016 KY-007).