
Abstract
Objective
The aim was to investigate the changes in retinal and choroidal thickness and vascular density in patients with systemic lupus erythematosus (SLE) using optical coherence tomography angiography (OCTA).
Methods
Twenty-nine patients with SLE (29 eyes) and 25 control subjects (25 eyes) were enrolled. SLE activity was assessed using the Systemic Lupus Erythematosus Disease Activity Index (SLEDAI). Retinal thickness (RT), inner retinal thickness (IRT), outer retinal thickness (ORT), choroidal thickness (ChT), retinal superficial vascular density (SVD), retinal deep vascular density (DVD), choriocapillary vascular density (CCVD), foveal avascular zone (FAZ), superficial FAZ (sFAZ), and deep FAZ (dFAZ) were measured using OCTA. The retinal and choroidal thickness and vascular density between the control group and SLE group were compared. The relationships between SLEDAI scores and the retinal and choroidal thickness and vascular density in SLE group were analyzed.
Results
The SVD was significantly increased, and the DVD and CCVD were significantly decreased in the SLE group compared to the control group (p < .05). The results of receiver operating characteristic (ROC) showed that the area under the curve (AUC) values of SVD, DVD, and CCVD were 0.873, 0.729, and 0.727, indicating a high accuracy in discriminating patients with SLE from controls. Correlation analysis showed that the SLEDAI scores were positively correlated with dFAZ (r = 0.589, p = .001) and FAZ (r = 0.451, p = .018), and negatively correlated with DVD (r = −0.491, p = .009) and CCVD (r = −0.521, p = .005).
Conclusions
DVD and CCVD were decreased in the SLE and might be related to the disease activity. SVD, DVD, and CCVD may hold promise in the discovery of biomarkers for diagnosing SLE.
Keywords
Introduction
Systemic lupus erythematosus (SLE) is a persistent autoimmune disorder that can induce systemic alterations affecting various bodily components such as the integumentary system, musculoskeletal system, renal system, and ocular structures. 1 Approximately 33%–35% of patients diagnosed with SLE exhibit ocular manifestations. 2 Among the ocular manifestations observed in individuals with SLE, the most common manifestation is dry eye, accompanied by retinal and choroidal vascular alterations, as well as corneal and optic nerve modifications.3,4 The occurrence of retinopathy in SLE is believed to primarily result from immune complex-mediated microangiopathy, making it the second most frequent manifestation. Additionally, retinopathy tends to coincide predominantly with the active phase of SLE. 5 Although not as frequent as retinal involvement, it has been demonstrated that the choroid is also susceptible to being affected in patients with SLE. 6
SLE can result in severe visual impairment or complete loss of vision if left untreated. Multiple studies have posited that individuals diagnosed with SLE ought to undergo ocular evaluations. 7 Fundus examination and fundus fluorescence angiography (FFA) are commonly employed techniques for evaluating the posterior pathway in patients with SLE. 8 However, FFA's limitations in distinguishing between superficial and deep capillary images hinder its ability to detect variations in major capillary networks. Furthermore, traditional angiographic methods fail to directly identify neovascularization and capture the complete retinal capillary system, resulting in potential clinical misdiagnosis and missed diagnoses.9,10 In addition, a subset of patients may experience adverse effects, including allergic reactions, vomiting, and nausea, as a result of the administration of the contrast agent. 2
Optical coherence tomography angiography (OCTA) is a contemporary microvascular imaging technique that has gained significant popularity in the field of retinal microvascular imaging.11,12 By employing the frequency division based decorrelation algorithm, OCTA has the capability to generate three-dimensional (3D) microvascular images of the retina. 13 This noninvasive and high-resolution method surpasses traditional angiographic techniques in several aspects, including its ability to avoid the need for contrast agent injection, its capacity for high-speed imaging to capture blood flow, and its proficiency in producing 3D images of microvascular structures at various depths.14,15
Currently, the utilization of OCTA in the context of SLE remains limited, and the outcomes of associated research have generated conflicting results. This study aimed to examine the ocular condition of individuals diagnosed with SLE, employing OCTA to evaluate retinal and choroidal thickness as well as vascular density in comparison to a control group of healthy individuals.
Methods
Participants
This cross-sectional study was carried out from May 2022 to February 2023 at Chaohu Hospital of Anhui Medical University. Patients diagnosed with SLE were recruited from the Department of Rheumatism Immunology and Department of Nephrology. Inclusion criteria for the study required patients to meet the American College of Rheumatology (ACR) revised criteria for SLE in 1997. Disease severity was measured by the Systemic Lupus Erythematosus Disease Activity Index (SLEDAI) score. The age range of the participants was between 18 and 60 years. The study excluded individuals who met any of the following criteria: (1) a diagnosis of autoimmune disease other than SLE; (2) systemic diseases, such as those affecting the endocrine or nervous system, which have an impact on the eye or optic nerve; (3) retinopathy or choroidal disease; (4) a history of eye tumor, eye surgery, or trauma; (5) diseases that significantly affect fundus imaging; (6) pregnancy or lactation; or (7) contraindications, allergies, or intolerance to local anesthetics or mydriatic drugs. Subjects who came to the Department of Ophthalmology of Chaohu Hospital of Anhui Medical University for physical examination during the same period were included in the control group. The absence of abnormalities in the eyes of the participants was assessed by an ophthalmologist from the medical center using clinical examination and OCTA imaging. All participants underwent examination by the same retinal specialist. This procedure was granted approval by the ethics committee of Chaohu Hospital of Anhui Medical University (registration number: KYXM-202204-004) and adhered to the principles outlined in the Declaration of Helsinki. Informed consent was obtained from all participants.
OCTA imaging
The OCTA procedure was conducted using the RTvue-XR Avanti OCT device (Optovue RTVue XR Avanti; Optovue, Inc., Fremont, CA, USA) operating at a scanning rate of 70,000 A-scans per second. To improve the visualization of the macular vasculature and acquire OCTA images (304 × 304 pixels), the split-spectrum amplitude-decorrelation angiography (SSADA) algorithm was employed. The OCTA system employed a light source with a central wavelength of 840 nm and a bandwidth of 50 nm. Patients exhibiting repeatability of OCTA parameters exceeding 40 were eligible for inclusion in our study.
The retinal thickness (RT) is defined as the distance between the inner limiting membrane (ILM) and the RPE-Bruch's membrane complex. The inner retinal thickness (IRT) is measured from the ILM to the outer boundary of the inner plexiform layer (IPL). The outer retinal thickness (ORT) is determined by the distance between the outer boundary of the IPL and the RPE-Bruch's membrane complex. Choroidal thickness (ChT) is assessed using the device's unique deep choroidal imaging (DCI) mode, which allows for horizontal and vertical cross-scans.
In this study, the analysis of macular retinal microvascular density involved the utilization of OCTA images from both the deep and superficial retinal layers. The retinal superficial vascular density (SVD) was specifically defined as the region spanning from 3 μm below the internal limiting membrane (ILM) to 15 μm below the inner plexiform layer (IPL), while the retinal deep vascular density (DVD) encompassed the range of 15–70 μm below the IPL.
The area of the foveal avascular zone (FAZ) was assessed by employing ImageJ software to quantify the dimensions of the FAZ on en face optical coherence tomography angiography (OCTA) images, encompassing both the superficial FAZ (sFAZ) and deep FAZ (dFAZ).
The evaluation of choriocapillary vascular density (CCVD) was conducted by defining the measurement setting of the slab, which was positioned between 3 µm above the Bruck's membrane and 30 µm below the Bruck's membrane.
Statistical analysis
Data analysis was conducted using SPSS 17.0 (IBM Corporation, Armonk, NY). The Kolmogorov–Smirnov one-sample test was employed to identify normal distributions. Descriptive analyses were performed, with normal quantitative variables presented as means ± SD, and skewed quantitative variables presented as median and interquartile range (IRQ; 25%–75%). Independent samples t test was utilized to compare variables conforming to a normal distribution between the two groups. Mann–Whitney U test was employed to compare non-normally distributed variables. Spearman’s rank correlation was employed to investigate associations. The Bonferroni correction method was employed to account for the issue of multiple testing. Receiver operating characteristic (ROC) curves, along with area under the curve (AUC) values, were utilized to assess the discriminatory ability of significant parameters in distinguishing between patients with and without SLE. An AUC value greater than 0.70 was deemed statistically significant. The threshold for statistical significance in the obtained results was set at p < .05.
Results
Characteristics of study participants
Twenty-nine patients with SLE (29 eyes) and 25 control subjects (25 eyes) were included. The average age of the control group and the SLE group was 48.72 ± 14.72 and 48.34 ± 9.87, respectively. The average BMI of the control group and the SLE group was (22.65 ± 2.79) and (23.21 ± 3.34) kg/m2. Male to female ratio was 11:14 in control group and 2:27 in the SLE group. There was no significant difference between the control and the SLE group in terms of age (t = 0.108, p = .914) and BMI (t = −0.667, p = .507). The gender ratio was significantly different between the groups (χ2 = 10.112, p = .001).
Comparison of retinal and choroidal thickness between control group and SLE group
Comparison of retinal and choroidal thickness between control group and SLE group.
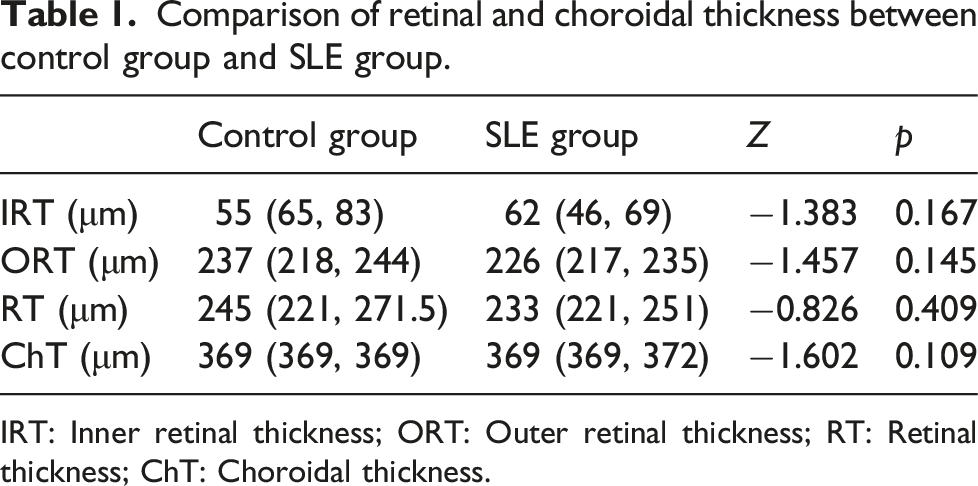
IRT: Inner retinal thickness; ORT: Outer retinal thickness; RT: Retinal thickness; ChT: Choroidal thickness.
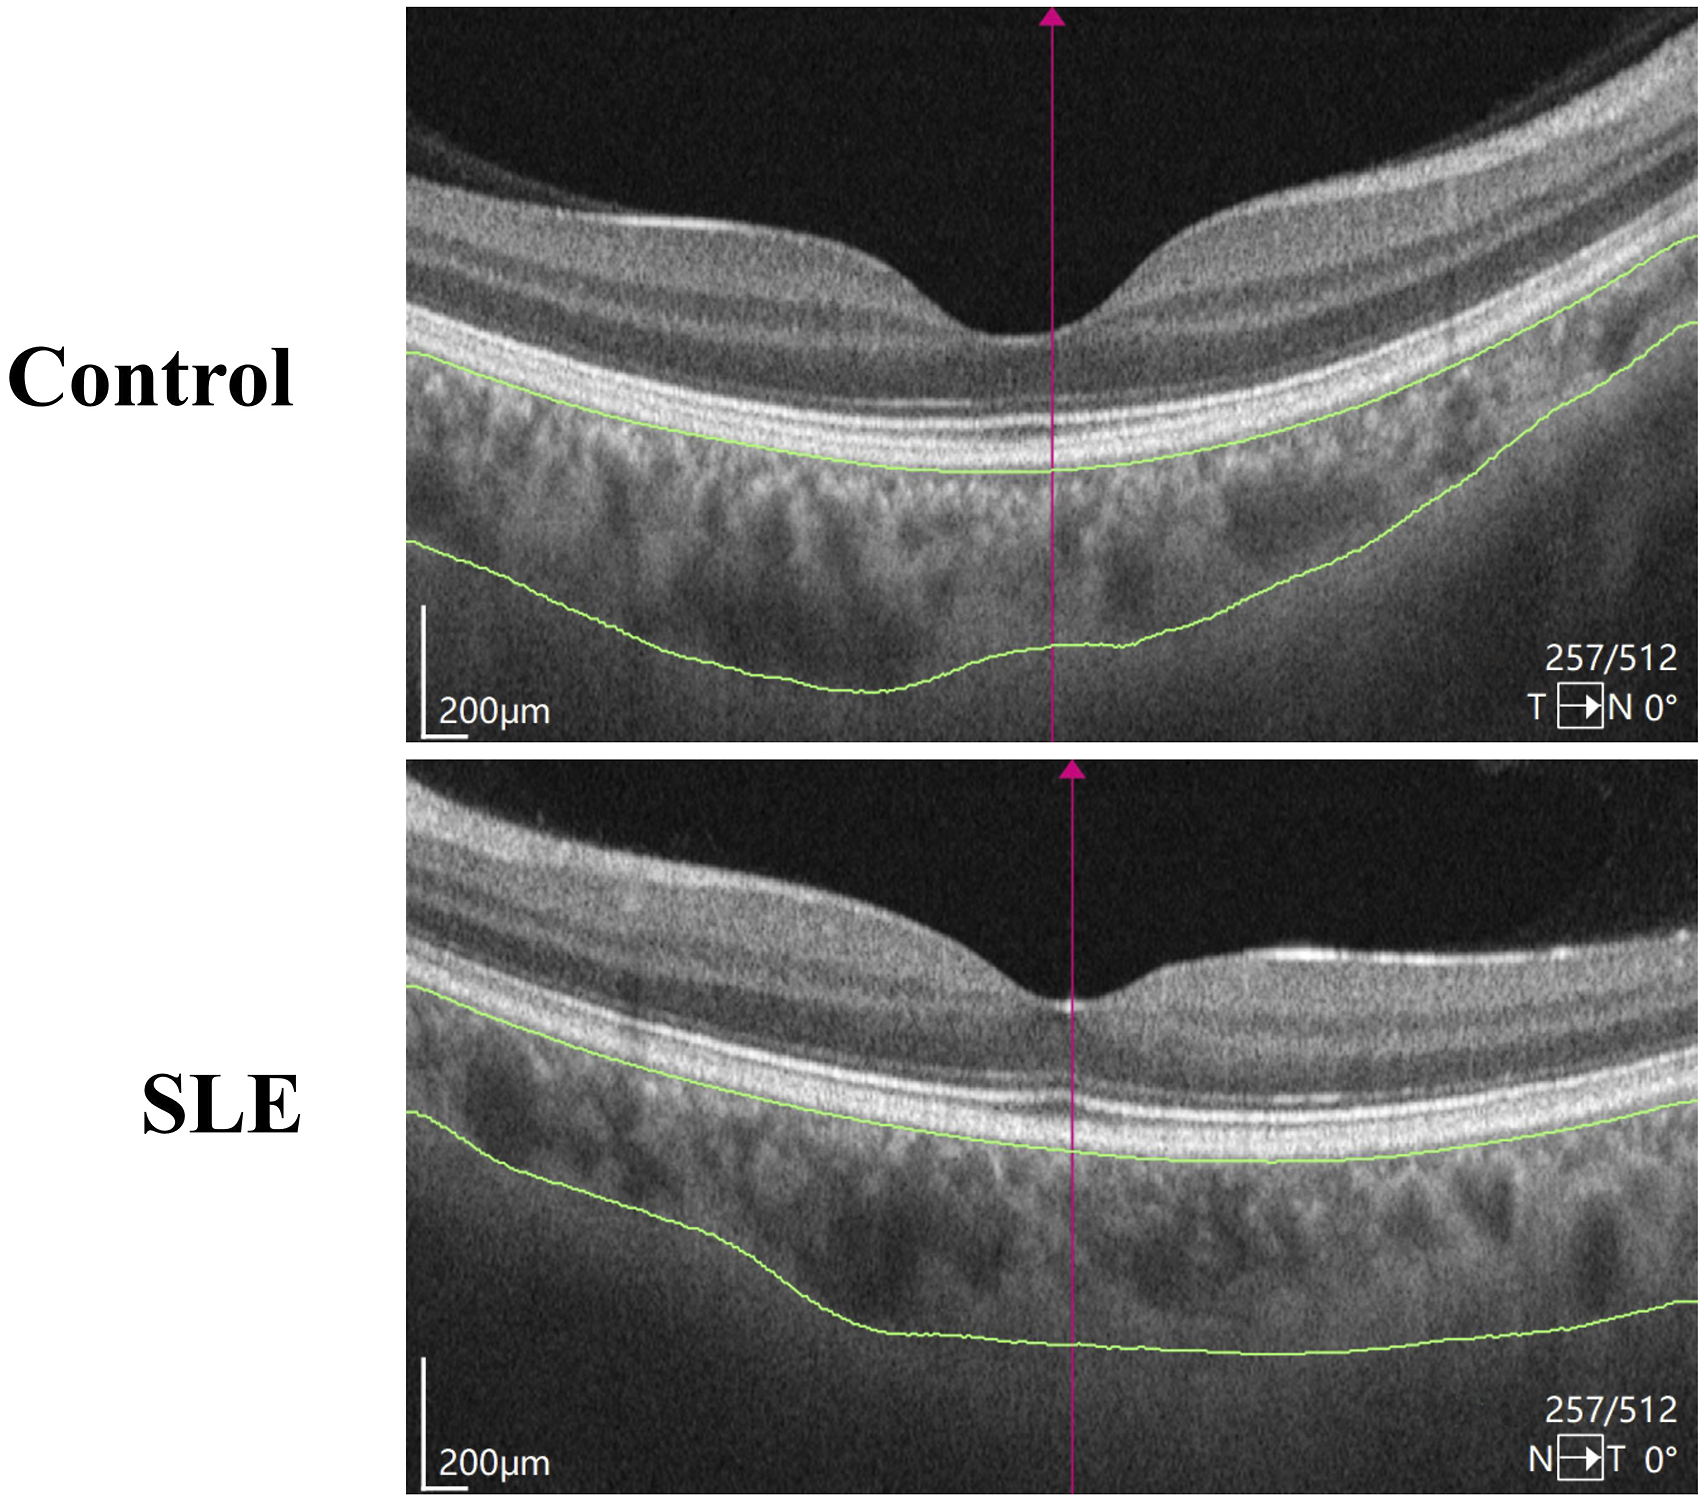
Representative diagram for comparing ChT between the control group and the SLE group.
Comparison of retinal and choroidal vascular density between control group and SLE group
Comparison of retinal and choroidal vascular density between control group and SLE group.
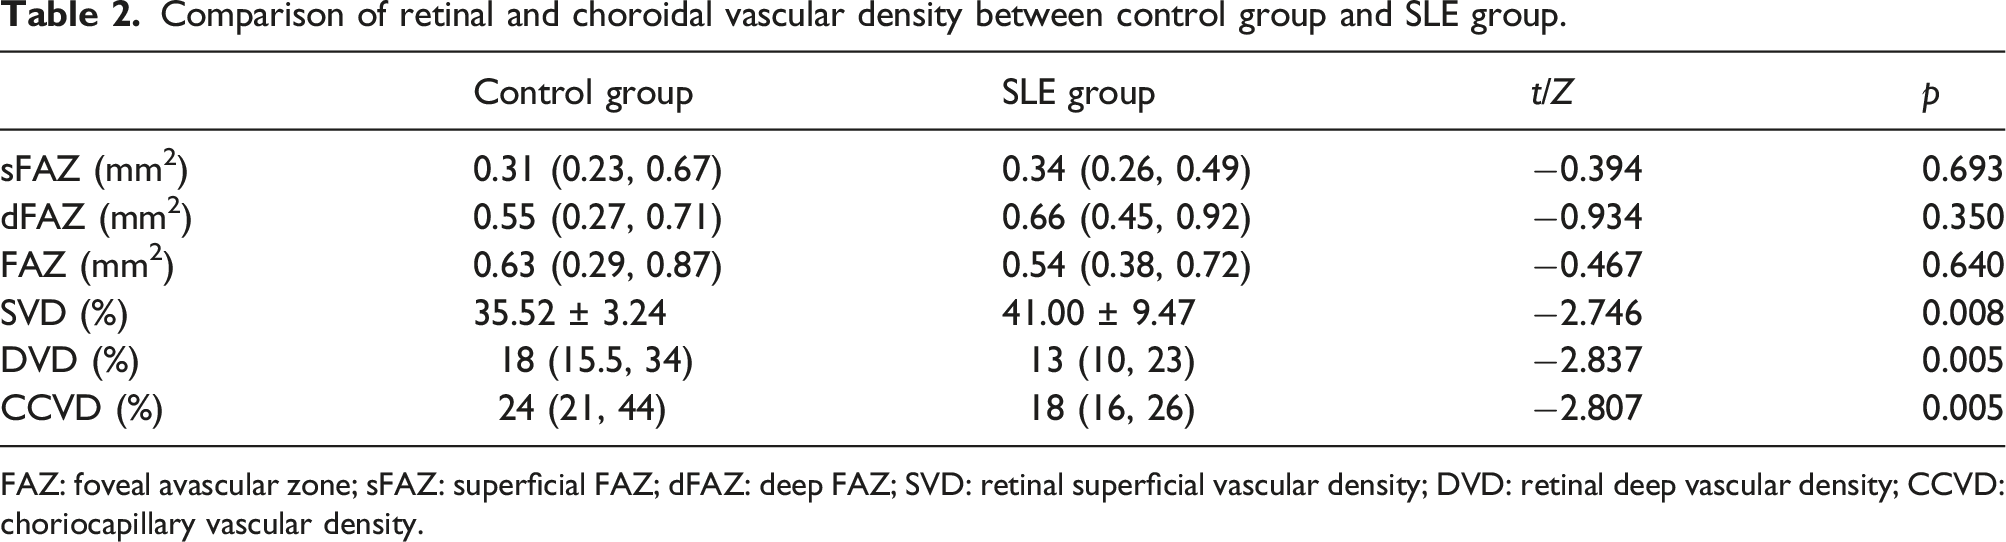
FAZ: foveal avascular zone; sFAZ: superficial FAZ; dFAZ: deep FAZ; SVD: retinal superficial vascular density; DVD: retinal deep vascular density; CCVD: choriocapillary vascular density.
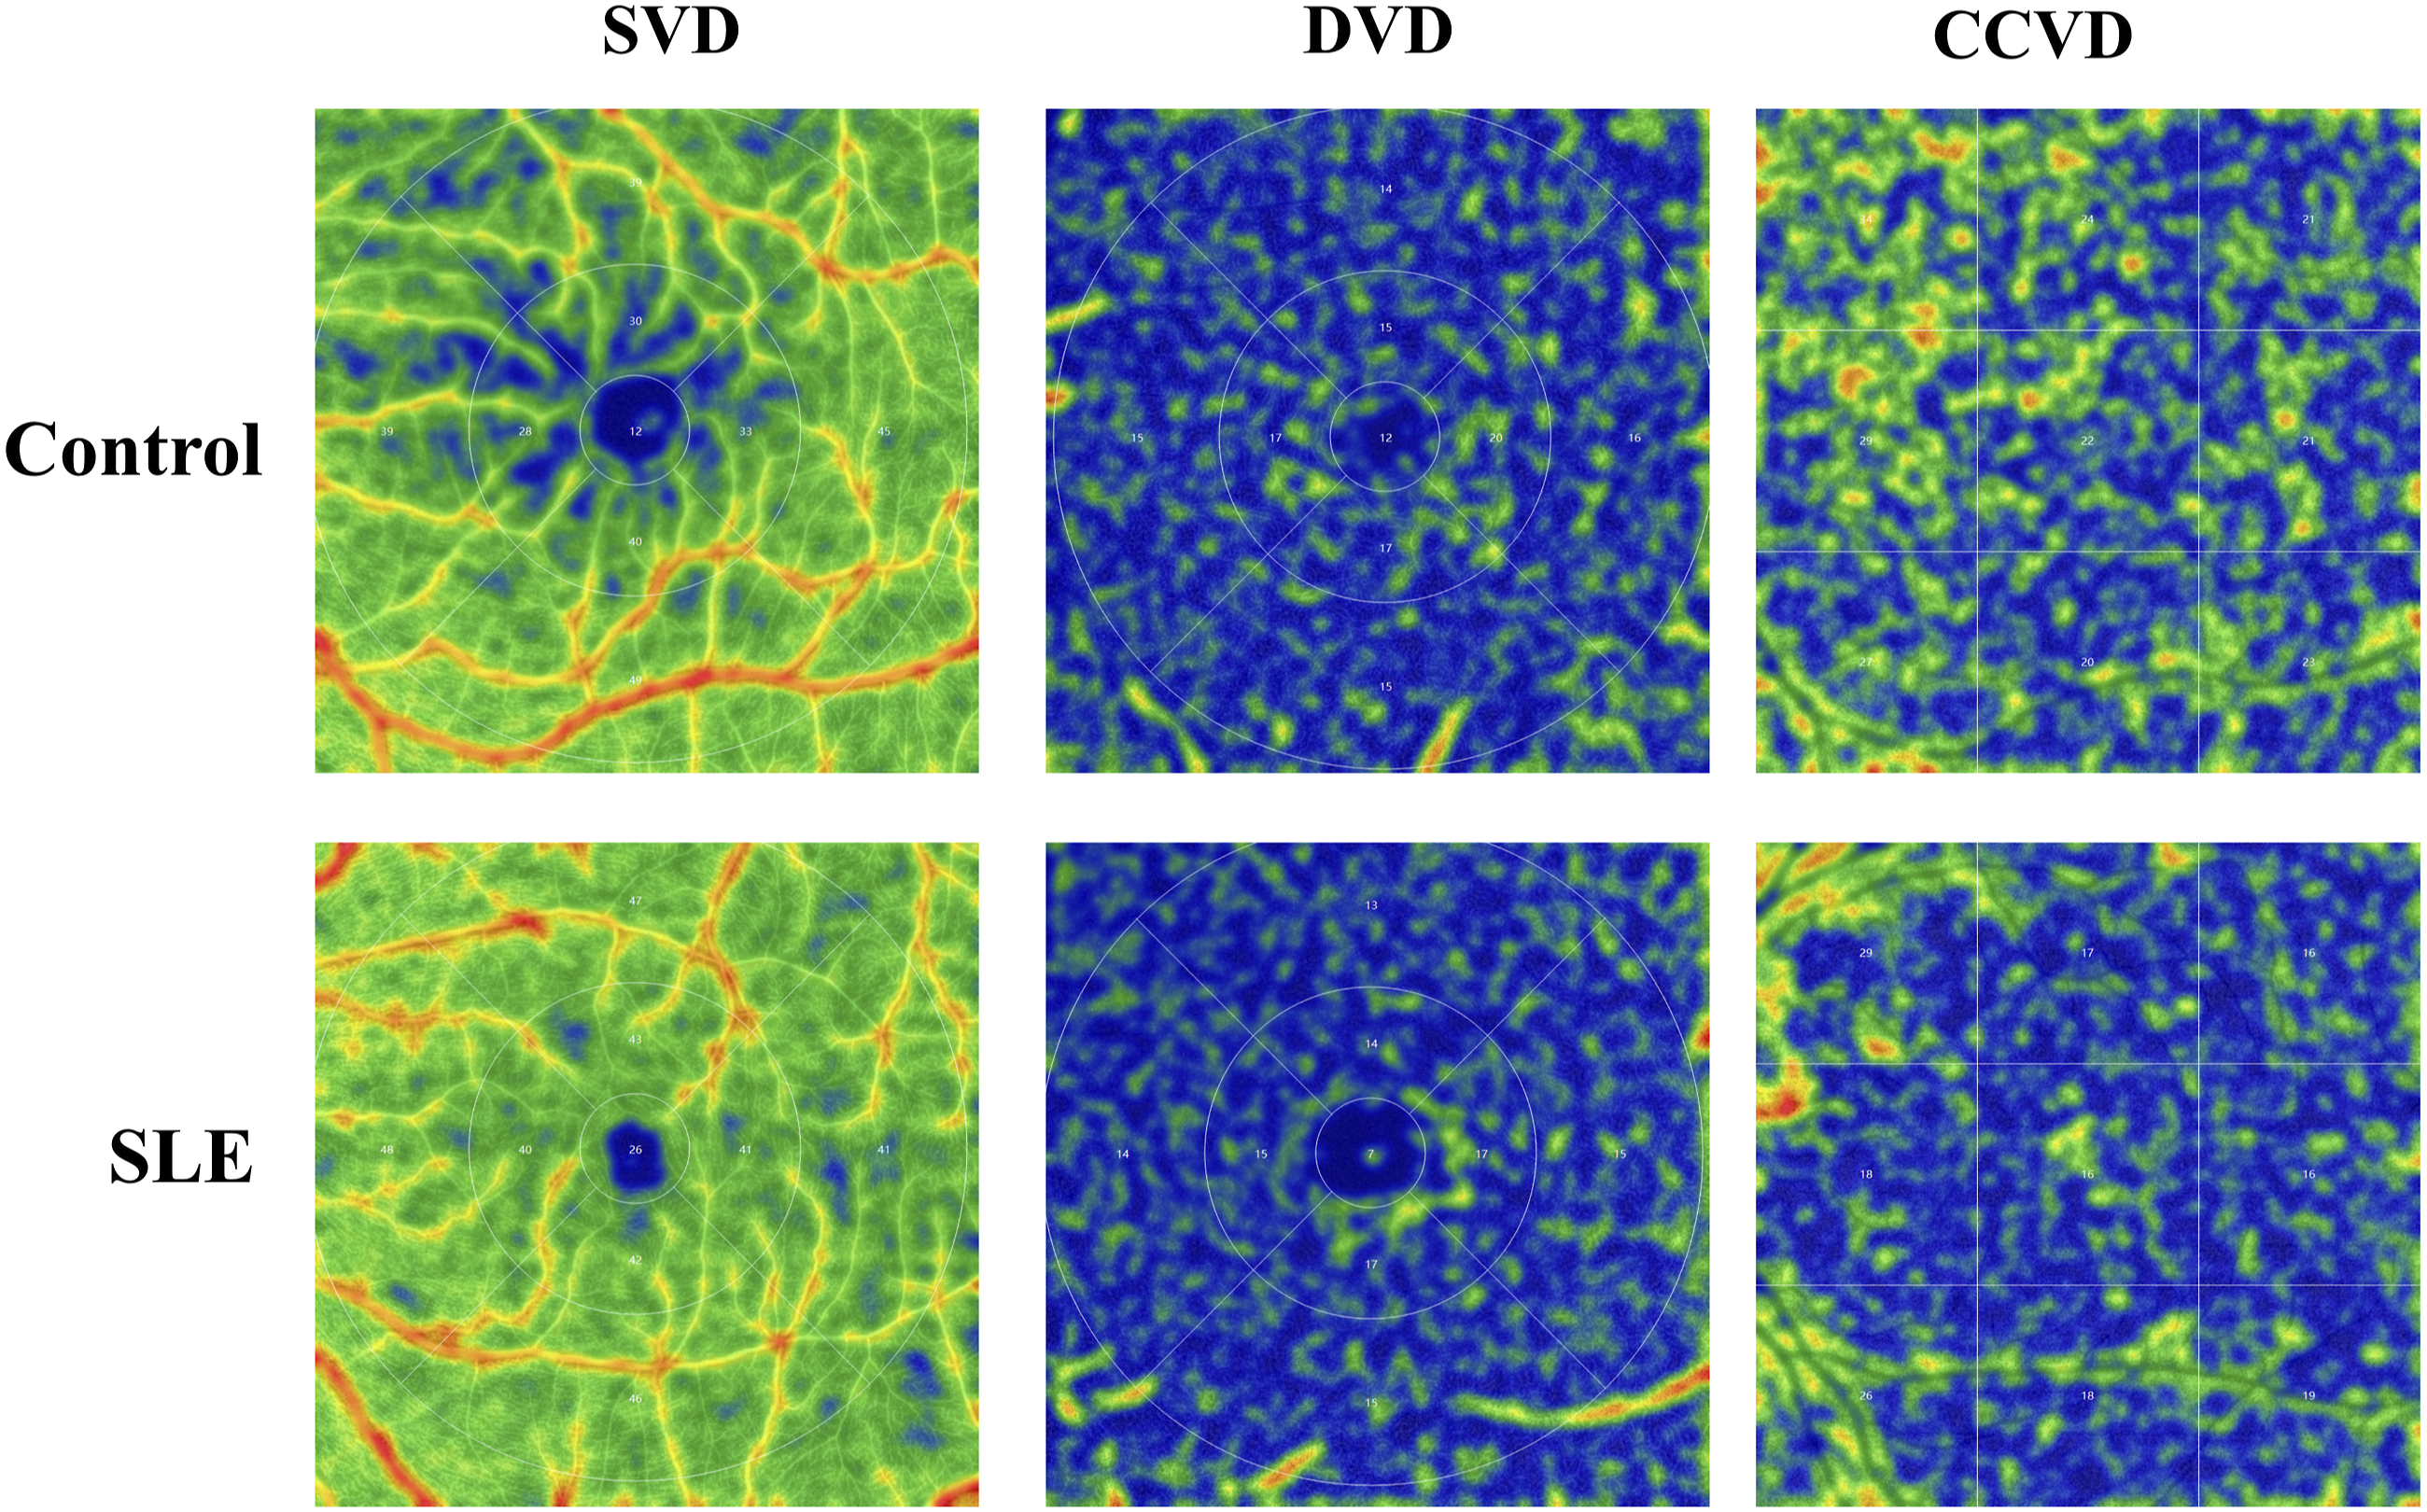
Representative diagram for comparing SVD, DVD, and CCVD between the control group and the SLE group.
Diagnostic values of SVD, DVD, and CCVD in discriminating patients with SLE from healthy controls
The diagnostic efficacy of SVD, DVD, and CCVD in distinguishing individuals with SLE from healthy volunteers was evaluated through the utilization of ROC curve analysis (Figure 3). An (AUC value exceeding 0.7 is generally deemed acceptable for clinical implementation. The results showed that the AUC values of SVD, DVD, and CCVD were 0.873, 0.729, and 0.727, signifying a notable precision in the discrimination of SLE patients from control subjects. ROC curves of SVD, DVD, and CCVD in discriminating patients with SLE from healthy controls. (a) ROC curve of SVD; (b) ROC curve of DVD; (c) ROC curve of CCVD.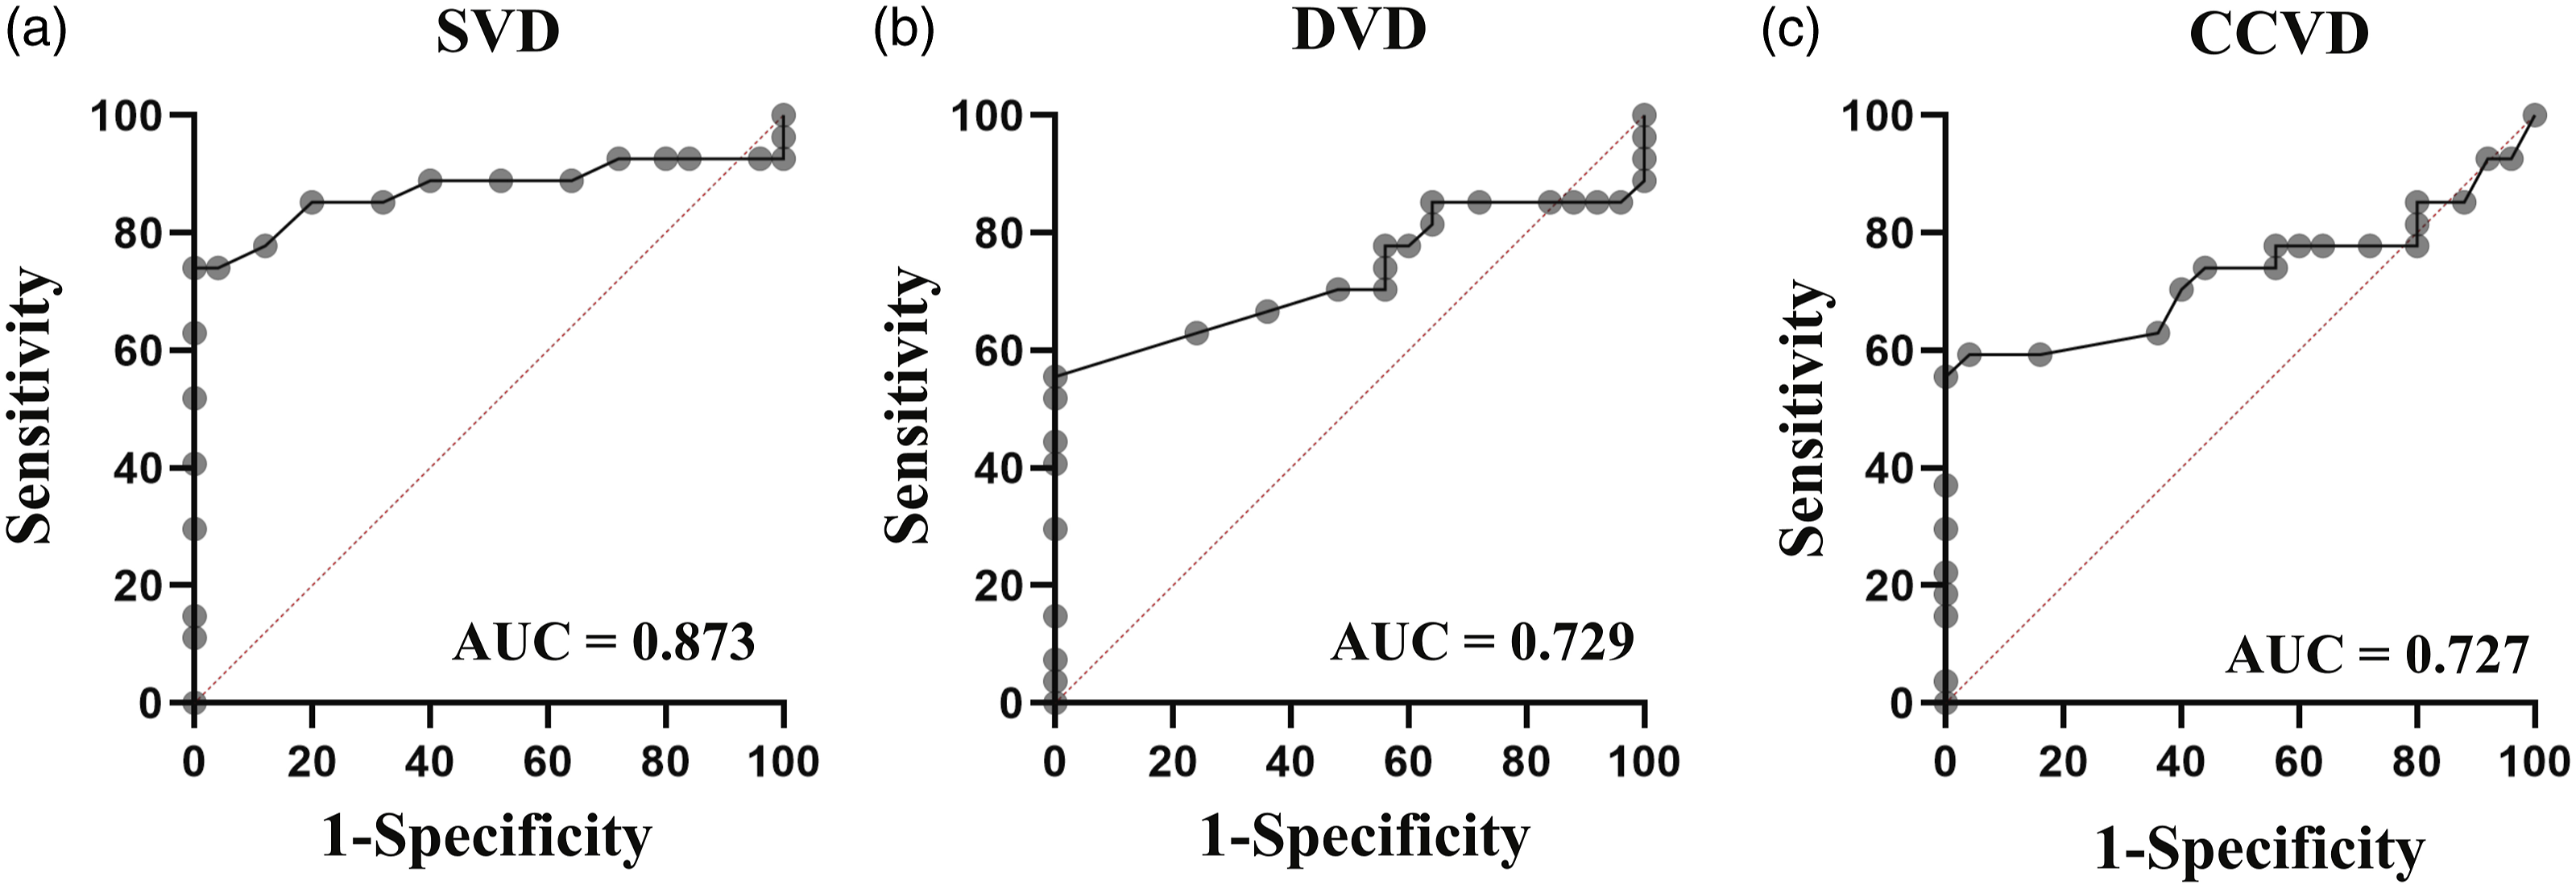
Relationship between retinal and choroidal thickness and vascular density, and disease activity in patients with SLE
The relationships between SLEDAI scores and the retinal and choroidal thickness and vascular density in SLE group were analyzed by Spearman’s rank correlation. As shown in Figure 4, the SLEDAI scores were positively correlated with dFAZ (r = 0.589, p = .001) and FAZ (r = 0.451, p = .018), and negatively correlated with DVD (r = −0.491, p = .009) and CCVD (r = −0.521, p = .005). Correlation between the SLEDAI scores and the retinal and choroidal thickness and vascular density in patients with SLE. (a) Correlation between the SLEDAI scores and DVD; (b) Correlation between the SLEDAI scores and CCVD; (c) Correlation between the SLEDAI scores and dFAZ; (d) Correlation between the SLEDAI scores and FAZ.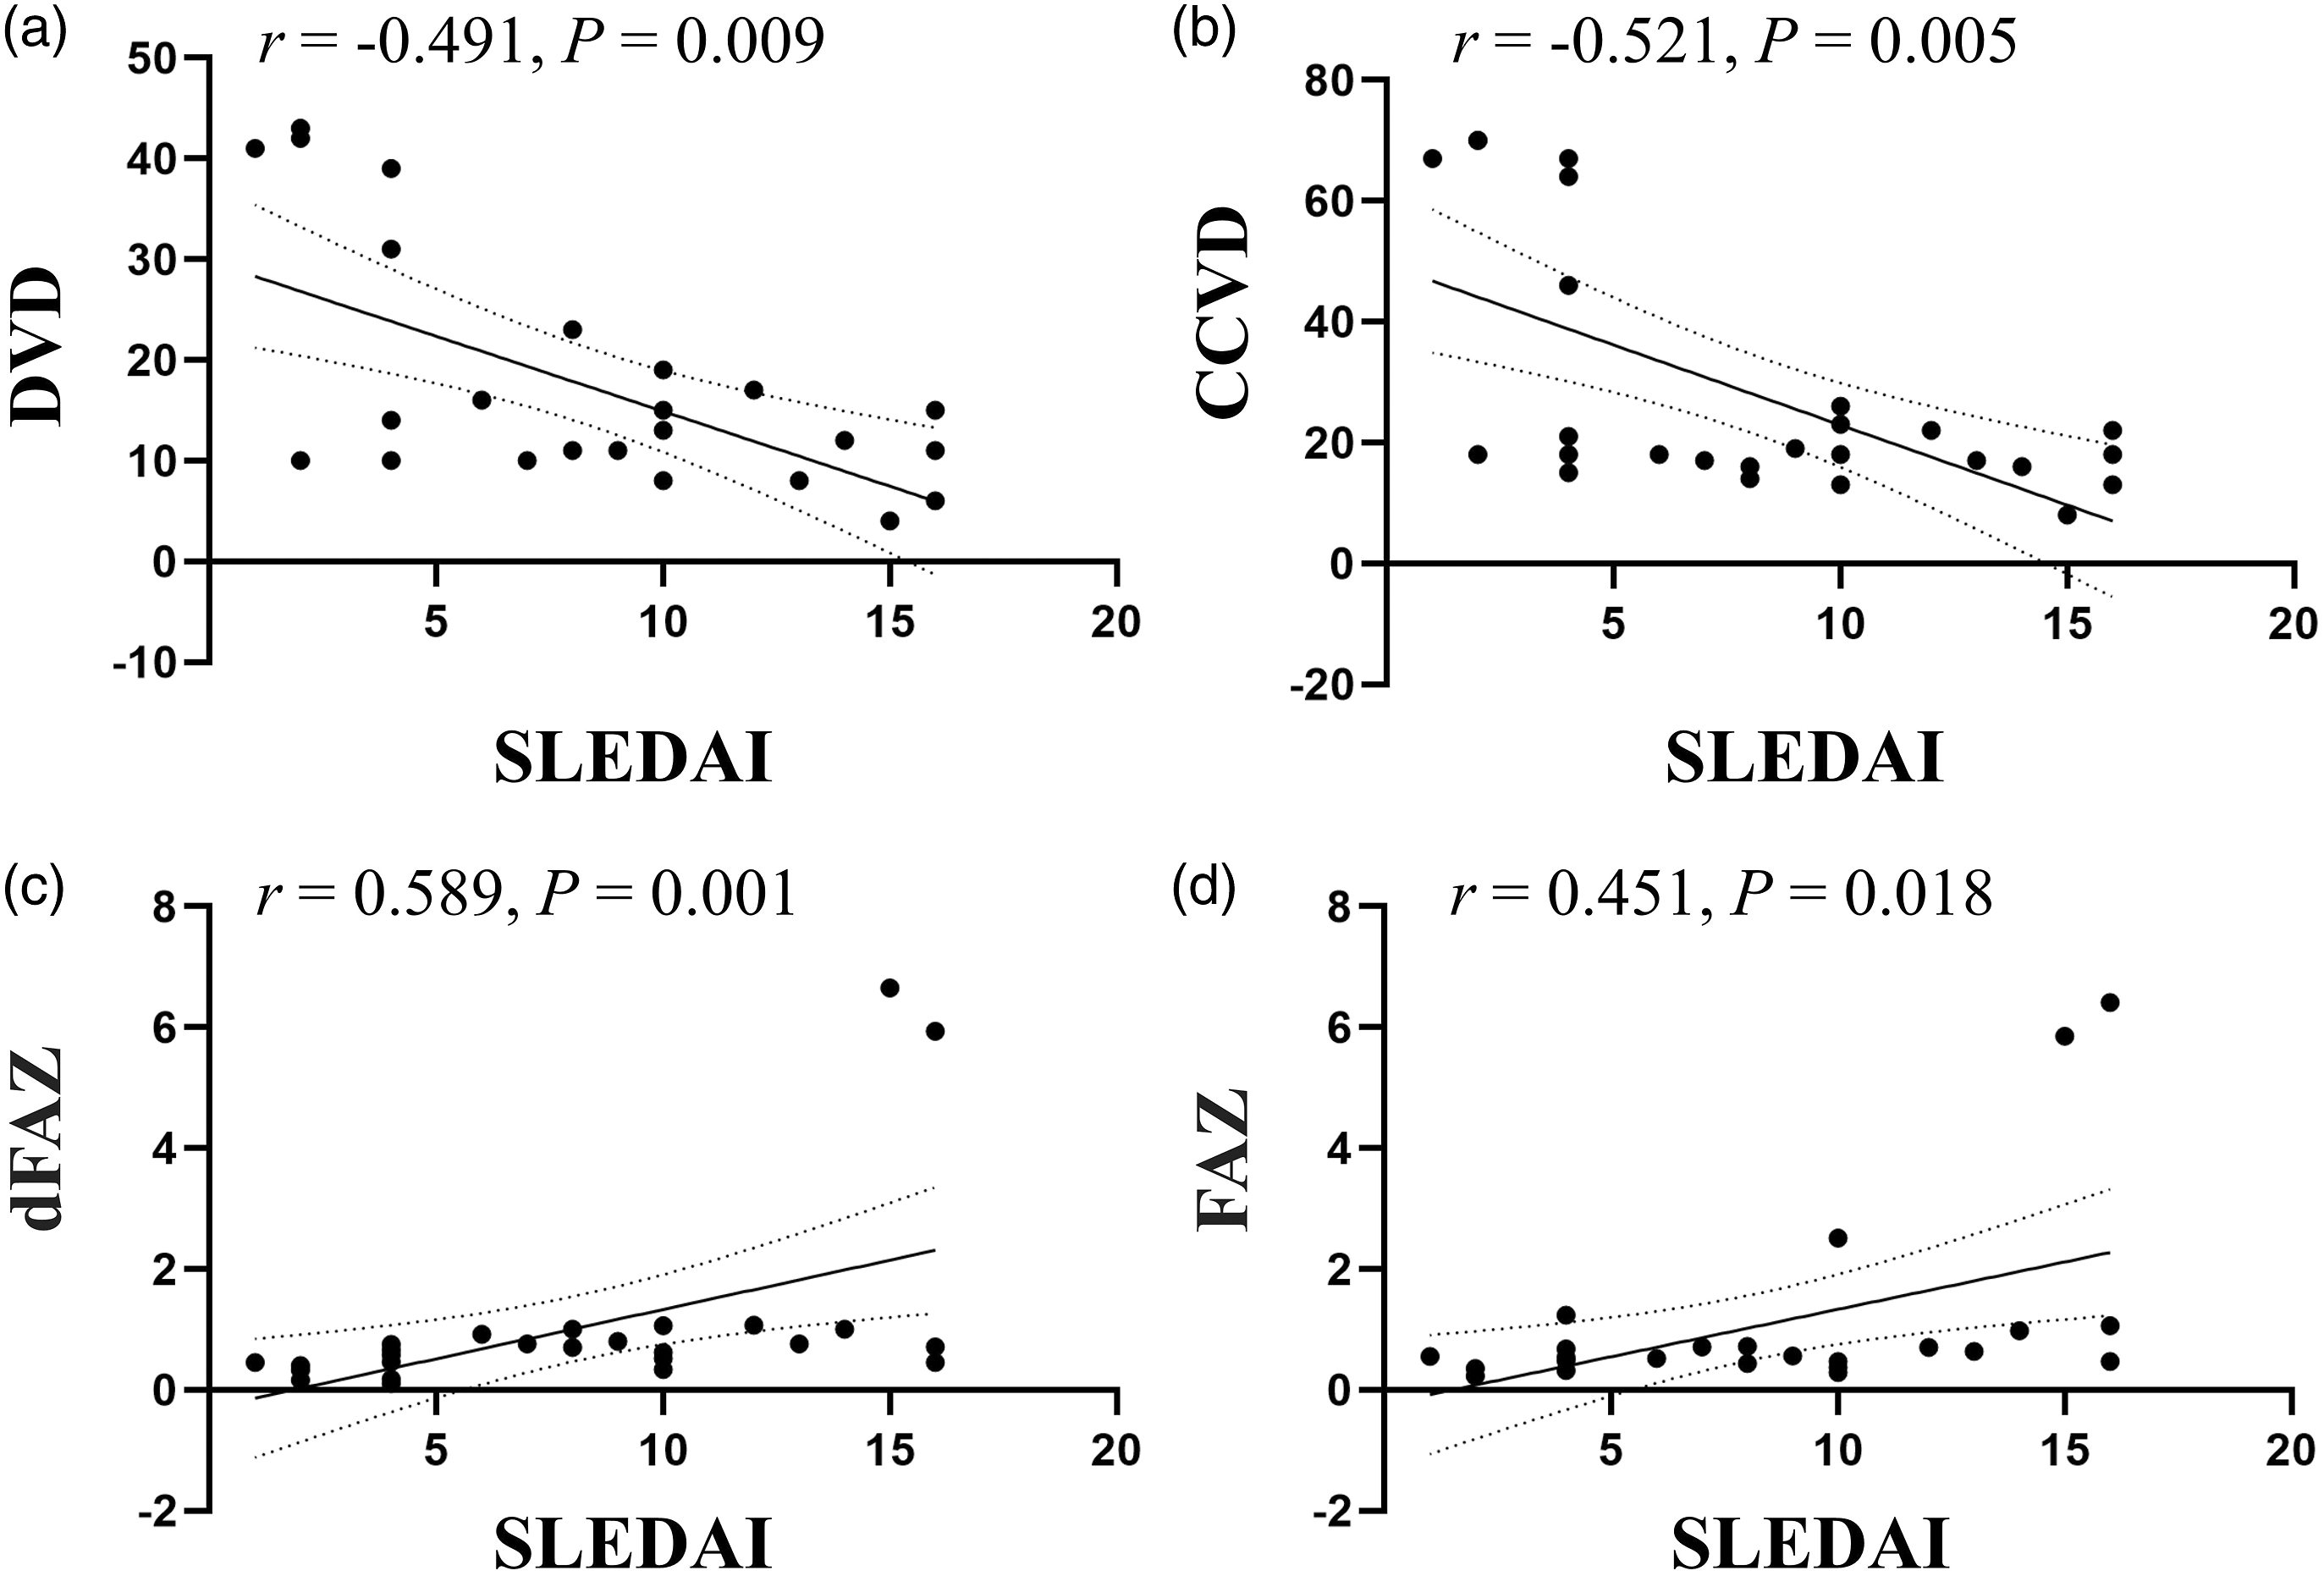
Discussion
The present study investigated the changes in retinal and choroidal thickness and vascular density in patients with SLE using OCTA, and analyzed the relationships between disease activity and the retinal and choroidal thickness and vascular density in patients with SLE. Three main findings emerged in the present study. Firstly, the SVD was significantly increased, while the DVD and CCVD were significantly decreased in patients with SLE. Secondly, ROC curve analysis showed that the AUC values of SVD, DVD, and CCVD were >0.7 in discriminating patients with SLE from healthy controls. Thirdly, SLE disease activity were positively correlated with FAZ, and negatively correlated with DVD and CCVD.
OCTA is utilized for the assessment of vascular structures in various ocular conditions such as age-related macular degeneration, diabetic retinopathy, uveitis, and glaucoma.15,16 By detecting compromised perfusion sites in both superficial and deep capillary plexi, OCTA also offers valuable depth information regarding the severity of impaired perfusion. 17 Consequently, OCTA has gained widespread usage in the diagnosis of several diseases, including optic neuritis, 18 Alzheimer’s disease, 19 diabetic retinopathy, 20 thyroidrelated ophthalmopathy, 21 and Parkinson’s disease. 22 In light of its noninvasive nature and clinical viability, OCTA was chosen as the preferred retinal imaging technique over FFA to examine alterations in retinal and choroidal thickness as well as vascular density among SLE patients in the present study.
The fundamental pathology of SLE encompasses vasculitis, with its distinctive histological alteration being the accumulation of immune complexes, primarily impacting small arteries and capillaries. 23 Although ocular symptoms are not included in the diagnostic criteria for SLE, ocular manifestations serve as significant indicators of disease activity due to their ability to directly visualize vascular alterations. 24 Previous animal experiments have indicated that retinopathy in SLE patients primarily arises from aberrant retinal microvasculature supplying the nerve fiber layer. 25 Inflammatory cells, immunoglobulins, and complement deposits within retinal blood vessels have been associated with retinal vascular hypoperfusion. 26 It was observed that early retinal vasculopathy may manifest with mucinous edema. As the disease advances, there is a progression towards fibrin-like degeneration, necrosis, and thrombosis of small and medium-sized vascular connective tissue. This ultimately leads to hemorrhage, as well as local ischemia and hypoxia. 26 In the present study, the retina SVD was significantly increased, and the retina DVD were significantly decreased in the SLE group. Previous studies have consistently reported that the deep retina layer is more susceptible to progressive obstruction compared to the superficial retina layer. This susceptibility is believed to be caused by hemodynamic dysfunction or impaired interactions among neurons, glial cells, and vascular cells. 27 Additionally, a positive correlation was observed between SLEDAI scores and DVD in individuals with SLE in the present study. Given that SLEDAI score reflects the disease activity in SLE patients, the assessment of changes in DVD using OCTA may serve as a means to evaluate the disease activity in SLE.
The choroid is organized in a manner that facilitates the presence of a highly intricate network of diminutive blood vessels, possessing a substantial surface area, ostensibly intended for the purpose of facilitating the exchange of oxygen and other essential nutrients. This network is situated in close proximity to the outer retinal layers. The proper structure and function of the choroidal vasculature are imperative for the optimal functioning of the retina. 28 SLE is a chronic immune disorder that affects multiple systems within the body and has the potential to impact both the retinal vasculature and the choroid. 6
Histopathological investigations of the ocular tissue in SLE have revealed the presence of inflammatory cell infiltrates within the choroid. Additionally, immunoglobulin and complement deposition in the choroidal vasculature, as well as damage to the retinal pigment epithelium, have been observed. 29 These choroidal lesions have been identified as potential indicators of SLE onset, preceding clinical symptoms by several months. Furthermore, they serve as markers for subclinical reversible kidney disease and neuropathy. 30 A recent study has further demonstrated that patients with SLE exhibit statistically significant lower mean ChT values compared to healthy individuals. 27 On the contrary, another study has reported that the ChT was thicker in children with SLE than in the control group. 31 However, in the present study, no significant differences were observed in ChT between the two groups. The differences between our findings and the previous study may be related in part to the racial difference. To the best of our knowledge, this study is the first cross-sectional clinical study evaluating the CCVD in patients with SLE. The results showed that CCVD were significantly decreased in patients with SLE compared to controls. Moreover, a negative relationship was found the SLEDAI scores and CCVD. Due to the cross-sectional study design, it is not possible to infer causality relationships between the SLEDAI scores and CCVD.
FAZ, which is a capillary ring surrounding an avascular area in the center of the fovea, plays a critical role in central visual function. When the FAZ is affected, it can lead to different levels of visual impairment. 32 It has been demonstrated that a larger FAZ area is linked to more severe capillary occlusion and nonperfusion in the macular region of the retina. 33 A recent study has indicated that in cases of diabetic retinopathy, the enlargement of the FAZ is among the earliest signs that significantly correlate with visual acuity and the severity of the disease. 34 In the present study, no significant difference in sFAZ, dFAZ, or FAZ between the two groups were found. However, FAZ, especially dFAZ, was positively correlated with the SLEDAI scores, suggesting that detecting FAZ, especially sFAZ, through OCTA may indirectly reflect the degree of disease activity in SLE.
This study had some limitations. Firstly, it is important to note that this study was conducted solely at a single center, utilizing data exclusively from one hospital. Consequently, the potential for selection bias cannot be disregarded. Secondly, the sample size employed in this study is relatively modest. Consequently, it is advisable to conduct larger-scale, multi-center studies with more substantial sample sizes in order to validate and reinforce these findings. Lastly, it is worth mentioning that a gender disparity was observed between the groups, which may serve as an additional limitation in the context of this particular study.
In summary, OCTA offers a noninvasive means of assessing alterations in retinal and choroidal thickness and vascular density among individuals diagnosed with SLE. Moreover, SVD, DVD, and CCVD exhibit potential in identifying biomarkers for the diagnosis of SLE. Furthermore, FAZ, DVD, and CCVD may serve as indicators of the extent of disease activity in SLE. To establish the viability of retinal and choroidal thickness and vascular density as innovative biomarkers for SLE, it is imperative to conduct multicentric studies for validation purposes. Additionally, longitudinal studies investigating the causal relationship between changes in retinal and choroidal thickness and vascular density and disease activity are warranted.
Footnotes
Declaration of conflicting interests
The author(s) declared no potential conflicts of interest with respect to the research, authorship, and/or publication of this article.
Funding
The author(s) disclosed receipt of the following financial support for the research, authorship, and/or publication of this article: This work was supported by the Research Fund Project of Anhui Medical University (2021xkj071).