
Abstract
The rise in online shopping can be largely attributed to its unmatched convenience, offering consumers the flexibility to shop from any location, at any time. It is widely assumed that online shopping saves time by eliminating the need to physically search for products, queue at checkout counters, and deal with crowds in physical stores. However, the evolving time efficiency of online shopping compared to traditional in-store shopping has not yet been empirically analyzed, leaving a gap in understanding time efficiency and how it has changed. This study aims to bridge that gap by analyzing time spent shopping both in-store and online from 2003 to 2023, utilizing data from the American Time Use Survey. The findings reveal that, in 2003, consumers were able to complete the equivalent of 1 h of in-store shopping in just 35 min online, falling to 15 min in 2023. Over the past decade (2013–2023), the average American has saved a total of 25 h per year due to the time efficiency of online shopping. An experience curve model was applied to characterize past trends and project the future. The resulting learning rate is between 12% and 19%. Using this in a projection suggests that 9.2–11.2 min of online shopping will be needed to replace 1 h of in-store shopping in 2030. Changes in time and money spent online versus in-store have implications for consumer activity patterns, time allocation, purchases, and building use. Increasing efficiency reflects a growing orientation toward speed and immediacy, reshaping shopping as a more instrumental practice, distancing consumers from the social and leisure aspects of shopping, and contributing to ongoing processes of temporal acceleration in everyday life.
Introduction
In recent years, online shopping has substantially changed the retail landscape, providing both convenience and time-saving benefits. Online shopping allows consumers to browse, select, and purchase products from anywhere at any time, effectively eliminating the need for physical store visits and reducing time spent on travel, in-store navigation, and checkout lines (Pantano and Priporas, 2016; Huang and Benyoucef, 2013). The ability to instantly compare prices and read product reviews can enhance decision-making efficiency, potentially offering time savings compared to traditional in-store shopping (Aldhmour and Sarayrah, 2016; Park and Lee, 2012). But it is important to acknowledge that not all consumers perceive online shopping as more convenient. For example, some types of shopping—in contexts such as grocery or daily-need shopping—may be more suitable for in-store shopping, which is more immediate. Moreover, perceptions of time efficiency are not always consistent with objectively measured shopping time durations. While online shopping often reduces the actual time required for browsing and purchasing, individual experiences of convenience and satisfaction may vary depending on factors such as decision effort, digital familiarity, and the social or experiential aspects of in-store shopping (Hagtvedt and Chandukala, 2023; Kohli et al. 2004).
Time efficiency reflects not only changes in shopping behavior but also carries broader social significance. Greater efficiency may free up time for other activities, yet it can also reshape the experience of shopping and our relationship to time itself—raising questions about whether such efficiency translates into greater freedom and leisure or instead intensifies the perception of time scarcity in everyday life. As Cornwell et al. (2019) note, changes in how individuals allocate and experience time are central to understanding contemporary social rhythms and the reorganization of daily life. By situating online shopping within this broader temporal framework, the present study provides a more robust understanding of relative efficiency dynamics within the evolving landscape of e-commerce, which has significant implications for consumer expenditure patterns, macro-economic structure, and sustainability.
In this context, time efficiency also functions as a central driver of online shopping adoption (Frick and Matthies, 2020). Studies have shown that consumers prioritize ease of navigation, fast checkout processes, and efficient delivery systems when using e-commerce platforms (Kang and Johnson, 2015). Innovations such as one-click purchasing and mobile apps have further accelerated transaction times, enabling customers to complete purchases in minutes or sometimes seconds, even while on the go (Pantano et al., 2017). Moreover, logistical advancements like same-day or next-day delivery options significantly shorten the time between order placement and product receipt, enhancing the overall online shopping experience (Fosso Wamba et al., 2018). With continued advancements in artificial intelligence and user interface design, e-commerce platforms are expected to further optimize the time efficiency of online shopping (Lari et al., 2022). As consumers increasingly seek faster, more convenient shopping experiences, online retail is becoming increasingly time-efficient, solidifying its advantage over traditional shopping methods (Huang and Benyoucef, 2013; Kang and Johnson, 2015).
Prior research on online shopping highlights both its convenience and its evolving impact on consumer behavior. Mittal (2013) emphasizes that online shopping offers significant time-saving advantages compared to traditional shopping methods. Cai and Cude (2016) expand on these findings by discussing the broadening reach of e-commerce, noting that as more consumers gain internet access, the time-saving potential of online shopping grows. They explain that online consumers benefit from streamlined search processes and personalized shopping experiences, which contribute to faster decision-making and greater efficiency compared to physical shopping. Kohli et al. (2004) explored the determinants of online consumer satisfaction, such as time saving, but with a limited discussion on time efficiency. While their survey recorded the time costs of purchases both online and in-store shopping, they only considered certain product types (such as books and apparel), had a relatively small survey sample (around 140), and they did not further study the time efficiency of online shopping compared with traditional in-store shopping.
There is no empirical research about the time efficiency of online shopping compared with in-store shopping, which is the focus of our work. This paper leverages macro time-use data from a nationwide annual survey in the U.S. to examine the time efficiency of online shopping compared to traditional in-store shopping. In general, “shopping time efficiency” could refer to the extent to which consumers can quickly, easily, and conveniently locate and purchase desired products. However, in this work, we define “online shopping time efficiency” as the ratio of the average time spent shopping in-store to the average time spent shopping online for equivalent purchasing activities (e.g., if a consumer spends 1 h in a physical store to buy a book but only 0.25 h purchasing the same item online, the resulting online shopping time efficiency would be 4), with a higher ratio indicating greater relative efficiency of online shopping.
This study uses data available in the American Time Use Survey (ATUS) (Bureau of Labor Statistics, 2025b) about the shopping time of U.S. consumers. In common parlance, shopping refers to many activities: searching for, selecting, and evaluating goods or services, and often involves browsing, comparing, and making decisions about what to buy. In this study, following the definition used in ATUS, shopping is defined to encompass the entire process of consumer activities relating to purchases, including pre-purchasing behaviors (such as information search and product comparison), the act of purchasing, and post-purchasing activities (such as returns and exchanges). As shopping activities in the ATUS survey recorded all the activities related to shopping, shopping time represents a multifaceted category of time use. On the one hand, it functions as work-like time—a necessary task related to household provisioning and maintenance, often aligned with errand running or routine consumption. On the other hand, shopping can also take on leisure-like qualities, offering pleasure, exploration, or social engagement, particularly in discretionary or recreational contexts.
The time efficiency associated with shopping is not fixed but may vary across historical periods and geographic contexts. Differences in retail infrastructure, transportation systems, digital access, and the diffusion of e-commerce technologies can shape how consumers allocate time to shopping activities. In the U.S., the rapid expansion of online retail platforms and logistics networks in recent decades provides a particularly relevant context for examining how technological and market developments shape the relative time efficiency of online shopping.
To estimate the evolution of online shopping efficiency, this study applies an experience curve model, an analytical tool first introduced by Wright (1936) but broadly applied to many activities that improve over time (Argote and Epple, 1990; Nagy et al., 2013). The experience curve model is suitable for this study given the observed continuous improvement in e-commerce efficiency as online sales grow and businesses improve their platforms. The experience curve uses historical data to enable the projection of future time efficiency trends, based on the relationship between accumulated sales and the rate of efficiency improvement, providing insights into how consumers’ shopping behavior may evolve as the e-commerce sector matures.
As shown in Figure 1, the average shopping time was historically stable, essentially constant until around 2005, after which there is a general downward trend. At the same time, with the exception of the 2008 recession, there was a steady growth in inflation-adjusted shopping expenditures, and the share of e-commerce sales in total retail sales was increasing exponentially from 0.9% in 2000 to 15.3% in 2023. In short, since around 2005, consumer retail spending is increasing but shopping time is decreasing. We attribute this decrease in shopping time to the rise in e-commerce: By increasingly shifting purchases to online modes, Americans are reducing their total shopping time while purchasing the same (or more) goods.
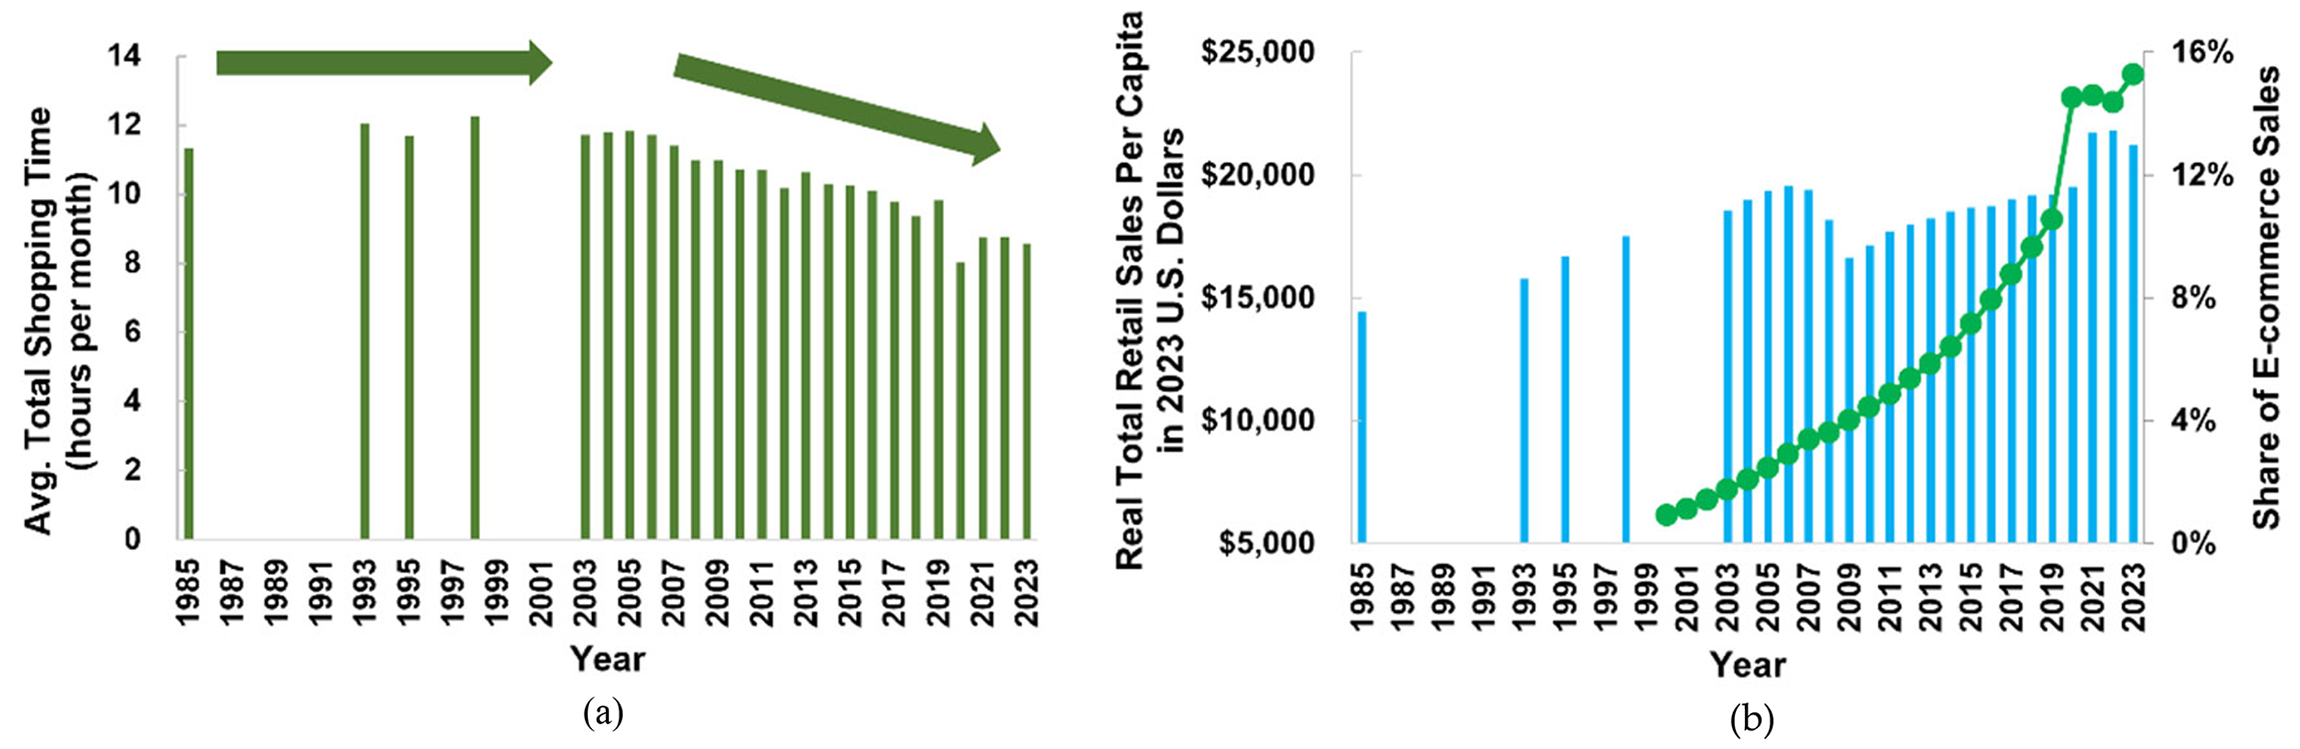
(a) Historical average total shopping time per capita (h per month) based on data from American Heritage Time Use Study (AHTUS) (Fisher et al., 2018) and American Time Use Survey (ATUS) (U.S. Bureau of Labor Statistics, 2025b), where total refers to online plus in-person. From 1985 to around 2005, the average total shopping time was stable, and there was in general a gradual positive growth in shopping expenditures. However, following the rise of online shopping, the total shopping time began to decline, despite continuing increases in real per capita retail expenditures. (b) Historical real total retail sales per capita (2023 U.S. Dollars, denoted as blue bars) in the U.S. from 1985 to 2023 based on the monthly retail trade reports from the U.S. Census Bureau (2024a) and the share of e-commerce sales from 2000 to 2023 (denoted as green markers) based on the U.S. quarterly retail e-commerce sales report (U.S. Census Bureau, 2024b). There was a steady increase in shopping expenditure except for the 2008 recession and an exponential increase in the share of e-commerce sales. We attribute the decrease in shopping time despite increases in expenditure due to e-commerce: One can complete the same shopping in less time using online platforms.
This correlation between increased online shopping and decreased total shopping time leads to the research question of this paper: What are the present and future trends of in-store and online shopping time and time efficiency? This question will be addressed by analyzing macro-level changes in in-store and online shopping time use from 2003 to 2023 in the U.S. annually, utilizing data from ATUS. We introduce the idea of “online shopping efficiency” to explain the downward trend in total shopping time: e-commerce consumers can achieve the same shopping outcome using less time. The continuing decline in total shopping time is explained as arising from ongoing technological progress in online shopping platforms. We use the experience curve model to quantify historical technological progress in the time efficiency of e-commerce. This work is the first macro-trend analysis of online versus in-store shopping, offering a quantification of trends in terms of an experience curve for technological progress in e-commerce.
Methods
Overview: We use time-use surveys from the U.S. to develop time series data on time spent shopping from 1985 to 2023. The surveys record the location of shopping activity, but not whether it is done online. Thus we develop a protocol to use location and behavioral trends to distinguish between in-store shopping, online shopping, and “other” shopping (e.g., catalogs and garage sales). We note that before the advent of e-commerce, total shopping time was roughly constant over time. Assuming a constant time budget for total shopping time, we explain the post e-commerce decline in total shopping time as due to time savings, using the concept of an “equivalent time” of online shopping that replaces 1 h of in-store shopping. The equivalent time of e-commerce declines over time, attributed to technological progress in online platforms due to factors such as improved search, one-click ordering, and smoother payment systems. We use an experience curve to model how equivalent time for online shopping decreases as a function of increased e-commerce sales.
Historical in-store shopping time and online shopping time
The American Time Use Survey (ATUS), conducted annually since 2003 by the U.S. Bureau of Labor Statistics, tracks participants’ daily activities. It provides comprehensive data on over 400 activities, alongside key demographic variables and respondent weights to correct for representational biases. Note that although ATUS provides a clear definition of shopping activities, the respondents interpret these definitions and report their own time use. Thus, there may be differences between the survey's definitions and how participants perceive or describe their own activities. Time use is complex, but ATUS simplifies it by estimating the number of minutes spent on each activity. In addition, people often engage in multiple activities at once—for example, watching television while ordering clothes online. ATUS records both primary and secondary activities, but the secondary activities are limited to watching children. Data about other types of secondary activities are not collected. This study thus focuses only on shopping as a primary activity. The American Heritage Time Use Study (AHTUS) (Fisher et al., 2018) archives time diaries prior to 2003, but it was not conducted annually. AHTUS provides data on shopping for the years 1985, 1993, 1995, and 1998. Both surveys document detailed information on respondents’ shopping activities, including duration and location, facilitating the calculation of average shopping time spent in stores and online. Time-use diaries such as those employed in ATUS and AHTUS are widely considered the gold standard for behavioral time measurement (Doucet, 2023), including the assessment of shopping time.
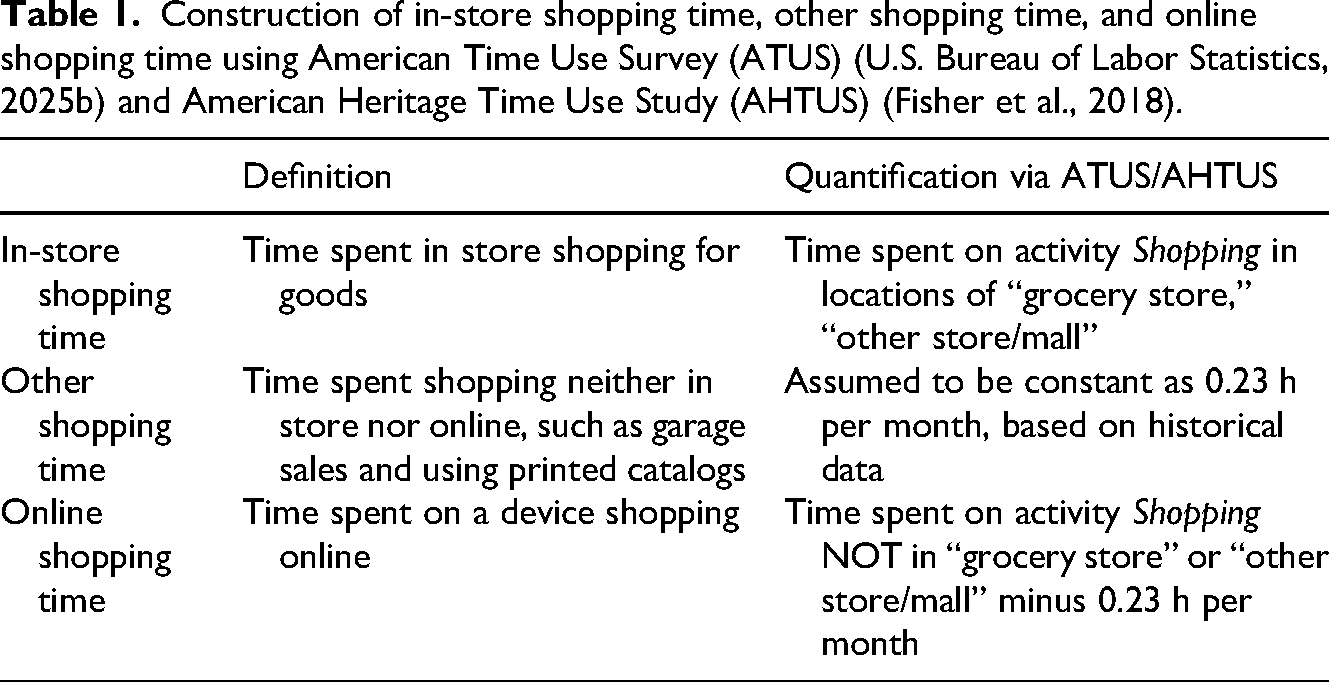
The next goal is to develop a time series dataset of shopping time spent in-store and online from ATUS responses. Notably, ATUS does not query respondents whether a shopping activity is done online. Thus we need to differentiate in-store and online shopping activities using shopping locations and detailed activity classifications in ATUS. Locations defined in ATUS include grocery stores, other stores, malls, home, workplace, restaurant, bank, and other relevant settings. To make clear which activities are empirically included in our analysis, we provide the main ATUS shopping-related categories below. Shopping categories in ATUS include grocery shopping, purchasing gas, purchasing food (such as take-out or fast food, but not groceries), comparison shopping, and researching products for purchase. The inclusion of “purchasing gas” and similar activities does not imply that all have online counterparts but reflects the broader category set of shopping-related activities as coded by ATUS. We define shopping activities that occur in grocery stores, other stores or malls as in-store shopping. One could define all other time spent shopping as online, but there are activities such as garage sales and catalog browsing that are not online and would be reported as shopping not conducted in a store/mall. ATUS questions do not distinguish between garage sales, catalog browsing, and online shopping. We use historical data from AHTUS to address this limitation. First, we categorize shopping time neither online nor in a store/mall as “other shopping time.” Next, we find all non in-store shopping time from AHTUS from 1985 to 1998 and note that must represent “other shopping time” (rather than online shopping) because e-commerce was insignificant in that period. The “other shopping time” ranged from 0.19 to 0.26 h per month from 1985 to 1998, with an average of 0.23 h per month. We assume that the average time spent by consumers on “other shopping” activities has remained constant at the pre-2003 level of 0.23 h per month, and online shopping time is set equal to shopping time not in store locations minus 0.23 h of “other shopping time.” The assumption that “other shopping” time is constant does not influence analysis of broader trends because the value is small compared to both in-store and online shopping times. The logic of these definitions is summarized in Table 1.
Construction of in-store shopping time, other shopping time, and online shopping time using American Time Use Survey (ATUS) (U.S. Bureau of Labor Statistics, 2025b) and American Heritage Time Use Study (AHTUS) (Fisher et al., 2018).
In our analysis, shopping time refers exclusively to the duration of shopping activities itself—time spent browsing, selecting, and purchasing—without including any travel time. For in-store shopping, only the time spent at a physical retail location is considered, while any time spent traveling to or from the store is excluded. For online shopping, travel time is not applicable, so only the time spent engaging in the online shopping activity is included. Excluding travel time ensures that the analysis focuses solely on the core shopping process, thereby avoiding variability introduced by external factors such as distance, traffic conditions and transportation mode, thus enabling a direct and comparable assessment of time efficiency between in-store and online shopping.
In addition, the analysis excludes prepared food purchases that are defined in ATUS shopping activities (such as take-out and fast-food orders) to maintain a focused examination of retail shopping behavior. Food purchasing generally occurs in restaurants or similar establishments, where the associated time primarily involves eating, which falls outside the scope of this research. Furthermore, while prepared food service has been affected by e-commerce trends, the effect has been smaller than in traditional retail. Therefore, by excluding activities related to prepared food, the study is better able to concentrate on the efficiency and time dynamics of retail shopping, ensuring that the data reflects the specific behaviors relevant to in-store and online retail shopping.
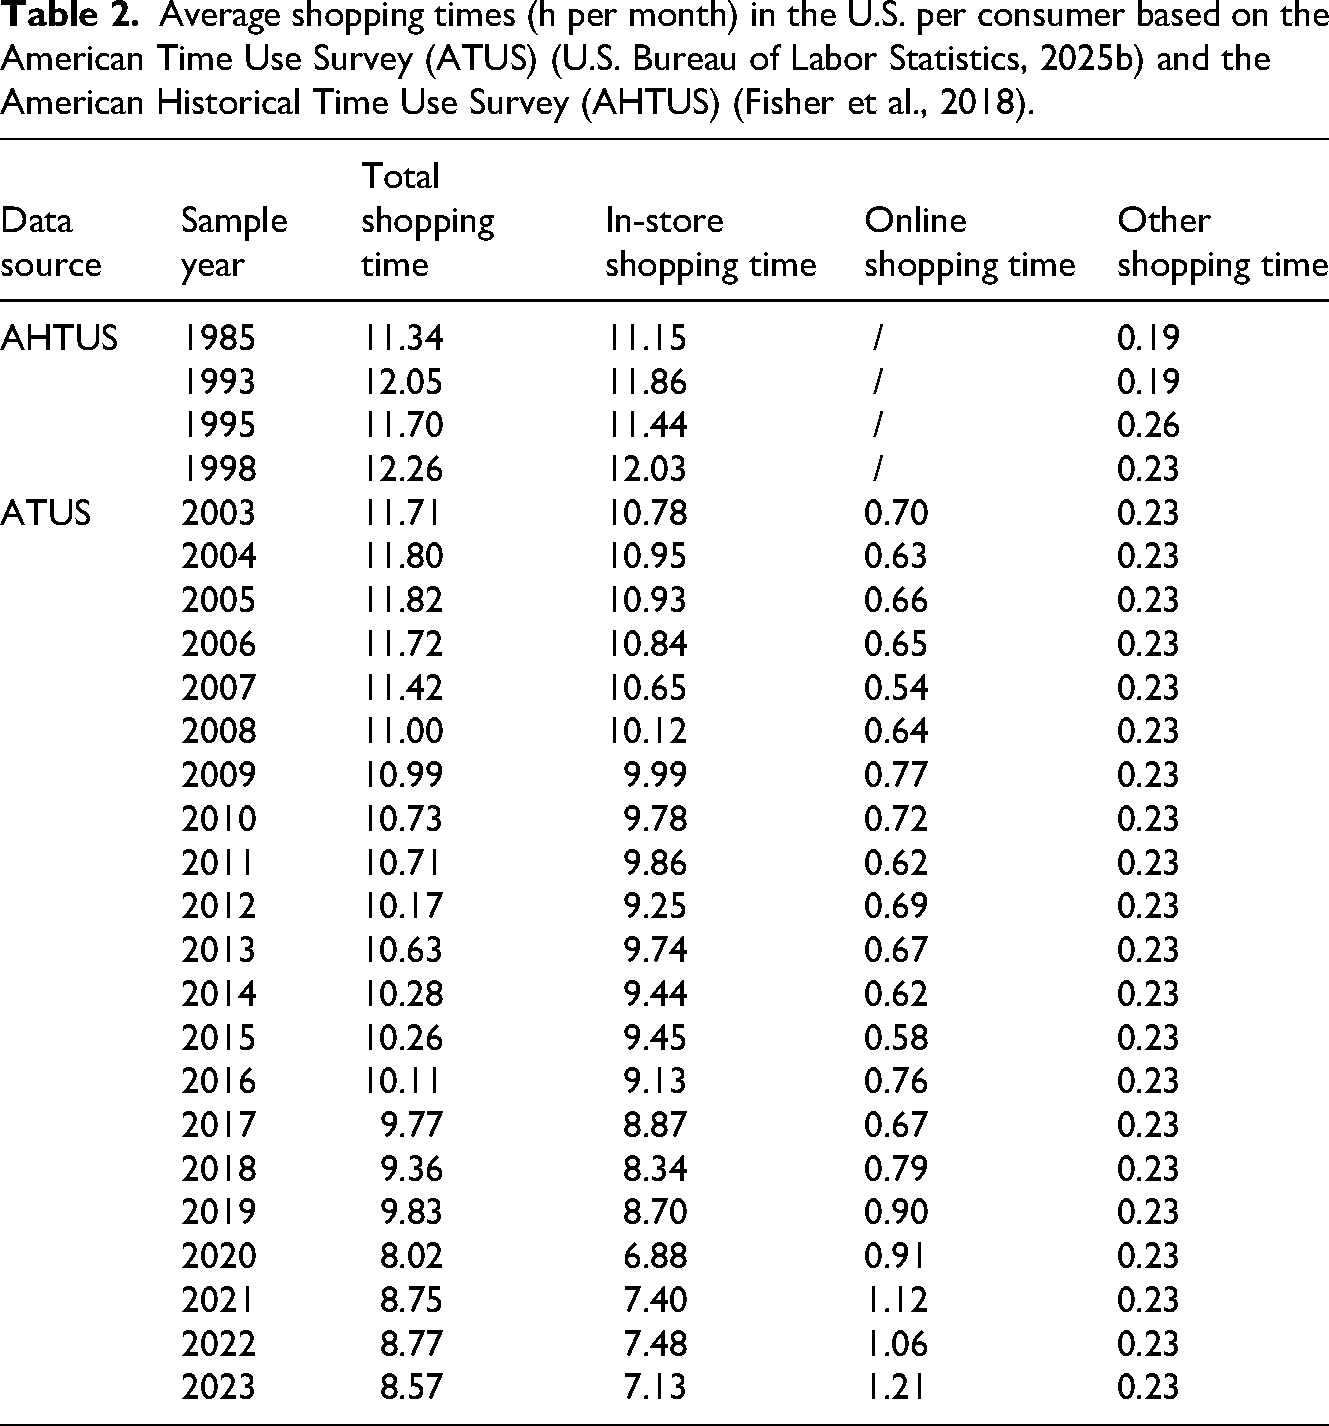
Using these definitions, the average total shopping time, in-store shopping time, online shopping time, and other shopping time per consumer per month were derived from the ATUS and AHTUS databases, and reported in Table 2.
Average shopping times (h per month) in the U.S. per consumer based on the American Time Use Survey (ATUS) (U.S. Bureau of Labor Statistics, 2025b) and the American Historical Time Use Survey (AHTUS) (Fisher et al., 2018).
Time efficiency of e-commerce
Next, we develop an approach to explain the reduction of total shopping time from 2003–2023 in terms of technological progress in online shopping. We hypothesize that e-commerce is more time efficient than in-store shopping - the selection and purchasing of goods online takes less time online than in-store. Prior to the emergence of e-commerce, Figure 1 and Table 2 show that despite increasing monetary expenditures, the average total shopping time per consumer remained stable from 1985 to 1998 at 11–12 h per month. The 95% confidence intervals for average total shopping time overlap, with ranges of [10.23, 12.45] (1985), [11.11, 12.98] (1993), [9.49, 13.92] (1995), and [10.60, 13.92] (1998) h per month. This suggests that the average total shopping time was statistically constant over this period. An ANOVA test further supports this observation, showing insufficient evidence to claim any significant difference in average total shopping time across these years (p = 0.64 > 0.05). The details of the statistical analysis are provided in Supplementary Material. This leads to the assumption of a constant time budget for shopping, that is, an assertion that an average consumer historically spent a fixed amount of time on shopping. One explanation of a constant time budget is psychological: After acquiring necessities, consumers do discretionary shopping to a certain point, switching activities when alternatives have higher marginal time utility. A second perspective considers the evolution of products and the in-store retail experience. Consumers might spend the same amount of time buying more products because the retail sector evolves to make it easier to purchase (e.g., big box stores). Also, consumers may be purchasing higher quality goods (e.g., better cars) with additional income, but using the same amount of time to make these choices. There are other precedents for a constant time budget for an activity (Gutiérrez et al., 2010). In transportation, empirical evidence indicates that total travel time tends to be constant over years of data, regardless of the mode of transportation or distance covered (Gutiérrez et al., 2010; Mokhtarian and Chen, 2004; Stopher et al., 2017). The stability in travel time budget is typically observed at an aggregate, population-wide level, rather than on an individual day-to-day basis (Joly, 2004).
We next explain the post-2003 decline of total shopping time by introducing the idea of “equivalent shopping time.” The hypothesis is that e-commerce delivers a greater practical and perceived time utility than in-store shopping. Equivalent shopping time is the total hours of in-store shopping utility achieved from all shopping combined. It represents how long the shopping would take if all of it were in-store. We next assume that the constant time budget of 12.26 h per month, corresponding to the average total shopping time in 1998 as shown in Table 2, the most recent year prior to widespread e-commerce adoption, which we use as the equivalent shopping time. E-commerce is expected to reduce actual shopping time due to improved time efficiency. In equation form, this is:
In addition to Kj as an efficiency factor, it is useful to define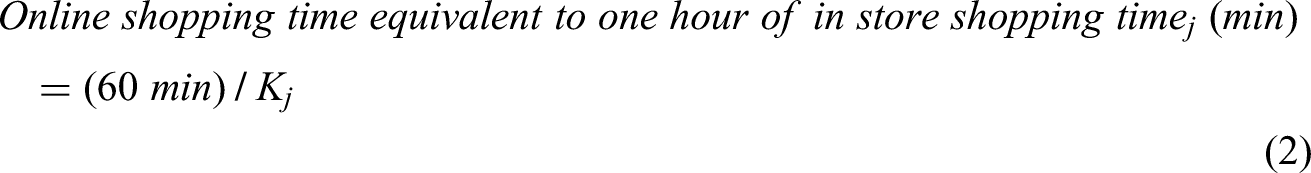
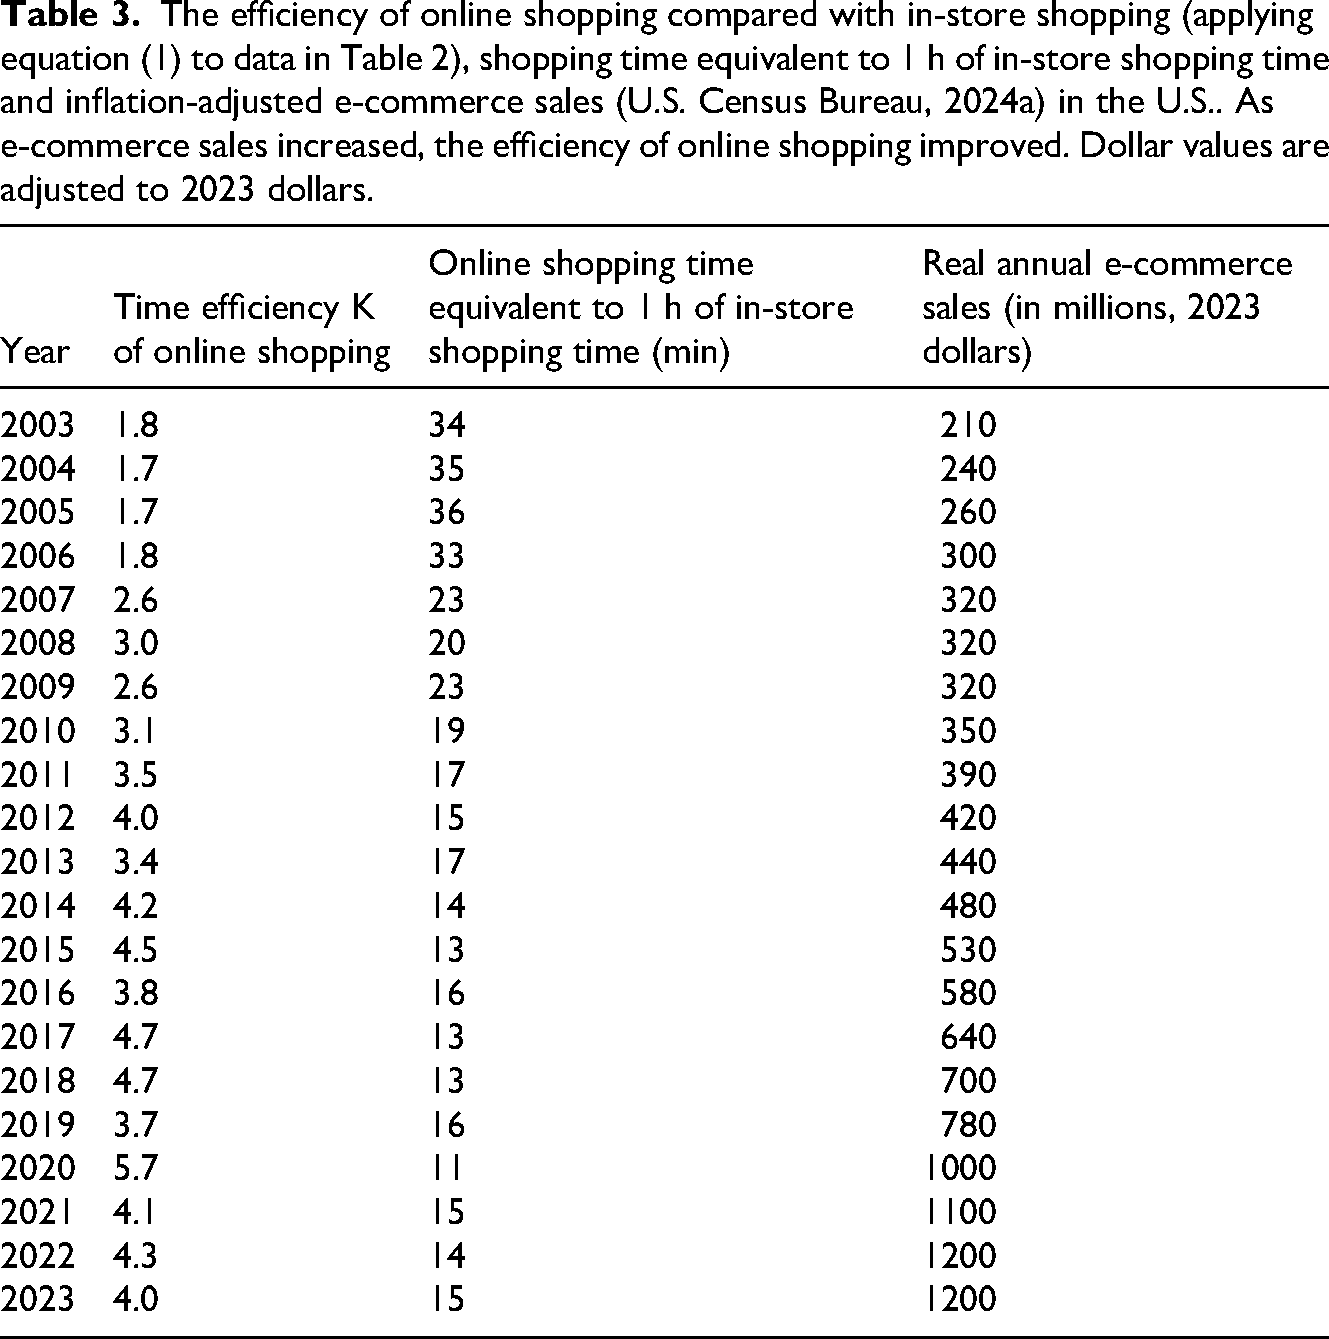
For example, if K = 3, then 60 min/3 = 20 min, which means it takes 20 min of shopping time online to complete the equivalent task of 1 h of in-store shopping. Calculating Kj using Equation (1) results in Table 3, showing increasing online shopping time efficiency from 2003 to 2023. Correspondingly, the online shopping time required to achieve the same task as 1 h of in-store shopping has decreased from approximately 35 min in 2003 to 2005 to around 15 min by 2023. Table 3 also gives the real annual e-commerce sales based on U.S. Census Bureau (2024a), showing that online shopping improved in time efficiency as e-commerce sales increased over time, which will be related further in next sub-section.
The efficiency of online shopping compared with in-store shopping (applying equation (1) to data in Table 2), shopping time equivalent to 1 h of in-store shopping time and inflation-adjusted e-commerce sales (U.S. Census Bureau, 2024a) in the U.S.. As e-commerce sales increased, the efficiency of online shopping improved. Dollar values are adjusted to 2023 dollars.
Discovering patterns in technological progress in e-commerce
The general increasing trend in the time efficiency of online shopping can be interpreted as a result of technological improvements in e-commerce platforms. At the same time, consumers have learned how to shop more effectively online, becoming familiar with search functions, filters, and price comparison tools. This learning process contributes to improved efficiency, although with available data it is difficult to distinguish between the technological versus consumer learning effects. We next propose a model to explain technological progress in terms of a driving external factor, cumulative e-commerce purchases. The experience curve model has been empirically robust in explaining an improving attribute of a process or product, such as production cost or time to complete, in terms of the cumulative instances of prior production or implementation (Kull et al., 2007; Rivera and Eng, 2004; Wright, 1936). The experience curve model has been used to explain cost reductions across various technologies, which is supported by Nagy et al. (2013), who found that R2 values exceeded 90% for most of the 62 technologies studied.
The experience curve model employed in this study is expressed in the following form:
E-commerce sales are taken from the U.S. Census Bureau’s (2024a) monthly retail trade reports which provide data on retail sales, including annual e-commerce retail sales from 2003 to 2023. The Chained Consumer Price Index for All Urban Consumers (C-CPI-U) (U.S. Bureau of Labor Statistics, 2025a) is used to adjust these e-commerce sales to real dollars in 2023. The right hand column of Table 3 presents this data on annual e-commerce sales.
In this study, the learning rate is quantified by measuring the reduction in time required to complete an equivalent shopping task online compared to 1 h spent in a physical store. It is calculated by:
By employing an experience curve model, future time efficiency trends in online shopping can be projected based on historical data. The learning coefficient combined with projected e-commerce sales are used to predict the future online shopping time equivalent to 1 h of in-store shopping time (min) through the year 2030, based on equation (3). Projected real e-commerce sales are estimated based on the Compound Annual Growth Rate (CAGR) of historical real e-commerce sales. CAGR is widely used in financial and business forecasting because of its simplicity and effectiveness in representing compounded growth over time (White and Ariguzo, 2011). Therefore, this paper utilizes CAGR to estimate future trends in e-commerce sales, providing a reliable projection of long-term growth. After the future online shopping time equivalent to 1 h of in-store shopping time (min) is predicted, the future efficiency (K) of online shopping can be computed using equation (2).
Sensitivity analysis of the learning rate can be done by changing the starting year or ending year of the analysis (Williams et al., 2017). In this work, we systematically vary the time frame of the analysis, allowing us to identify the impact of temporal boundaries on learning rates and estimate their uncertainty. This is crucial because the online shopping landscape is dynamic, with rapid advancements in technology, changes in consumer behavior, and evolving market conditions. Understanding how the variations of starting year and ending year contribute to learning rates can provide insights into potential future time-efficiencies of online shopping.
Results
Trend in historical in-store shopping time and online shopping time
Figure 2 shows in-store and online shopping time for U.S. consumers between 2003 and 2023. Over this period, there is a clear decline in in-store shopping time and an overall increase in online shopping time, showing a clear transition from conventional in-store shopping to online shopping. A degree of noise in the data presents a challenge for identifying precise years of turning points, but a downward trend in in-store shopping begins around 2008. The abrupt drop in 2020 (to 6.88 h per month) can be attributed to the COVID-19 pandemic, which led to widespread store closures and a sharp but temporary increase in online shopping. The pattern observed after 2020 suggests a partial normalization, with online shopping stabilizing at a higher level than before the pandemic, indicating a lasting structural shift in shopping behavior. The amount of time shopping online looks roughly constant at around 0.6 h per month until around 2017, after which there is an overall upward trend of +0.08 h per month each year.
Historical time efficiency of online shopping
Figure 3 shows the historical time efficiency of online shopping from 2003 to 2023, measured by the amount of online shopping time calculated to be equivalent to 1 h of in-store shopping. This is calculated via methods and data described in the section “Time Efficiency of E-commerce.” The results show a rapid improvement in efficiency from 33 min (in 2003) to around 15 min in 2012. The trend after 2012 is weaker and difficult to discern by eye, with annual change smaller than the year-to-year noise in annual data.
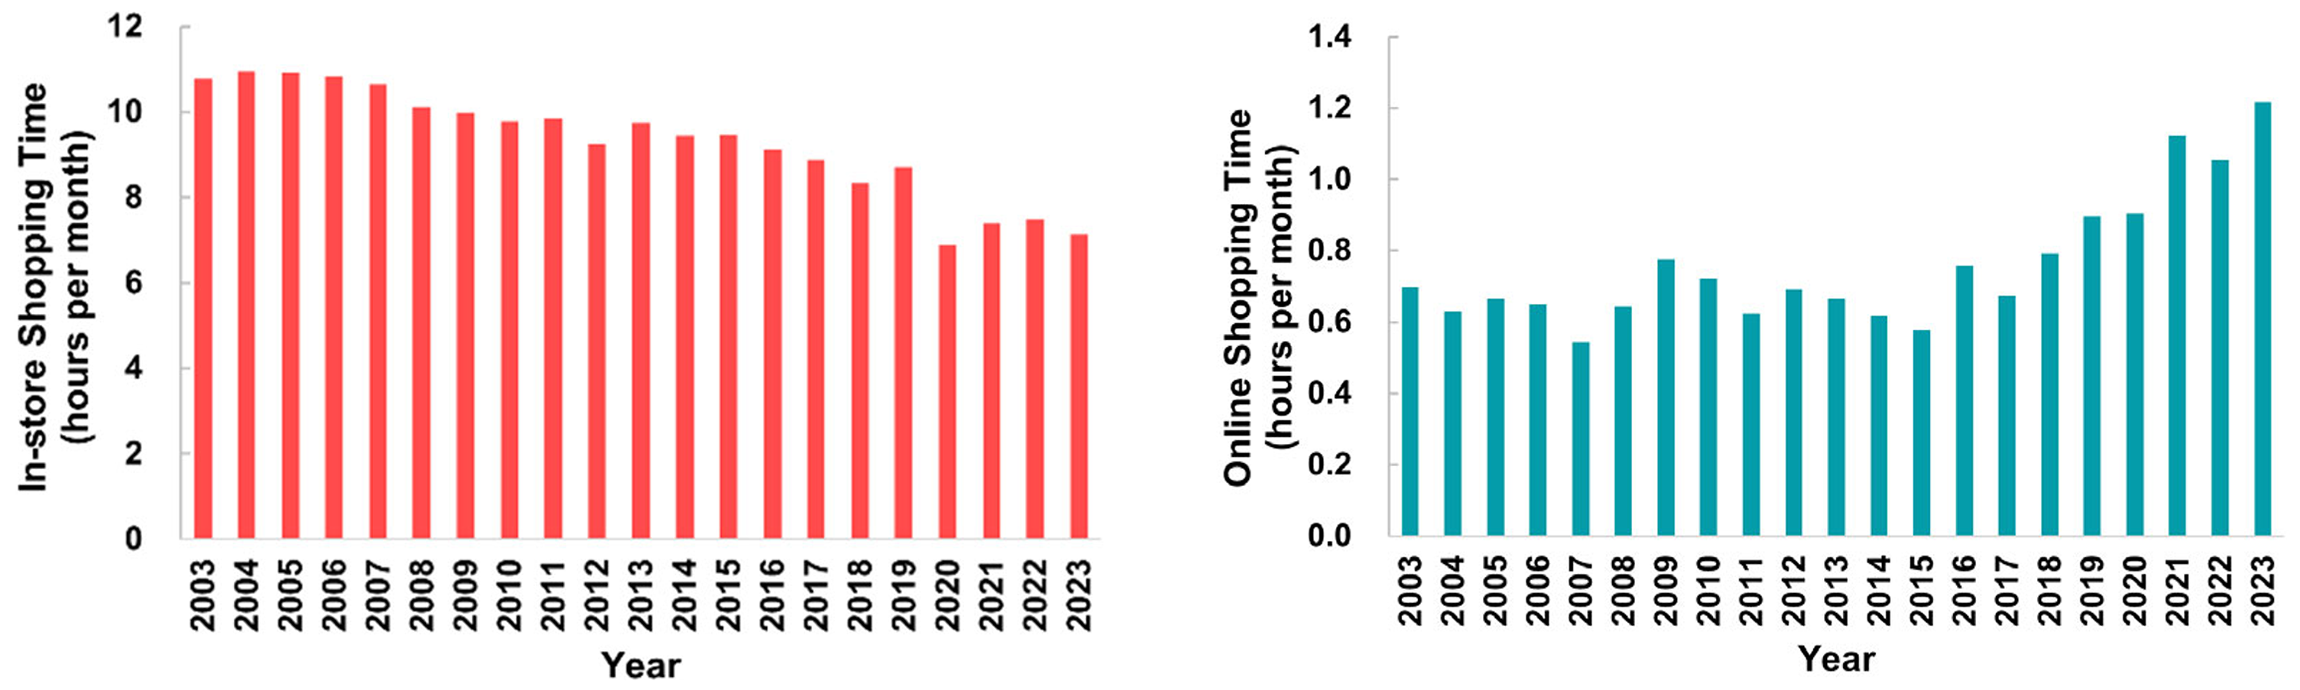
Historical in-store and online shopping time (h per month) in the U.S. from 2003 to 2023. The in-store shopping time exhibited a decreasing trend, while online shopping time has increased. This reflects a clear shift from traditional in-store shopping to online shopping. Note the differing scales, and that total shopping time has been decreasing over time.
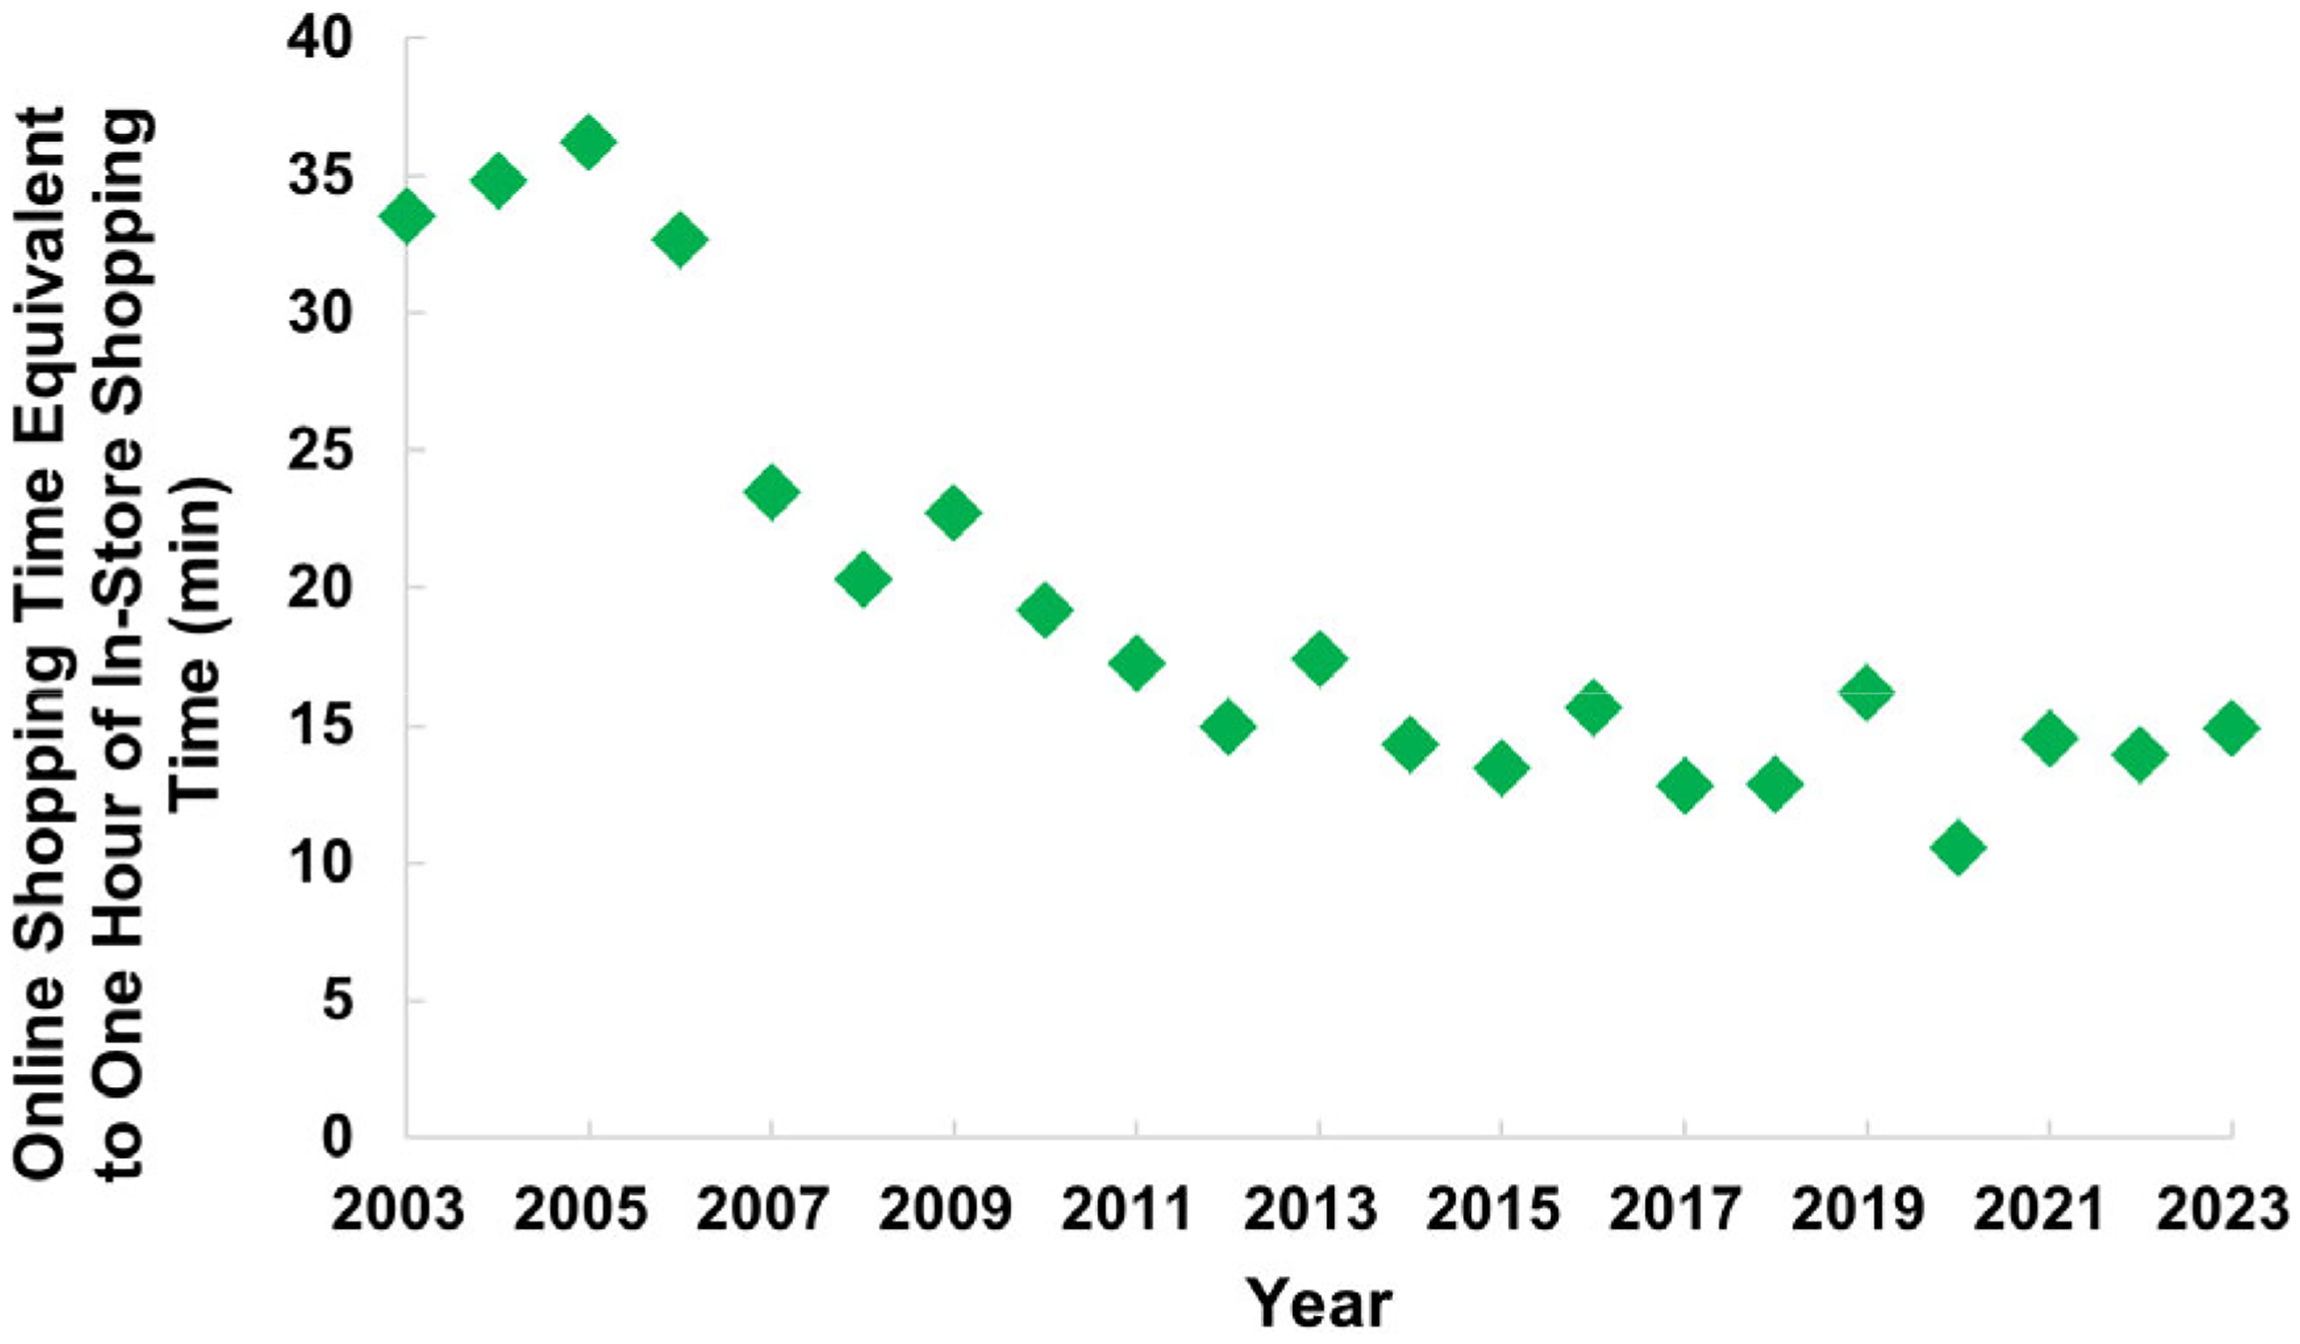
Online shopping time equivalent to 1 h of in-store shopping time (min) from 2003 to 2023. The decreasing trend indicates a progressive improvement in the efficiency of online shopping compared to in-store shopping over time.
Learning rate for the efficiency of online shopping
As described in the section “Discovering Patterns in Technological Progress in E-commerce,” we model the evolution of the online shopping time equivalent to 1 h of in-store shopping time as an experience curve with cumulative e-commerce as the descriptive variable. Figure 4 shows the resulting relationship. Figure 4(a) presents the data using a normal linear scale, which shows a clear downward trend in which the online shopping time equivalent to 1 h of in-store shopping time decreases as cumulative e-commerce sales increase. Figure 4(b) depicts the same data on a log-log scale, showing that a straight-line relationship (corresponding to the experience curve model) fits the data reasonably well. Performing linear regression, the resulting learning rate is 15% from 2003 to 2023, with an R2 value of 0.94. A learning rate of 15% implies that every doubling of cumulative e-commerce sales leads to a 15% reduction in the online shopping equivalent to 1 h of in-store shopping time. These improvements in online shopping time efficiency can be attributed to several factors, including technological advancements, user-friendly interfaces, streamlined checkout processes, and improved logistics systems. The high R2 value (0.94) suggests reliability of the experience curve model.
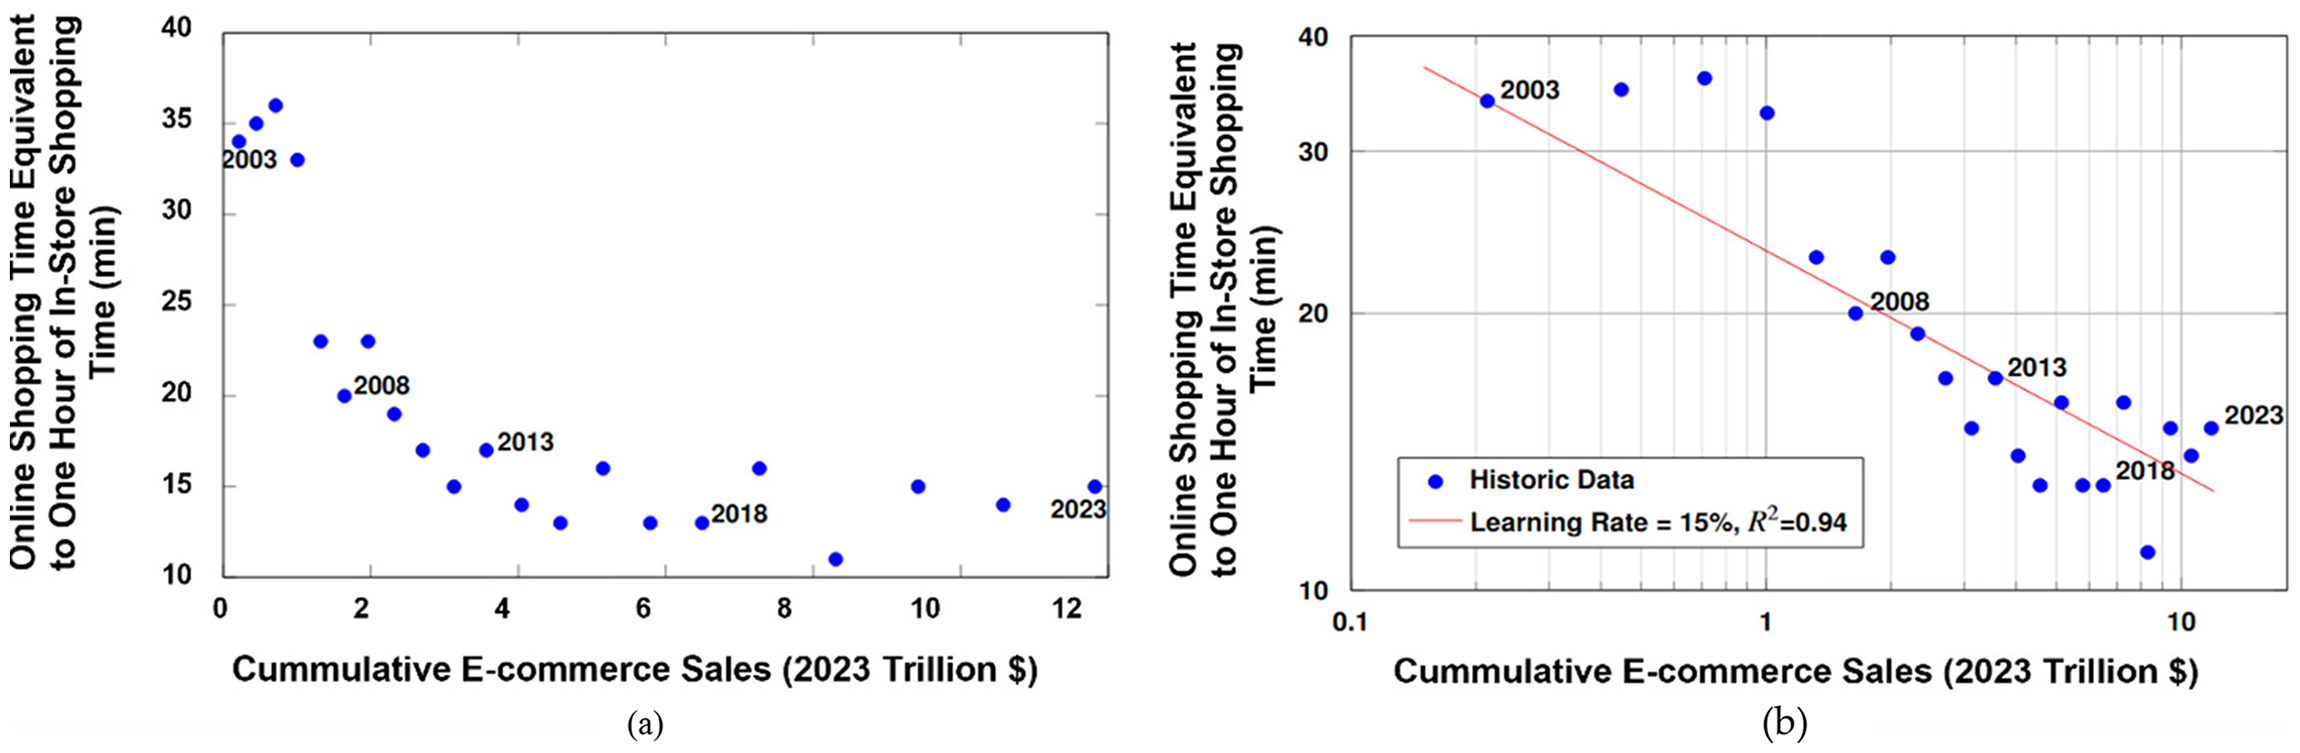
E-commerce experience curve for 2003 to 2023. The online shopping time equivalent to 1 h of in-store shopping decreases as cumulative e-commerce sales increase, (a) displays the data on a linear scale, showing a downward curve, and (b) presents the same data on a log-log scale, revealing a straight-line relationship, as expected by the experience curve model. Data points are labeled in 5-year increments from 2003 to 2023. The learning rate is 15% with an R2 value of 0.94, which indicates that for every doubling of cumulative e-commerce sales, the time required for online shopping to achieve the same task as 1 h of in-store shopping decreases by 15%.
Uncertainty analysis for experience curve model
The time frame of available data is a source of uncertainty for experience curve models (Williams et al., 2017). In many cases, including the current model, the underlying data are subject to noise driven by business cycles. The most common application of experience curves is modeling cost reductions over time. However, when time-series data on costs are unavailable, the prices are used as a proxy for cost. Business cycles in the economy lead to prices generally increasing faster in boom periods and more slowly during recessions. A dataset for an experience curve model starting during boom versus recession years affects results for the learning rate, sometimes significantly (Williams et al., 2017). The starting and ending years of a dataset are arbitrary choices, as the analyst normally chooses the maximum range that data are available at the time of the analysis.
To address this, we perform a sensitivity analysis of the learning rate by varying the starting and ending years of the dataset. Figure 5 illustrates the variation in learning rates across different starting and ending years. When the starting year ranges from 2003 to 2007, the learning rate for e-commerce sales varies between 12% and 19% (Figure 5(a)), with an R2 value exceeding 90%. This variation suggests that the learning rate is sensitive to the choice of the starting year. This sensitivity may be attributed to the relatively low popularity of e-commerce during these early years, and the limited sample size of respondents reporting online shopping in the ATUS dataset. The learning rate ranges from 15% to 16% when the ending year varies between 2017 and 2023, with an R2 value exceeding 90% (Figure 5(b)). Combining the sensitivity analysis of changing starting year and ending year, the learning rate ranges between 12% and 19%. The preferred learning rate is 15% based on the entire dataset from 2003 to 2023.
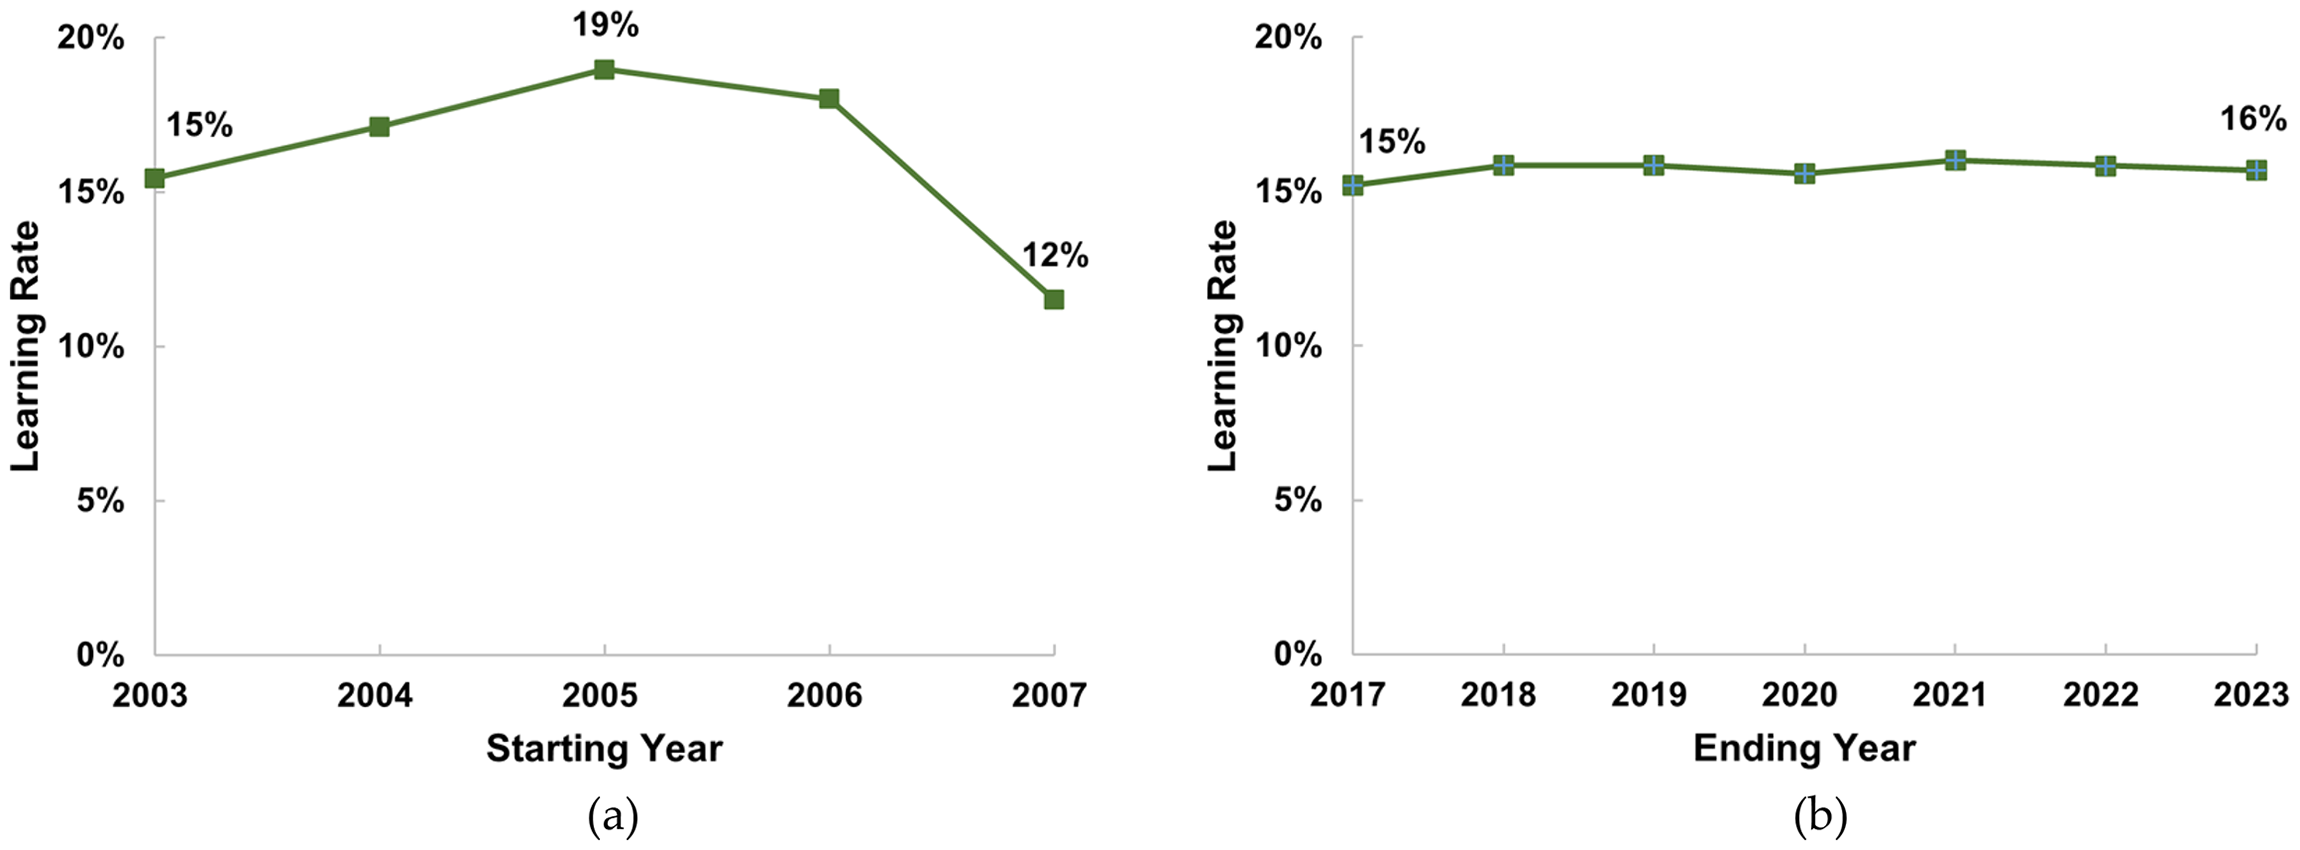
Sensitivity of learning rate to starting and ending years of dataset. The starting and ending year can be considered as stochastic variables that affect experience curve results. (a) When the starting year ranges from 2003 to 2007, the learning rate varies between 12% and 19%, (b) shows a relatively stable learning rate of 15–16% as the ending year changes from 2017 to 2023.
Forecasting time efficiency of online shopping
We next use the experience curve model to forecast future online shopping time equivalent to 1 h of in-store shopping out to the year 2030, accounting for uncertainties in learning rate and the growth in e-commerce. We develop baseline, high, and low estimates for each quantity. The uncertainty in learning rate is drawn from the the section “Uncertainty Analysis for Experience Curve Model” results, a base case learning rate of 15%, low-end estimate of 12%, and high-end estimate of 19%. For e-commerce sales, future compound annual growth rate (CAGR) is estimated through retrospective forecasting. When adjusting the starting year while maintaining a fixed ending year of 2023, the CAGR for real e-commerce sales ranges from 3.6% to 10.1%. The preferred CAGR, starting from 2003, is 8.8%. These values reflect the low, high, and most likely growth rates for real e-commerce sales over the forecast period. Thus, the ranges above are incorporated into the experience curve model to predict future online shopping time equivalent to 1 h of in-store shopping and thus predict the future efficiency (K) of online shopping based on Equation (2). By integrating uncertainties in learning rates and e-commerce growth, this approach provides a robust framework for projecting how online shopping efficiency will evolve under varying market conditions.
As illustrated in Figure 6, the online shopping time equivalent to 1 h of in-store shopping in 2030 ranges from 9.2 to 11.2 min, with the preferred estimate being 10.7 min. The preferred estimate is carried out based on the preferred values for the learning rate and CAGR of real e-commerce sales. The analysis indicates that by 2030, online shopping could be between 5.4 and 6.6 times more time-efficient compared to traditional in-store shopping. This projected increase in efficiency reflects the continued advancements in e-commerce technologies, including streamlined navigation, faster transaction processes, and improved product search functions. These technological developments are expected to further reduce the time consumers spend purchasing goods online. At the same time, as consumers become more familiar with online shopping interfaces and decision-making processes, their learning and adaptation further enhance efficiency.
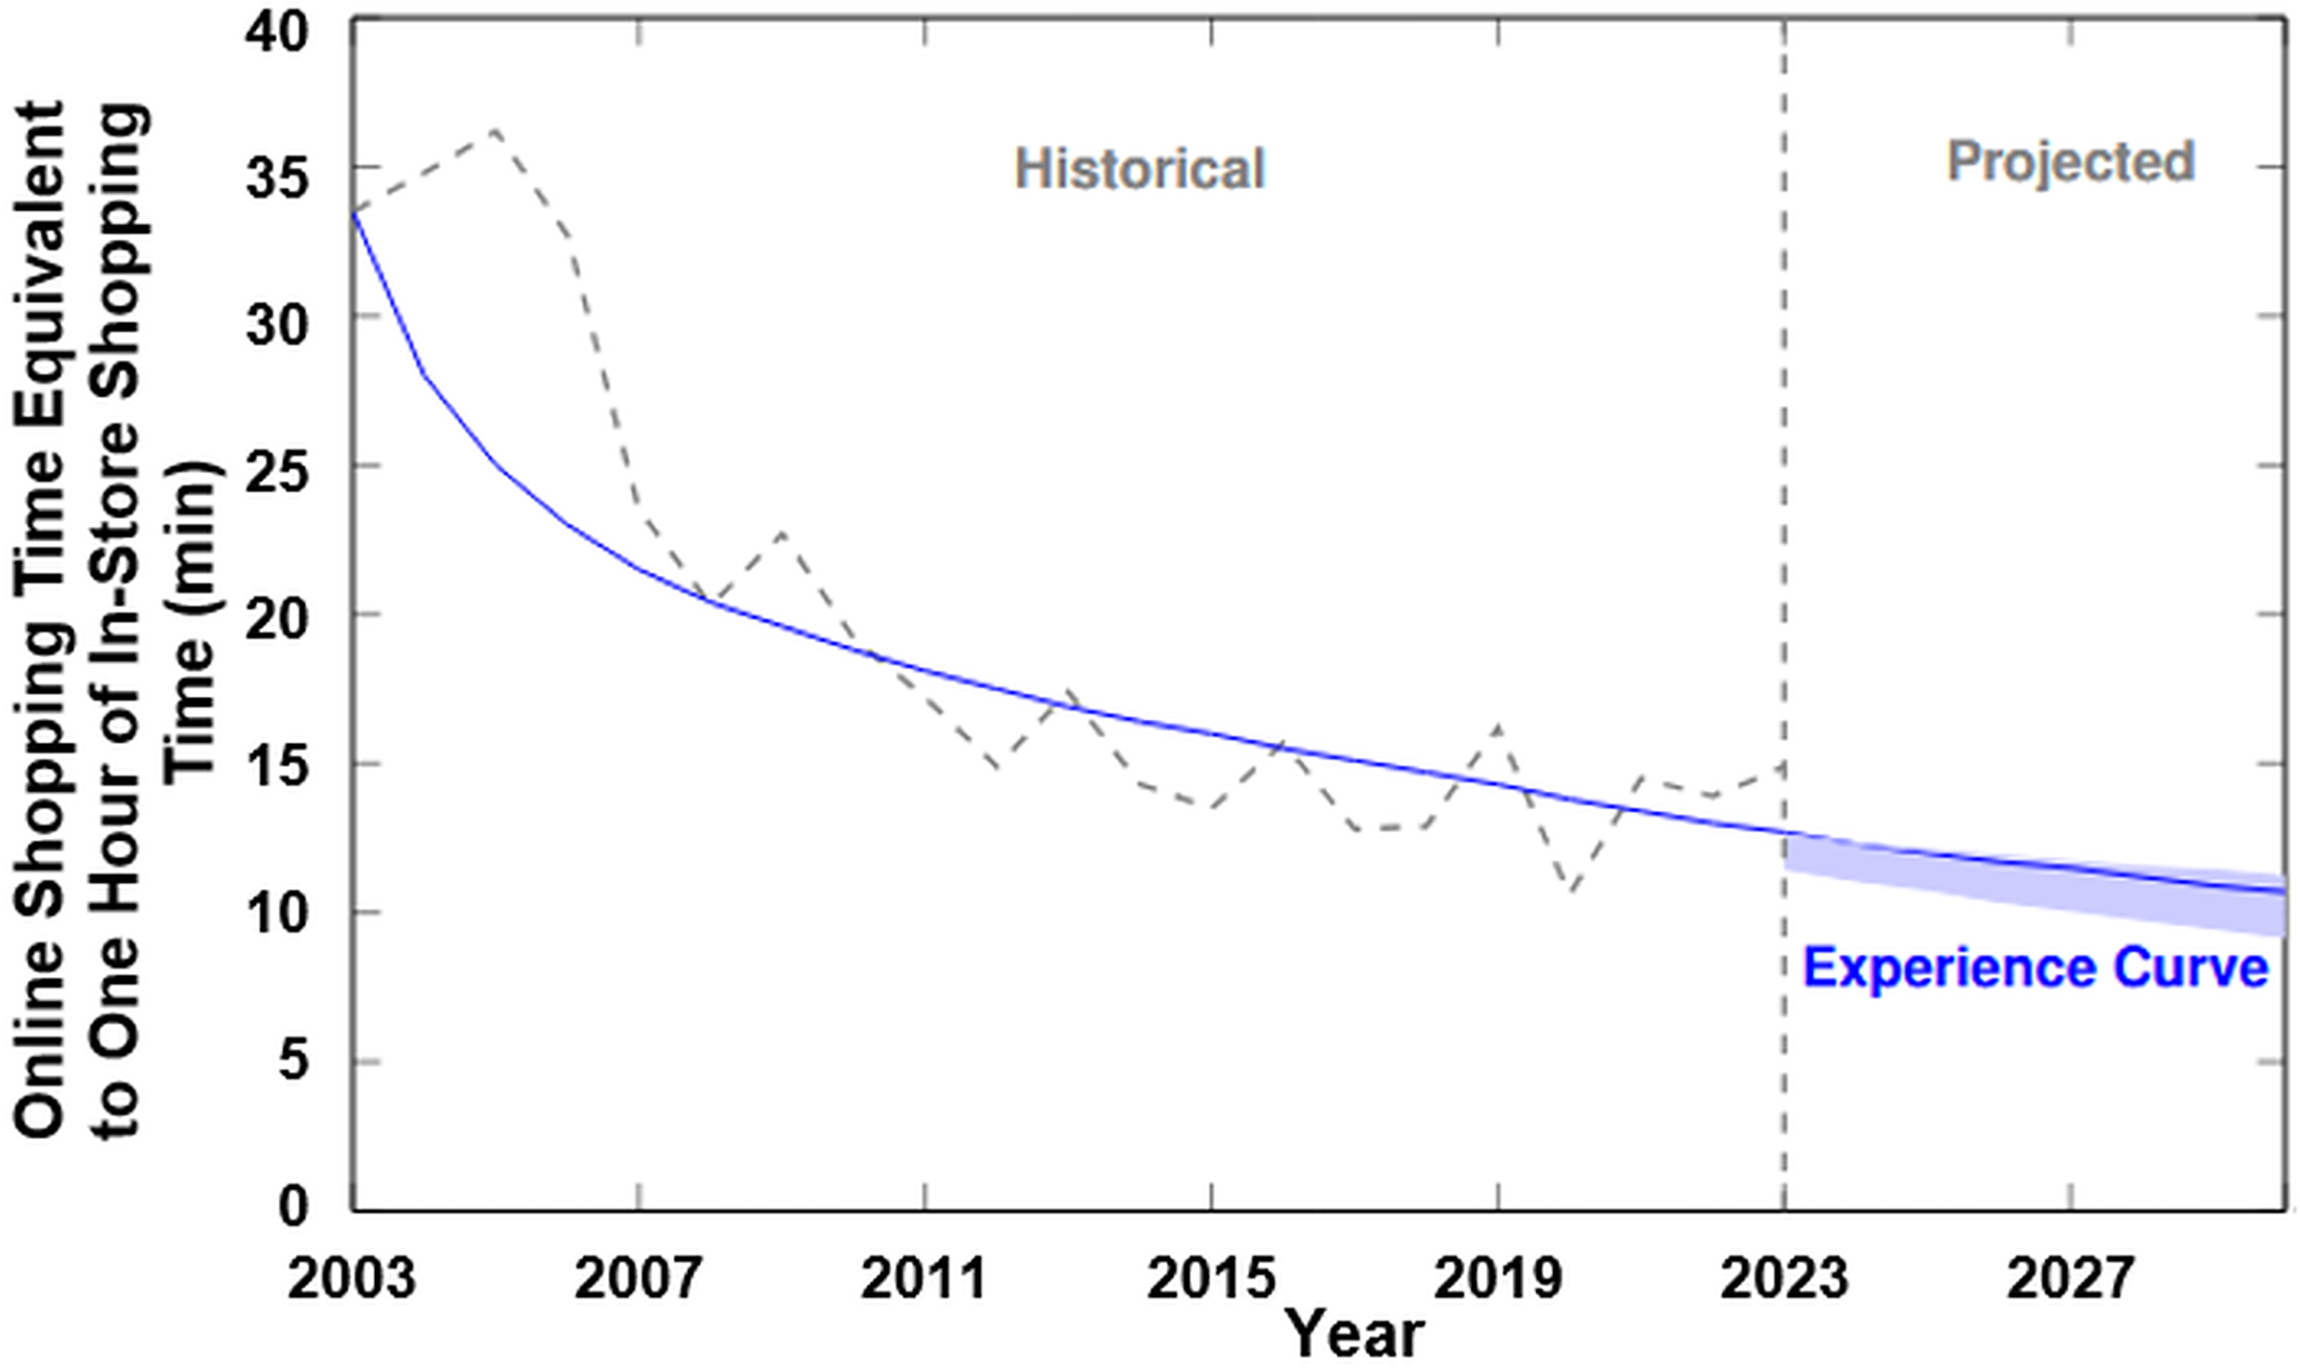
The historical and projected online shopping time equivalent to 1 h of in-store shopping time (min). Projections are based on the experience curve model, represented as a range (light blue area) with a preferred estimate (dark blue line). The preferred estimation is also used to estimate the historical trend back to 2003 and effectively captures the historical data (gray dashed line), supporting the reliability of the experience curve model. The upper bound of the range uses the lowest learning rate (12%) and the lowest CAGR for real e-commerce sales (3.6%), while the lower bound uses the highest learning rate (19%) and the highest CAGR for real e-commerce sales (10.1%). The preferred estimate is derived from a learning rate of 15% and a CAGR of 8.8%. The model predicts that by 2030, online shopping will continue the trend of improving time efficiency relative to in-store shopping, enabling consumers to accomplish the equivalent of 1 h of in-store shopping in just 9.2 to 11.2 min online.
Discussion
To first discuss matters of methodology, we believe that this analysis is the first example of research using the experience curve to model consumer behavior influenced by technological progress. Prior applications of the experience curve include price/cost, time to complete a task, error reduction in processes, improvement in quality, and others (Badiru, 1998; Krouwer, 2002; Rivera and Eng, 2004; Williams et al., 2017). Our treatment is akin to the “time to complete” but does not refer to a single defined task but rather a bundle of tasks (1 h of in-store shopping) faced by consumers.
The results indicate that online shopping has become increasingly time-efficient in the prior 20 years, reflecting continuous advancements in e-commerce platforms, growing consumer familiarity and adoption, and other factors that enhance the overall efficiency of online purchasing activities. It is important to note that in-store shopping efficiency has also improved over time due to the adoption of digital tools such as inventory-checking apps, in-store navigation, and self-checkout systems, as well as the growing prevalence of big-box shopping centers where consumers can purchase multiple types of goods in a single trip. These developments have shortened the in-store shopping process, but do not change the overall conclusion that the efficiency gains of online shopping have outpaced those of in-store shopping, given the faster rate of improvement in online platforms and user adaptation.
The continuous improvement in online shopping efficiency observed in this study carries broader implications for how consumers experience and structure time. The orientation toward time in shopping is increasingly characterized by a pursuit of immediacy and optimization, where efficiency serves as both a goal and a guiding temporal logic shaping consumer behavior (Papastefanou and Zajchowski, 2016; Wajcman, 2015). As online shopping requires only a fraction of the time previously needed for equivalent in-store activities, it may free up time that could be devoted to leisure, work, or other pursuits (Sekar et al., 2018). However, such efficiency may also intensify expectations for constant availability and faster consumption, potentially reinforcing rather than alleviating perceived time pressure. As Cornwell et al. (2019) argue, the ways individuals allocate and experience time are deeply embedded in the social organization of everyday life, while Papastefanou and Zajchowski (2016) demonstrate that temporal patterns of shopping reflect broader processes of social acceleration. Within this evolving temporal landscape, shopping itself occupies a hybrid position between work and leisure—functioning both as a necessary household activity and as a source of exploration or enjoyment. Yet, as efficiency increases, shopping becomes more transactional and work-like, potentially diminishing its social and experiential dimensions. In this sense, the pursuit of efficiency not only transforms how much time consumers spend shopping but also how shopping is experienced and understood, reflecting the broader rationalization and acceleration of everyday life under digital capitalism (Aguiar et al., 2013; Wajcman, 2015).
This analysis measures the time implications of e-commerce. Shifting the perspective from time to money, per capita consumer spending in-store declined slightly from $17,400 (in 2023 U.S. dollars) in 2003 to $17,200 in 2023 (U.S. Census Bureau, 2024a). In contrast, per capita e-commerce expenditures increased significantly from $1170 (in 2023 U.S. dollars) in 2003 to $4010 in 2023 (U.S. Census Bureau, 2024a). These two trends will presumably continue, partly driven by continued technological progress in e-commerce. The nature of future technological improvement is unknown, but there have been technological advances on multiple fronts in the past, for example, better selection of goods, easier searching, and streamlined checkout progress. In the future, it is reasonable to expect advances in AI algorithms to improve suggested purchases. AI could also improve the efficiency of e-commerce logistics (Thenmozhi and Krishnakumari, 2024).
What are the economic and social implications of increased time and expenditures on e-commerce? Enabling more and easier purchases is presumably good for overall economic growth (Anggraeni et al., 2024), though with winners and losers. The brick-and-mortar retail sector will continue to struggle when faced with online competition. This affects jobs: the share of people employed in retail fell from 7% in 2010 to 5.6% in 2022 (Laughlin and Beckhusen, 2023). Over the same time period, U.S. employment in electronic shopping and mail order houses rose from 1.9% in 2010 to 3.3% in 2022 (U.S. Bureau of Labor Statistics, 2025c). These data suggest that e-commerce is, on the whole, less labor intensive than brick-and-mortar retail, leading to a net reduction of workers.
Socially, there is a question of what people do with time saved via e-commerce and other virtual modes such as telework. Using our results, the average American has saved 25 h per year over the past decade (2013–2023) due to the time efficiency of online shopping. If scaled up to the entire population of the U.S., this amounts to 8.4 billion h per year over the past 10 years. What are people doing with this extra time? Prior research suggests that increased time spent online leads to more time on activities at home (such as sleeping and watching TV) (Phoung et al., 2024; Sekar et al., 2018), but further investigation could be made. There are also environmental implications of shifting to e-commerce. At the consumer level, increased time spent at home leads to less time spent in transportation and commercial buildings (Phoung et al., 2024; Sekar et al., 2018). This affects the structure and scale of energy demand. The logistics of e-commerce versus brick-and-mortar have different environmental impacts, with more warehousing, packaging, and delivery activity for online platforms, while retail involves more personal transport and retail store energy use (Feichtinger and Gronalt, 2021; Siragusa and Tumino, 2022; Weber et al., 2009).
Limitations
Aggregation of shopping activities
The online shopping time and in-store shopping time extracted from the American Time Use Survey (ATUS) are aggregated across all shopping activities, and e-commerce sales data from the monthly retail trade reports from the U.S. Census Bureau (2024a) do not distinguish between product categories such as groceries, clothing, or durable goods. As a result, the analysis cannot disaggregate time efficiency by purchase type. However, consumer behavior and preferences can vary significantly by category, as the time required for shopping for clothes, for example, can differ dramatically from that spent on purchasing books. This variability highlights the need for further research that disaggregates shopping activities by category to provide a more nuanced understanding of the time efficiency associated with online versus in-store shopping, particularly in categories that account for the largest share of consumers’ disposable income, such as food, transportation, apparel and healthcare. Future studies that might create or have access to new datasets could explore these category-specific dynamics to enhance the robustness of the findings and offer more targeted insights into consumer shopping behaviors.
Assumption of constant total shopping time budget
The historical data from the American Heritage Time Use Survey (AHTUS) shows a reasonably constant value over time, and we interpret that as a form of constant time budget. This implies that we attribute any changes to the effect of e-commerce, when additional factors could be at play. In particular, shifts in consumer lifestyle, technological adoption, and demographic composition may also influence how individuals allocate time to shopping-related activities. Therefore, while the assumption of a constant shopping time budget provides a useful analytical baseline, it is important to interpret this stability in light of these interacting social, economic, and technological dynamics.
Assumption of constant “other shopping time”
In Section “Historical In-store Shopping Time and Online Shopping Time” we posited that the average time spent by consumers on other shopping activities remained constant from 2003 to 2023 at 0.23 h per month. These activities, including garage/yard and catalog sales, are assumed to remain stable due to the inherent challenges in the data in distinguishing them from online shopping time. While we did not have national time series data on garage/yard and catalog sales, consulting firm data indicates that U.S. catalog shopping revenues were stable over the period 2005–2019, and growing during the pandemic (IBISWorld, 2026). We test the sensitivity of results for the experience curve model to the assumption of 0.23 h per month. We alternatively assume an average time of 0 h for other shopping activities. This assumption is unrealistically low—for example, people will likely continue engaging in activities like garage sales (Crawford, 2014; Herrmann, 2006), meaning the average time for “other shopping” will never reach 0—but is useful for sensitivity analysis. Under this assumption, the learning rate increases to 15.9%, close to the original base case estimate of 15.4% (rounded to 15% in “Learning Rate for the Efficiency of Online Shopping” results). 0.23 h per month is likely an upper bound on other shopping activities and 0 h per month a lower bound, showing that the learning rate is relatively insensitive to plausible choices regarding this assumption.
Perceptions of time efficiency
Although this study provides an empirical assessment of the evolving efficiency of online shopping based on observed time-use data, it does not capture consumers’ perceptions of time efficiency. While our focus is on an objective assessment of how long people spend on online and in-store shopping activities, perceptions of convenience, satisfaction, and cognitive effort may differ substantially from these recorded durations. For instance, activities that are objectively faster may still be experienced as time-consuming if they involve fragmented attention or decision fatigue. Conversely, in-store shopping may be perceived as more satisfying or efficient in contexts where it combines social interaction or leisure. Consequently, while the findings document a marked improvement in the actual time efficiency of online shopping, they may not fully represent the subjective experience of time saving. Future research could integrate attitudinal or qualitative data to examine how perceived efficiency interacts with measured time use, thereby offering a more comprehensive understanding of the time efficiency of online shopping.
Conclusion
This paper analyzed in-store and online shopping time from 2003 to 2023, using data from the American Time Use Survey (ATUS) to determine the relative time efficiency of online shopping. An experience curve model based on e-commerce sales predicted that online shopping could be 5.4 to 6.6 times more time-efficient than traditional in-store shopping by 2030, with a learning rate between 12% and 19%, which carries significant implications across multiple domains. For consumers, it means a substantial reduction in the time spent shopping, enhancing convenience and freeing up time for other activities. This efficiency gain is a key driver behind the growing preference for online shopping, as it aligns with evolving consumer demand for speed and ease of use. For businesses, particularly in the e-commerce sector, the increased efficiency is likely to spur further growth, as streamlined processes encourage more frequent purchases and potentially larger market penetration. Companies will need to continuously innovate to meet the rising expectations for fast, convenient shopping experiences. Meanwhile, traditional brick-and-mortar retailers may face increased competitive pressure, necessitating innovation in their own spaces, including a growing emphasis on omnichannel retailing as a strategy to respond to this pressure. On a broader scale, supply chains and logistics will also need to evolve, incorporating more advanced technologies such as automation and AI-driven operations to keep pace with growing online demand. Policymakers may need to adjust to these trends by reconsidering the role of physical retail and ensuring robust digital infrastructure to support the ongoing shift to e-commerce.
Beyond these empirical and economic implications, the results speak to broader questions about time and society. Increasing shopping time efficiency reflects not only technological progress but also a shifting temporal orientation in everyday life, where speed and immediacy become important values shaping consumption practices. As shopping requires less time, it is increasingly reorganized as an instrumental, task-oriented activity. Rather than simply freeing time, efficiency may reallocate it toward other demands, reinforcing persistent feelings of time scarcity documented in contemporary societies.
Supplemental Material
sj-docx-1-tas-10.1177_0961463X261446692 - Supplemental material for Spending More Money in Less Time: The Evolution of Online Shopping Time Efficiency
Supplemental material, sj-docx-1-tas-10.1177_0961463X261446692 for Spending More Money in Less Time: The Evolution of Online Shopping Time Efficiency by Kun Liu, Subhrajit Guhathakurta, Chaeyeon Han, Eric Hittinger, Sinoun Phoung, and Eric Williams in Time & Society
Footnotes
Ethical approval and informed consent statements
This article does not contain any studies with human or animal participants.
Funding
The authors disclosed receipt of the following financial support for the research, authorship, and/or publication of this article: This work was supported by the Environmental Sustainability program of the U.S. National Science Foundation (Grant Number 2243099).
Declaration of conflicting interests
The authors declared no potential conflicts of interest with respect to the research, authorship, and/or publication of this article.
Data availability statement
All data generated or analyzed during this study are included in this published article and its supplementary information files.
Supplementary material
Statistical Evidence of Constant Average Total Shopping Time before the Advent of E-Commerce. Supplemental material for this article is available online.
References
Supplementary Material
Please find the following supplemental material available below.
For Open Access articles published under a Creative Commons License, all supplemental material carries the same license as the article it is associated with.
For non-Open Access articles published, all supplemental material carries a non-exclusive license, and permission requests for re-use of supplemental material or any part of supplemental material shall be sent directly to the copyright owner as specified in the copyright notice associated with the article.