
Abstract
In this paper, we propose a generalized functional linear regression model for a binary outcome indicating the presence/absence of a cardiac disease with multivariate functional data among the relevant predictors. In particular, the motivating aim is the analysis of electrocardiographic traces of patients whose pre-hospital electrocardiogram (ECG) has been sent to 118 Dispatch Center of Milan (the Italian free-toll number for emergencies) by life support personnel of the basic rescue units. The statistical analysis starts with a preprocessing of ECGs treated as multivariate functional data. The signals are reconstructed from noisy observations. The biological variability is then removed by a nonlinear registration procedure based on landmarks. Thus, in order to perform a data-driven dimensional reduction, a multivariate functional principal component analysis is carried out on the variance-covariance matrix of the reconstructed and registered ECGs and their first derivatives. We use the scores of the Principal Components decomposition as covariates in a generalized linear model to predict the presence of the disease in a new patient. Hence, a new semi-automatic diagnostic procedure is proposed to estimate the risk of infarction (in the case of interest, the probability of being affected by Left Bundle Brunch Block). The performance of this classification method is evaluated and compared with other methods proposed in literature. Finally, the robustness of the procedure is checked via leave-j-out techniques.
1 Introduction
The use of telemedicine systems in pre-hospital emergency rescues has allowed quicker diagnoses for patients with cardiovascular ischaemic diseases. The literature has shown that pre-hospital electrocardiogram (ECG) reduces treatment times and in-hospital mortality.1–3 It is also known that pre-hospital ECG may either be transmitted to the hospital staff or can be interpreted in real time by paramedics, who then communicate their diagnosis to the hospital.4,5
Starting from 2006, in the Milan urban area a working group collecting 23 Cardiology Units and the 118 Dispatch Center (the Italian free-toll number for emergencies), performed monthly data collections twice a year on all patients admitted to any hospital in Milano with coronary artery disease (MOMI 2 : MOnth MOnitoring Myocardial Infarction in MIlan survey). The statistical analysis of the collected data6–8 confirmed the time of first ECG teletransmission as the most important factor to guarantee a quick access to an effective treatment for patients. Since 2008, a project named PROMETEO (PROgetto sull’area Milanese Elettrocardiogrammi Teletrasferiti dall’Extra Ospedaliero) has been started with the aim of spreading the intensive use of ECG as pre-hospital diagnostic tool. The project is also a way of constructing a new database of ECGs with features never recorded before in any other data collection on heart diseases. Indeed, ECG recorders with GSM transmission have been installed on all Basic Rescue Units of Milan urban area, thanks to the partnerships of Azienda Regionale Emergenza Urgenza (AREU), Abbott Vascular and Mortara Rangoni Europe s.r.l.
The principal aim of this work is the development of a new semi-automatic diagnostic procedure for predicting the disease probability on the basis of the ECG morphology. Such a procedure can be implemented starting from the ECG signals generated by telemedicine equipment of the Basic Rescue Units.
A statistical identification of specific ECG patterns which could benefit by an early invasive approach has been performed on a sample of data arising from PROMETEO database. 9 In fact, the presence of a cardiac disease induces morphological changes in the ECG signals. Finding statistical tools capable of classifying curves using only these changes could support an early detection of coronary disease, not based on usual clinical criteria.
In order to do this, ECG traces are considered as a noisy multivariate functional data. 9 A real-time procedure has been tuned and tested, consisting of preliminary steps like signal reconstruction, wavelet denoizing and removing biological variability through data registration. Then a multivariate functional k-means has been considered, thus simultaneously clustering all eight leads of each patient. This classification procedure uses group centroids as reference signals. The technique proposed in Ieva et al. 9 allowed diagnoses to be consistent with clinical practice, starting from purely statistical considerations. Anyway, despite the attractiveness of this method, the estimation of the number of groups as well as their identification might not be straightforward.
In this work, we approach the problem in a different way: we aim at constructing and validating a statistical procedure to model the binary outcome of interest (i.e. the presence of cardiovascular acute ischaemic event) by means of suitable covariates (i.e. patient characteristics, whenever available) and of multivariate functional predictors (i.e. the ECG signals and the corresponding derivatives, available for each patient). In particular, we focus on estimating the probability of each patient to belong to the Left Bundle Branch Block (LBBB) group. This can be done by using as predictors the eight-leads ECG trace of each patient and its first derivative, which are inserted in a suitable generalized functional linear model. Specifically, following for example Berrendero et al. 10 , James, 11 Ratcliffe et al., 12 Escabias et al., 13 Müller and Stadtmüller 14 and Zhu and Cox, 15 we perform a dimensionality reduction by a multivariate functional principal component analysis (see Ramsay and Silverman 16 ). It consists of summarizing the information carried out by the covariance operators of the signals and their first derivatives by the corresponding scores and obtaining projecting data and derivatives on the corresponding Karhunen–Loève bases. Then we introduce the scores into a generalized linear model where the response is the Bernoulli variable indicating the presence of LBBB, performing a model selection inspired by the work of Escabias et al. 17 We then discuss the classification of patients resulting from the procedure described above and propose a comparison with results obtained by other classification methods dealing with suitable dimensional reduction of functional data.18,19 We also study the robustness of the procedure via leave-j-out techniques. In fact, one of the main aims of the work is to propose a method for identifying a suitable and reliable basis to be used for projecting a new data and making a real-time prediction of the corresponding risk of disease.
The paper is structured as follows: Section 2 contains the theoretical framework of the multivariate functional principal component analysis we adopt for carrying out dimensional reduction of the multivariate functional data (2.1) and the corresponding first derivatives (2.2). These steps are performed in order to input relevant components in a generalized linear model for risk prediction of the presence of disease (Section 2.3). In Section 3, the analysis of ECG data arising from PROMETEO dataset is presented, together with the leave-j-out analysis. Finally, in Section 4, conclusions are drawn and further developments are discussed. All the analyses are carried out using R statistical software. 20
2 Models and methods
A common strategy to deal with complex or high-dimensional data is to perform a dimensional reduction. 16 In the motivating example described here, the eight-leads ECG signal of each patient (a multivariate functional curve) is considered as a predictor of the presence of LBBB. Thus we deal with the dimensional reduction of such data and their first derivatives in order to input them in a generalized linear model for predicting the risk of LBBB.
2.1 Multivariate functional principal component analysis
Within the functional setting, principal component analysis also provides a way of looking at covariance structure of data that can be much more informative and can complement, or even replace altogether, a direct examination of the variance-covariance function, as detailed in Ramsay and Silverman. 16
Let  , for each

is the mean function of  of
of
The kernel

where ⊗ is an outer product in
In what follows, the model formulation is already intended for the application of interest, where the ECG of each patient
So let
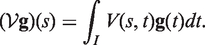
Consider the usual scalar product between two elements
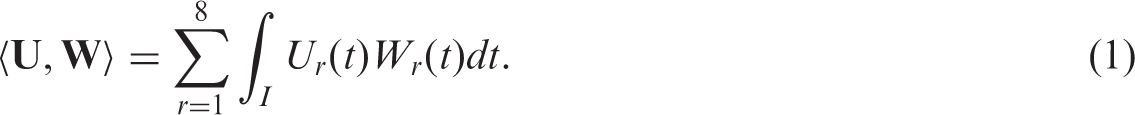
Call
The eight-leads ECGs
In the analysis of data, as literature advises, we deal with centred and scaled data, i.e.
2.2 Derivatives refinements
The problem with discrete and noisy observations is amplified when the data derivatives are taken into account. In our case, since the information on the presence of the disease is carried out not only by morphological changes we observe on the signals but also on their first derivatives, it is even more necessary to smooth data in a suitable way. In fact, the smoothing procedure is essential not only for an accurate reconstruction of data but also for a proper estimate of their derivatives (see Ieva et al. 9 for a discussion of such arguments and comparison of different derivatives computations). Moreover, since the eight ECG leads of interest (I, II, V1, V2, V3, V4, V5 and V6) jointly describe the complex heart dynamics, the smoothing technique should take into account simultaneously all the components of the multivariate functional data (i.e. the leads).
Among possible smoothing methods, wavelets based ones seem suitable for smoothing our data because every basis function is localized both in time and in frequency and is therefore able to capture strongly localized ECG features (peaks, oscillations,…). The procedure proposed in Pigoli and Sangalli 21 can take into account the multi-dimensionality of the data, obtaining smoothed estimates of the eight-dimensional curves of the ECGs. In the case presented below, a Daubechies wavelet basis with 10 vanishing moments is used. This basis is smooth enough to allow the computation of the first derivative of the estimated functional data, too. In fact, the smoothing procedure is essential for an accurate derivative reconstruction as well. Wavelet methods have the advantage of providing an estimate of the curves derivatives, which is straightforward when functional reconstruction is obtained via a basis expansion. Indeed, each derivative can be obtained simply by a linear combination of the corresponding basis function derivatives.
Once we get the smoothed data and derivatives, we carry out the same dimensionality reduction proposed in Section 2.1 also on the covariance operator of the first derivatives. This enables to take into account also the variability of the first derivatives when modelling the risk prediction. In so doing, we really take advantage of the functional nature of data.
2.3 Generalized regression with multivariate functional predictors
We now consider a logistic regression model, where the response variable is

The model is then reduced to a classical logistic regression model in which the unknowns are represented by the parameters
3 An application to ECG signals
In Ieva et al., 9 a statistical framework has been proposed for the analysis and classification of ECG curves starting from the modification of morphology induced by the presence of disease. The main goal of that paper is to identify specific ECG patterns which could benefit from an early invasive approach. In fact, the identification of statistical tools capable of classifying curves using only the modifications in shape induced by the presence of disease could support an early detection of heart failures.
The basic statistical unit is the eight-variate function (the ECG) which describes the heart dynamics of each patient on the eight leads I, II, V1, V2, V3, V4, V5 and V6, together with the corresponding derivatives. Here, the outcome we consider is the group label, indicating the presence of the disease. It is modelled by a Bernoulli random variable Yi, which takes value 1 if LBBB is diagnosed, and 0 if the trace is physiological. As mentioned before, in this work, we analyse ECG traces from PROMETEO datawarehouse. Each file contained in PROMETEO can be associated to three sub-files. The first is called Details and consists of technical information, useful for signal processing and analysis. More precisely, it includes waves repolarization and depolarization times, landmarks indicating onset and offset times of the main ECG’s subintervals and an automatic diagnosis, established by the commercial Mortara-Rangoni VERITAS™ algorithm. We used these automatic diagnoses to label the ECG traces we analysed. The second sub-file is called Rhythm and contains the output of an ECG recorder. Specifically, it registers 10 s (10,000 sampled points) of the ECG signal. The third file is called Median. It is built from the Rhythm file and depicts a reference beat lasting 1.2 s on a grid of 1200 points. We carried out the analysis using only the Median files, i.e. using eight curves (one for each ECG lead) for each patient, representing patient’s ‘Median’ beat for that lead. This representative heartbeat is a trace of a single cardiac cycle (heartbeat), i.e. of a P wave, a QRS complex, a T wave and a U wave, which are normally visible in 50–75% of ECGs.
The sample we analyse consists of the ECG signals of
The novelty of the analysis presented here is to set up a generalized linear model able to discriminate between pathological and physiological traces, explaining the disease probability by means of multivariate functional predictors, i.e. ECG signals and their first derivatives. The contribution of the multivariate curves is summarized through the dimensional reduction carried out by multivariate functional principal component analysis of the covariance operators of signals and signals’ first derivatives proposed in Sections 2.1 and 2.2, in order to take advantage of the functional nature of the data.
In practice, we deal with a noisy and discrete observation of the function describing the ECG trace of each patient. We use the wavelet based smoothing technique for multivariate curves proposed in Pigoli and Sangalli
21
to obtain the smoothed estimates of eight-dimensional ECG signals and their first derivatives. Moreover, since each patient has her/his own ‘biological’ time, the same event of the heart dynamics may happen at different times for different patients. Since the morphological change due to this difference is misleading from a statistical perspective, we need to register data. It is well known that a correct separation between the different kinds of variability is necessary for a successful analysis.
16
In particular, as detailed in Ieva et al.,
9
we adopt a registration procedure based on landmarks, which are points of the curve that can be associated with a specific biological time. Five of these landmarks (Ponset, QRSonset, QRSoffset, Tonset and Toffset) are provided by Mortara-Rangoni procedure. They identify, for each patient
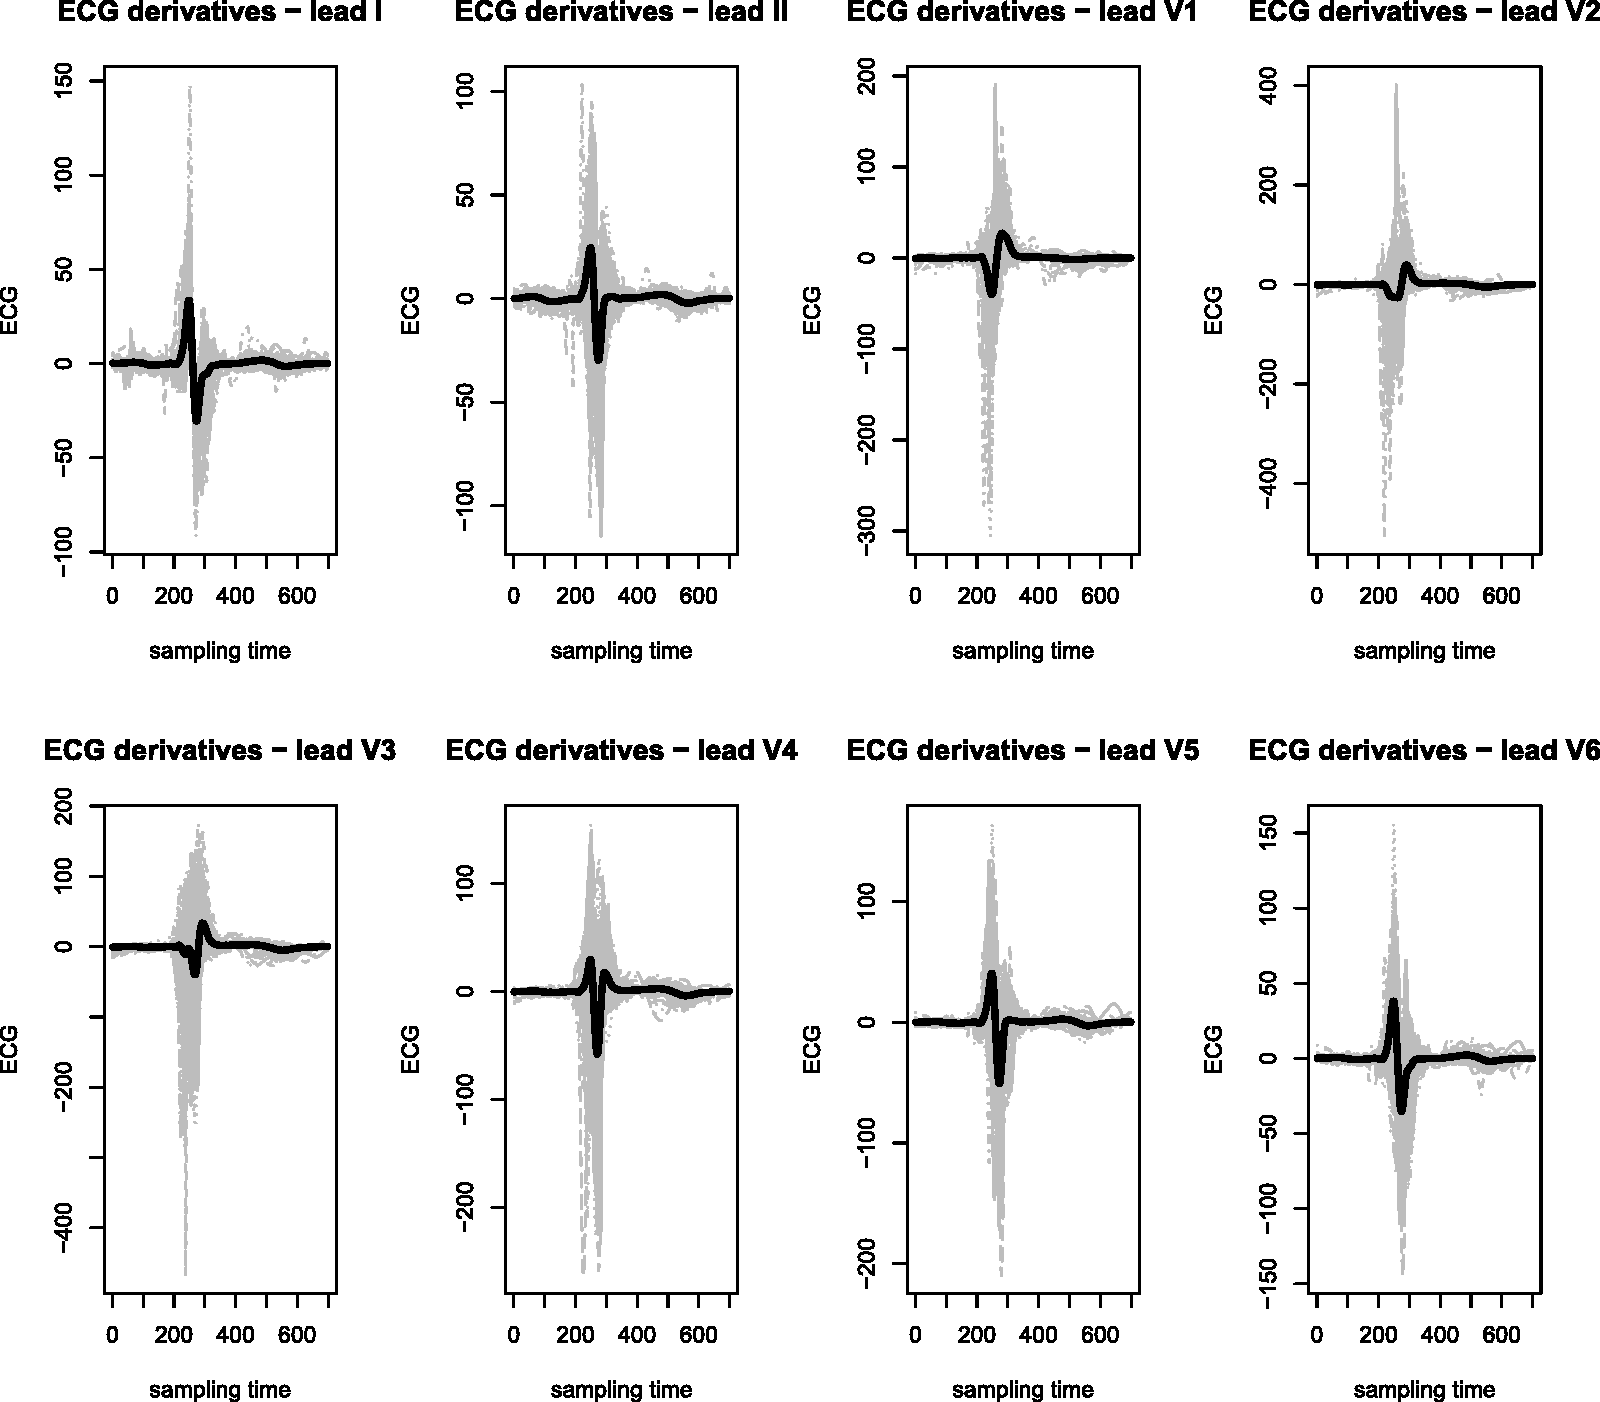
Figure 1 shows denoized and registered data we consider for our analysis. The black solid lines represent the mean functions. Figure 2 shows the corresponding first derivatives. Again the black solid lines represent the mean functions.
Denoized and registered data (eight leads) for the 149 patients with superimposed the mean functions (black solid lines). First derivatives (eight leads) for the 149 patients with superimposed the mean functions (black solid lines).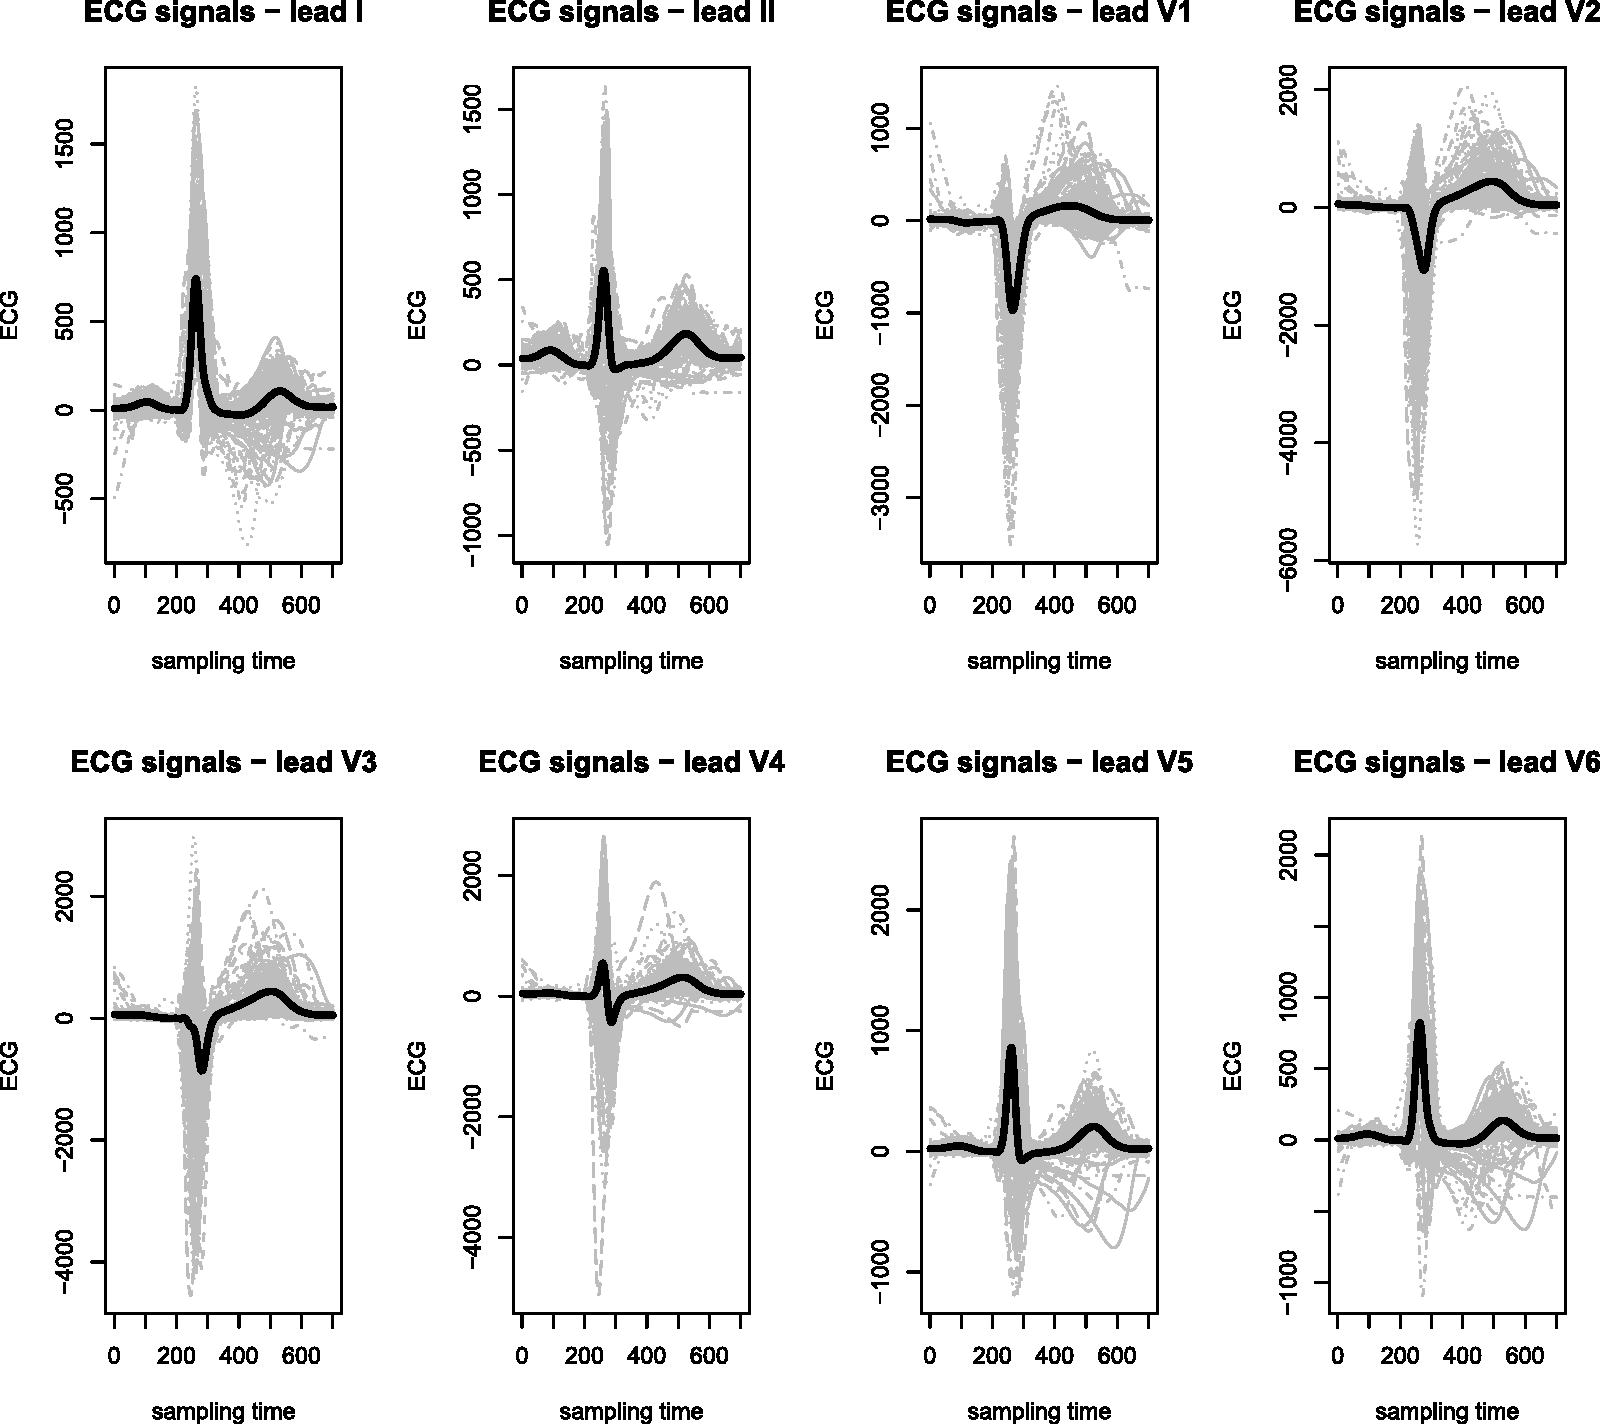
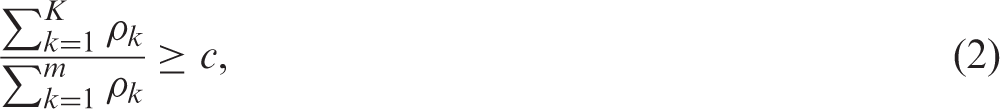
We shall now select the components of the multivariate functional principal component to be considered in the subsequent analysis, both for ECG signals and their first derivatives. In both cases, we choose the first K and Kd components of data and derivative’s basis, respectively, such that their associated eigenvalues explain a proportion of variance equal to 70%.
Among these, we retained only the first principal components, using the corresponding scores as covariates. The scores are computed projecting data and first derivative on the first elements of the corresponding multivariate functional principal component basis. We retained only the first multivariate functional principal component for two reasons:
both a stepwise selection based on the Akaike Information Criterion (AIC) as well as a Brier’s score minimization criterion selected the scores on the first and tenth components as the significant ones to explain the disease probability but it is known that the efficiency of the estimates of the eigenfunctions and of the corresponding scores is decreasing with respect to the index of eigenfunctions. Distributions of first principal components scores, stratified by the presence of disease, for the data (left panel) and the first derivatives (right panel).
The conditional likelihood ratio test to choose between nested models with functional covariates, proposed in Escabias et al.
17
, shows a high statistical evidence (p 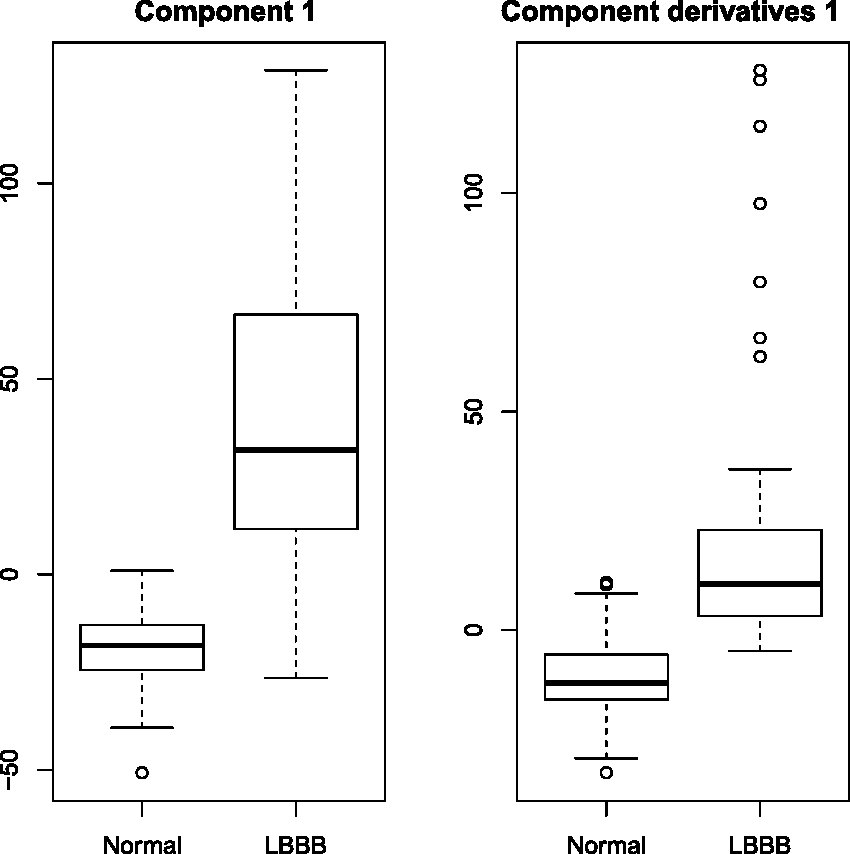
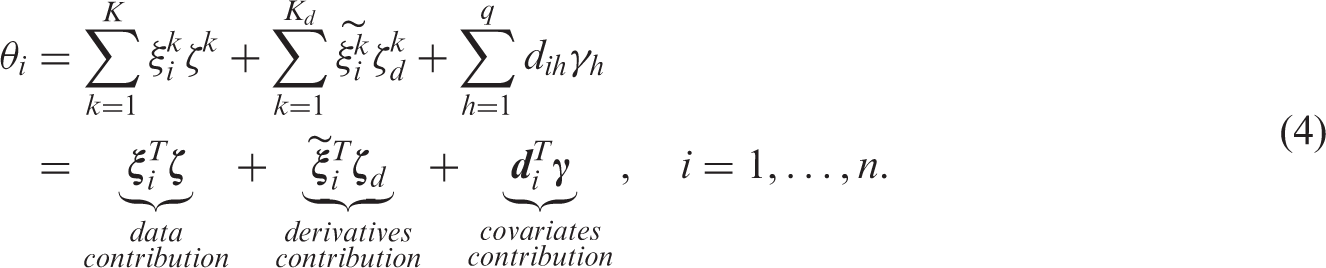
Thus we fitted the following logistic regression model: for

Estimates, standard errors and p values for the parameters of the logistic model.
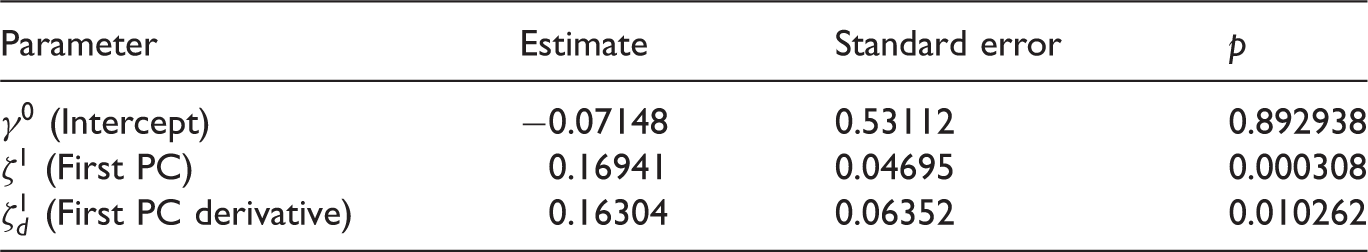
Figure 4 shows the first multivariate functional principal component of the data. Sample means of each lead are plotted (solid lines), together with two curves obtained by adding (+) and subtracting (−) a suitable multiple C of the principal component. As suggested in Ramsay and Silverman,
16
we set C as 0.2 times the root-mean-square difference between the estimated mean First multivariate functional principal component.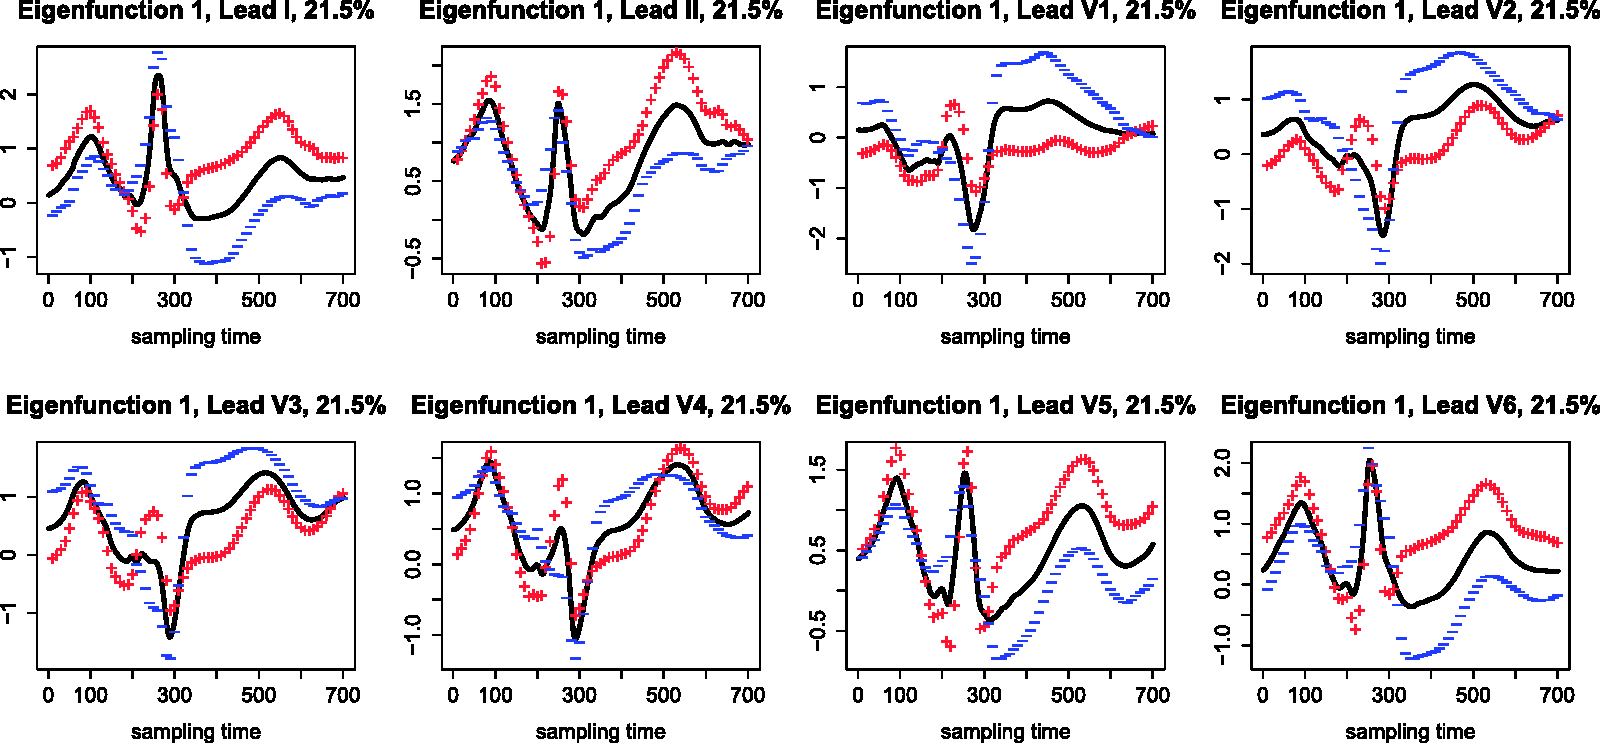
Confusion matrix.

LBBB: Left Bundle Branch Block.
Moreover following James and Hastie, 18 we performed a two-means classification of the scores arising from projecting both data and derivatives on the corresponding first principal components, and a linear discriminant analysis as suggested in Wouters et al. 19 The results in terms of false-positive rate provided by these procedures are much worse than those obtained with the procedure we propose in this paper. In fact, although the false-negative rate is zero in both the cases, the false-positive rate is 48% in the two-means clustering analysis and 29% for the Linear Discriminant Analysis (LDA) procedure. The corresponding correct classification rates are 84.6% and 90.6%, respectively.
All the results indicate that the model can be considered a good classifier, providing reasonable performances, especially with respect to the benchmark of physicians practice in diagnosing LBBB.
Finally, we computed the mean cross validation (CV) error of the logistic model for testing its goodness of fit, obtaining a mean CV error equal to 3.6%.
We propose this method as an automatic diagnostic tool to predict the risk also for new patients entering the study. In fact, one of the most innovative aspects of the proposed methodology is the idea of computing off-line a basis to be used in an on-line procedure of risk prediction. Specifically, the off-line step consists of performing the multivariate functional principal component analysis on a given database of ECGs, then fitting a logistic regression model like equation (4) and obtaining the estimation of the coefficients and the number of basis components to be retained for prediction. Then, in the on-line step, for a new patient to be diagnosed we projects her/his ECG on the basis previously pointed out, in order to get a real-time computation of the scores corresponding to the new data and its first derivative, and the estimated probability of disease.
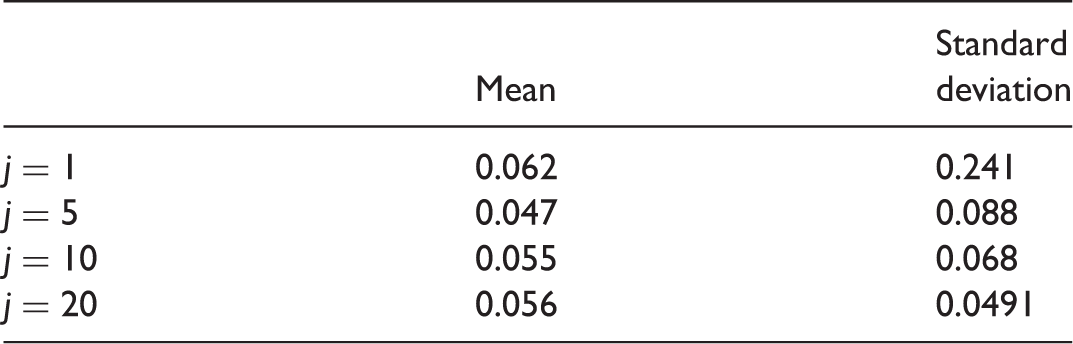
In order to do this, we need to check the robustness of the basis to be used for the off-line estimation. According to the framework detailed above, we did it through a leave-j-out study. The procedure can be summarized as follows:
– step 1 choose a random subsample of j patients ( – step 2 carry out the multivariate functional principal component analysis on the remaining n–j patients; – step 3 fit the logistic model for obtaining coefficients estimates and the number of basis components to be retained, both for data and derivatives; – step 4 projected the j chosen ECGs on the basis pointed out in step 2, getting the real-time computation of the scores corresponding to the new j data and their first derivatives, and the corresponding estimated probability of disease. Mean and standard deviation of actual error rate.
We repeated the experiment 500 times. The mean actual error rate (AER) over the 500 simulations and their corresponding standard deviation are reported in Table 3.
In general, the idea is the following: once a reliable and representative dataset of N ECGs is given according to clinical best practice, the procedure we propose computes the off-line step described above on the N multivariate curves, selecting a suitable number of components for data and first derivatives basis and providing the coefficients for the generalized regression model. Therefore, when new patients enter the study, the semi-automatic diagnosis tool projects their ECGs on eigenfunctions selected in the off-line basis and plugs in the scores estimates as predictors in the logistic model for estimating then LBBB risk.
4 Conclusions
In this paper, we propose a generalized functional linear regression model for a binary outcome indicating the presence/absence of a cardiac disease, with a multivariate functional data among the relevant predictors. This is an example of data which must be treated in the multivariate functional context. Such a framework, despite its evident interest, is quite rarely treated in statistical literature.
The principal aim of this work is then the development of a new semi-automatic diagnostic procedure for risk prediction based on the ECG signals generated by telemedicine equipment of the Basic Rescue Units. In fact, we set up a framework for carrying out semi-automatic diagnosis of LBBB, starting from the statistical analysis of the sole curve morphology. The method we propose is then aimed at supporting decisions rescuers. It is aimed at identifying specific ECG patterns which could benefit by an early invasive approach, performing a real-time diagnosis.
In particular, we focus on estimating the probability to belong to LBBB group, using as predictor the eight-leads ECG trace of each patient and its first derivative, which are inserted in a suitable generalized functional regression model. Specifically, we perform a dimensionality reduction by a multivariate functional principal component analysis, summarizing the information carried out by the covariance operators of the signals and their first derivatives by the corresponding scores and obtaining projecting data and derivatives on the corresponding Karhunen–Loéve bases. Then we introduce the scores into a generalized linear regression model where the response is the Bernoulli variable indicating the presence of LBBB. We finally carry out the classification of patients and we check the robustness of our method. To this aim, we are trying to robustify the estimation method for regression parameters through the use of a wider dataset of numerically simulated ECGs.
The innovative aspect of this paper lies in developing advanced statistical methods aimed at detecting pathological ECG traces (in particular, LBBB), starting only from morphological features of the curves. This methodology enables diagnoses that are consistent with clinical practice, starting from purely statistical considerations. Further extensions of this work consist in enlarging the spectrum of acute cardiovascular diseases.
Footnotes
Acknowledgements
This work is part of PROMETEO (PROgetto sull’area Milanese Elettrocardiogrammi Teletrasferiti dall’Extra Ospedaliero). Data are provided by Mortara Rangoni Europe s.r.l.. The authors wish to thank 118 Dispatch Centre of Milan and Professor Maurizio Grasselli of Politecnico di Milano for stimulating discussions that gave us the impetus to improve the original version of the paper.
Declaration of conflicting interests
The author(s) declared no potential conflicts of interest with respect to the research, authorship, and/or publication of this article.
Funding
The author(s) received no financial support for the research, authorship, and/or publication of this article.