For either the equivalence trial or the non-inferiority trial with survivor outcomes from two treatment groups, the most popular testing procedure is the extension (e.g., Wellek, A log-rank test for equivalence of two survivor functions, Biometrics, 1993; 49: 877–881) of log-rank based test under proportional hazards model. We show that the actual type I error rate for the popular procedure of Wellek is higher than the intended nominal rate when survival responses from two treatment arms satisfy the proportional odds survival model. When the true model is proportional odds survival model, we show that the hypothesis of equivalence of two survival functions can be formulated as a statistical hypothesis involving only the survival odds ratio parameter. We further show that our new equivalence test, formulation, and related procedures are applicable even in the presence of additional covariates beyond treatment arms, and the associated equivalence test procedures have correct type I error rates under the proportional hazards model as well as the proportional odds survival model. These results show that use of our test will be a safer statistical practice for equivalence trials of survival responses than the commonly used log-rank based tests.
Clinical trials for determining equivalence of a new treatment with a standard treatment of proven efficacy have become increasingly commonplace in recent years. With growing financial and ethical pressures1 to switch from an expensive and invasive standard treatment/procedure to a cheaper and less-invasive treatment, we can expect an increasingly higher number of equivalence trials to be conducted in future years. Our paper deals with the important concern about the validity of the conclusions from equivalence studies when the key modeling assumptions of the test is violated. Statistical methods used for equivalence trial for survival response are often based on methods of Wellek2 using the proportional hazards model (PHM) of Cox.3 The reason behind the popularity of this method for equivalence trial is given below. One main challenge for developing a convenient hypothesis testing method for an equivalence trial is the formulation of the statistical hypothesis using only the parameter of the treatment effect. For a two-arm (placebo vs. treatment) superiority trial under any semi-parametric model (e.g., the PHM of Cox3), it is straightforward to make a statistical/mathematical formulation of the alternative hypothesis Ha (clinically important difference) of scientific interest. Any difference in the regression parameter η of the treatment arm implies some difference in survival curves S1 and S0 from two different arms at least at one time point t, and the converse is also true. For example, when two treatment arms follow PHM (PHM of Cox3) with hazard ratio η, the alternative hypothesis Ha: for some t, implies : 1 and vice versa. However, for an equivalence trial, when the alternative Ha is being within the prespecified range of equivalence for every time point t (to be explained later), it is not straightforward to express this Ha as a statistical hypothesis involving only the regression parameter η (which is free of time t). For example, in Cox’s PHM, it is not obvious that less than a small known constant for all t does imply that η is within a known interval. Wellek2 paved the way for a convenient log-rank based equivalence test by deriving this result for the PHM, and only for the case of no covariates beyond treatment arms. Our result, an extension of the result of Wellek2 to the case of proportional odds survival model (POSM), allows us to formulate an equivalence test for the POSM based on a rejection region which only involves the estimate and the corresponding standard error of the treatment effect parameter. Please see Wellek4 (section 6.7) for a thorough review of the justifications behind formulating statistical hypothesis of equivalence based on the treatment effect parameter.
Due to Wellek2 results, the existing literature on equivalence trials for survival responses is dominated by the log-rank test based on the assumption of a PHM for the two treatment arms, without any consideration for alternative semi-parametric models and the presence of other covariates. The non-parametric procedures of Com-Nogue et al.5 and others often require much higher sample sizes than tests based on semi-parametric models. In practice, often the hazard functions of two treatment arms are not proportional over time and there may be other covariates in addition to treatment arms. We show that a log-rank based test of equivalence has a higher than intended type I error rate when treatment arms do not follow the PHM. This points to the practical need to consider new equivalence tests based on other semi-parametric models. For example, the ratio of two hazards may converge towards one over time when the initial benefit of one treatment arm over the other treatment arm diminishes over time. In this situation, the POSM of Bennett6 will be more appropriate than a PHM. In this paper, we also show that a POSM-based equivalence test has correct type I error even when the true model is either POSM or PHM. This shows that the POSM-based equivalence test is a safer option in practice compared to the log-rank based test, especially when the underlying modeling assumption is under suspicion.
We place high emphasis on controlling the type I error rate for an equivalence trial because, unlike a superiority trial, an effective standard treatment already exists for an equivalence trial. Wrongly accepting the alternative Ha of equivalence can potentially replace an effective standard treatment with an ineffective treatment in the market. Whereas, even if we wrongly accept the null of non-equivalence, i.e., do not accept the new treatment as equivalent, we will still have the effective standard treatment available in the market. In this case, wrongly rejecting the null is a more serious mistake than wrongly accepting the null. However, we first deal with a major impediment for developing an equivalence test for a POSM. The clinicians and other non-statisticians have understandable difficulty in defining the clinically important difference between the two treatment arms in terms of the ratio of two survival odds. On the contrary, most clinical experts and researchers are comparatively more at ease to express the clinical equivalence of two treatment arms in terms of a clinically important difference between two survival functions. The development of equivalence trial methodology for POSM depends on whether the alternative hypothesis of the equivalence of two survival curves (or two hazard curves) can be properly expressed as an alternative hypothesis in the regression parameter of the POSM.
In Section 2, we first derive the formulation of the alternative statistical hypothesis, , that only uses the odds ratio of the POSM, such that also corresponds to the scientific (clinical) hypothesis related to the “equivalence” of the survival functions of two treatment arms. In section 3, we describe the statistical methods including rejection regions for two-sample and one-sample equivalence studies under POSM. In section 4, we show that even in the presence of additional covariates, testing equivalence of the survival functions for two treatment arms is the same as statistically testing the survival odds ratio parameter to be within a small interval. This result allows us to develop the statistical test of equivalence of two treatments under POSM, even in the presence of additional covariates. In section 5, we study the relationship between sample size and intended type I error rates with tests based on Cox’s model and our new POSM-based tests. Our theoretical and simulation studies show that when the POSM assumption is true for the trial in question, log-rank based equivalence test of Wellek2 tends to reject the correct null hypothesis more often than the desired level of significance. On the contrary, our POSM-based equivalence tests achieve desired type I error rates and power when the true model is either POSM or Cox’s model.
2 Formulation of hypothesis under POSM
For the time being, we consider no covariate other than treatment arm. We later extend our methods to include other covariates. The POSM of Bennett6 assumes
for all time points , where θ is the time-constant survival odds ratio between new treatment and standard treatment, with corresponding survival functions and , respectively. For example, one may consider two treatments are clinically equivalent if , the difference between two survival functions, is smaller than a predetermined equivalence level δ over time. Thus, two treatment arms are equivalent only when for all t. Here, the additional quantity indicates the maximum clinical difference allowed between the standard therapy and a therapeutically equivalent experimental therapy. The value of δ is usually determined by clinical experts and regulatory agencies involved in determining the practical definition of the equivalence of two treatments under consideration. However, in order to implement a statistical test for the equivalence of two treatments under POSM of (2.1), the alternative statistical hypothesis must be based on a range (interval) of θ, where the interval depends on the practical (clinical) meaning of the equivalence of two survival curves and . Furthermore, it is difficult for clinicians and non-statisticians to express the therapeutic equivalence in terms of a prespecified range of θ, because θ is a ratio of odds, unlike difference in probabilities of any observable event under two treatment arms. To facilitate the formulation of a statistical hypothesis testing procedure for evaluating the clinical (scientific) alternative hypothesis Ha: for all t, under POSM of (2.1), we develop the following theorem.
Theorem 1
Under POSM of (2.1) with continuous , testing Ha: : , where is a known function of δ.
Theorem 1 (proof in the Appendix 1) shows that under the POSM of (2.1), if the clinicians and practitioners can specify the maximum allowable difference δ between two survival functions and of two equivalent treatment arms, we can derive the corresponding statistical alternative hypothesis based on the time-constant survival odds ratio θ. This can now be tested using statistical hypothesis testing tools.
Many authors including Rothman et al.7 advocated testing the equivalence of two treatments using the hazard ratio, because the hazard ratio of Cox’s model does not depend on the baseline population. The hazard ratio is also the popular parameter for comparing treatments in efficacy trials (at least in the field of oncology). One may specify the alternative (scientific) hypothesis Ha of equivalence of the two treatment arms via Ha: for all time points , where and are hazard functions for new and standard treatments, respectively. Similar to δ for Theorem 1, the maximum allowable hazard ratio for two clinically equivalent treatments is determined from a clinical perspective. To expedite the equivalence trial under POSM of (2.1) for Ha based on hazards ratio, we have the following theorem (proof is again in the Appendix 2).
Theorem 2
Under the POSM assumption of (2.1), the alternative hypothesis of interest Ha: for all t, is the same as testing : .
We note that the here is identical to the of Theorem 1 with replaced by ρ. This indicates that for POSM of (2.1), the formulation of the statistical hypothesis is the same while testing the equivalence of two treatment arms based on either the maximum hazards ratio over time or the maximum difference of the survival functions over time. Both of these alternative hypothesis can be reduced to testing the statistical hypothesis involving only time constant parameter θ in (2.1). In the next section, we present the statistical tests and corresponding critical regions for this hypothesis for two cases—the two-sample case when the baseline survival function of standard treatment is unknown and the one-sample case when is known from historical data.
3 Implementation of equivalence tests
First we discuss the statistical tests for the equivalence of two treatment arms under the POSM of (2.1) when n patients are randomized to two treatment arms with when patient i receives the new treatment, and when she/he receives the standard treatment. We denote the observed right-censored data as , where and observed censoring indicators where Yi is the observed survival when and Yi is the right-censoring time when . Survival time Ti is at risk of non-informative random right censoring. In practice, the decision about therapeutic equivalence of two treatment arms will be based on testing H0: for some time point t, versus Ha: for all . From Theorem 1 and (2.1), we know that testing this hypothesis is equivalent to testing
where and log(θ) in (2.1). Due to the formulation of this statistical equivalence test based solely on parameter β of POSM, we can use the test statistic of a superiority test under POSM as the test statistic for testing (3.1). However, the new test for (3.1) has a different rejection region.
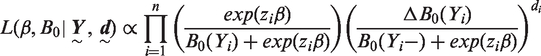
One option is to use the semi-parametric Maximum likelihood estimator (SPMLE) of Murphy et al.,8 obtained via maximizing the following semi-parametric likelihood
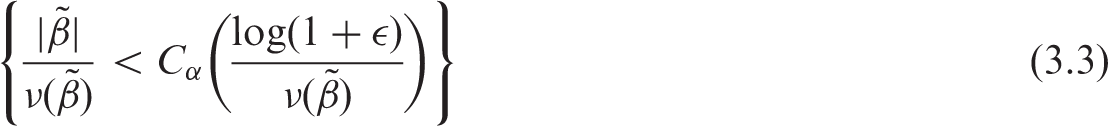
where the baseline odds function is a non-decreasing, right continuous function and with jumps at the observed failure times. The rejection region of the large sample based asymptotically most powerful test for (3.1) is given as
where the is the αth quantile of a distribution with and non-centrality parameter . Numerical differentiation of the profile likelihood is used to obtain
An alternative semi-parametric approach for testing (3.1) is to use the test statistic of Chen et al.,9 based on the estimator obtained via iteratively solving a set of estimating equations. The iterative steps are outlined in Appendix 3. Using the test statistic of Chen et al.,9 we can similarly derive the rejection region for testing (3.1) as
where is the αth quantile of a with and non-centrality parameter . This approach avoids the high-dimensional numerical maximization and the estimator of the asymptotic variance of has a closed-form expression. We omit the closed form expression of (given in Chen et al.9) for the sake of brevity. Although the estimator is not the most efficient estimator, the efficiency loss is typically small.
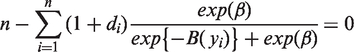
In many equivalence trials, particularly in oncology, for all practical purposes, we may know the baseline survival of the standard treatment. In particular, there often exists a considerable amount of historical data on the survival function of the standard treatment because its efficacy has been already studied. In this situation, every patient with observed survival data Yi and censoring indicator di for receives the new treatment. We note that the logic and the result of Theorem 1 still apply here, and the hypothesis of equivalence of two treatments is again reduced to the hypothesis of (3.1). Since is known, we can find the MLE of β by solving the score equation
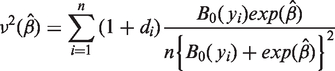
where is known. Using the usual asymptotic theory, the large-sample rejection region is , where is the same as in (3.3) and the estimated variance has the closed form expression
The computer codes for computing the test statistic of (3.2) and corresponding critical region of (3.3) are available from the authors upon request. The authors also have codes for the competing test statistic and critical region of Wellek.2
4 Extension to include other covariates
We now extend our previously described procedure of equivalence tests to accommodate even other covariates , in addition to treatment arm indicator zi. Even though it is very much conceivable to have additional covariates in practice, we have not yet come across any previous research on equivalence tests to accommodate additional covariates. We assume that the underlying model with additional covariate is a natural extension of the POSM of (2.1) with
where is the regression parameter of and θ is again the treatment effect of interest. For this situation, the relevant clinical hypothesis of interest is for all covariates and for all . Similar to the statement of Theorem 1, we can show that Ha for this case is equivalent to testing the statistical hypothesis , where (proof omitted). It is important to note that does not depend on either γ or . This result shows that for survival response with the POSM assumption, the hypothesis of equivalence of two patients with the same covariate but from different treatment arms is the same as testing the statistical hypothesis . This result allows us to extend the formulation of the statistical hypothesis of equivalence in Theorem 1 to the equivalence studies under POSM with additional covariates . However, the test statistic and corresponding critical region are now different from those used for equivalence tests with no covariates. The new test statistic, its corresponding critical region, and associated computational steps are given in the Appendix 4.
5 Error rates of tests
Since the properties of our equivalence testing procedures do not depend on additional covariates , for the sake of simplicity, we do not include covariate for our theoretical and simulation studies to compare the error rates of competing procedures. In this section, we first theoretically show inflation of type I error rate of the PHM-based test when true model is POSM. After that, we also perform simulation studies to study the finite sample properties (type I error and power) of both the POSM-based tests and the log-rank based tests under correctly and incorrectly specified models.
In practice, the most frequently used semi-parametric procedure for testing the equivalence (e.g., Wellek2) is via a log-rank based statistic under the assumption of the PHM of Cox3
where is the baseline hazard and is the hazards ratio of the two treatment arms under the PHM. In spite of substantial literature on the robustness of a log-rank statistic based on the PHM of (5.1) for superiority tests, there is not much research studying the effect of wrongly using a log-rank based test statistic for an equivalence hypothesis when the true underlying model is not of (5.1). We examine the type I error rate for wrongly using a log-rank based equivalence test when the true underlying model is the POSM of (2.1) with true value of β as . This implies that two treatment arms following the POSM of (2.1) have the maximum difference of δ between their survival curves. If we wrongly use a log-rank based equivalence test with the same δ, we actually use a test based on the partial likelihood estimate of Cox.3 In this case, the asymptotic density of is not centered around true parameter value of model (2.1). Instead, Lin and Wei10 showed that follows an asymptotic normal distribution with mean 0 and variance , where is the unique solution of the equation
and where n0 and n1 are the sample sizes for the standard treatment and new treatment respectively. Here, is the estimated standard error of obtained from Cox.3 When the sample sizes n0 and n1 in the two treatment arms increase to , we can show that the center of the asymptotic distribution of η is , where satisfies (the proof is in the Appendix 5). Since the rejection region for the log-rank based test is
the necessary condition for controlling the type I error rate within 0.05 for large sample size is . Under the null hypothesis H0, as sample sizes become sufficiently large and goes below , the type I error rate for a log-rank based test becomes greater than 0.05, the intended type I error rate of the test. Below, we also show, via simulation studies, the approximate levels of inflation of the type I error rate for finite sample sizes if we wrongly use a log-rank based test when the true model is POSM of (2.1) with true regression parameter .
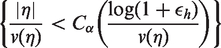
Our simulation studies with underlying POSM use a log normal baseline survival function with mean and variance , and an exponential censoring distribution with mean 50. The test statistics for the log-rank and POSM-based tests were calculated in Matlab. We take the maximum allowable difference in survival curves between two equivalent treatments as , the same used by Wellek.2 Using Theorem 1, we get the corresponding , the cut-off for the equivalence test based on POSM. Each entry gives the fraction of times out of 1000 replications of simulated data sets for which the test statistic falls in the critical region of (3.2) with (that is ). The columns for and 0.10 represent the approximate powers of the tests. The rest of the columns represent the type I error rates (sizes) of the tests at different . Table 1 shows the approximate powers and sizes using the POSM test, it appears to be below the nominal significance level of 0.05.
For different values of maximum difference in survival curves , the Pr(Rejecting H0) for using POSM-based test when the true model is POSM (sample for ).
Sample size
Power
Type I error rate
m = 0
m = 0.10
m = 0.15
m = 0.20
m = 0.30
50
0.114
0.072
0.049
0.030
0.006
100
0.210
0.115
0.050
0.010
0.000
150
0.378
0.154
0.050
0.012
0.000
200
0.598
0.200
0.055
0.007
0.000
400
0.930
0.308
0.044
0.004
0.000
POSM: proportional odds survival model.
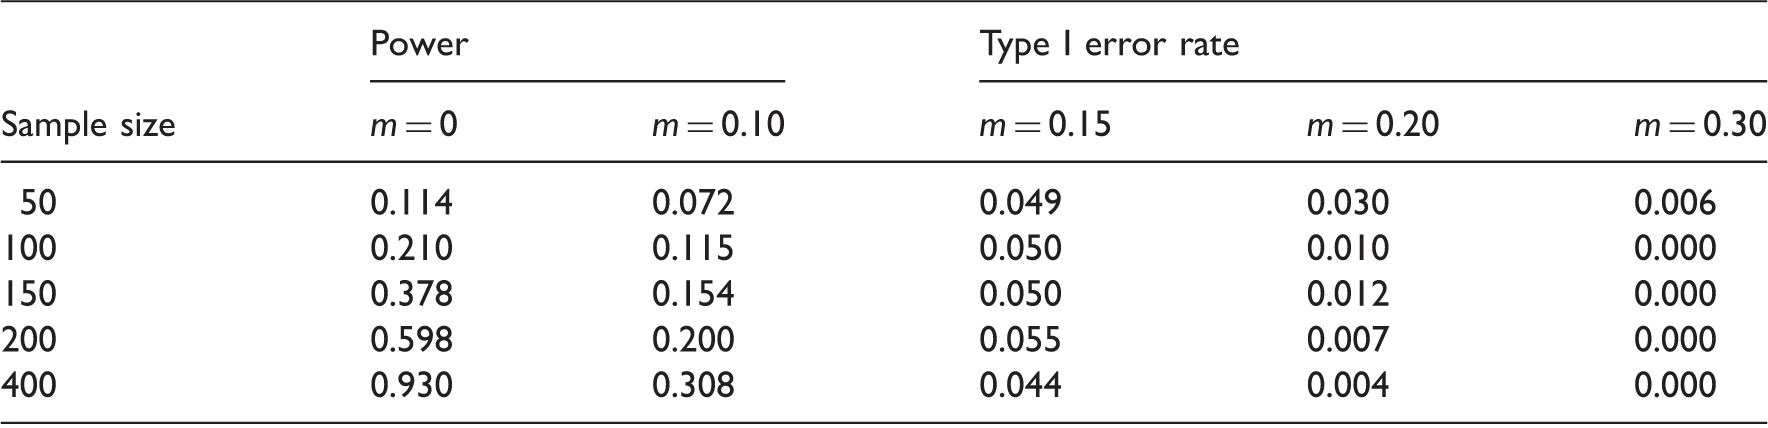
Table 2 summarizes the approximate powers and sizes for (wrongly) using the log-rank test proposed by Com-Nougue et al.5 and Wellek2 for equivalence using the same 1000 replicate data sets simulated from the POSM models. We use the rejection region of Wellek,2 with intended test size 0.05 and the maximum difference in survival curves as the margin of equivalence (same as Table 1). Each entry gives the fraction of replications for which the test statistic falls in the critical region of Wellek2 for . The simulation results show that the type I error rates at the boundary of the null H0 of the log-rank based tests are greater than 0.05 when the true model is POSM. The difference between the actual (estimated) size type I error rate and the intended probability of type I error (5%) increases as the sample size increases. This indicates that when we wrongly use a log-rank based test, the probability of accepting the alternative that the two treatments are equivalent even when they are actually different from each other (null is true) is higher than the intended level of significance of the test.
For different values of maximum difference in survival curves , Pr(Rejecting H0) for using log-rank based test when the true model is POSM (sample size = for ).
Sample size
Power
Type I error rate
m = 0
m = 0.10
m = 0.15
m = 0.20
m = 0.30
50
0.120
0.085
0.069
0.032
0.007
100
0.286
0.155
0.085
0.038
0.006
150
0.497
0.235
0.111
0.034
0.004
200
0.685
0.335
0.130
0.033
0.000
400
0.964
0.539
0.180
0.033
0.000
POSM: proportional odds survival model.
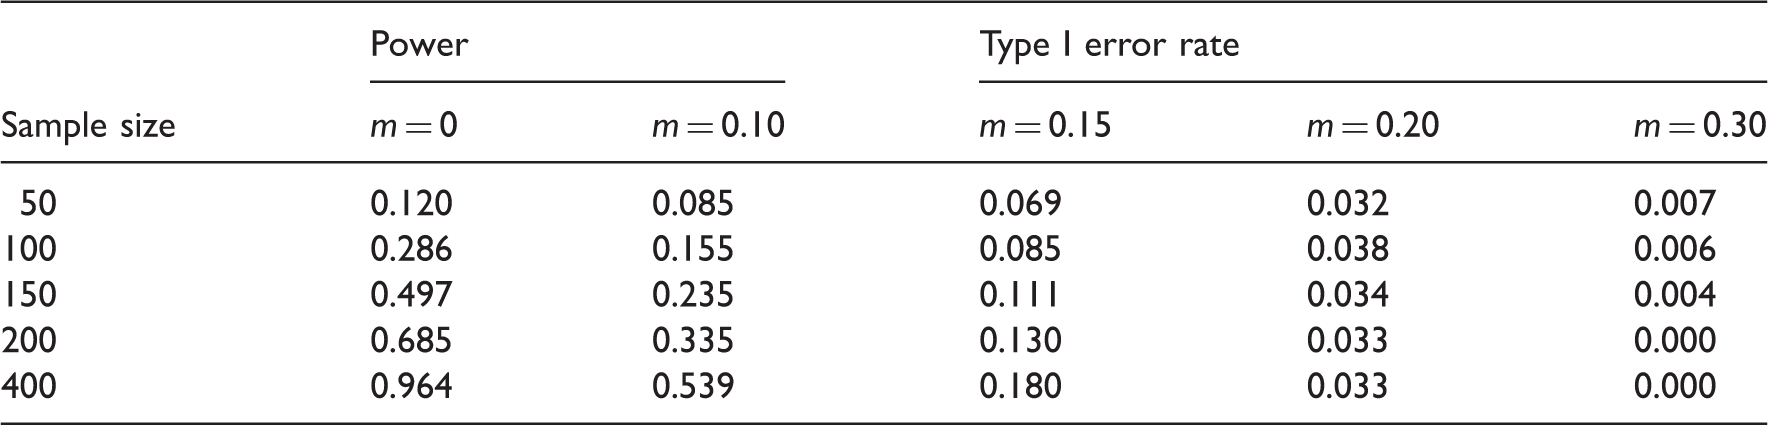
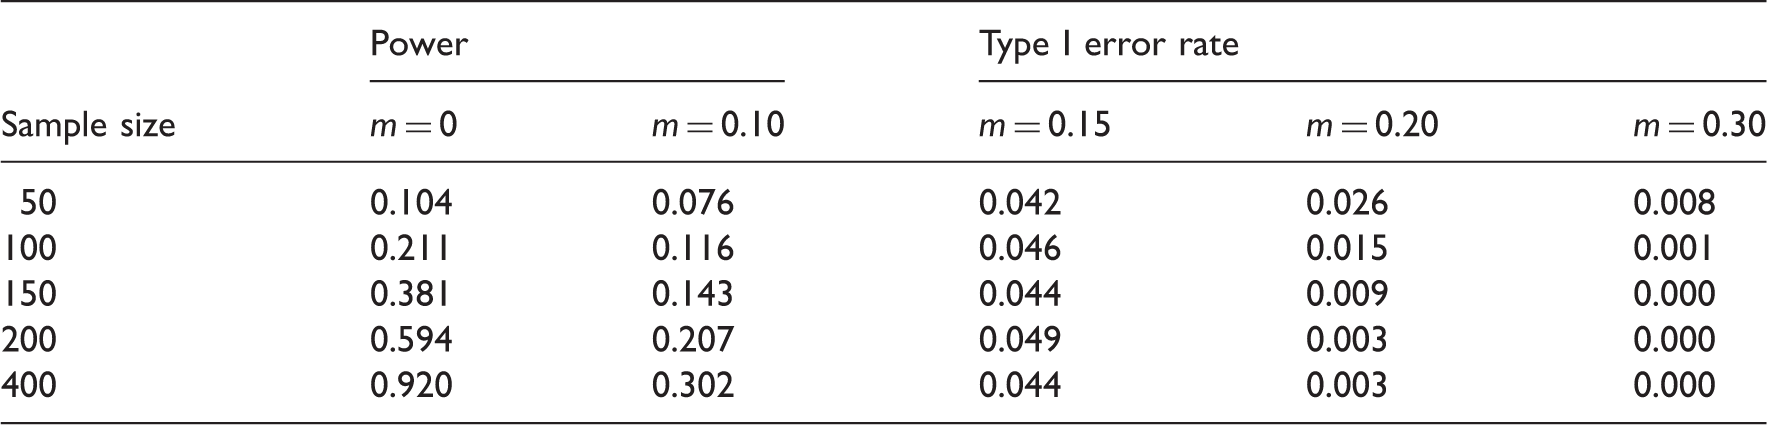
Our next simulation study use data sets generated from the PHM with baseline survival and random censoring density of exponential with mean 50. Both and censoring density are same as the one used in previous simulation study. We again compare the type I error rates as well as the power of the log-rank based test with those of our POSM-based tests. The rejection regions for both tests are determined using the equivalence margin and an intended level of significance of 0.05. The values in Table 3 are the results using the log-rank based test under PHM. Table 4 values represent the POSM-based test when the simulation model is PHM. Although we have only limited amount of loss of power for wrongly assuming the POSM compared to the powers of the log-rank based test, the type I error rates (sizes) of POSM-based test remain below and close to the intended 5% level. This shows that the test based on a POSM assumption is a more conservative and robust approach, when compared to the log-rank based test, even when the true underlying model has proportional hazards.
For different values of maximum difference in survival curves , Pr(Rejecting H0) for using log-rank based test when the true model is PHM (sample size = for ).
Sample size
Power
Type I error rate
m = 0
m = 0.10
m = 0.15
m = 0.20
m = 0.30
50
0.127
0.087
0.045
0.012
0.005
100
0.268
0.131
0.052
0.016
0.000
150
0.510
0.156
0.047
0.010
0.000
200
0.676
0.201
0.049
0.009
0.000
400
0.966
0.355
0.052
0.002
0.000
PHM: proportional hazards model.
For different values of maximum difference in survival curves , Pr(Rejecting H0) for using POSM-based test when the true model is PHM (sample size = for ).
For the sake of brevity, we skip the results of the simulation study of the one sample case comparing the PHM-based test and the POSM-based test. Similar to the two-sample case, the size of our POSM-based one-sample test has type I error lower than intended significance level test even when the sample size is small. The power of the one-sample test is almost double compared to the corresponding power of the two-sample test, indicating that we need a smaller number of patients compared to the two sample case when is known.
6 Data example and conclusion
The main goal of the pediatric oncology trial of Nam et al.11 was to evaluate whether a seven-month long maintenance treatment (the standard) is equivalent to a shorter (less toxic) four-month long treatment (new treatment) for non-Hodgkin’s malignant type B lymphoma. It is necessary to accept a “small” decrease in survival rate as a trade-off for the better tolerability and less toxicity of a new shorter treatment. For this study, the investigators decided that would be the “threshold of equivalence region” from Nam et al.11 —the maximum difference between the survival rates of two equivalent treatment arms. Using this , the p-value of the log-rank based equivalence test was 0.024 based on the observed data with 11 and nine failures out of sample sizes of 84 and 82, respectively, from standard long and new shorter treatment regimens. This p-value () is a highly significant evidence in favor of the alternative hypothesis of equivalence of two treatments. We cannot re-analyze the clinical trial because the original data is proprietary. Instead, we would like to demonstrate using a simulation study the comparison between a log-rank based test and a POSM-based test when we follow the design and the censoring mechanism similar to this trial and the true difference between treatment arms is at the margin of equivalence (). We simulate 1000 data sets with 11 out of and nine failures out of for two treatment arms following POSM. We use the censoring scheme and monitoring length (18 months) similar to Nam et al.11 The proportion of log-rank based test statistics with p-values more extreme than 0.024 is 0.038. When using the POSM test on the same set of data, we find the corresponding proportion to be 0.012. This shows that when the true model is POSM, the probability that a log-rank test will have a p-value less than 0.024 (same or more significant than the p-value obtained by Nam et al.11) is almost three times more than the probability of having such a significance level with the POSM-based test. This further demonstrates that a log-rank based test has a high probability to give a highly significant (very small) p-value, even though we do not want to reject the null hypothesis H0 when the actual .
Unlike Cox’s model where one hazard function dominates the other over time, a POSM can allow two hazard functions to merge over time. This may be a possible explanation for POSM-based equivalence test being more conservative than the log-rank based test. Li et al.12 and Betensky et al.13 (among others) have argued that even for superiority trials, the efficiency and validity of a log-rank based test likely is questionable for solid tumor oncology studies in which there is heterogeneity of tumors due to existence of various unidentified genetic subtypes. For these studies, the hazard functions from two treatment arms may merge over time. A POSM assumption with POSM-based equivalence tests would be a wise choice in this situation.
In this paper, we have presented the test statistics, critical region, and robustness and other related properties of POSM-based tests restricted only to right-censored survival data. We would like point out that the statements of Theorem 1 and Theorem 2 are valid irrespective of the censoring mechanism. Arguably, for any type of censoring, it is possible to develop an equivalence test based on POSM if one can determine the appropriate statistic (preferably based on the SPML estimate of β of POSM from interval-censored data) and the corresponding critical region. However, equivalence trials with different types of censoring such as interval censoring are beyond the scope of this paper. These are important topics of future research.
Footnotes
Acknowledgements
We would like to thank the editor, and two referees for their valuable suggestions that led to the great improvement of our article.
Declaration of conflicting interests
The author(s) declared no potential conflicts of interest with respect to the research, authorship, and/or publication of this article.
Funding
The author(s) disclosed receipt of the following financial support for the research, authorship, and/or publication of this article: The authors are grateful for the support provided by NIH grant R01CA69222 for this research.
References
1.
World Medical Association Declaration of Helsinki. Ethical principles for medical research involving human subjects. JAMA2000; 284: 3043–3045.
2.
WellekS. A log-rank test for equivalence of two survivor functions. Biometrics1993; 49: 877–881.
3.
CoxDR. Regression models and life-tables (with discussion). J R Stat Soc Ser B1972; 30: 248–275.
4.
WellekS. Testing statistical hypothesis of equivalence and non inferiority, 2nd ed. Florida: Chapman & Hall, 2010.
5.
Com-NougueCRodaryCPatteC. How to establish equivalence when data are censored: a randomized trial of treatments for B non Hodgkin lymphoma. Stat Med1993; 12: 1353–1364.
6.
BennettS. Analysis of survival data by the proportional odds model. Stat Med1983; 2: 273–277.
7.
RothmannMLiNChenG. Design and analysis of non inferiority mortality trials in oncology. Stat Med2003; 22: 239–264.
8.
MurphySARossiniAJVan Der VaartAW. Maximum likelihood estimation in the proportional odds model. J Am Stat Assoc1997; 92: 968–976.
9.
ChenKJinZYingZ. Semi-parametric analysis of transformation models with censored data. Biometrika2002; 89: 659–668.
10.
LinDYWeiLJ. The robust inference for the Cox proportional Hazards model. J Am Stat Assoc1989; 89: 659–668.
11.
NamJKimJSeungyeounL. Equivalence of two treatments and sample size determination under exponential survival model with censoring. Comput Stat Data Anal2005; 49: 217–226.
12.
LiYAdelsteinDJAdamsGL. An intergroup phase III comparison of standard radiation therapy and two schedules of concurrent chemoradiotherapy in patients with unresectable squamous cell head and neck cancer. J Clin Oncol2003; 21: 92–98.
13.
BetenskyRALouisDNCairncrossJG. Influence of unrecognized molecular heterogeneity on randomized clinical trials. J Clin Oncol2003; 20: 2495–2499.