
Abstract
Medical researchers are often interested to investigate the relationship between explicative variables and times-to-events such as disease progression or death. Such multiple times-to-events can be studied using multistate models. For chronic diseases, it may be relevant to consider semi-Markov multistate models because the transition intensities between two clinical states more likely depend on the time already spent in the current state than on the chronological time. When the cause of death for a patient is unavailable or not totally attributable to the disease, it is not possible to specifically study the associations with the excess mortality related to the disease. Relative survival analysis allows an estimate of the net survival in the hypothetical situation where the disease would be the only possible cause of death. In this paper, we propose a semi-Markov additive relative survival (SMRS) model that combines the multistate and the relative survival approaches. The usefulness of the SMRS model is illustrated by two applications with data from a French cohort of kidney transplant recipients. Using simulated data, we also highlight the effectiveness of the SMRS model: the results tend to those obtained if the different causes of death are known.
Keywords
1 Introduction
The method most widely used to investigate the relationship between explicative variables and times-to-events is the Cox proportional hazards model. 1 However, only a single time-to-event can be studied, which may not be relevant in a medical context. As an example, if the event under study is the progression to an advanced stage of a chronic disease, it is often difficult to consider death as non-informative censoring. Multistate models allows multiple times to event data to be studied and have been well-established for years.2–4
Another advantage of multistate approaches is the possibility to separately study the death according to their causes. To personalize therapeutic strategies, it is important to study more specifically the treatment effects on time-to-death related to the disease under consideration. However, deaths are often studied indifferently to their cause, the cause of death being usually unavailable or hardly attributable to a unique cause. For instance, in renal transplantation, a death related to a post-transplantation cancer may be attributed to the renal chronic disease since immunosuppressive drugs represent risk factors for cancer 5 and/or may be due to other factors independent from transplantation, such as tobacco use or hereditary factors. Relative survival (RS) models with additive hazards have been introduced as a methodological answer to this issue:6–8 the excess mortality related to a disease is estimated by subtracting the expected mortality rates from general population life tables to the observed mortality rates. This decomposition allows an estimate of the net survival, i.e. the survival in the situation where the disease under study would be the only possible cause of death.
In light of this, it is interesting to combine both approaches, i.e. multistate model with the concept of net survival. Exploring this idea, Belot et al. 9 considered the excess mortality related to colon cancer with competing risks data. More recently, in a general multistate framework, Huszti et al. 10 proposed a time-inhomogeneous Markov relative survival (MRS) model with piecewise constant intensities. The authors demonstrated the usefulness of this model, especially when the effects of risk factors differ substantially between disease-specific mortality and expected mortality in the general population. Time-inhomogeneous Markov models consider that the transition intensities depend on the chronological time, i.e. the time since the baseline of the study. However, this assumption may not be relevant in many medical applications, for instance in chronic diseases for which time-to-death more likely depends on the time since the last disease progression than on the time since the initial disease diagnosis. It has already been demonstrated that the semi-Markovian assumption, that considers the transition intensities between two states depend on the time spent in the current state,11,12 was particularly relevant in renal transplantation13,14 or in AIDS.15,16
In that context, we propose a relative survival model to describe the multistate progression of a disease considering the time spent in the current state. We call this approach SMRS (semi-Markov additive relative survival). Section 2 presents the SMRS model. Section 3 presents two applications related to the long-term evolution of kidney transplant recipients (KTRs) and describes differences with the MRS model proposed by Huszti et al. 10 Finally, Section 4 offers discussions and conclusions. Of note, simulations for validation of the SMRS model properties are detailed in the online supplementary materials.
2 The SMRS model
2.1 Notation
We adopt the notation T for the chronological time from baseline and S for the duration (or sojourn time) in a state. Let The SMRS representation for a multistate model including the death related to the disease (X = E) and the death not related to the disease (X = P). Arrows for the transitions to X = E and X = P are represented with dashed lines since the two states cannot be distinguished individually.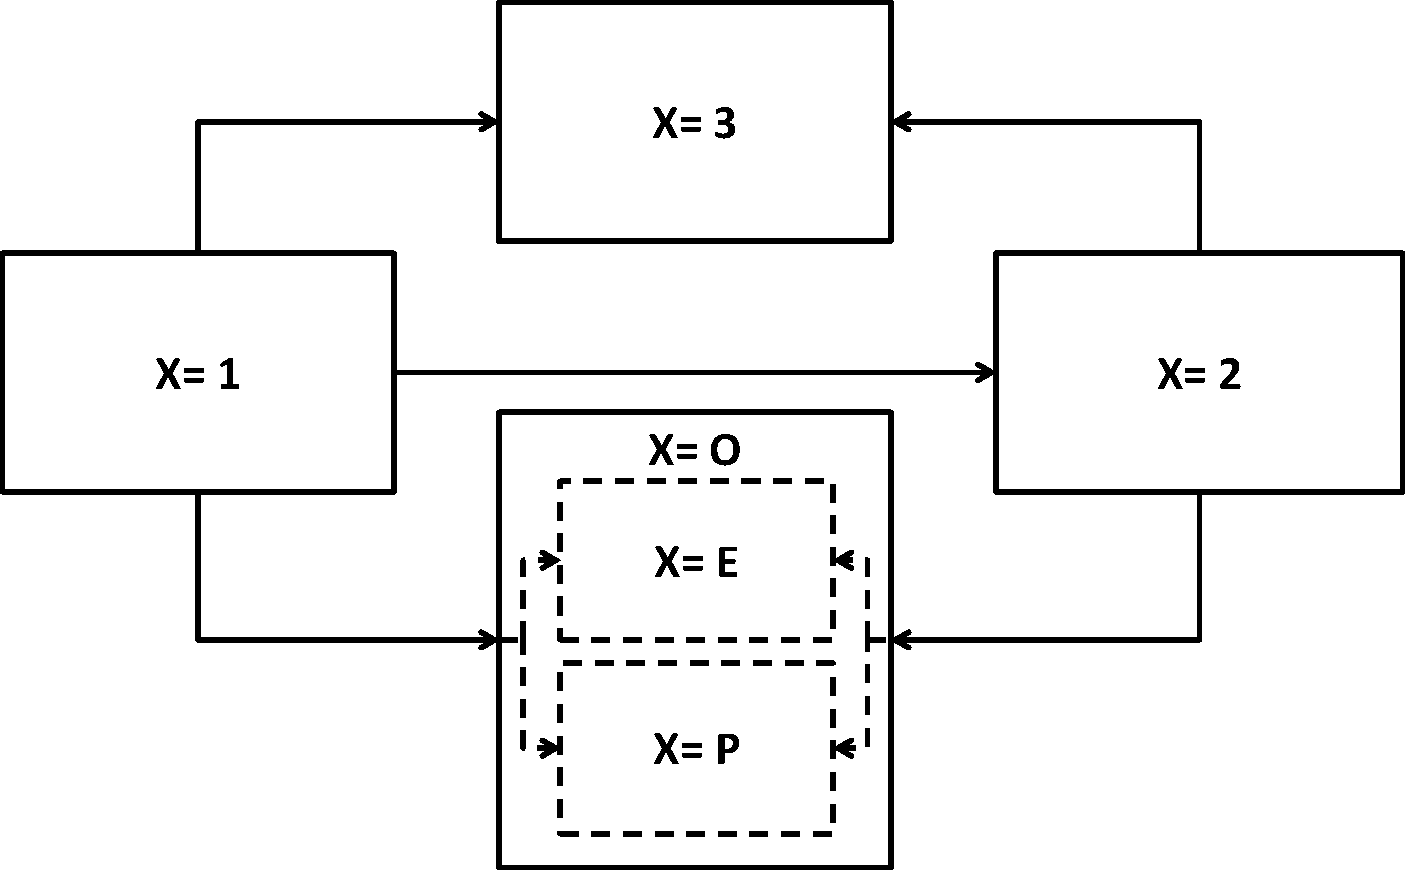
2.2 The semi-Markov model
The semi-Markov (SM) model considers that the transition intensities between two states depend on the time already spent in the current state. In this paper, we focus on a time-homogeneous SM model. Unlike the time-inhomogeneous SM model, the time-homogeneous SM model considers that the transition intensities between two states do not depend on the time since baseline. The instantaneous hazard function specific from state Xm = i to the state Xm + 1 = j after a duration s, given patient characteristics Zij = zij is therefore defined by

2.3 The proposed SMRS model
In additive relative survival analysis, the observed mortality hazard λiO(.) is assumed to be the sum of two components: the expected population mortality and the excess mortality related to the disease under study. 8 Let X = E the death related to the disease and X = P the death related to other causes. Figure 1 shows the SMRS representation for a multistate model: whereas the usual SM model considers four observed states (solid lines), the SMRS model considers five states (dashed lines) with two types of death, although these two states cannot be distinguished individually.
The expected population mortality hazard λP(.) can be obtained from the death rates provided by life tables of statistical national institutes. These tables indicate the proportion of people dead in a calendar year stratified by birthdate and gender. Other strata can be included, such as ethnicity, but such additional strata are rarely available. Given the completeness of deaths from exhaustive life tables, λP(.) is always considered as a fixed parameter. This assumption has to be relaxed when λP(.) is obtained from a survival model estimated from a non-exhaustive database. In this case, sample-to-sample fluctuations should be considered.
17
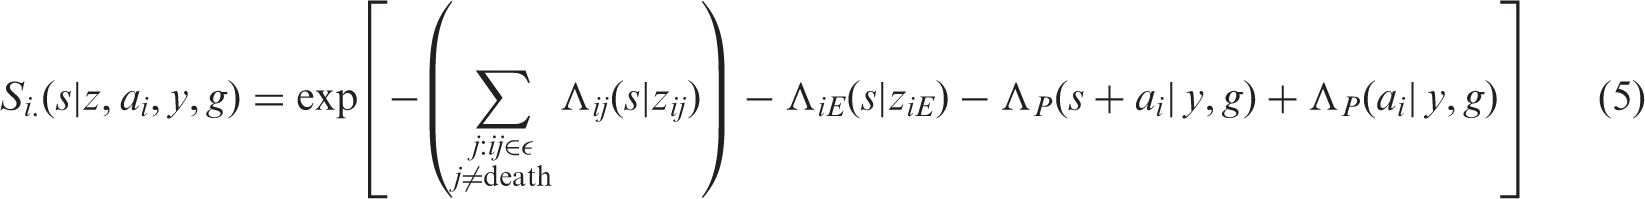
Let A the random variable for patient age at death, ai his/her age observed at entry in state i, y his/her birthyear, and g his/her gender. The instantaneous hazard function for the expected mortality (not related to the disease) after a duration s in the state i is


The instantaneous hazard functions (including the excess death hazard λiE) can be modeled classically using parametric or semi-parametric distributions, and proportional or non-proportional hazard models. 18 In this paper, the methods discussed are limited to parametric proportional hazard models with time-fixed covariates. The hazard ratios for transition ij (HR ij ), calculated as the exponential of the regression coefficients, are cause-specific to the transition ij: the individuals who suffer an event k ≠ j are removed from the risk set to do a competing transition after this time event (right conditioning in equation (1)). The HR ij is a measure of association that does not necessarily directly translate into a measure of risk without the assumption of independence between the competing events. It can be interpreted as the relative change in the cause-specific hazard for the transition ij corresponding to a 1-unit increase in the corresponding covariate.3,19
We used the R statistical software 20 version 3.0.1 with optim() function to maximize the likelihood function and to compute the corresponding Hessian matrix (Nelder and Mead algorithms 21 ). The complete methodology has been implemented in an R package Multistate available at http://www.divat.fr and is additionally available from the authors upon request. It includes functions for estimating SM, SMRS, Markov, and MRS models.
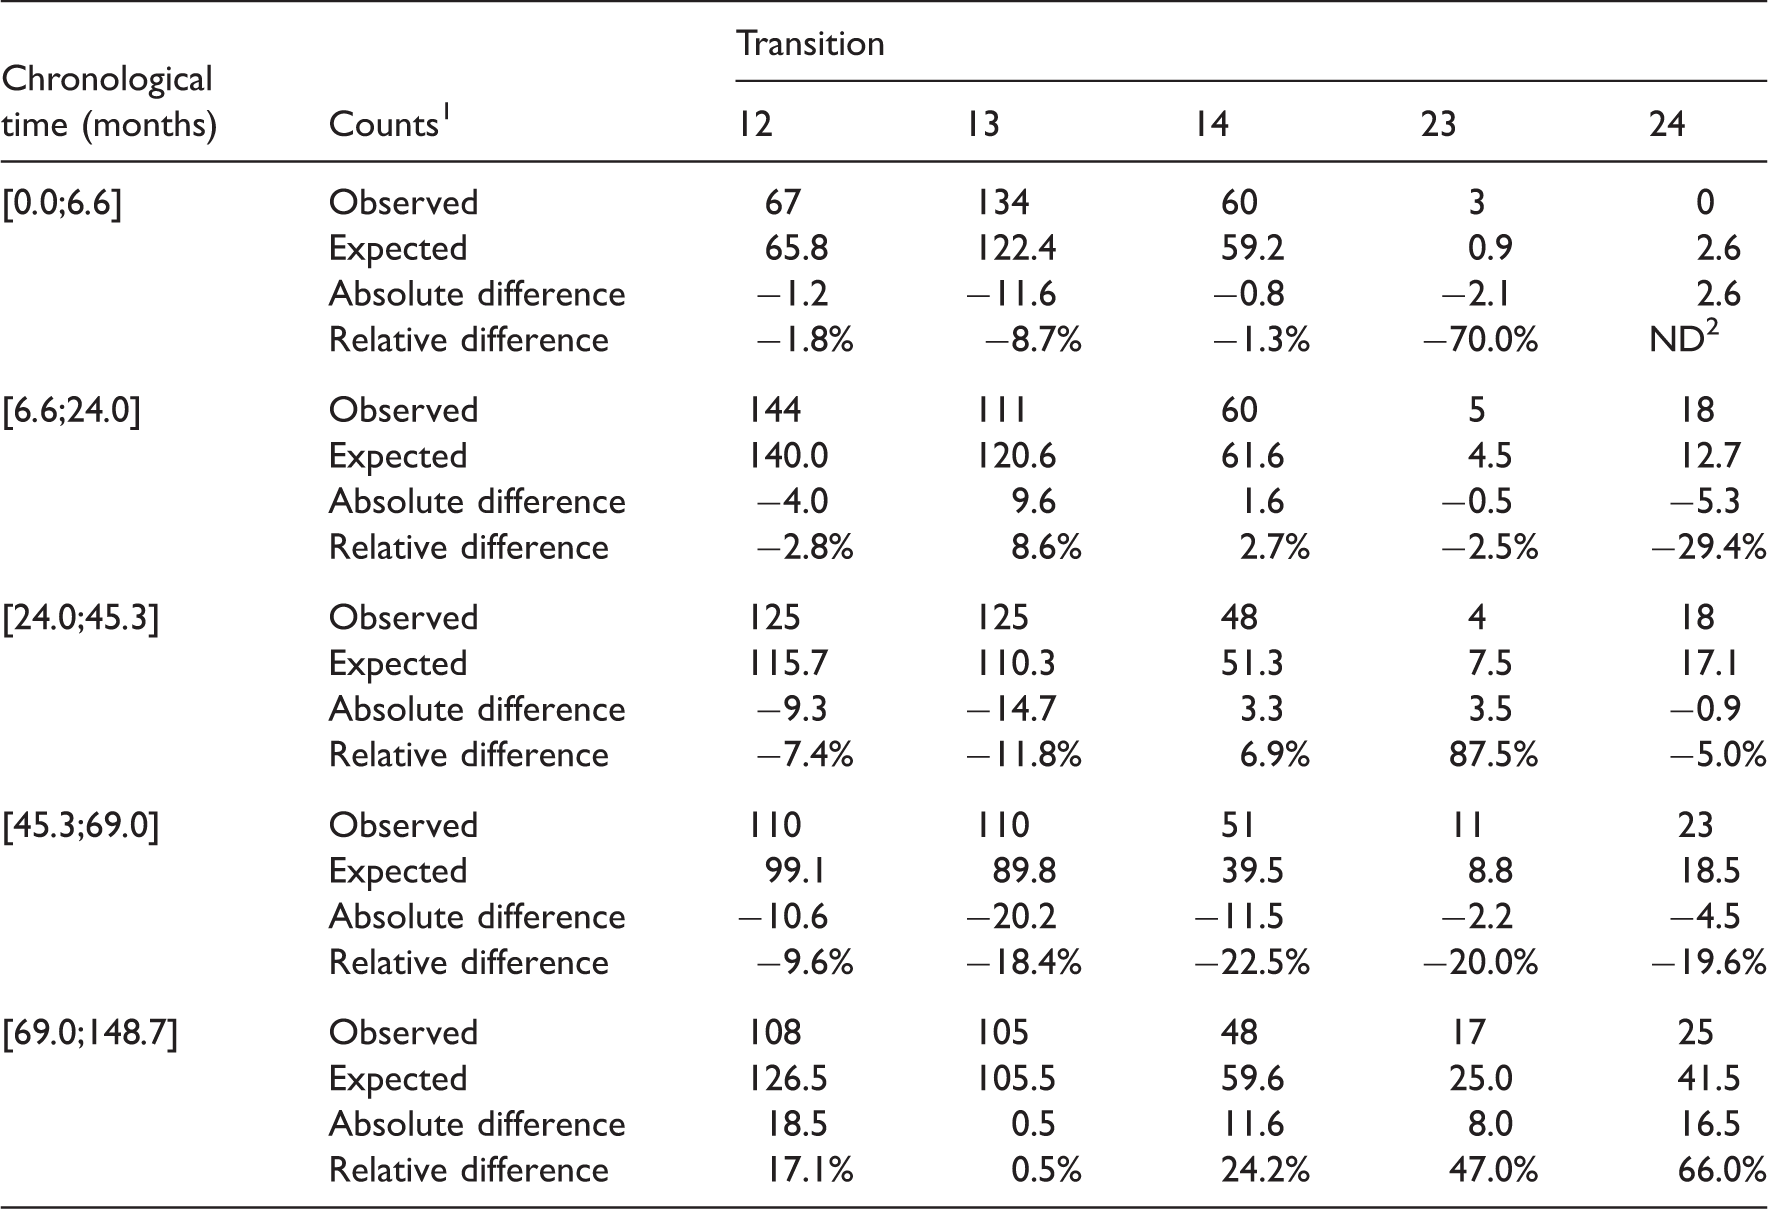
2.4 Comparison between observed and expected numbers of transitions
To assess the fit of the SRMS model, we proposed an ad hoc comparison between observed and expected numbers of transitions ij according to chronological time intervals


In parallel, in order to evaluate the suitability of the parametric assumptions, we also compared for each transition the estimations of the cumulative incidence functions (CIFs) from the SMRS model and from the non-parametric Aalen–Johansen estimator. 22 Estimations of the CIFs from the SMRS model for some specific strata were calculated using the mean of individuals’ CIFs, i.e. the integrals of the density functions (6). Effect of covariate on CIF should be interpreted with caution because a decrease in the CIF could be either due to a physiological effect of the exposure or to an increase in the probability of the competing failure causes. 23
3 Applications in kidney transplantation
Kidney transplantation is the treatment of choice for most patients with end-stage renal disease because survival and quality of life are often better than long-term dialysis. However, with the shortage of donor organs and the risk associated with the surgical procedure, it is of particular interest to study the risk of death related to the kidney transplant status. In particular, it is important to evaluate whether transplantation in elderly patients is associated with a dramatic increase in the mortality compared with the general population. Foucher et al. 7 proposed, for the first time in a transplantation setting, the use of an additive regression model for relative survival. They were not able to demonstrate a significant excess of mortality related to ageing compared with the general population. They also suggested that preventing delayed graft function (DGF) may be more effective for decreasing the risk of death specifically related to the disease. Nevertheless, they only considered the time-to-death by assuming the non-informative right-censoring of returns in dialysis. Moreover, they ignored intermediate stages of disease evolution, such as the acute rejection episode (ARE) or cancer. The ARE is a common complication in the first year post-transplantation partially due to DGF. Cancer is the third cause of death in KTRs, with mortality rates higher in youngest KTR compared to the general population because of the long-term use of immunosuppressive drugs. 24
To illustrate the usefulness of the SMRS model, we propose studying the relationship between the DGF and the multistate evolution of KTR (Figure 1): the states X = 3 and X = O are respectively the definitive return to dialysis and the death with a functional graft, and the transient state (X = 2) is the ARE in the first application and cancer in the second application. Both applications were performed using data from DIVAT (Données Informatisées et VAlidées en Transplantation, http://www.divat.fr), a French multicentric prospective cohort of patients from six centers, older than 18 years, who have received renal transplantation and have given their informed consent for their data collection. We included 5943 adults receiving a kidney transplant between January 2000 and September 2012, without simultaneous transplanted organ. Mean recipient age was 50.9 years old (standard deviation [SD] 13.5), 3622 (61%) patients were male recipients and 1817 (31%) had a DGF. In October 2012, 625 (10.5%) patients were returned to dialysis and 351 (5.9%) were dead with a functional graft.
For each application, we compared the proposed SMRS model with two other models: the MRS model with piecewise constant intensities proposed by Huszti et al. 10 and the traditional SM model without distinction between deaths (four-state SM model). The expected mortality rates of the general French population, available by age, gender and calendar year in the R package ROCt (http://www.divat.fr), were used in relative survival models. Original data and updates can also be downloaded from the Human Mortality Database (http://www.mortality.org). Three covariates were considered for each transition intensities: recipient age, recipient gender, and the DGF. The number of intervals and cutpoints related to the piecewise baseline hazard functions were determined graphically for each transition using the CIFs from the non-parametric Aalen–Johansen estimator as a reference.
3.1 The ARE as a transient state
Comparison of the multivariable SMRS, MRS and four-state SM models for the analysis of the relationship between clinical factors and the time-to-events on renal transplant data with ARE as a transient state (N = 5943). For the HRs related to age, the reference group corresponds to patients older than 65 years.

Cutpoints for baseline hazards
Results from the SMRS and MRS models were similar for transitions from the first state. This was expected as duration and chronological times coincide for this transition. Nevertheless the results for these two models were also close from the transitions to ARE (X = 2). This may be also explained by the short time to ARE, leading to close duration and chronological times after ARE.
As expected, estimations for transitions into clinical events other than death were quite similar between the SMRS model and the four-state SM model. More interestingly, the estimations from the SMRS model differed from the SM model for transitions to death. This was expected because some deaths are related to the kidney transplant status. The effect of ageing on death related to the transplantation (SMRS model) was lower than those for all-cause death (four-state SM model) but remained important indicating that the role of ageing observed in the SM model might not only be explained by the expected effect of age as in the general population. For example, in the SMRS model, the HRs of death related to the disease without ARE, varied from 0.06 (95% confidence interval (CI) [0.01–0.31]) for recipients younger than 35 years old to 0.55 (95% CI [0.32–0.93]) for recipients between 50 and 65 years old compared with recipients older than 65 years of age. In the SM model these HR varied from 0.06 (95% CI [0.03–0.13]) to 0.45 (95% CI [0.33–0.60]). Similar trends could be underlined for the transition from ARE to death. In contrast, the associations between DGF and the different risks of transition into death were greater in the SMRS than in the SM model. In the SMRS model, the corresponding HR for death related to the disease was estimated to be 3.02 (95% CI [1.96–4.64]) without ARE, and to be 2.49 (95% CI [1.23–5.04]) after ARE. In the SM model, these HRs were respectively estimated to be 1.93 (95% CI [1.52–2.44]) and 1.88 (95% CI [1.20–2.95]). The differences between both approaches are consistent since the DGF cannot be a risk factor of death related to a cause other than the disease. Finally, we observed that women seemed to have a higher risk than men to die due to the disease, especially after ARE, when the association was embedded in the all-cause model (the mortality for men being higher than for women in general population).
The CIFs derived from the SMRS model and from the non-parametric Aalen–Johansen estimator are presented in Section B of the online supplementary materials. Regardless of the type of event or group of patients, the SMRS model estimates tended to fit the non-parametric ones. Therefore, the parametric assumptions for durations and the proportionality of hazards seemed reasonable.
Contingency table for the observed and expected numbers of transitions derived from the SMRS model with ARE as a transient state (N = 5943).
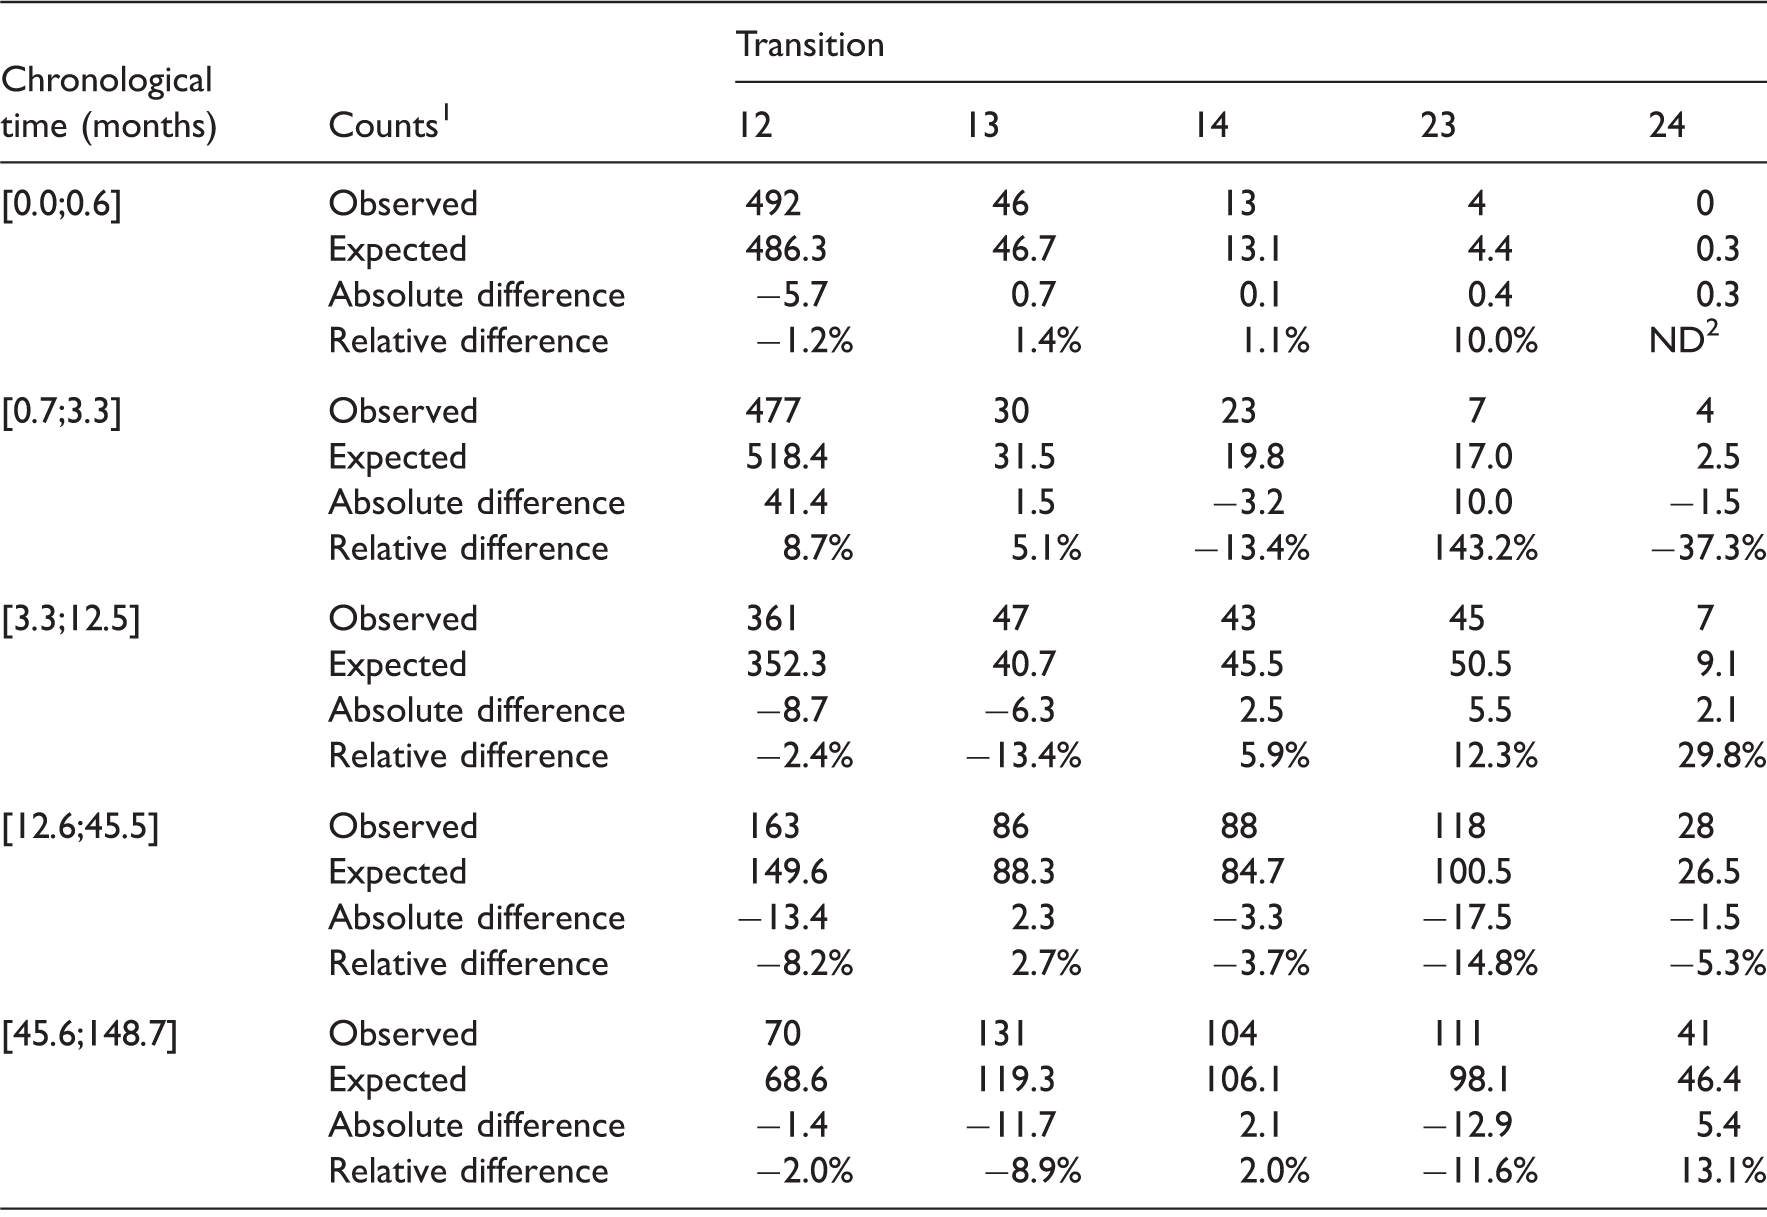
1Absolute difference = Expected counts – Observed counts
Relative difference = (Expected counts – Observed counts)/Observed counts; 2 Not defined.
3.2 The post-transplant cancer as a transient state
Comparison of the multivariable SMRS, four-state SM and MRS models for the analysis of the relationship between clinical factors and the time-to-events on renal transplant data with cancer as a transient state (N = 5943). For the HRs related to age, the reference group corresponds to patients lower than 55 years.
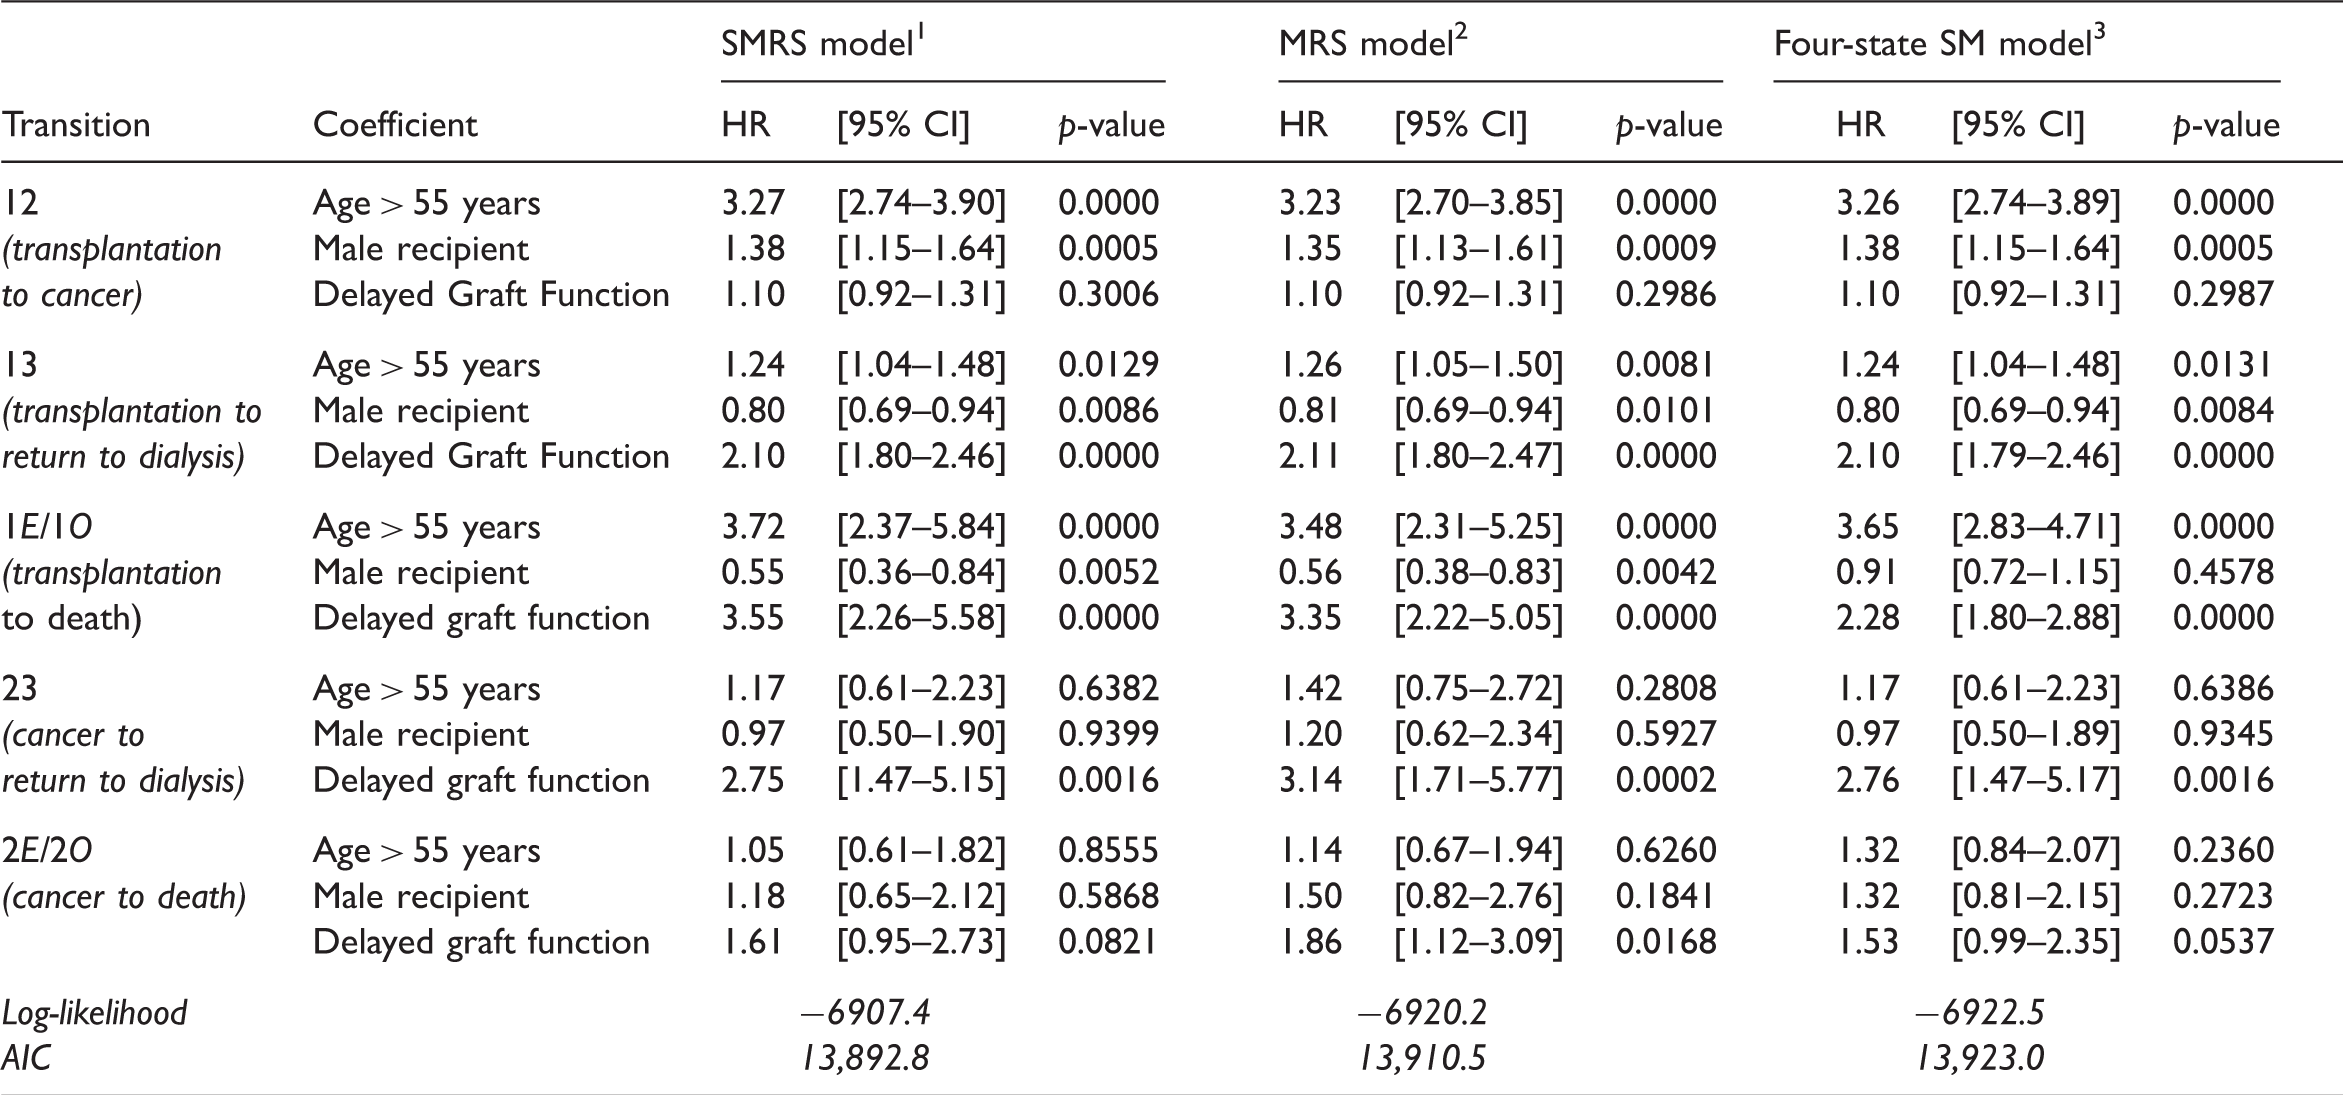
1Cutpoints for baseline hazards
As in the first application, results obtained with the SMRS and MRS models were close for transitions from the initial state. In contrast, regression coefficient for transitions after cancer differed importantly. For example, in the SMRS model, the estimated HRs related to DGF were 2.75 (95% CI [1.47–5.15]) for the return to dialysis, and 1.61 (95% CI [0.95–2.73]) for the death related to the disease. In the MRS model, these HRs were respectively 3.14 (95% CI [1.71–5.77]) and 1.86 (95% CI [1.12–3.09]). Additional reason to favor the SMRS model was that transition times after cancer were not significantly associated with the duration before cancer (p = 0.69 for return to dialysis and p = 0.59 for death). Similarly to the first application, differences were observed between the SMRS model and the four-state SM model for the transitions to death: (i) the regression coefficients related to DGF were greater in the SMRS than in the SM model; and (ii) when no cancer was diagnosed post-transplantation, gender appeared as an important determinant of death related to the disease whereas this factor was not significantly associated with the all-cause mortality.
Contingency table for the observed and expected numbers of transitions derived from the SMRS model with cancer as a transient state (N = 5943).
1Absolute difference = Expected counts – Observed counts
Relative difference = (Expected counts – Observed counts)/Observed counts 2 Not defined
4 Discussion
We have proposed an additive relative survival analysis using a semi-Markovian multistate model. The merging of relative survival and multistate analyses concepts may be very informative for many clinical epidemiology studies. The applications of our model to study the evolution of KTRs illustrate in practice the usefulness of the SMRS model to better describe the incidence of deaths related to the disease and the associated risk factors. Indeed, the risk/benefit of transplantation of organs into elderly patients has been debated for a long time, particularly in light of the shortage of donor organs and the higher risk associated with the surgical procedure. According to our results, recipient age remains a major risk factor of death related to the disease. Our analyses confirm the well-known consequences of the DGF after kidney transplantation 25 and provide additional information on the mechanistic pathways implicated. In particular, the SMRS model described a correlation between the DGF and the time-to-death related to the disease, and this was regardless of the occurrence of ARE. The fit of the SMRS model and the homogeneity assumption regarding the chronological time seemed reasonable. This supports the use of semi-Markov multistate models with KTRs data. Although the parametric assumptions for durations appeared appropriate in our application, there may be some diseases where the non-parametric distributions fit better. 15
Huszti et al. 10 recently developed a time-inhomogeneous MRS model. However, in some medical contexts, the transitions may be more likely associated with the time spent in the current state than to the chronological time. Our first application shows that both SMRS and MRS models tend to have similar results. This result may be explained by early ARE (X = 2), the majority occurring during the first year post-transplantation. The consequence is a close distribution between chronological and duration times. In contrast, results from the SMRS and MRS models differed in the second application, i.e. when the transient state is cancer. Cancer is a long-term complication and therefore chronological time and duration time after the occurrence of cancer differed importantly. In both applications, it turns out that the SMRS model was preferred regarding the AIC. From our point of view, the SMRS model has several benefits. First of all, the semi-Markovian assumption corresponds to a clinical reality in many chronic diseases: the risk of death more likely depends on the time since the last disease stage evolution (cancer, infection, disease recurrence, etc.) than on the time since the disease diagnosis. Second, it is straightforward to include the time spent in the first state as a covariate of transitions from X = 2. This takes the chronological time in the SMRS model into consideration. Third, the check of parametric assumptions in the SMRS model is easier than in the MRS model: the instantaneous hazard functions depend on the duration time which enables to evaluate the suitability of the parametric assumptions by comparing the CIFs estimates with the non-parametric ones.
From simulations (see the online supplementary materials), we have demonstrated that the performances of the SMRS model are as good as a SM model where the causes of death are known (five-state model), and are better than the traditional SM model (where the causes of death are not distinguished) to estimate the effects of risk factors on the mortality related to the disease. In our SMRS model, the variability of estimations associated to transitions into death was greater than for an all-cause death model. This is due to the fact that net estimations attempt to only use information regarding deaths related to the disease, whereas the all-cause estimations are based on all observed deaths. A similar increase was reported previously.10,26 Large standard deviations could have indicated that few deaths are related to the disease under study.
It is important to note that we have used a cause-specific writing for hazard functions. The cause-specific hazard ratios calculated are a valid measure of the apparent associations between a covariate and the relative instantaneous hazard rate given that individuals have survived all competing events until time t. A marginal (or net) interpretation is only possible in the hypothetical situation that the competing event time distributions and censoring distribution are independent but this assumption cannot be verified from the observable data.3,19,27,28
In a relative survival framework, the expected hazard of death is calculated from general population life tables. Such estimates are known to be biased since they also include mortality from the disease under study. However, the bias is sufficiently small to be insignificant for most applications and particularly for kidney transplant data since mortality among KTRs is thought to constitute only a small proportion of total mortality. 29 In our application, the use of general population life tables may also be discussed because the expected mortality for KTRs can also be the mortality observed in patients with renal disease who have not benefited from transplantation. To date, no lifetime table exists for such population.
As a conclusion, this study shows the usefulness of the SMRS model to investigate the relationship between covariates and a chronic disease progression, particularly toward the death related to the disease. It offers additional results to traditional multistate models, in particular the interpretation of the mechanism associated with death related to the disease. The complete methodology has been implemented in an R package to make these statistical tools more user friendly. Future developments would be to implement semi-parametric or non-parametric multistate relative survival models for cases where parametric assumptions for durations are not relevant.
Supplemental Material
sj-pdf-1-smm-10.1177_0962280215586456 - Supplemental material for A multistate additive relative survival semi-Markov model
Supplemental material, sj-pdf-1-smm-10.1177_0962280215586456 for A multistate additive relative survival semi-Markov model by Florence Gillaizeau, Etienne Dantan, Magali Giral, Yohann Foucher, Professor Marie Davidian in Statistical Methods in Medical Research
Footnotes
5 Supplementary materials
The reader is referred to the online supplementary materials (available at: ![]() ) for technical appendices, additional simulations and supplementary graphics. Section A details the calculations of expected numbers of transitions from the SMRS model (presented in Section 2.4). Sections B and C present the CIFs estimates provided by the SMRS model and the Aalen–Johansen non-parametric estimator on data from KTRs with ARE as a transient state (Section B) and cancer as a transient state (Section C) according to: DGF, recipient age, and recipient gender. Section D details the design and results of six simulation scenarios to assess the performances of the SMRS model and compare them to the five-state SM model (the causes of death are known), and the four-state SM model (all deaths are considered regardless their cause).
) for technical appendices, additional simulations and supplementary graphics. Section A details the calculations of expected numbers of transitions from the SMRS model (presented in Section 2.4). Sections B and C present the CIFs estimates provided by the SMRS model and the Aalen–Johansen non-parametric estimator on data from KTRs with ARE as a transient state (Section B) and cancer as a transient state (Section C) according to: DGF, recipient age, and recipient gender. Section D details the design and results of six simulation scenarios to assess the performances of the SMRS model and compare them to the five-state SM model (the causes of death are known), and the four-state SM model (all deaths are considered regardless their cause).
Acknowledgements
The authors would like to thank the Roche laboratory for partially supporting the DIVAT cohort, and participants of the DIVAT network for their contribution to ensure the maintenance of the cohort and the development of research projects.
Declaration of conflicting interests
The author(s) declared no potential conflicts of interest with respect to the research, authorship, and/or publication of this article.
Funding
The author(s) disclosed receipt of the following financial support for the research, authorship, and/or publication of this article: This work was supported by the French Ministry of Health [grant number PHRC PROG/11/85 2011 to Pr Magali Giral].
References
Supplementary Material
Please find the following supplemental material available below.
For Open Access articles published under a Creative Commons License, all supplemental material carries the same license as the article it is associated with.
For non-Open Access articles published, all supplemental material carries a non-exclusive license, and permission requests for re-use of supplemental material or any part of supplemental material shall be sent directly to the copyright owner as specified in the copyright notice associated with the article.