
Abstract
Publication bias can significantly limit the validity of meta-analysis when trying to draw conclusion about a research question from independent studies. Most research on detection and correction for publication bias in meta-analysis focus mainly on funnel plot-based methodologies or selection models. In this paper, we formulate publication bias as a truncated distribution problem, and propose new parametric solutions. We develop methodologies of estimating the underlying overall effect size and the severity of publication bias. We distinguish the two major situations, in which publication bias may be induced by: (1) small effect size or (2) large p-value. We consider both fixed and random effects models, and derive estimators for the overall mean and the truncation proportion. These estimators will be obtained using maximum likelihood estimation and method of moments under fixed- and random-effects models, respectively. We carried out extensive simulation studies to evaluate the performance of our methodology, and to compare with the non-parametric Trim and Fill method based on funnel plot. We find that our methods based on truncated normal distribution perform consistently well, both in detecting and correcting publication bias under various situations.
Keywords
1 Introduction
Meta-analysis is a statistical procedure of combining results from independent studies to answer specific questions, with the hope of drawing reliable conclusions. Since it was first introduced by Glass, 1 the use of meta-analysis techniques has increased tremendously, especially in health and medical research. While combined studies certainly have higher statistical power than individual studies, one major criticism of meta-analysis is that not all relevant studies are published. Investigators tend to ignore studies with less significant results and journals tend to reject publishing them as well.2–5 The result is called publication bias, also known as the “file drawer” problem because some studies are “tucked away in file drawer”. 6 Synthesizing results of a non-representative sample of studies lead to biased conclusion, one that favors only significant outcomes. Hence, it is desirable to test whether any bias exists in studies collected for a meta-analysis. If there is publication bias, bias correction needs to be done so as valid conclusion can be reached.
An earlier approach to testing publication bias is “Failsafe N” suggested by Rosenthal. 6 Failsafe N is defined as the number of additional studies needed so that the significance of an overall test from combined studies can be reduced to non-significance. Rosenthal 6 argued that if Failsafe N is large (for example, N > 19k, where k is number of studies in the meta-analysis), then results from meta-analysis can be considered reliable (not affected by publication bias), as it is unrealistic to have a large number of unpublished studies. Thus, small Failsafe N is an indication of the presence of publication bias.
Another group of methods, collectively called selection methods,7–14 utilize a weight function to describe the probability of a specific study being selected in meta-analysis. The choice of weight function depends on the p-value or both the effect size and its standard error from individual study. 15 Although the selection method approach appears to have more realistic assumptions of inclusion and exclusion of studies, it is rather complicated and is rarely used in actual application. The complexity of this approach comes from the arbitrariness in specifying the weight function, the requirement of a large number of studies, and the lack of readily available computer programs.
Alternatively, a funnel plot 16 is a visual tool for detecting publication bias. It is a scatter plot of the effect size from each individual study versus its precision measure, such as standard error or sample size. Studies with small sample sizes tend to produce insignificant results, and thus get omitted, resulting in an asymetrical funnel plot. Thus, the asymmetry of funnel plot maybe an indication of the presence of publication bias, although there may be other reasons for an asymmetrical funnel plot. 17 However, since the funnel plot is not a rigorous statistical test, especially when the number of studies is small, visual detection of asymmetry is not enough to make a firm conclusion. Several formal statistical test methods have been developed for testing the asymmetry of funnel plots. These include the non-parametric rank correlation test by Begg and Mazumdar 18 and the regression-based test by Egger et al. 17 However, simulation analyses have shown that the power of these methods is low unless the level of bias is severe.18,19
To date, the most popular method is the Trim and Fill (TF) method developed by Duval and Tweedie.20,21 The TF method is a funnel plot-based, iterative, non-parametric (rank-based) method. It detects publication bias by estimating number of omitted/trimmed studies on one side of the funnel plot. Once these trimmed studies are filled, the funnel plot should become less asymmetrical, and the overall effect can be estimated using both filled and observed study effects. A major criticism of the TF method is that it cannot distinguish publication bias from heterogeneity.22–24 Also, the TF method only considers publication bias caused by small effect sizes, and does not consider studies omitted due to non-significant results (with large p-values).
In this paper, we propose a new parametric procedure to detect and correct for publication bias. As with all funnel plot-based procedures, we assume that some studies on one side of the funnel plot are omitted. However, instead of testing the symmetry of the funnel plot, we formulate the omitted studies as truncation of a distribution. Montes and Lotyczewski 25 considered a similar approach in 2003, but they did not consider variability from one study to another, and simply assumed that the study effects follow a truncated normal distribution. By ignoring the within-study variances, the method essentially assumed that the study variances were equal, which made the estimation much easier. Naturally, however, such an assumption is unrealistic and not applicable in practical meta-analyses. We seek to improve upon their approach and the other meta-analysis methods. We also distinguish between the two truncation mechanisms (small effect size or large test p-value). Our primary interest is to estimate the underlying mean, which is the corrected estimate of the overall effect, free of publication bias. The estimated truncation point can be used to estimate proportion of omitted studies, and thus serves as a measure of severity of truncation and the graveness of publication bias. We consider both fixed- and random-effects models, as the asymmetry of a funnel plot may be due to heterogeneity of studies, not only because of truncation. 15 We use maximum likelihood method for parameter estimation with a fixed-effects model and method of moments with a random-effects model.
2 Modeling publication bias
Consider the meta-analysis that deals with n independent studies. The i-th study has an estimate xi of a parameter of interest with a corresponding variance estimate
When assuming no between-study heterogeneity,
26
traditional fixed-effects model can be used. The fixed-effects model assumes that all studies in the meta-analysis share a common true effect size, and thus the observed effect size varies from one study to the next only because of the random error inherent in each study. The fixed-effects model is specified as follow

In the above model, the within-study variance
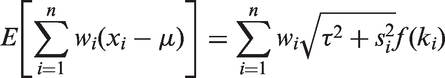
If these n studies constitute a representative sample from the population of all studies, the global mean can be obtained by a weighted average of the n estimates and we refer to it as the uncorrected mean

The uncorrected estimator (2) can be obtained using maximum likelihood method under certain assumptions, which we shall discuss in the next section.
However, as noted in the Introduction section, it may not be valid to assume that the n studies are a representative sample of the population of all relevant studies. To develop our new methodology, we first note that most studies, if not all, assume an aymptotic normal distribution of the estimate xi when obtaining its p-value and also its confidence interval. Hence, we begin by assuming that

Now we consider that some studies are omitted, causing publication bias. When they are omitted due to small effect size, we observe studies only when the individual effect xi is larger than some unknown value, k. Hence, we observe {
Note that our choice of an unknown cut-off point k (or t) is essentially the same as the “suppressed Bernoulli model” assumption in the TF method, as “the suppression has taken place in such a way that it is the k0 values of the Yj with the most extreme left-most values that have been suppressed” 21
Extra variation among study effects (i.e. heterogeneity) can also cause asymmetry in a funnel plot. Random-effects models can effectively deal with heterogeneity in meta-analysis. To incorporate the heterogeneity among studies, we consider that the effects are distributed as


3 Parameter estimation
We derive likelihood functions for the two truncation mechanisms, from which we estimate the overall effect and the proportion of omitted studies.
3.1 Truncated by effect size
3.1.1 Estimation under fixed-effects model
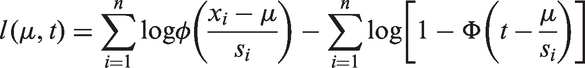
If truncated by effect size, study i is not included in the meta-analysis when

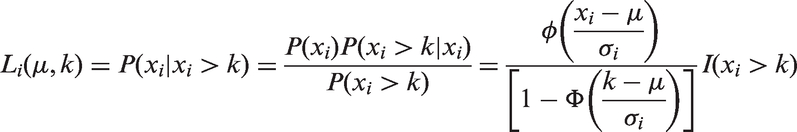
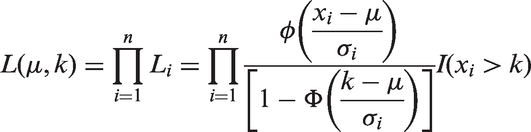
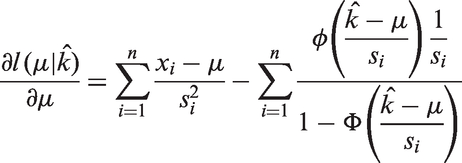
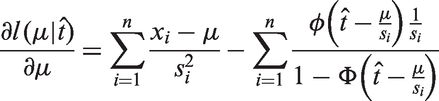
Therefore, maximum likelihood estimators of μ and k can be obtained by maximizing the log-likelihood (with σi replaced by si)

The constraint on the log-likelihood function poses difficulties in the maximization procedure and the statistical inference, as it violates the regularity conditions for the maximum likelihood estimation theory.
27
Note that the first term in the right-hand side of equation (7) does not depend on k, while the second term increases as k increases. Therefore, the likelihood increases as k increases, but with the constraint

Appendix 1 proves that this estimator is asymptotically unbiased and consistent for true k. Now, we obtain

Given
By letting
An estimated
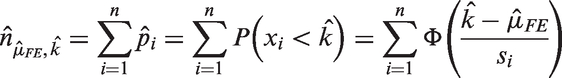
Then the estimated proportion of omitted studies can be defined as

Traditional maximum likelihood theory is not applicable for statistical inferences and the construction of confidence intervals for
3.1.2 Estimation under a random-effects model
Under a random-effects model with truncation of studies by effect size (

Compared to the truncation probability under a fixed-effects model, we have an extra parameter
Note, for any
Note that ki depends on both μ and
For given
In reality,
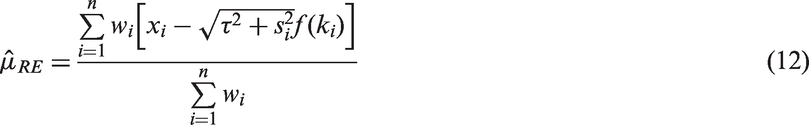
3.2 Truncated by p-value
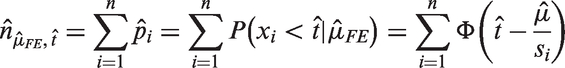
When some studies are truncated by large p-value, we can consider all values


Similar to the situation when the truncation is by effect size, we estimate t by


The proportion of truncation p can be estimated through

Confidence intervals for the estimates μ and p can be obtained using the bootstrap procedure, in the same way as described in previous subsection. Also, replacing ki in equation (12) with
4 Simulation studies
In this section, we investigate the empirical performance of our proposed method. We compare the performance of our method with that of the TF method in terms of the ability to detect and correct the estimates for publication bias.
4.1 Generation of the data for meta-analysis
In this section, we describe how we generate the data
4.1.1 Continuous responses
To conduct simulation studies, we first generate continuous data through the following steps.
Step c1. Generate standard error si from a Step c2. Repeat step c1 n times, with n = 20 to 100, by an increment of 10. Step c3. Induce publication bias by excluding some studies. Step c4. Calculate the estimates of the global mean and the proportion of truncation as discussed in previous section
Data from a random-effects model were generated by replacing
4.1.2 Binary responses
Step b1. Generate number of events and determine event rates based on the tests of odds ratio for binary outcome data from control (rc) and treatment (rt) groups as in Peters et al.
23
Step b2. Generate total number of subjects (n) in each group from the exponential of a normal distribution Step b3. Generate subjects with event from two binomial distributions, Step b4. Calculate log odds ratio and the corresponding standard error for each study, which are our simulated individual effect sizes xi and standard errors si. Step b5. Induce publication bias by excluding some studies. Step b6. Calculate the estimates of the global mean of log odds ratios and the proportion of truncation.
Under random-effects model, before proceeding to Step b2, we would need the following additional steps. First, for a given τ, generate
In step b1, the event rate of the control group is allowed to vary for each sample study, generated from a uniform distribution with lower and upper limits of 0.3 and 0.7, respectively. The event rate for the treatment group is then determined according to the relation
In steps c3 and b5, number of excluded studies is
We also conducted a simulation to verify the general proof for the property of the estimator for the cut-off point for the truncation. Data were generated similarly as the steps c1 and c2, but in step c3, data were excluded based on a fixed cut-off point for the truncation. We used −0.4 and −0.5, which corresponds to studies with OR < 0.61 or <.67 being excluded because of having negative results to the desired study objectives. We calculated the estimates of the bias of the cut-off point and examined their behaviors.
We considered nine sample sizes for the number of studies in a meta-analysis
4.2 Simulation results
We present simulation results using data generated from both random- and fixed-effects models, and compare various estimation strategies discussed in the previous section. With a fixed-effects model (τ = 0), we plot all six estimators for selected truncation proportions
4.2.1 Truncation point
In Appendix 1, we proved that the estimator for the cut-off point given in equation (8) is asymptotically unbiased and consistent with its mean squared error approaching zero and it was unconditional to where the truncation happened. To numerically verify the proof, we plotted the bias of the estimate in Figure 1 for two cases where the studies are removed due to negative results than expected. In the simulation set up, studies with OR < 0.61 or 0.67 were truncated in the data generated, and we used our estimator to estimate the bias. In Figure 1, it is shown that the bias in the estimate decreases as n increases, approaching zero, as expected from the proof given in Appendix 1. Although the positive bias does not seem to approach zero quickly, it is relatively minor in value even in small samples, and we are satisfied with its consistency.
Bias in estimation of the cut-off point for data truncation: tau is the between-study standard error. The dashed horizontal line is inserted to indicate a zero bias.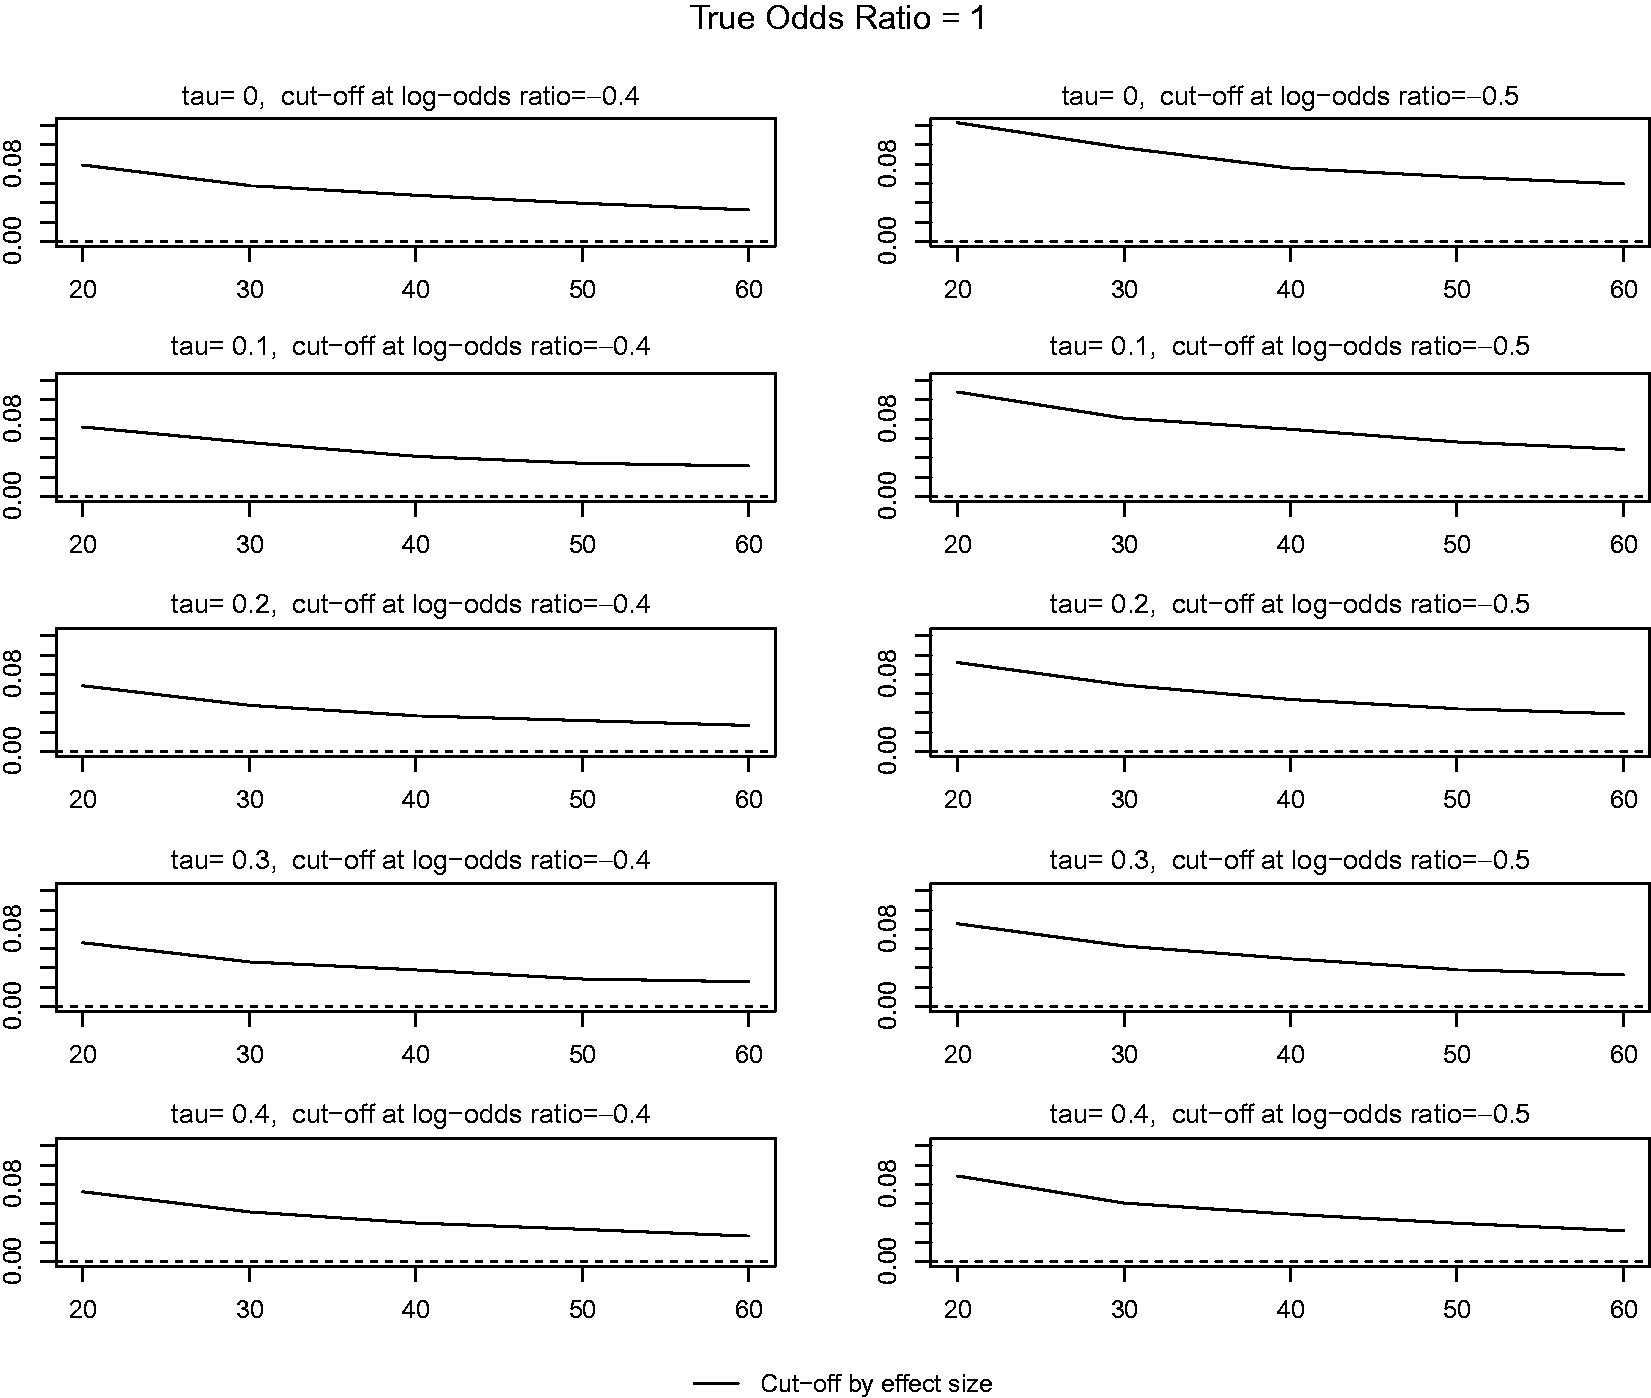
4.2.2 Overall effect size
Figure 2 illustrates the bias of the estimates with studies using binary outcomes. The uncorrected estimator has the largest bias in estimating the overall effect size, as expected. The bias is positive (overestimation), and increases substantially with increasing proportion of truncation. When there is no truncation (p = 0), the uncorrected estimator has a very small positive bias and the bias converges to zero as the number of studies increases, as expected.
Bias in estimation of the global mean with binary responses: tau is the between-study standard error and P is the truncation proportion. The dashed horizontal line is inserted to indicate a zero bias: UC: uncorrected; ML: the maximum likelihood; TF: the Trim and Fill method; 2-step: the method of moments; RE: a random-effects model; FE: a fixed-effects model.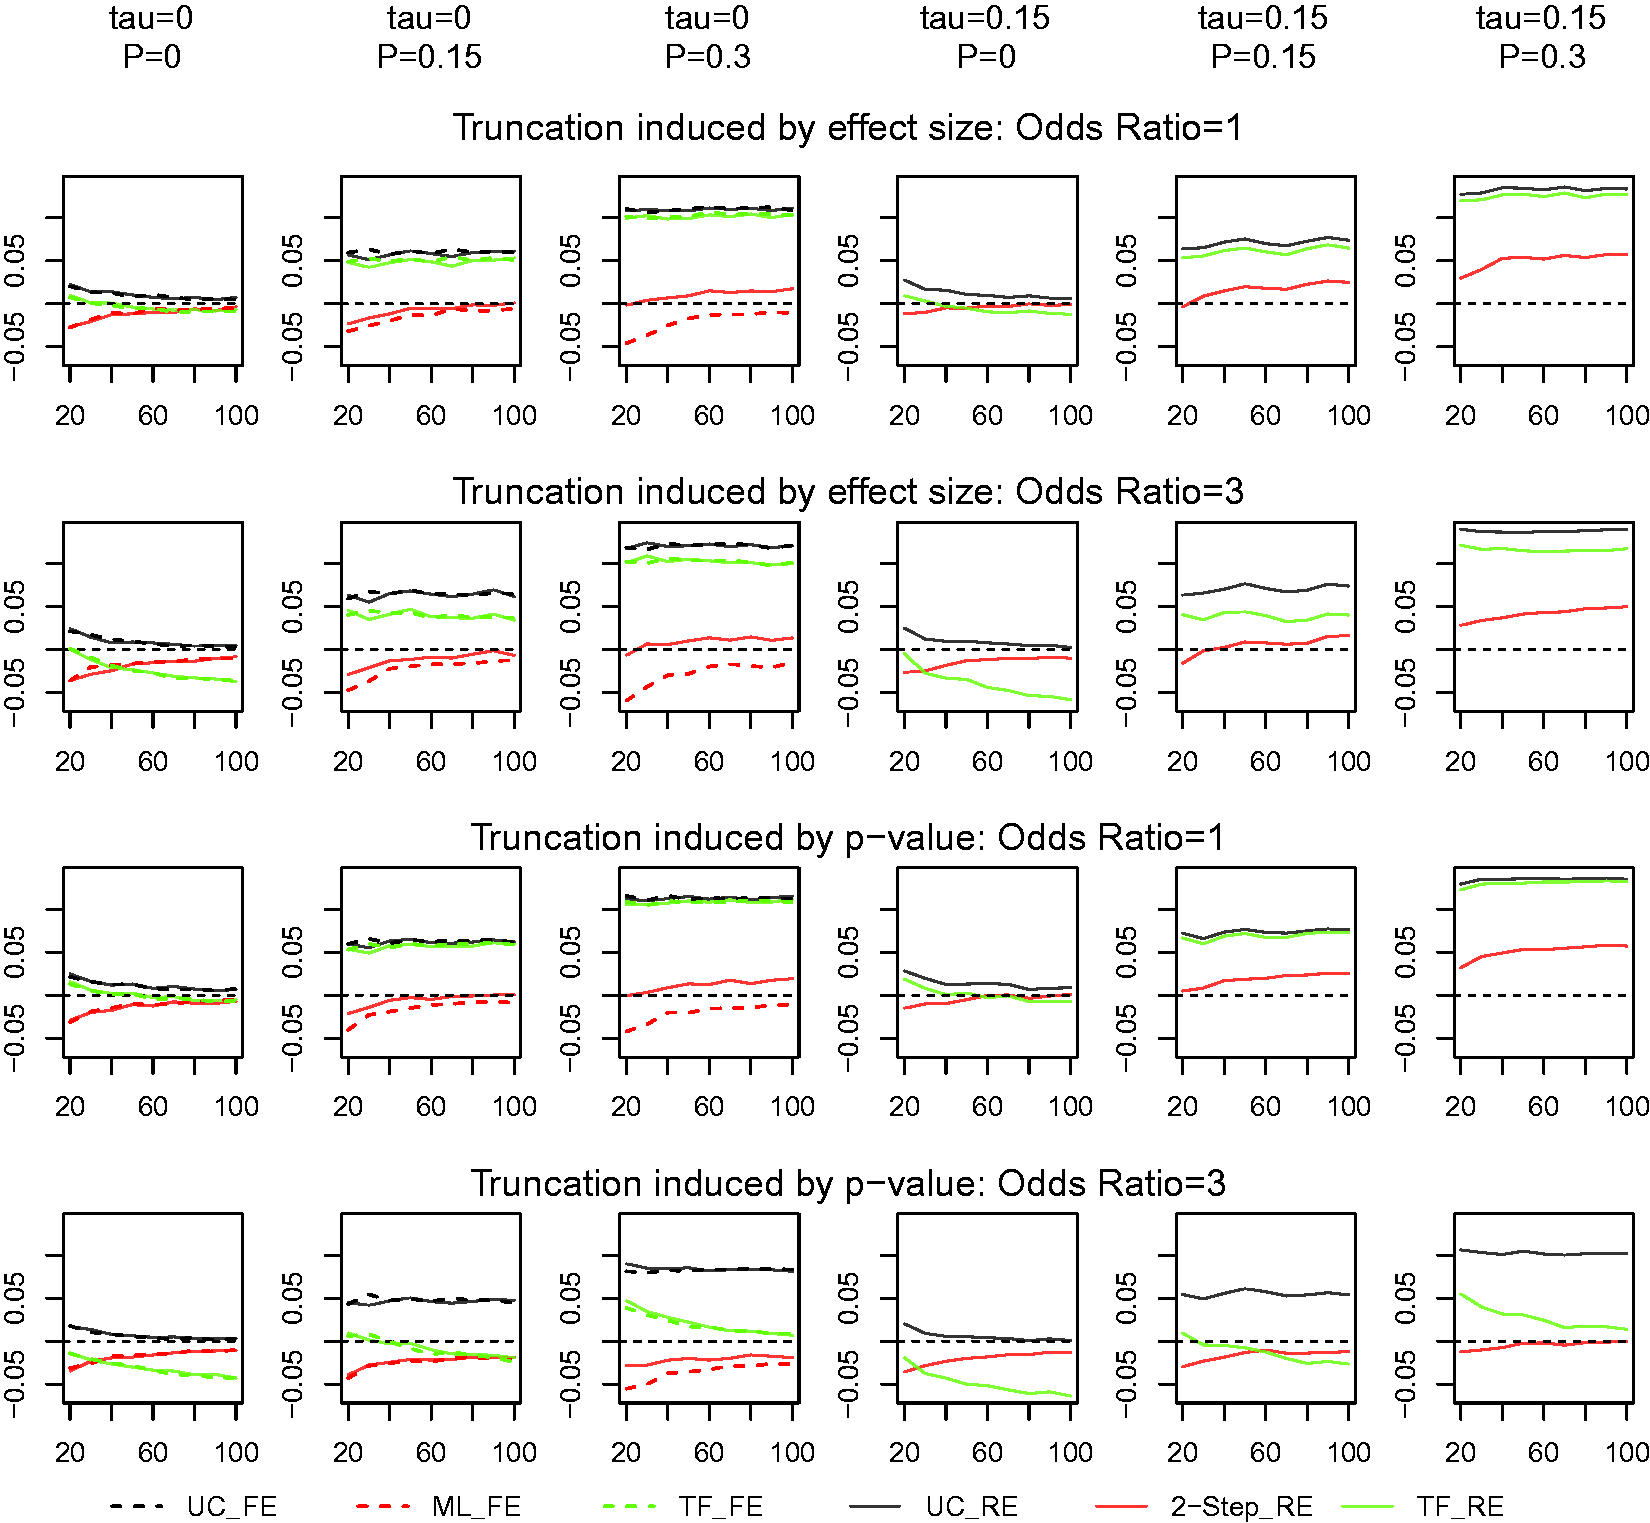
The TF estimator performs only slightly better than the uncorrected estimator, especially when the truncation proportion is large. In most situations, the TF estimator has a positive bias, but when there is no or small truncation proportion, the bias is negative. It also performs somewhat differently when the truncation is by p-value under a large underlying overall effect size (OR = 3), where the bias is much smaller than that of the uncorrected estimator, and decreases as sample size increases. The TF estimator performs similarly under both fixed and random-effects models.
On the other hand, our estimators produce results with the smallest bias for almost all situations. Under a fixed-effects model, our maximum likelihood estimator (
Figure 3 compares the mean squared errors (MSE) in estimating the global mean with data generated from binary responses. There are no real differences in MSE when there is no truncation of studies. However, in likely situations of various levels of truncation, our methods were shown to have smaller MSE compared to the TF or un-corrected estimators in almost all situations consistently.
MSE in estimation of the global mean with binary responses. One-step effect and two-step effect refer to the Method of moments updated once and twice, respectively, assuming truncation by small effect size where tau is the between-study standard error and P is the truncation proportion.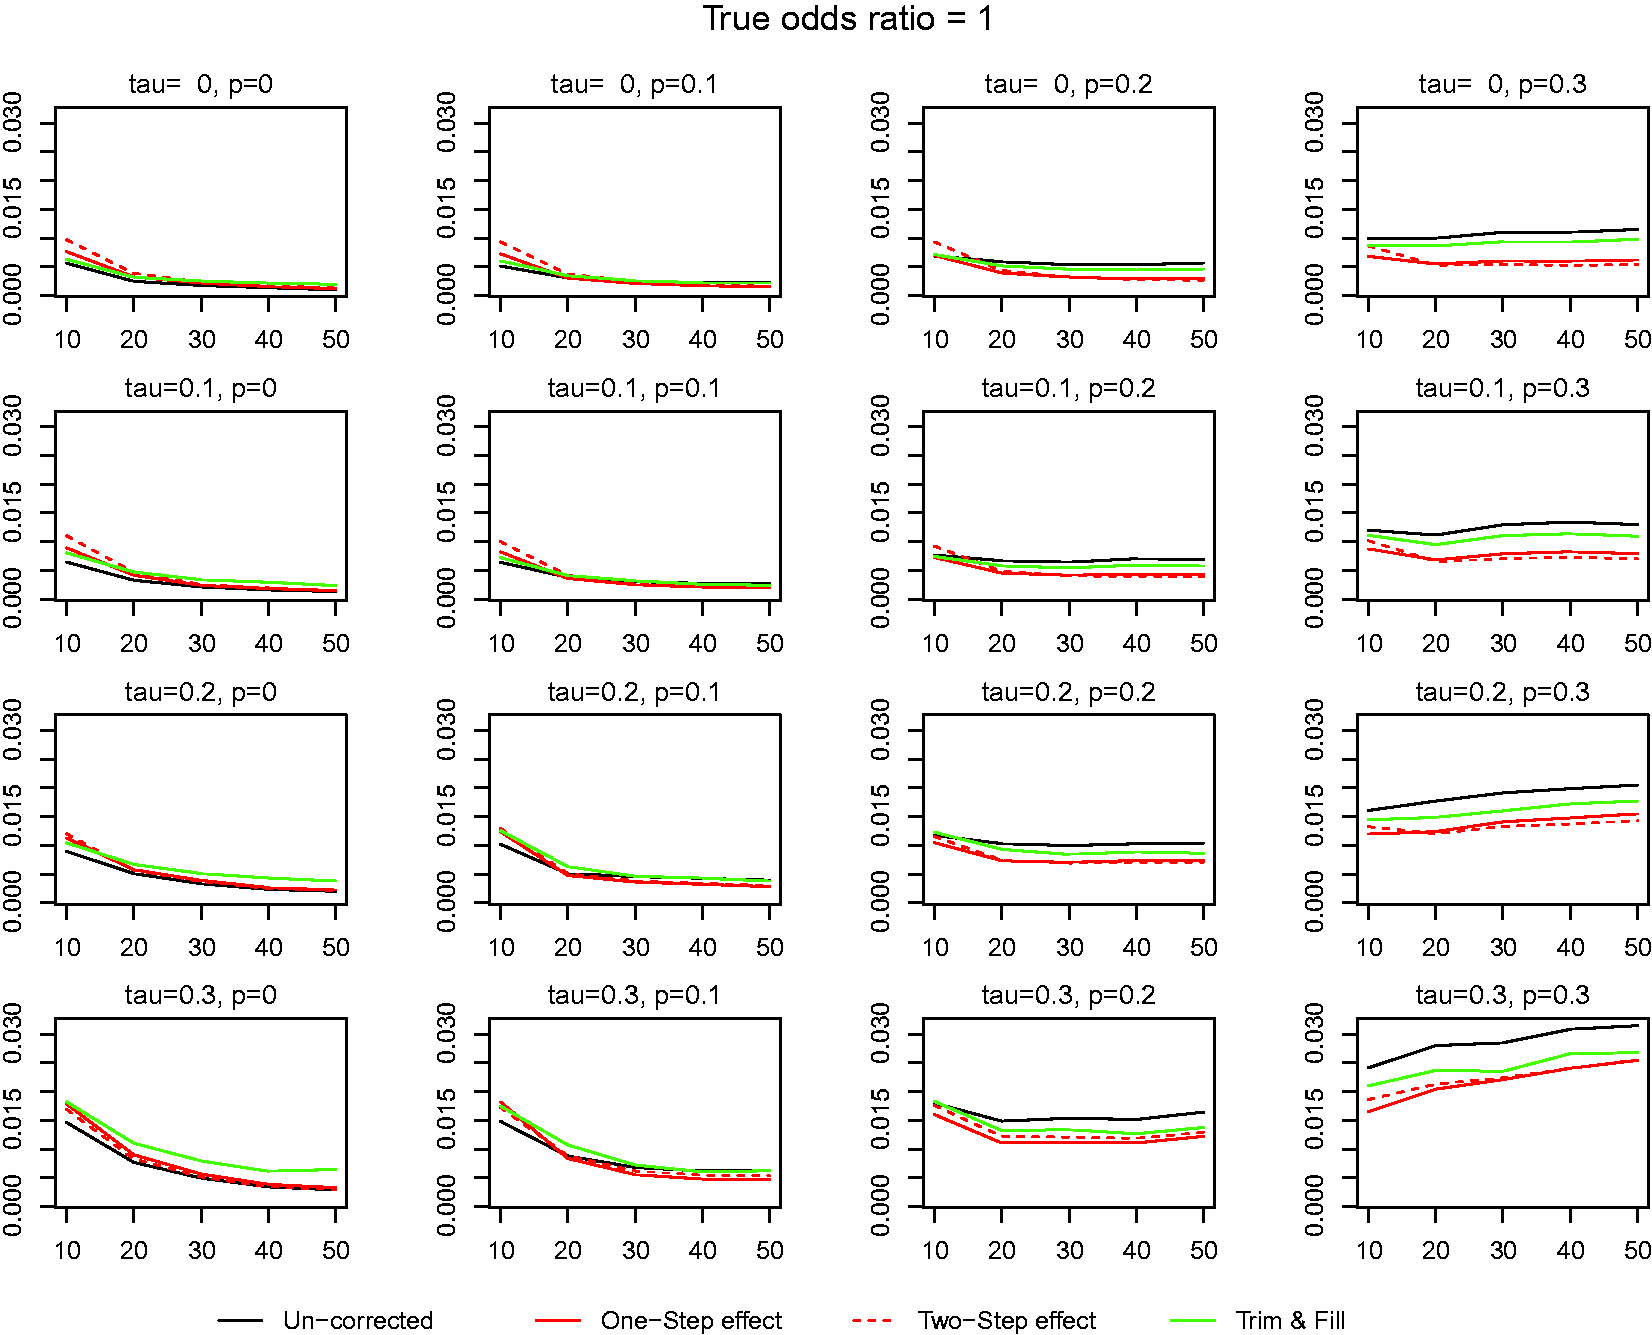
Overall, our estimators consistently perform much better than those of the TF and the uncorrected meta-analysis methods in estimating the global effect size.
4.2.3 Percentage of truncation
We now compare the performance of our estimator with the TF method in their ability to determine the severity of publication bias. The bias of the estimated percentages of truncation is presented in Figure 4. Our estimator is calculated as the average truncation probabilities for all included studies. The TF estimator is calculated as Bias in estimation of the truncation proportion with binary responses. See note for Figure 2.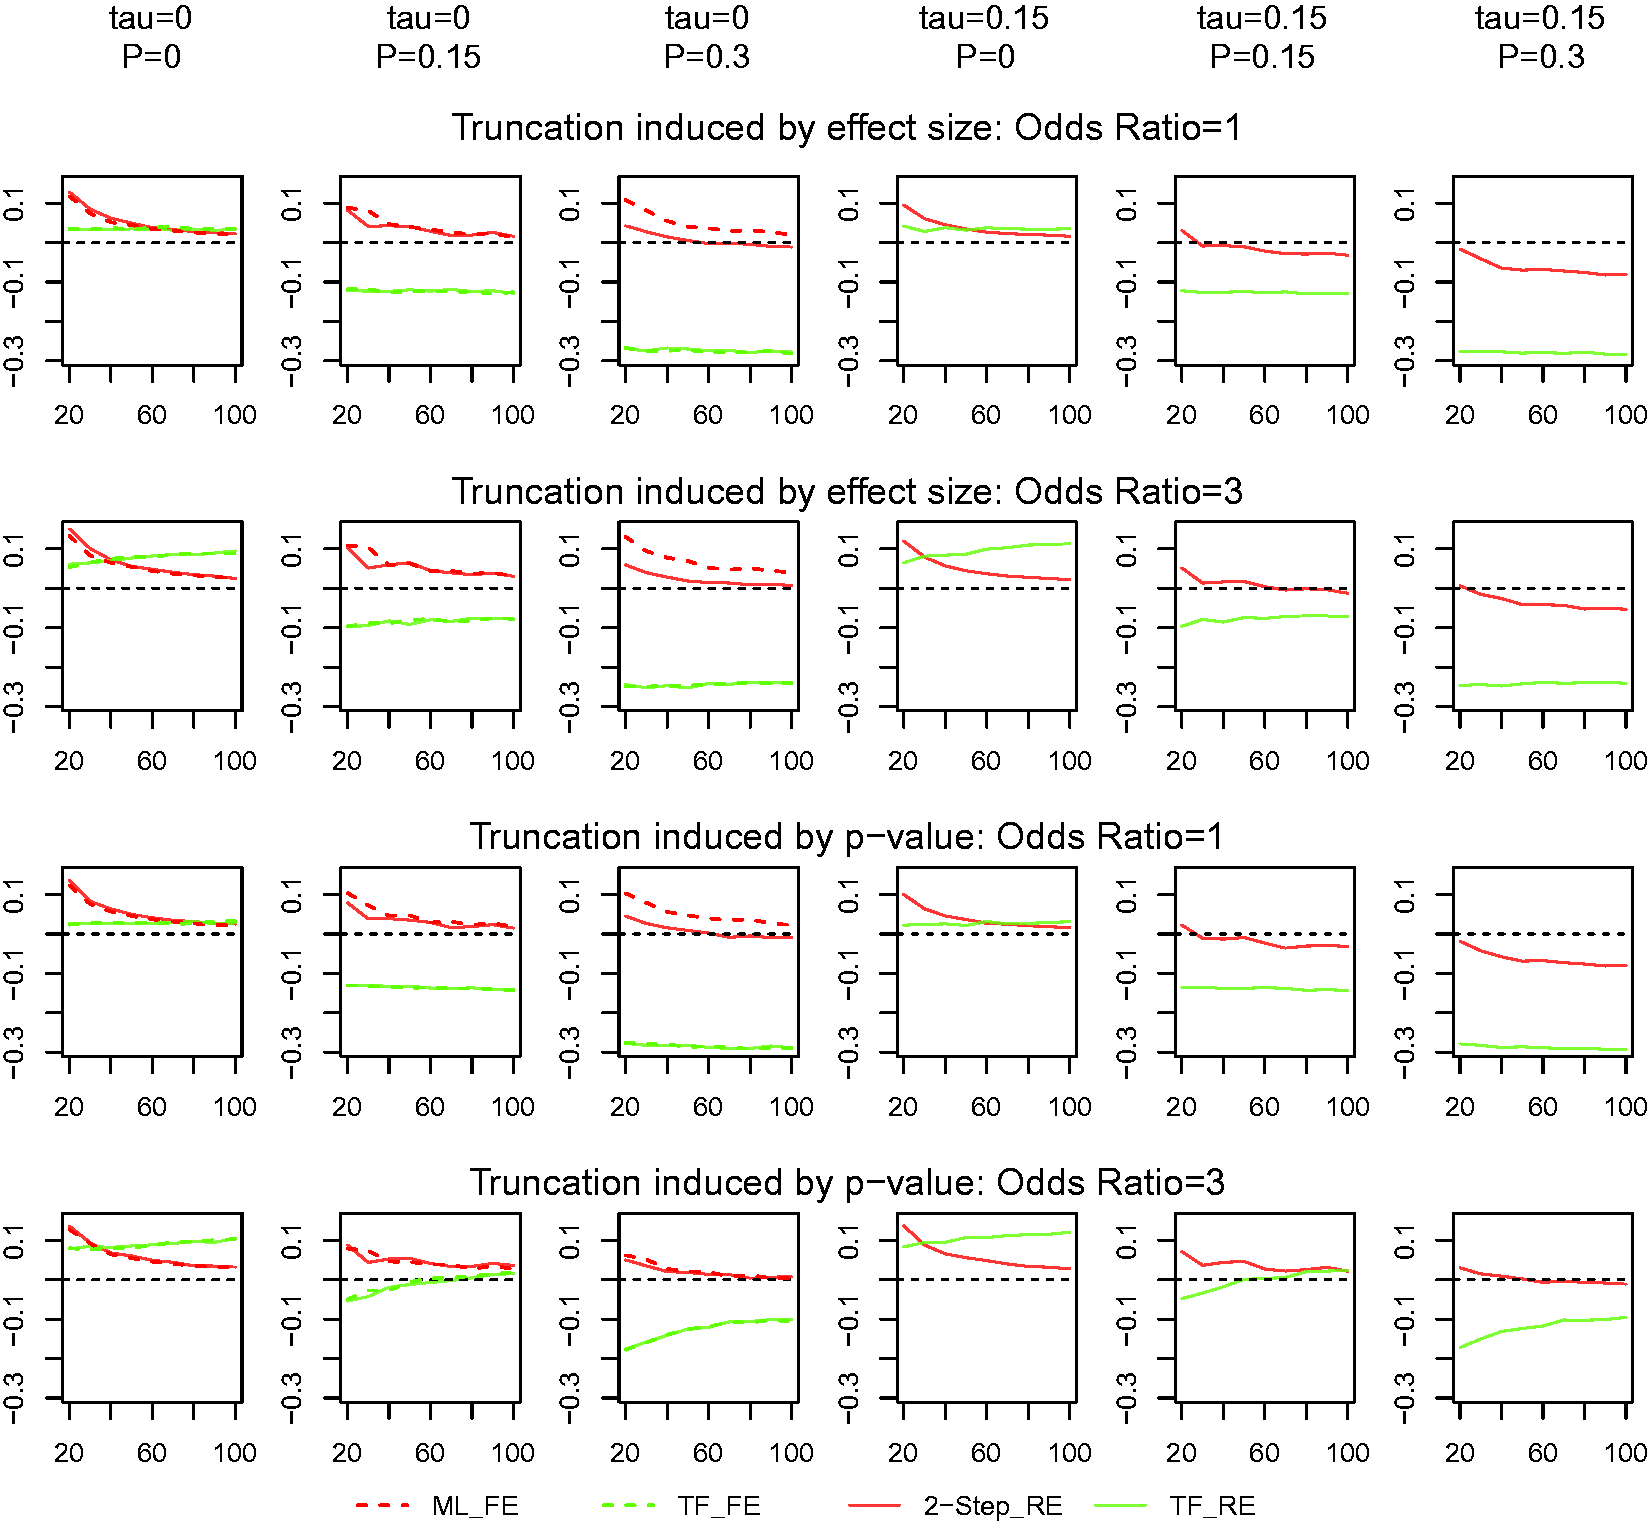
Similarly to the performance of the estimated global mean, the TF estimator produces the largest bias, regardless whether we consider a fixed or a random-effects model and whether the meta-analysis concerns with continuous or binary response. When there is no truncation, the bias is positive, but when there is substantial truncation, it is negative, and it increases in magnitude with the increase of truncation proportion. The bias increases as the sample size increases when the underlying effect size is large (OR = 3). Again, the performance of our estimators is quite consistent in most situations. It has a slightly positive bias (overestimating the severity of truncation), but the bias decreases as the number of studies increases. When there is large between-study variation, the bias decreases and may become negative, but it is still much smaller than the TF estimator in magnitude. When data are from a fixed-effects model, both the maximum likelihood estimator and the two-step estimator perform similarly, but the two-step estimator has a smaller bias than the maximum likelihood estimator. Figure 5 shows the MSE in estimating the truncation proportion. Similar to the pattern observed in Figure 3, our methods consistently had smaller MSE than those using the TF method.
MSE in estimating the truncation proportion with binary responses. See note for Figure 2. One-step and two-step effects refer to the method of moments updated once and twice, respectively, assuming truncation by small effect size.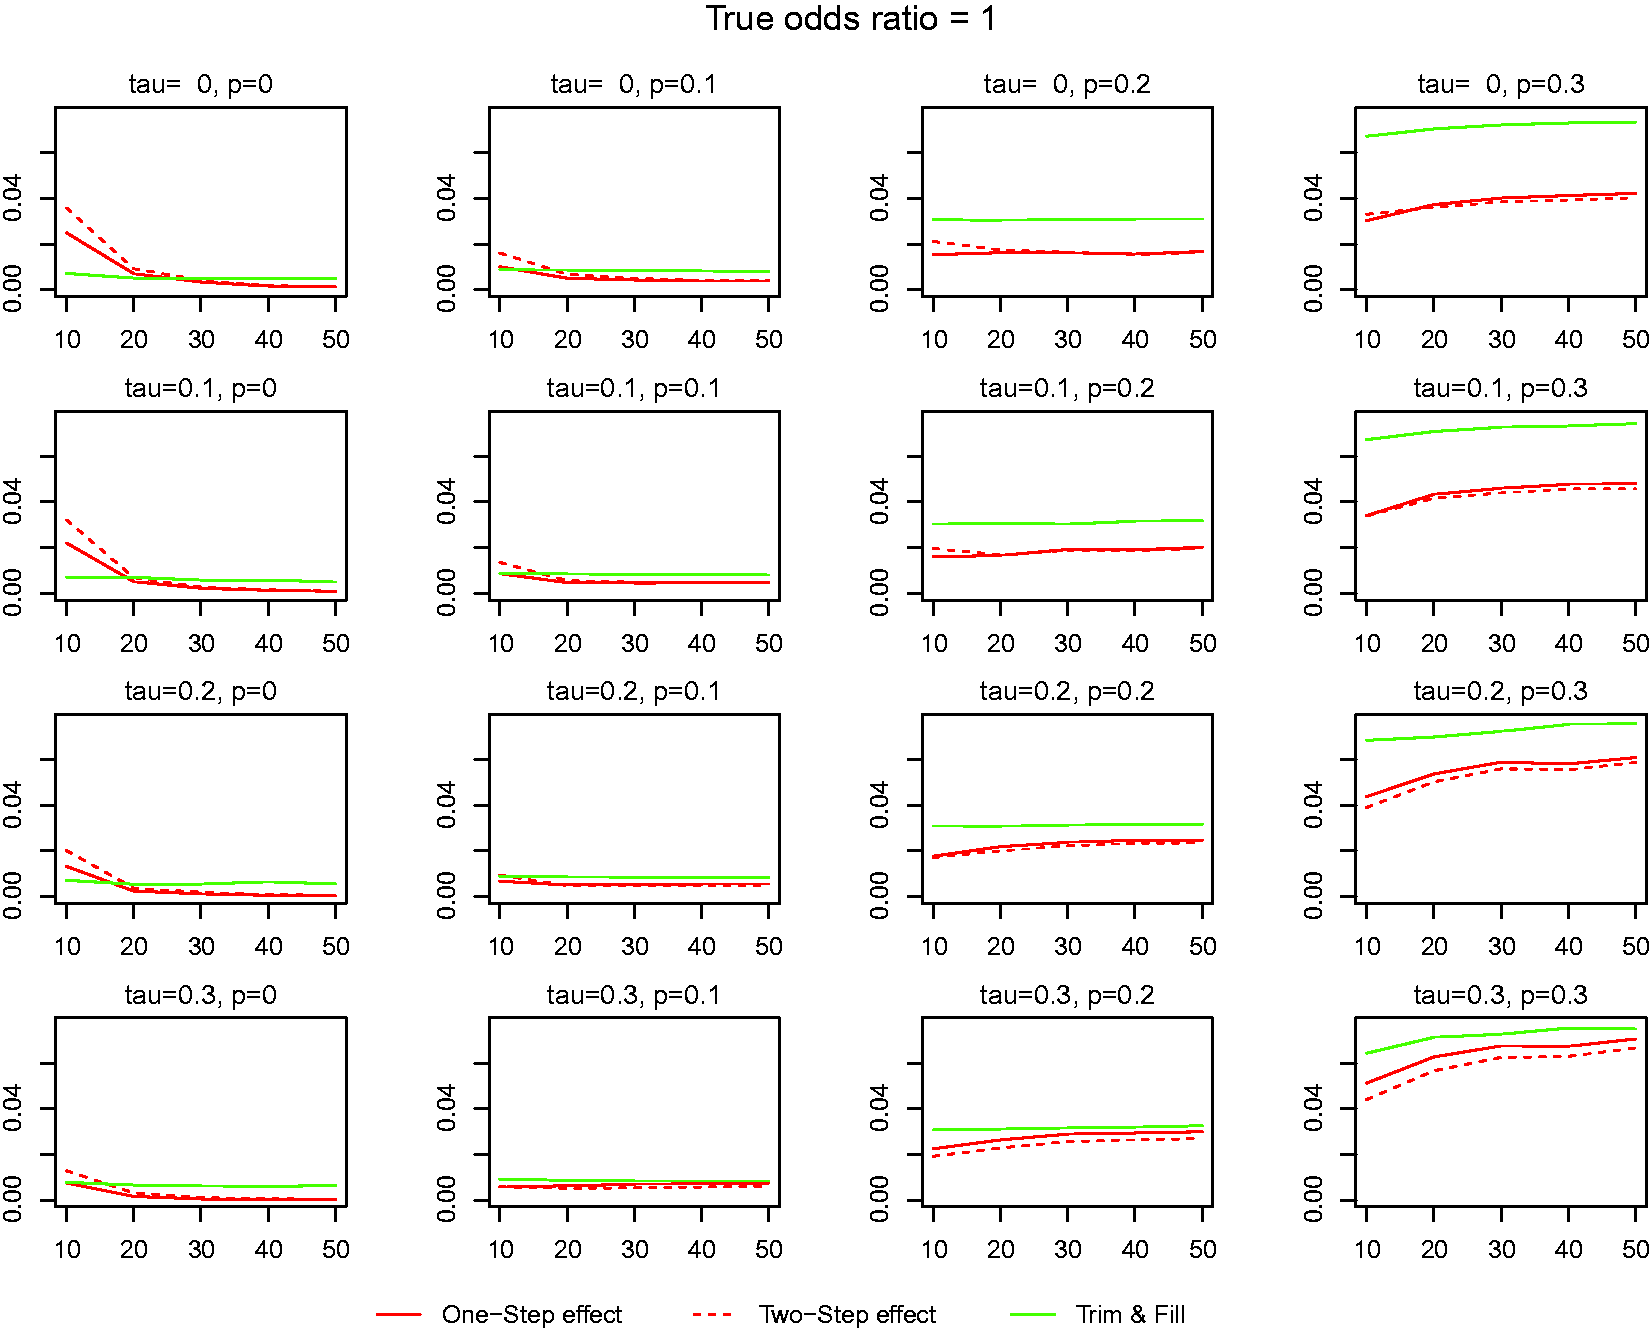
4.2.4 Coverage of nominal 95% confidence interval for the global mean
Finally, we compare the coverage probabilities of the two estimation methods. The R package Coverage of 95% CI for the global mean with binary responses. See note for Figure 2.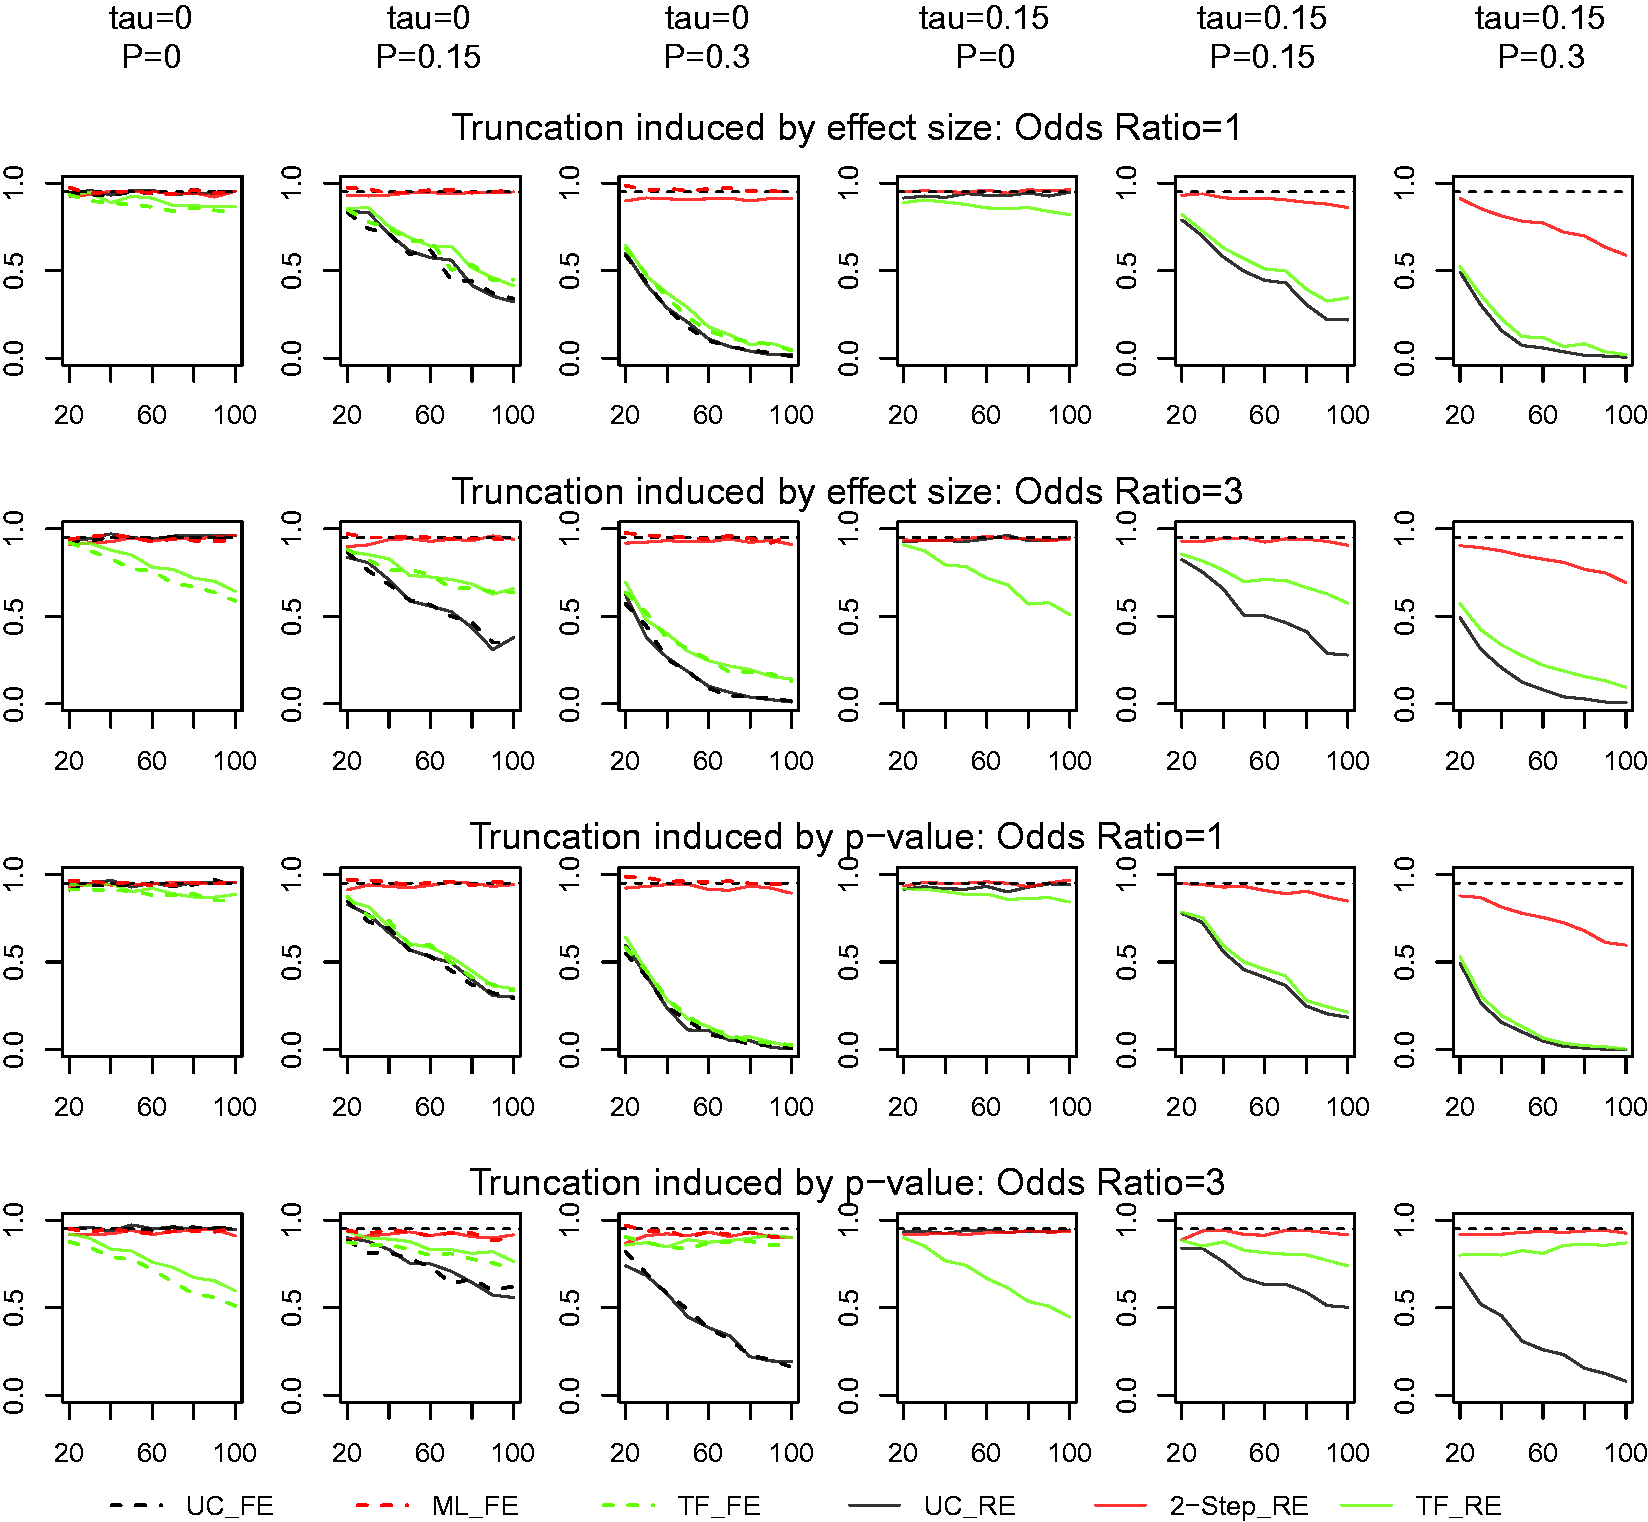
The coverage probability for the global mean in our approach is very close to the nominal 95% level in almost all situations, except when the truncation proportion and the between-study variation are large. Under a fixed-effects model, both the maximum likelihood and two-step estimators are very similar in performance. On the other hand, the coverage probability of the TF estimates is far less than the nominal 95% coverage, even when there is no truncation, and it gets worse as the proportion of truncation gets large and as the number of studies gets large.
In summary, our proposed estimators are shown to outperform the TF method in detecting and correcting for the bias of estimating the effect size and the truncation proportion whether the truncation is due to small effect size or large p-value. It outperforms on the coverage probability as well. Although not shown (available upon request), our approach performs consistently better in estimating τ than either the TF method or the uncorrected approach. We also examined their performance in relatively small samples. At n = 10 with p = .4, the meta-analysis would involve just six studies. As depicted in Figures 3 and 5, while the bias and therefore the MSE are higher than when the sample size is larger, this issue is shown to be common to all methods. However, the general pattern remains and ours outperform the other methods. We recommend the two-step method to be the best overall.
4.3 Comparing with selection methods
Note that both our proposed method and the TF method assume the “Suppressed Bernoulli Model” for the induction of publication bias. Unlike the selection methods approach, this assumption may seem infeasible or too strong in real applications, as it can be viewed as using a weight of 1 for larger effect size (smaller p-value) and 0 for smaller effect size (larger p-value). However, when compared to the selection methods, our approach requires fewer number of studies and is easier to implement.
To examine and compare the empirical performance of our approach against the selection method approach, we also conduct simulations by including randomly selected studies back in the meta-analysis, which were initially excluded. This effectively provides us with sensitivity analysis results for using the truncation points in equations (8) and (14). We then apply our approach, the TF method, and the Dear–Begg 7 selection method. 33 The results were similar to those shown here: not only that our method still out-perform the TF method in terms of the estimation bias of the underlying overall effect size and the percentage of publication bias, but also when compared to the Selection method, our method has smaller estimation bias for the overall effect size, especially when there is a severe truncation. These results are omitted here, but available upon request.
5 Meta-analysis of passive smoking studies
We now apply our methods to assess and analyze possible publication bias and correct the estimation of overall effect using the data set from Hackshaw et al. 34
Hackshaw et al. 34 conducted a meta-analysis of 37 studies (4 cohort studies and 33 case-control studies), comparing the risk of lung cancer between two groups of women. One group consists of non-smoking women living with currently smoking spouses, and the other consists of non-smoking women living with spouses who have never smoked. The goal was to estimate the risk of lung cancer in non-smokers who were exposed to second-hand (passive) tobacco smoking. This data set, which has been re-analyzed by many other investigators since its publication,35–37 has generated heated debate about a possible publication bias unaccounted for.
Figure 7 is the funnel plot of the data set displayed by their relative risks against their standard error in a log scale. The funnel plot indicates obvious asymmetry. However, a visual inspection does not provide a definite conclusion. The original authors
34
concluded that there is no evidence of publication bias based on the Failsafe N idea. On the other hand, Copas and Shi
35
examined the relationship between the relative risks and their corresponding uncertainty measures and concluded that publication bias could not be exempted.
Funnel plot for the passive smoking meta-analysis.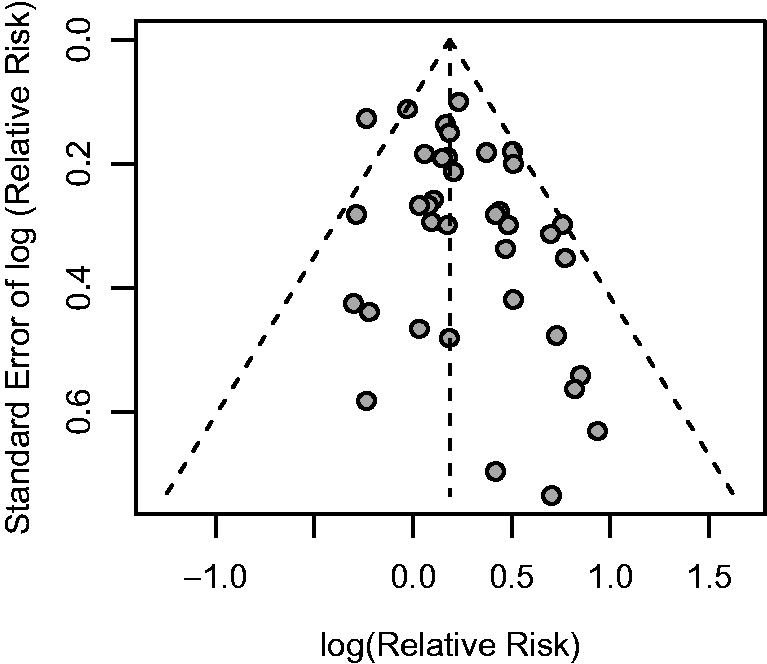
Parameter estimates and their 95% CI for the passive smoking data.
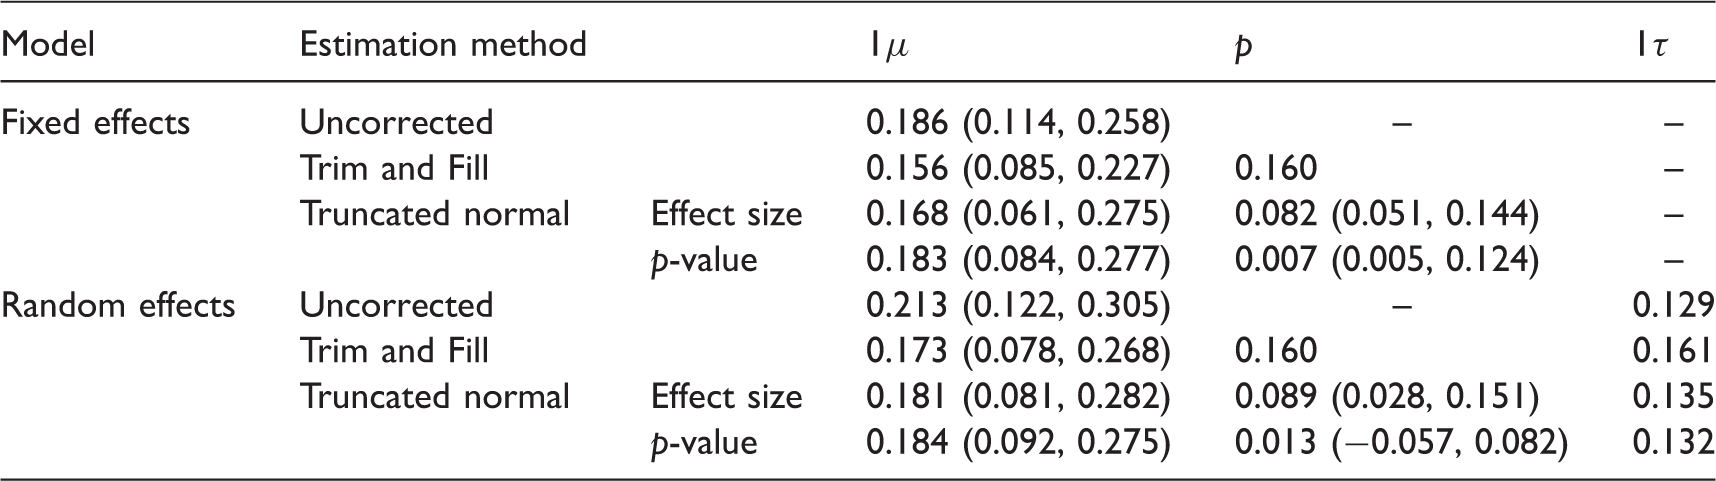
For the overall effect (i.e. relative risk) estimation, all methods produce significant results under both fixed and random-effects models, with the uncorrected estimate being the largest, and the TF method being the smallest. The TF method fills seven studies, and thus the truncation proportion is
In estimating the between-study standard error under random-effects model, all methods produce estimates ranging from 0.13 to 0.16. Our approach also gives the bootstrap confidence intervals as (.018, .251) and (.016, .247) for truncation by effect size and p-value, respectively. The estimates of the truncation proportions are very similar to the estimates under fixed-effects model. From the results of our method under random-effects model assumption, it shows that there may be significant heterogeneity among the studies, and the asymmetry of funnel plot may has been caused by heterogeneity, rather than truncation of some studies leading to publication bias. But because the TF method cannot distinguish heterogeneity from asymmetry, even though it produces large between-study standard error (
6 Discussion
By modeling publication bias as truncation to a normal distribution, we have developed a new parametric approach to deal with publication bias in meta-analysis. Simulation study results indicate that our approach has the following desirable properties: It combines the detection and correction for publication bias; It has a smaller bias; It can handle publication bias induced by the two main mechanisms, by small effect size and by large p-value; and it works well under various levels of severity of truncation. Furthermore, with random-effects model, our approach can distinguish heterogeneity from publication bias.
Our model includes two primary parameters, the underlying overall effect size μ and the truncation point k or t. The estimated truncation point k or t can be used to estimate p for determining the percentage of truncation. This approach is different from methodologies based on a funnel plot, such as Begg and Mazumdar’s 18 rank correlation test and Egger’s regression test, 17 where the focus is on detecting the asymmetry of the funnel plot. These methodologies do not provide an estimate of the severity of publication bias, nor do they provide for correction of the bias in the overall effect size estimation. Gleser and Olkin 38 used the distribution of p-values from individual studies to estimate the number of unpublished studies, but they do not provide estimates of effect sizes for unpublished studies, and thus cannot provide a correction based on the number of unpublished studies alone.
Our approach is similar to the TF method in that it estimates the number of unpublished studies and corrects the estimate of the overall effects for publication bias. However, as shown in our simulation study and previous simulation studies, 23 the performance of the TF method is less than satisfactory, as it severely underestimates the number of unpublished studies with a large bias in estimating the overall effect, especially when the truncation proportion is severe and/or large heterogeneity among studies. In these situations, the TF method is only slightly better than the uncorrected estimator. Further, unlike selection model approaches, ours does not require an impractically large number of studies, and does not rely on an arbitrary choice of weight functions.
A novel feature of our approach is that we distinguish between the two main causes of publication bias (a small effect size and a large p-value) and develop maximum likelihood functions for respective truncation mechanisms. Simulation results show that our approach works well under both truncation mechanisms. Funnel plot-based methods do not consider the difference between these two mechanisms, and focus on effect size only (i.e. TF). In real application, truncation and thus publication bias may be a combined effect of both a small effect size and a large p-value, and thus it might be desirable to develop a method that can handle both mechanisms at the same time. We provided methods for dealing with these two mechanisms, and researchers can determine which mechanism best fit the data. One could apply both and assess the results accordingly.
Simulation results also indicate that our truncated normal distribution approach works consistently well whether there is no, mild or severe truncation. The bias in estimation for both the overall effect size and the proportion of truncation is rather similar regardless of the level of truncation. On the other hand, both the uncorrected and the TF estimators are severely affected by the level of truncation: the magnitude of bias increases with the severity of truncation.
It is well recognized that heterogeneity is another source of asymmetry in funnel plots.15,17,23 The TF method cannot distinguish heterogeneity from publication bias. Thus, even when there is no truncation, it still fills some studies. This explains the negative bias in the estimated overall effect size and the positive bias in the estimated truncation proportion by the TF method in Figures 1 and 2 for
Finally, it is worth further noting that both our method and the TF method have the same assumption that suppression happens with the most extreme left-most values, and use the same normal distribution assumption in obtaining the underlying overall effect size. The only difference lies in the way of determining the cut-off point or the number of suppressed studies. The TF method uses non-parametric (rank) approach, which ignores the distributional property of the effect sizes, even though this distributional property is utilized in the calculation of overall effect size. Our method estimates the cut-off point and utilizes the same distributional property of the effect sizes in both determining the cut-off point and calculating the overall effect size. A consequence of the lack of distributional assumption of the TF method is that when the standard errors of effect sizes are very close, or in the extreme case that all the standard errors are equal, no matter how many studies are suppressed on the left, the funnel plot will always be symmetric. Thus, the TF method will not be able to detect any publication bias at all. On the other hand, the distribution of the remaining effect sizes will be skewed to the right, and thus our method can still detect the existence of publication bias. While the new strategy we developed was shown to improve the existing current methods in all aspects we considered, further work is needed to improve the limitations we observed, especially with meta-analyses using small samples.
Footnotes
Declaration of conflicting interests
The author(s) declared no potential conflicts of interest with respect to the research, authorship, and/or publication of this article.
Funding
The author(s) disclosed receipt of the following financial support for the research, authorship, and/or publication of this article: This work was funded in part by a grant from the Natural Sciences and Engineering Council of Canada.