Pooled testing is useful to identify positive specimens for large-scale screening. Matrix pooling is one of the commonly used algorithms. In this work, we investigate the properties of matrix pooling and reveal that the efficiency of matrix pooling is related with the magnitude of overlapping among groups. Based on this property, we develop a new design to further improve the efficiency while taking into account of testing error. The efficiency, pooling sensitivity and specificity of this algorithm are explicitly derived and verified through plasmode simulation of detecting acute human immunodeficiency virus among patients who were suspected to have malaria in rural Ugandan. We show that the new design outperforms matrix pooling in efficiency while retain the pooling sensitivity and specificity.
Screening for transfusion-transmissible infections is important in national blood programs to ensure the safety of blood supply.1,2 A recent survey in China shows that the seroprevalence of human immunodeficiency virus (HIV), hepatitis B and C viruses, and Treponema pallidum among 211,639 blood donors were 0.08%, 0.51%, 0.20% and 0.57%, respectively.3 Blood donation during seronegative ‘window period’ is considered as the greatest threat to the safety of blood supply.4 For HIV, window period donation accounts for at least 90% of risk.5 Nucleic acid amplification tests (NAAT) is proved to be beneficial for blood safety by shortening the window period considerably.6 However, NAAT is very expensive and thus pooled NAAT screening is usually used for its efficiency and cost saving. Pooled testing (or group testing) was originally introduced by Dorfman to screen blood samples for the syphilis antigen in U.S. soldiers during the Second World War.7 It has been widely applied in many fields, such as HIV/AIDS,8,9 agriculture,10,11 genetics12,13 and compressed sensing.14
An essential step in group testing is to design the algorithm.15 For pooled NAAT, there are two types of pooling design: minipool and matrix pooling.16,17 Minipool is a type of Dorfman’s algorithm, where non-overlapped groups are screened in the first stage. Matrix pooling (or two-dimensional array-based group testing algorithm) is performed through placing specimens in an array and then screening groups which are formed by rows and by columns.18 Basically, both designs are two-stage approaches, where groups are screened parallelly in the first stage and suspected infections are further screened individually in the second stage. As pointed out, matrix pooling outperforms minipool in efficiency and negative predictive value.19 Matrix pooling is widely used in high throughput screening, for example, to identify of individuals with acute HIV infections,20 and to uncover of DNA variants.21–23 In this study, we will focus on this type of group testing algorithm.
Efficiency is the main concern in group testing and is usually used to measure the performance of a group testing algorithm.24–26 To improve efficiency, Berger et al.27 proposed three-dimensional extensions of two-dimensional pooling approach. Sudbury28 proposed an array-based algorithm using a selection design, but did not provide an instruction on how to construct such a design. Both studies assume perfect sensitivity and specificity of the screening tool. However, the screening tool is not perfect in practice.29 Kim et al.24 studied the operating characteristics of square array-based testing algorithms in the presence of testing error. Hedt and Pagano30 proposed to improve the square array scheme through using the halving strategy for retesting. In this study, we aim to develop a more flexible and efficient array-based algorithm than the square array scheme in the presence of testing error.
This paper is organized as follows. In Section 2, we investigate the characteristics of matrix pooling and propose a general design for group testing, along with an approach to construct the design. Considering misclassification, we investigate the operating characteristics of our algorithm including the efficiency, pooling sensitivity and specificity. In Section 3, we conduct simulation studies and a real data analysis to explore the performances of our proposed algorithm. Some discussions are given in Section 4. All the technical details are presented in the Supplemental Material.
2 Method
2.1 The properties of matrix pooling
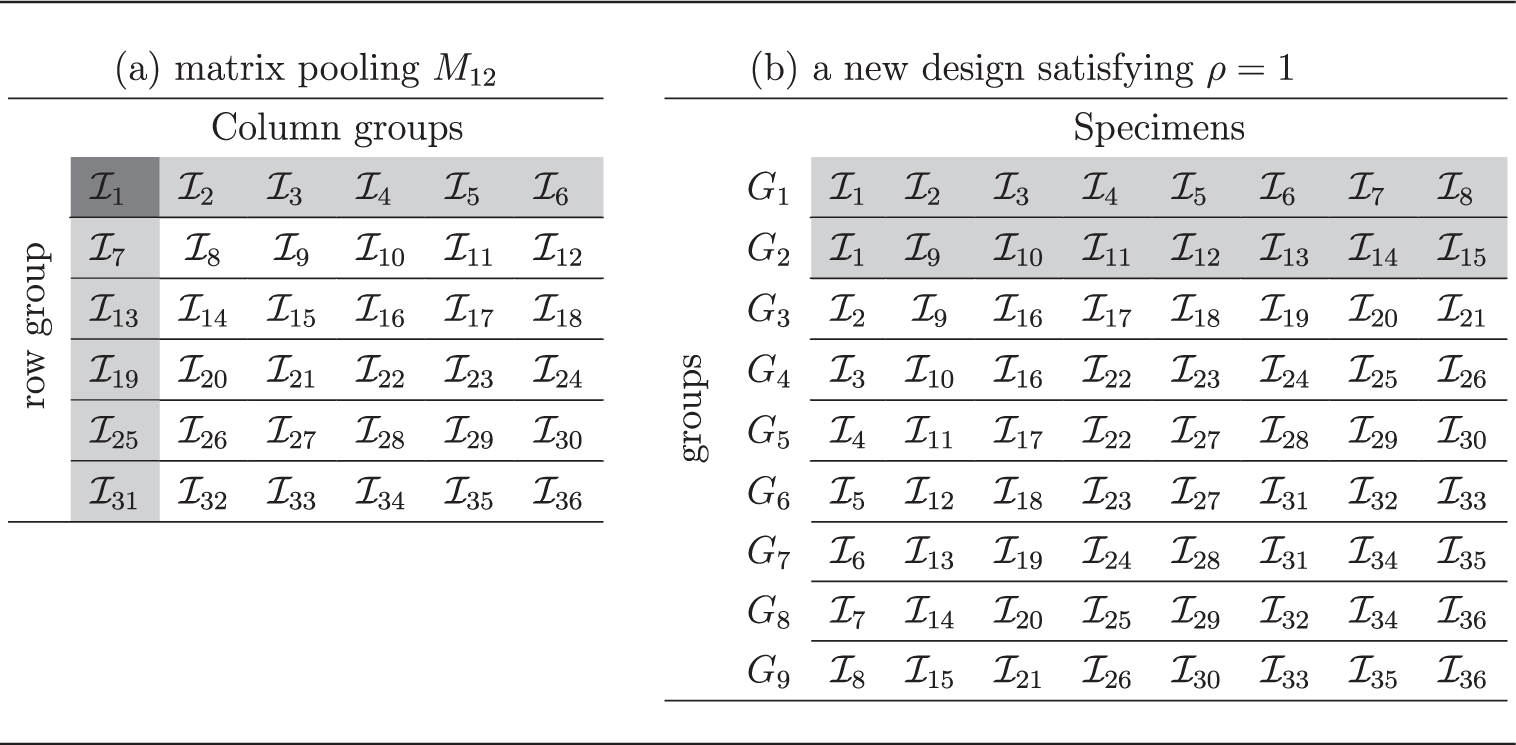
Suppose N specimens are denoted by a set They are assigned into m groups, Consider equal sized groups and denote matrix pooling with m groups by Mm. Table 1(a) shows the design of M12. The specimens are placed in an array. Each row or each column forms a group. Shown by Table 1(a), the highlighted specimen is the intersection of the first row group and the first column group. Each specimen is covered by one row group and one column group. This property is formulated as
where denotes the number of elements contained in the set a. Denote an equal sized group testing algorithm satisfying the property (*) by Ak,m, where k is the group size.
The pooling design for 36 specimens.
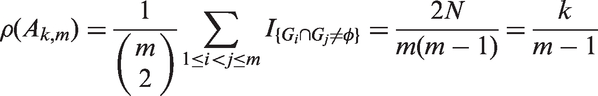
Note that Mm is a special case of Ak,m, with m = 2k. Generally, we have the following relationship: mk = 2N for the design Ak,m. Table 1(a) also explains that there is no intersection between row groups or between column groups. To describe the magnitude of overlapping, we define a measurement ρ as follows
For the design M12, we have If we increase ρ, e.g. to impose any two groups have a common specimen, will the efficiency of the corresponding group testing algorithm be improved?
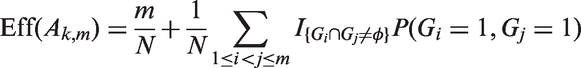
To answer this question, we first investigate the relationship between ρ and the efficiency of Ak,m. Following Kim et al.,24 efficiency is defined as the expected number of tests per specimen, and therefore, a smaller value is better. Denote it by ‘Eff’. Let Gi = 1 if the ith group is tested positive for . Then the efficiency of group testing algorithm Ak,m is defined as
For perfect screening, we have , where derived from the definition of To further show the relationship between and denote by p the proportion of the trait of interest, e.g. the prevalence of a disease. Considering perfect screening, we have the following result.
Proposition 1
For a group testing algorithm Ak,m, there exists an upper bound pu(k) that the efficiency is a decreasing function of ρ if the prevalence p is smaller than
The proof of Proposition 1 is presented in the Supplemental Material, along with a list of the upper bound pu(k). For example, the upper bound is for k = 5. Since the prevalence p is always smaller than pu(k) for rare trait, the efficiency will be improved if we increase The maximum value of is ρ = 1. One feasible design for N = 36 satisfying ρ = 1 is presented in Table 1(b). Each row forms a group. In this design, we just require an initial nine tests for N = 36 specimens. A natural question is how to design the array as Table 1(b) for general cases?
2.2 New design
In this section, we proceed to explore the design satisfying ρ = 1 (e.g. Table 1(b)). We first formally describe the structure of the new design
Denote the above formulas as Criterion (1). The first formula of Criterion (1) shows that there is one common specimen among any two groups. The second one shows that no common specimen is contained in any three groups. The last one reveals that each specimen is the intersection of two groups. This criterion is a special case of the property (*) and infers a group testing algorithm satisfying ρ = 1.
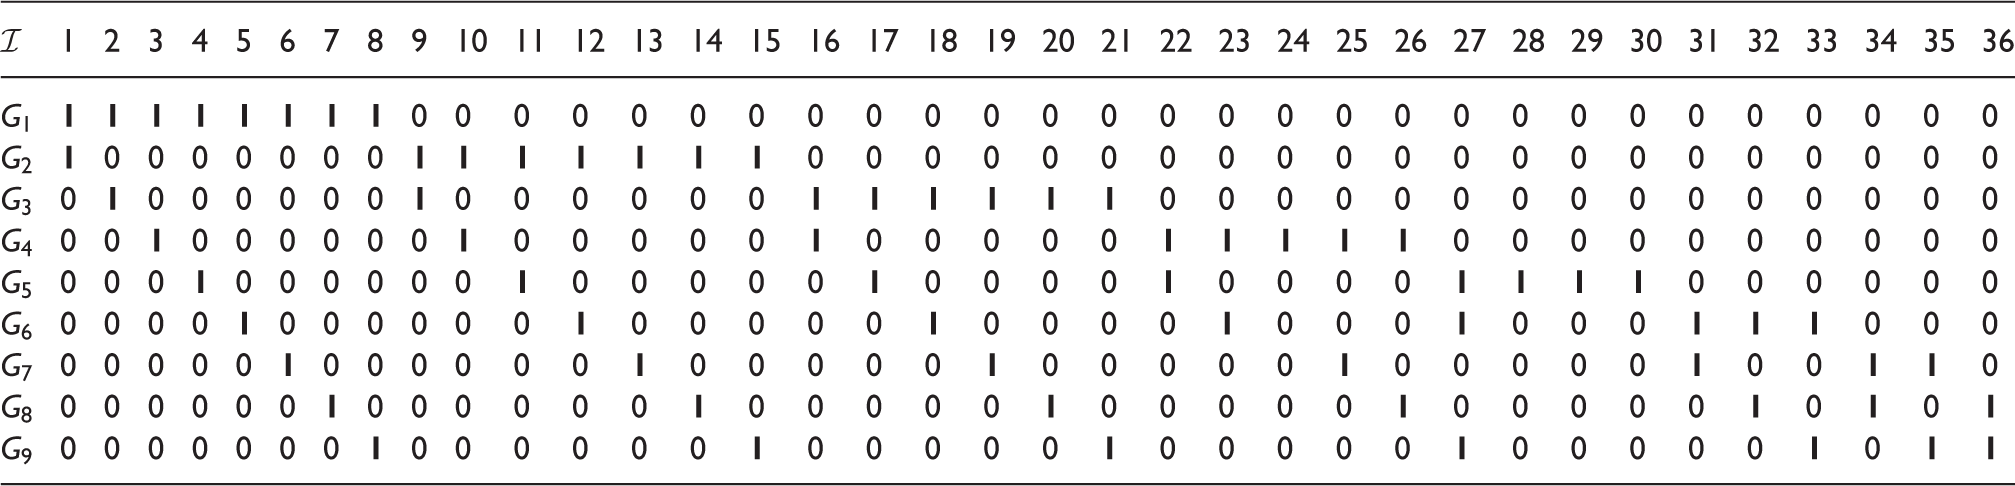
To facilitate the construction process, define a Ak,m as a m × N binary matrix with rows represent groups and columns represent specimens Define the element aij = 1 if the jth specimen is contained in the ith group and aij = 0 otherwise, for and As an example, the new design in Table 1(b) could be formatted as in Table 2. Note that for a design satisfying Criterion (1), the number of specimens is .
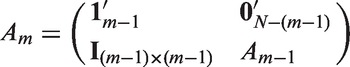
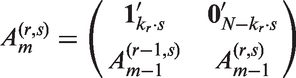
We then show how to obtain Ak,m under Criterion (1) for general cases. If we have and therefore denote the design by Am for short. Let be a l-dimensional column vector with all the elements being 1 and be a l-dimensional column vector with all the elements being 0 for Suppose that the group size is equal. The design Am is formulated as
where denotes the transpose of matrix b and is an identity matrix of size and
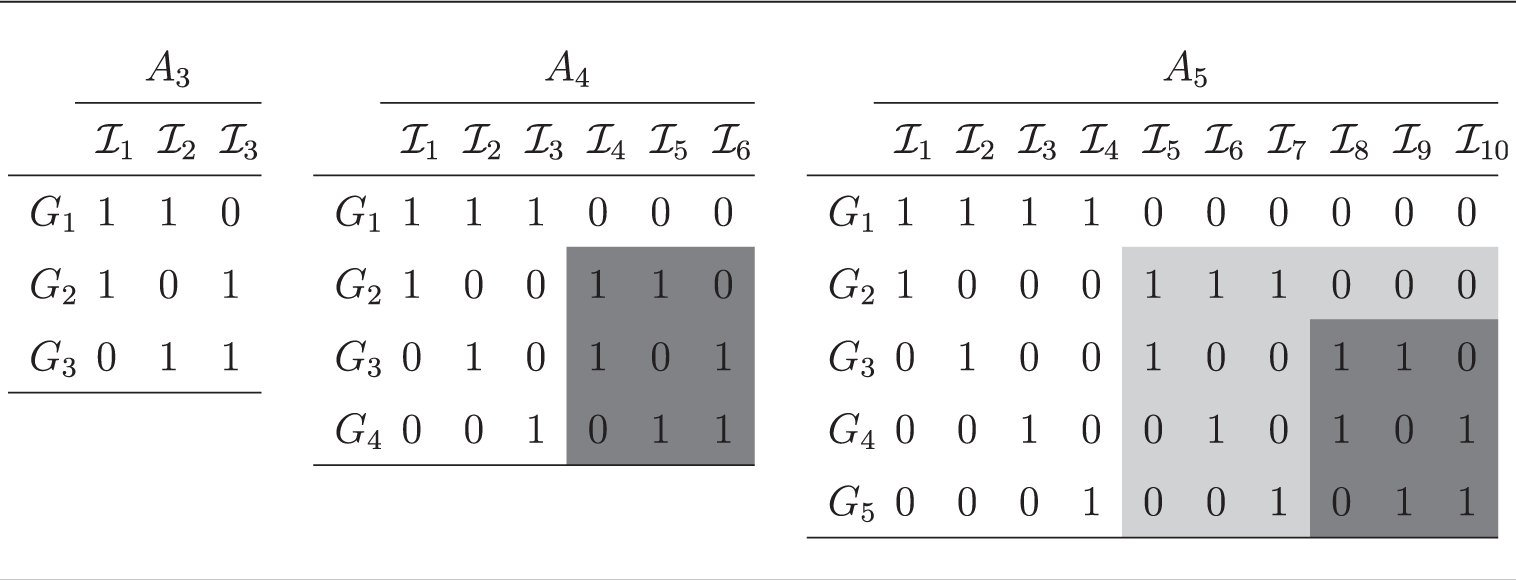
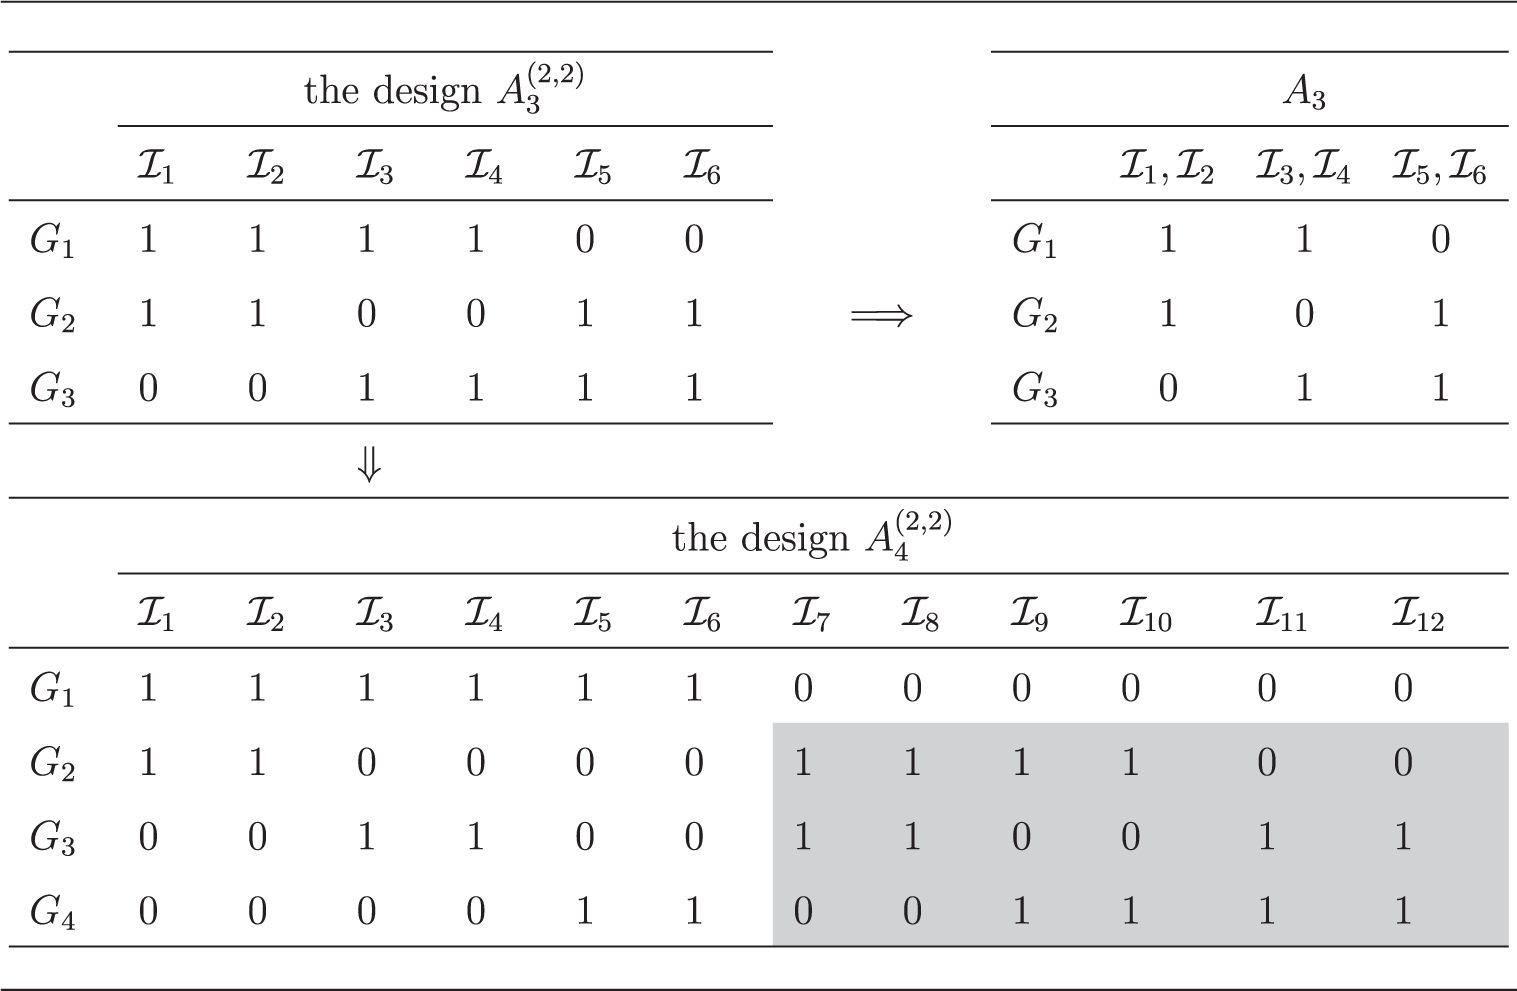
For illustration, we display the design Am with m = 3, 4, 5 in Table 3. The design Am is iteratively constructed based on the design To clearly show this relationship, we highlight A4 in the design and also A3 in the design
The designs .
2.3 The group testing algorithm using the design Am
Considering misclassification, we use the design Am to conduct screening and perform further retesting after the first-stage screening. Let Se and Sp denote the sensitivity and specificity of the screening tool, respectively. Denote and Ii as the true status and observed status of the ith specimen for Now, we list two assumptions:
Assumption 1
i.i.d. follow Bernoulli distribution with parameter p.
Assumption 2
For each test, Se and Sp are independent of the group size.
Assumptions 1 and 2 have been discussed extensively24 and are standard in group testing literature.25
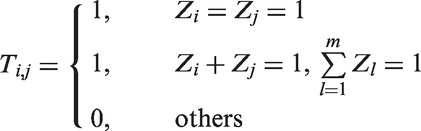
Let Zj = 1 if the jth group of the design Am tests positive and Zj = 0 if negative. Let if the true status of the jth group is positive and otherwise. For any denote the common specimens of by . Suppose that we retest the specimen if the groups all test positive, or if one of tests positive and the remaining groups test negative. The number of tests is defined by where
This retesting rule tells us that retesting is required when the common specimen is suspected to be positive or there is inconsistency among the observed statuses of the groups. Such a situation might be faced in practice due to misclassification. Based on this rule, the expected number of tests is
We proceed to obtain the explicit expression of Denote the number of specimens contained in n groups by As derived from the formulation of any n groups contain the same number of specimens. Therefore, H(n, m) is identical to the number of specimens covered by the first n groups, which is for and Then we have the following result.
Theorem 1
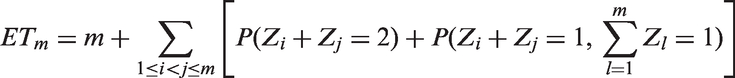
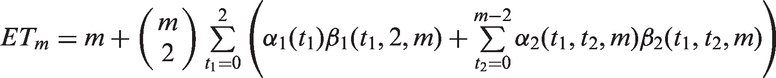
Consider the group testing algorithm using the design Am with retesting rule Under Assumptions 1 and 2, the expected number of tests is
where and
The proof is given in the Supplemental Material. Correspondingly, the efficiency is obtained, For perfect screening, the expected number of tests ETm is which is concordant with the result of Theorem 2 in Sudbury.28
2.4 Comparison of the efficiency of the design Am and Mm
In Proposition 1, we have proved that the efficiency of Ak,m is able to be improved if the measurement ρ is increased. The design Am is an improved version of Mm, since and Proposition 1 only considers perfect screening. In this section, we will consider measurement error and extensively investigate the efficiency of comparing with the efficiency of According to Kim et al.,24 the efficiency of Mm without master pool testing is defined as follows
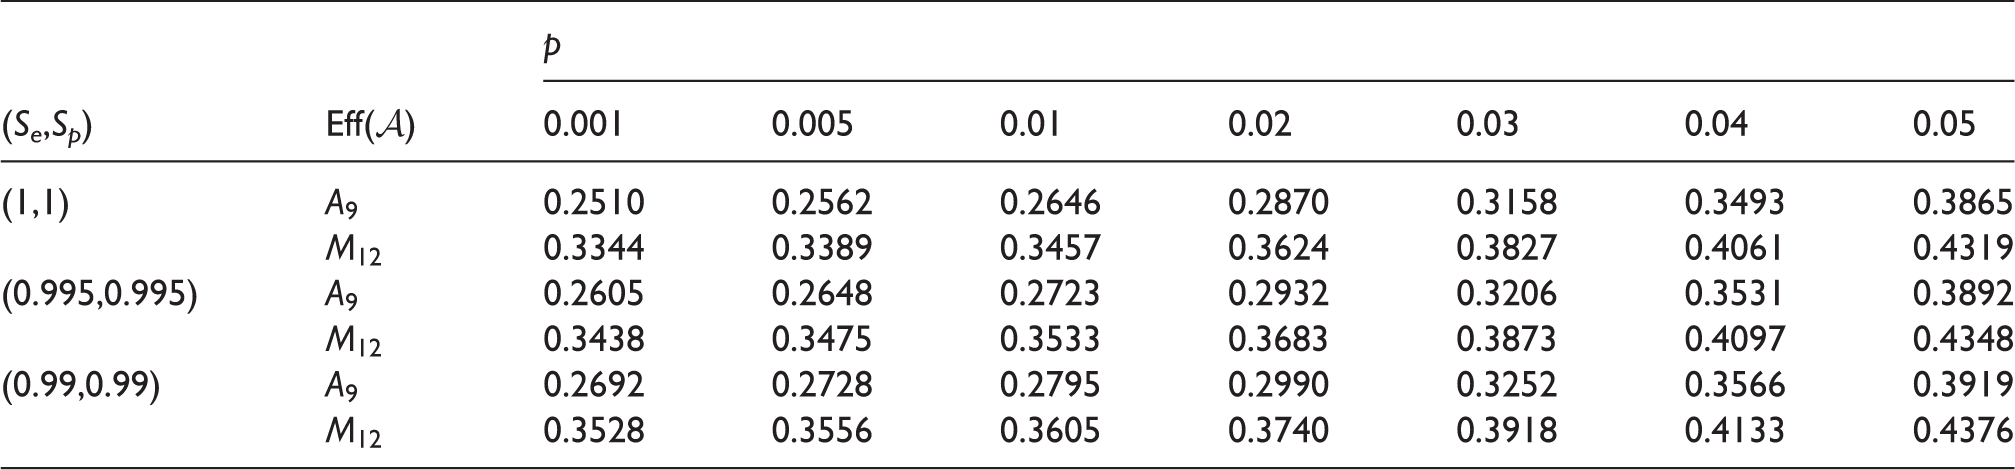
where and the definition of and for i = 0, 1 could refer to Kim et al.24 Specially, we calculated the efficiency of M12 and A9, which are described in Table 1(a) and (b), respectively. The results are presented in Table 4. It shows that our algorithm A9 needs smaller expected number of tests per specimen under different Se, Sp and p.
The expected number of tests per specimen, Eff(A9) and Eff(M12).
(Se,Sp)
Eff()
p
0.001
0.005
0.01
0.02
0.03
0.04
0.05
(1,1)
A9
0.2510
0.2562
0.2646
0.2870
0.3158
0.3493
0.3865
0.3344
0.3389
0.3457
0.3624
0.3827
0.4061
0.4319
(0.995,0.995)
A9
0.2605
0.2648
0.2723
0.2932
0.3206
0.3531
0.3892
0.3438
0.3475
0.3533
0.3683
0.3873
0.4097
0.4348
(0.99,0.99)
A9
0.2692
0.2728
0.2795
0.2990
0.3252
0.3566
0.3919
0.3528
0.3556
0.3605
0.3740
0.3918
0.4133
0.4376
We proceed to explore the relation of and for general cases. Define and , where N is the number of specimens and denotes the maximum integer that is not larger than a. Then the designs and contain nearly the same number of specimens. Moreover, we have the following result, whose proof is given in the Supplemental Material.
Theorem 2
For fixed number of specimens N, there exists a threshold of the prevalence, that the efficiency Eff is smaller than Eff
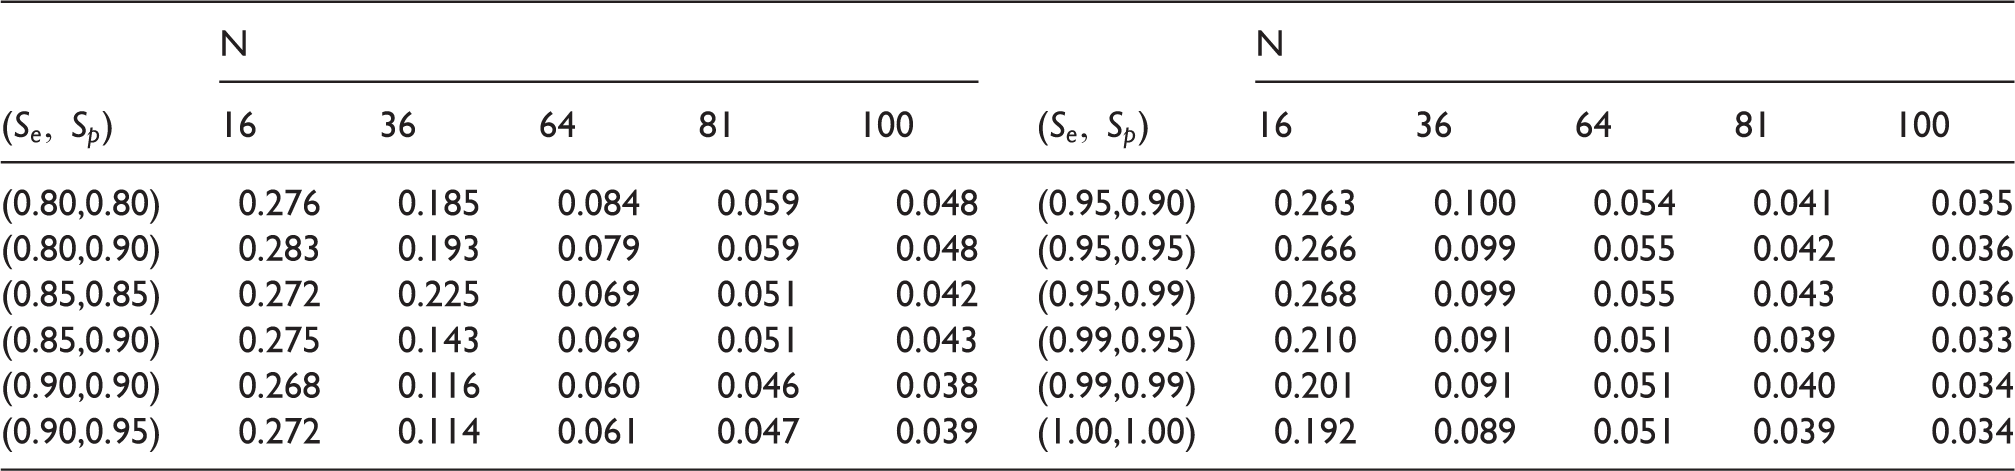
Consider scenarios of the sensitivity Se and specificity Sp ranging from 0.8 to 1 and the number of specimens The threshold pc is calculated through the equation Eff = Eff Results are presented in Table 5. Note that we are interested in rare trait so that the thresholds pc in Table 5 are relatively large. We will investigate the threshold pc more thoroughly in Section 3.1.
The threshold pc for different .
N
N
()
16
36
64
81
100
()
16
36
64
81
100
(0.80,0.80)
0.276
0.185
0.084
0.059
0.048
(0.95,0.90)
0.263
0.100
0.054
0.041
0.035
(0.80,0.90)
0.283
0.193
0.079
0.059
0.048
(0.95,0.95)
0.266
0.099
0.055
0.042
0.036
(0.85,0.85)
0.272
0.225
0.069
0.051
0.042
(0.95,0.99)
0.268
0.099
0.055
0.043
0.036
(0.85,0.90)
0.275
0.143
0.069
0.051
0.043
(0.99,0.95)
0.210
0.091
0.051
0.039
0.033
(0.90,0.90)
0.268
0.116
0.060
0.046
0.038
(0.99,0.99)
0.201
0.091
0.051
0.040
0.034
(0.90,0.95)
0.272
0.114
0.061
0.047
0.039
(1.00,1.00)
0.192
0.089
0.051
0.039
0.034
Additionally, pooling sensitivity and pooling specificity are also important operating characteristics of a group testing algorithm. As defined in group testing literature,24,26,29 pooling specificity is the probability a specimen is diagnosed as negative by a particular pooling procedure given that specimen is truly negative; pooling sensitivity is the probability a specimen is diagnosed as positive by a particular pooling procedure given that specimen is truly positive. Denote the pooling sensitivity and pooling specificity of our algorithm by and Based on Assumptions 1, 2 and Theorem 1, let and Then we have
The detailed derivation of and is presented in the Supplemental Material. These characteristics of our extended array-based design Am are extensively studied in Section 3.2.
2.5 Extension
In this section, we generalize Criterion (1) to enable more groups to have common specimens. It mimics the generalization from two-dimensional array-based group testing algorithm to three-dimensional array-based group testing algorithm.27 Specifically, the generalized criterion is as follows
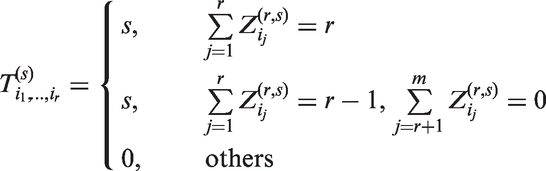
This criterion tells that there are s common specimens among r groups and no common specimen is contained in any r + 1 groups. All N specimens are covered by m groups.
Criterion (1) is a special case of Criterion (2). Especially, the individual testing is the case of Denote the design under this rule by which is
where kr is defined as Note that the design Am is short for For illustration, we display the design and in Table 6, along with the design
The designs .
Take a close look at the design If we tie up every two specimens, then the design reduces to A3 with new ‘specimen's. Let if the ith group of the design is tested positive and if negative. Let if the true status of the ith group is positive and otherwise. Suppose we retest the ‘specimen’ individually if the groups are all tested positive or if r – 1 groups of are tested positive and the remaining groups are tested negative. Since the ‘specimen’ contains s specimens, the number of tests is defined by with
Therefore, the expected number of tests is
The explicit expression of , along with the pooling sensitivity and specificity, is derived and presented in the Supplemental Material.
3 Numerical results
3.1 Threshold and efficiency
In this section, we proceed to investigate the properties of our algorithm comparing with First, we report the threshold within a wide range of sensitivity and specificity. Set the number of specimens for each pool by The number of groups is defined by for our algorithm and for
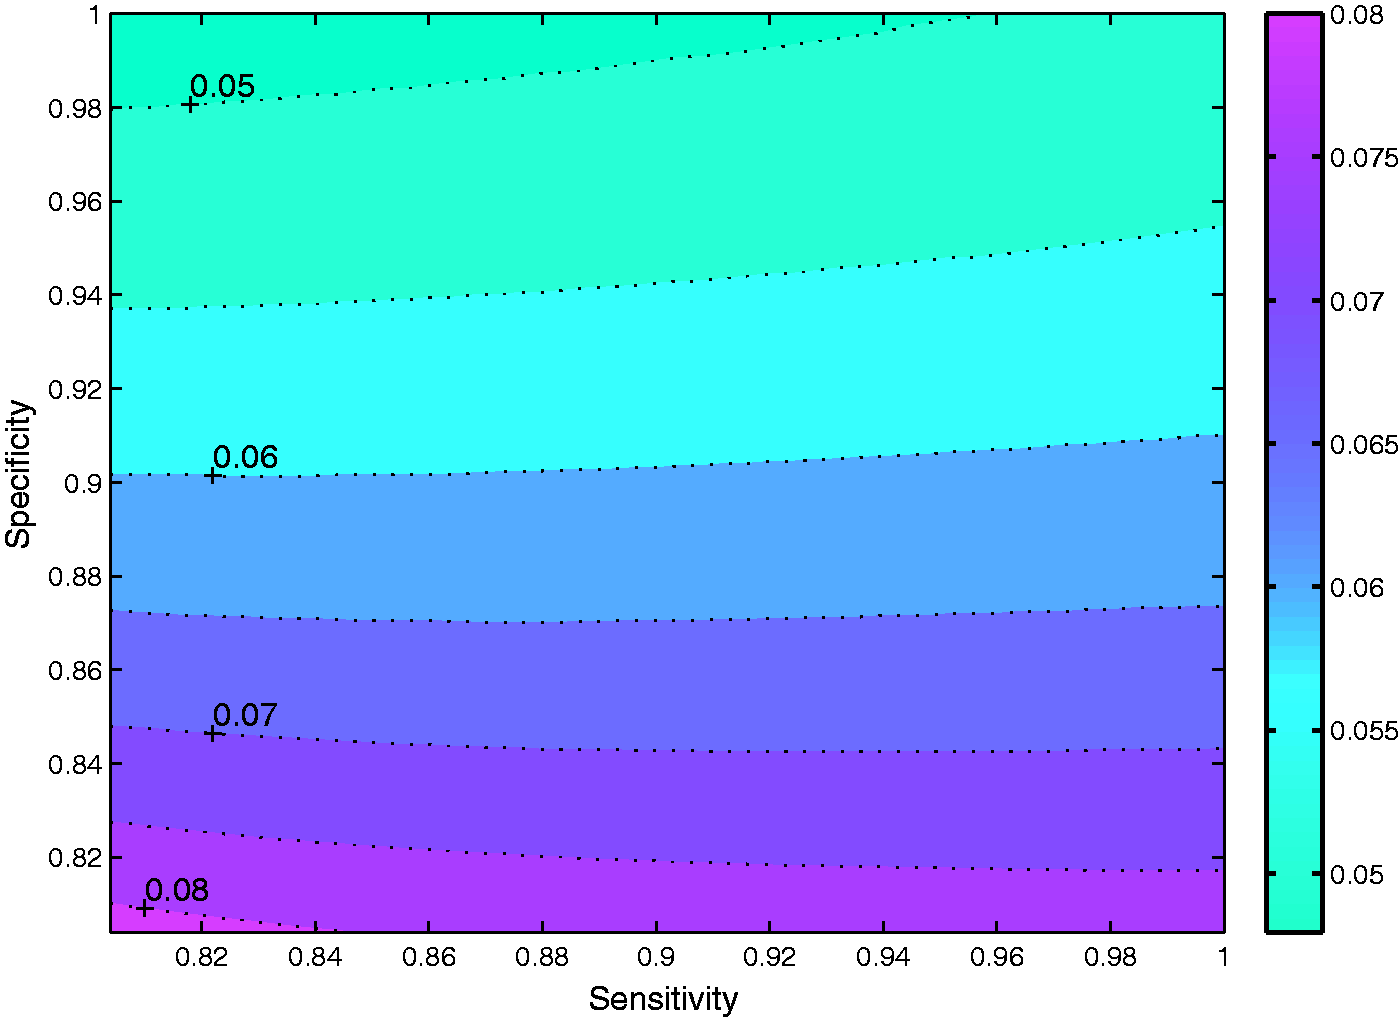
Figure 1 shows the threshold under different sensitivity and specificity. For example, the threshold pc is approximately 0.05 when sensitivity and specificity In this case, the efficiency Eff is definitely smaller than Eff if the prevalence p is smaller than The relationship of with respect to Se and Sp is similar for different N. Note that the value of pc overall increases if N is smaller and decreases otherwise, which is also shown in Table 5.
The contour plot of the threshold for N = 64. The efficiency of and satisfy that Eff Eff if the prevalence where .
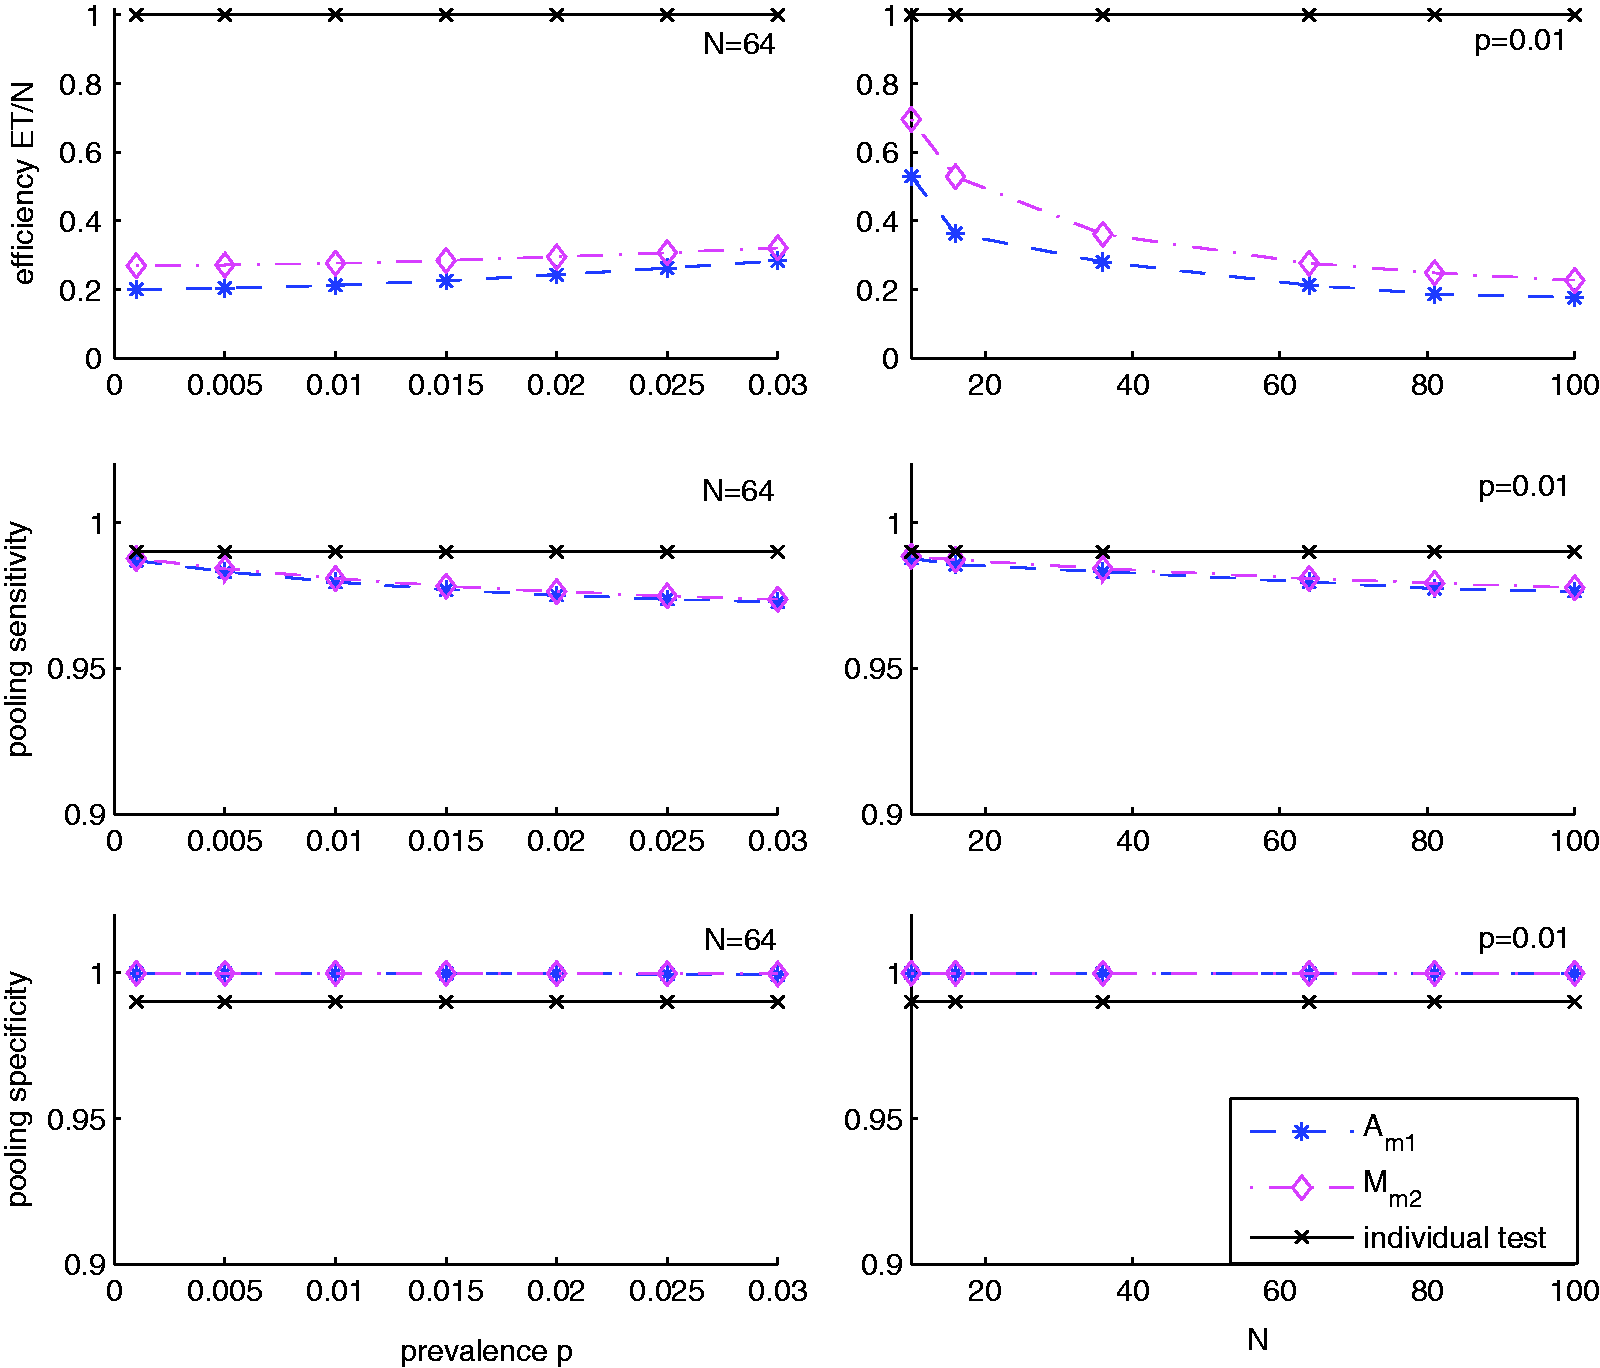
Next, we explore the operating characteristics of our algorithm Am, including the efficiency, pooling sensitivity and pooling specificity, comparing with square array-based group testing algorithm We consider two scenarios: varying prevalence p with fixed N and varying N with fixed p. The parameters are set at N = 64 and p = 0.01 for the two scenarios, respectively, while and The results are reported in Figure 2. For comparison, we also report the results of individual test.
The efficiency, pooling sensitivity and pooling specificity of and individual test with and The horizontal axis labels are the prevalence p (left panels) and the number of specimens N (right panels).
Figure 2 shows that the efficiency of is the lowest under different scenarios. For example, the efficiency of is 0.2125 while that of is 0.2762 for p = 0.01, N = 64 and If N increases, the efficiency becomes smaller for both and shown in the right top panel of Figure 2. However, our algorithm needs fewer expected number of tests per specimens than The pooling sensitivity of and are similar and are a little lower than The pooling specificity of both algorithms are very high, nearly 0.9998, which is much higher than We omit the results under other settings, since their performance is similar as that under this setting.
3.2 Application to detect acute HIV infections
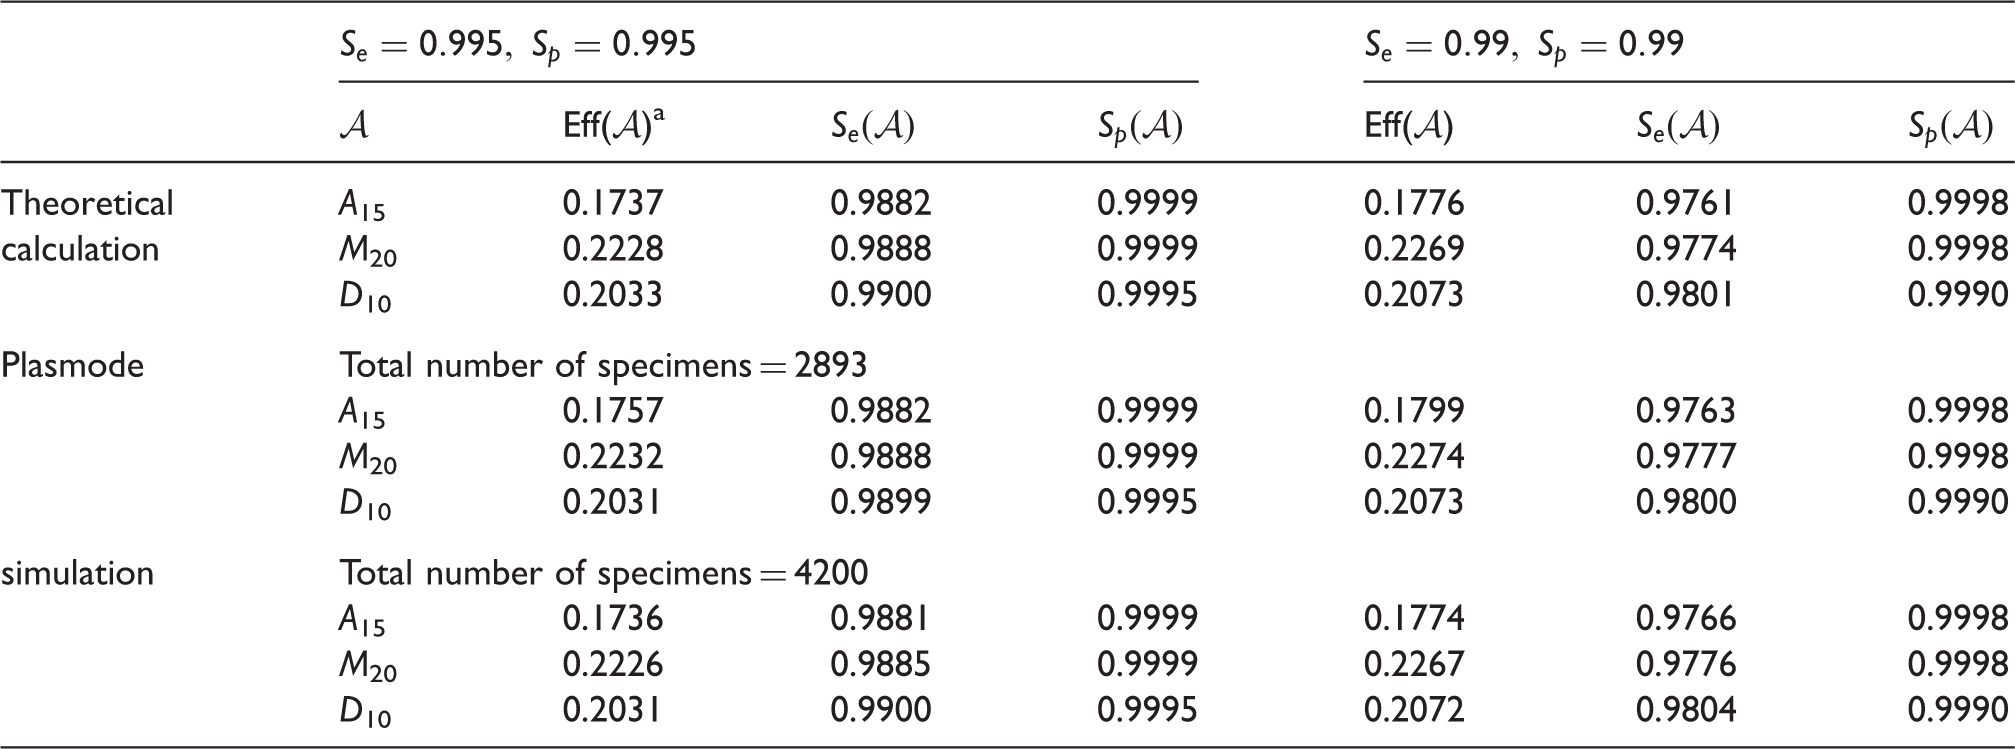
Bebell et al.31 reported a study of identifying acute human immunodeficiency (AHI) virus in Ugandan. They collected 7000 consecutive patients of all ages who were suspected to have malaria in seven government health clinics in rural Ugandan. Only 2893 adults (aged 13 years or older) were included in the study and 30 patients (1.04%) were identified as having AHI using pooled NAAT assay. In their setting, 10 specimens are pooled and screened, denoted by The sensitivity and specificity of NAAT is high, but no HIV test can have a sensitivity of 100% due to factors such as ‘window period’.32 Some researchers reported the positive predictive value of 0.9804 with a specificity of 0.9998, since the NAAT-negative pools were not deconstructed and confirmed negative.33 So, we set the parameters by with or
Let be a group testing algorithm. We first calculate the operating characteristics of three pooling algorithms: D10, and where and The parameter N is set at The results are reported in Table 7. To demonstrate the application of our approach, we proceed to conduct a plasmode simulation. Create a pool of {0, 1} with a total number of 2893 and 30 of them are ‘1’. Draw 2893 samples with replacement from the pool and screen them using the pooling algorithms: D10, A15 and with or Record the screening result for each specimen. Finally, we calculate the expected number of tests, the pooling sensitivity and specificity. Repeat the procedure by 10,000 times.
The efficiency, pooling sensitivity and specificity for detecting acute HIV infection.
Eff() is the expected number of tests per specimen.
The number of specimens in each pool is for A15 and 100 for Therefore, we also consider a total number of 4200 specimens to straightforwardly compare theoretical results and simulations, since it is a multiplier of both 105 and 100. In this case, we draw 4200 samples with replacement from the pool and the remaining steps are the same as the case of 2893 specimens. All the results are reported in Table 7.
Table 7 shows that A15 has lowest expected number of tests per specimen among the three algorithms. Both algorithms, A15 and M20, have higher pooling specificity and lower pooling sensitivity than D10. The pooling sensitivity and specificity are highly related with the particular pooling procedure. Before the final individual test, a truly positive specimen will be identified as positive only if two groups containing this specimen are tested positive using the algorithms A15 and M20, while just one group containing this specimen needs to be tested positive using D10. On the other hand, the pooling specificity will be improved using A15 or Note that our algorithm A15 only sacrifices little pooling sensitivity but considerably reduces the expected number of tests per specimen. Additionally, the results of theoretical calculation and plasmode simulation in Table 7 are coincided, inferring that our results reported in Theorems 1 and 2 are confirmed. Results of plasmode simulation under different scenarios are presented in the Supplemental Material.
4 Discussion
Group testing is an efficient strategy to identify the infected subjects. One of the commonly used group testing algorithms is matrix pooling. This type of group testing algorithm has a property that groups are overlapped. Investigating the relationship of efficiency and the magnitude of overlapping ρ, we found that the efficiency is an increasing function of ρ within a range of the prevalence. Based on this property, we develop a new array-based design and also provide an iterative method to construct such a design.
Moreover, we have proved theoretically that this new design is more efficient than the existing matrix pooling if the disease prevalence is smaller than a reasonable threshold. Our algorithm retains the pooling sensitivity and specificity of matrix pooling. We use a plasmode simulation to demonstrate real application and also confirm the theoretical results of the operating characteristics of our algorithm. Note that the comparison is made under the condition of approximately the same number of specimens in each pool. Overall, our algorithm needs less number of tests than matrix pooling, which is meaningful while the cost of test is expensive, such as NAAT.
Some extensions of our algorithm are possible, such as different retesting rules in the second stage30,34,35 and unequal group sizes,27,36 which have been proposed for square array scheme. Besides, we do not take into account of the heterogeneity of the prevalence among specimens. In practice, some additional informations are able to be collected, such as clinical, demographic parameters and risk behaviors. This type of information is related with the possibility of being positive and is helpful for the process of detecting infective subjects.37–39 Our design Am is possible to be further improved if adding such information. These are potential directions of extending the design Am for future work.
Footnotes
Declaration of conflicting interests
The author(s) declared no potential conflicts of interest with respect to the research, authorship, and/or publication of this article.
Funding
The author(s) disclosed receipt of the following financial support for the research, authorship, and/or publication of this article: This work is supported by National Natural Science Foundation of China [nos. 11526061, 11501134, 11371353]; Guangxi Natural Science Foundation [2015GXNSFBA139016]; the key project of Guangxi Normal University [2014ZD002]; Program on the High Level Innovation Team and Outstanding Scholars in Universities of Guangxi Province. Dr Li was supported in part by Special National Key Research and Development Plan under Grant [2016YFD0400206]; the Breakthrough Projects of Strategic Priority Program of the Chinese Academy of Sciences [XDB13040600].
Supplemental material
Supplemental material is available for this article online.
References
1.
World Health Organization. Screening donated blood for transfusion-transmissible infections: recommendations, Geneva: World Health Organization, 2010.
2.
World Health Organization. Blood safety and availability, Geneva: World Health Organization, 2016.
3.
YangSJiaoDLiuCet al.Seroprevalence of human immunodeficiency virus, hepatitis B and C viruses, and Treponema pallidum infections among blood donors at Shiyan, Central China. BMC Infect Dis2016; 16: 531–531.
4.
Van der BijAKCoutinhoRAVan der PoelCL. Surveillance of risk profiles among new and repeat blood donors with transfusion-transmissible infections from 1995 through 2003 in the Netherlands. Transfusion2006; 46: 1729–1736.
5.
BuschMPKleinmanSHJacksonBet al.Nucleic acid amplification testing of blood donors for transfusion-transmitted infectious diseases. Transfusion2000; 40: 143–159.
6.
EllingsonKSeemDNowickiMet al.Estimated risk of human immunodeficiency virus and hepatitis C virus infection among potential organ donors from 17 organ procurement organizations in the United States. Am J Transplant2011; 11: 1201–1208.
7.
DorfmanR. The detection of defective numbers of large populations. Ann Math Stat1943; 14: 436–440.
8.
PilcherCFiscusSNguyenTet al.Detection of acute infections during HIV testing in North Carolina. N Engl J Med2005; 352: 1873–1883.
9.
HutchinsonABPatelPSansomSLet al.Cost-effectiveness of pooled nucleic acid amplification testing for acute HIV infection after third-generation HIV antibody screening and rapid testing in the United States: a comparison of three public health settings. PLoS Med2010; 7: e1000342–e1000342.
10.
TebbsJBilderC. Confidence interval procedures for the probability of disease transmission in multiple-vector-transfer designs. J Agric Biol Environ Stat2004; 9: 75–90.
11.
BilderCRTebbsJM. Empirical Bayesian estimation of the disease transmission probability in multiple-vector-transfer designs. Biom J2005; 47: 502–516.
12.
GastwirthJL. The efficiency of pooling in the detection of rare mutations. Am J Hum Genet2000; 67: 1036–1039.
13.
ShamPBaderJSCraigIet al.DNA pooling: a tool for large-scale association studies. Nat Rev Genet2002; 3: 862–871.
14.
CormodeGMuthukrishnanS. Combinatorial algorithms for compressed sensing. In: International colloquium on structural information and communication complexity2006; Vol. 4056, Springer Berlin Heidelberg: SIROCCO, Lecture Notes in Computer Science, pp. 280–294.
15.
LiC. A sequential method for screening experimental variables. J Am Stat Assoc1962; 57: 455–477.
16.
PilcherCPriceMHoffmanIet al.Frequent detection of acute primary HIV infection in men in Malawi. AIDS2004; 18: 517–524.
17.
van ZylGUPreiserWPotschkaSet al.Pooling strategies to reduce the cost of HIV-1 RNA load monitoring in a resource-limited setting. Clin Infect Dis2011; 52: 264–270.
18.
PhatarfodRMSudburyA. The use of a square array scheme in blood testing. Stat Med1994; 13: 2337–2343.
19.
MaySGamstAHaubrichRet al.Pooled nucleic acid testing to identify antiretroviral treatment failure during HIV infection. J Acquir Immune Defic Syndr2010; 53: 194–201.
20.
KrajdenMCookDMakAet al.Pooled nucleic acid testing increases the diagnostic yield of acute HIV infections in a high-risk population compared to 3rd and 4th generation HIV enzyme immunoassays. J Clin Virol2014; 61: 132–137.
21.
KwiatkowskiTJJrZoghbiHYLedbetterSAet al.Rapid identification of yeast artificial chromosome clones by matrix pooling and crude lysate PCR. Nucleic Acids Res1990; 18: 7191–7201.
22.
ZuzartePCDenrocheREFehringerGet al.A two-dimensional pooling strategy for rare variant detection on next-generation sequencing platforms. PloS One2014; 9: e93455–e93455.
23.
SintDSporlederMWallingerCet al.A two-dimensional pooling approach towards efficient detection of parasitoid and pathogen DNA at low infestation rates. Meth Ecol Evol2016; 7: 1548–1557.
24.
KimHYHudgensMGDreyfussJMet al.Comparison of group testing algorithms for case identification in the presence of test error. Biometrics2007; 63: 1152–1163.
SudburyA. Two-stage testing using selection schemes. Stat Med2010; 29: 2194–2199.
29.
LitvakETuXMPaganoM. Screening for the presence of a disease by pooling sera samples. J Am Stat Assoc1994; 89: 424–434.
30.
Hedt BL and Pagano M. A matrix pooling algorithm for disease detection. Working Paper 57, Harvard University Biostatistics Working Paper Series, 2008.
31.
BebellLMPilcherCDDorseyGet al.Acute HIV-1 infection is highly prevalent in Ugandan adults with suspected malaria. AIDS2010; 24: 1945–1952.
32.
SteklerJDSwensonPDCoombsRWet al.HIV testing in a high-incidence population: is antibody testing alone good enough?Clin Infect Dis2009; 49: 444–453.
33.
PatelPMackellarDSimmonsPet al.Detecting acute human immunodeficiency virus infection using 3 different screening immunoassays and nucleic acid amplification testing for human immunodeficiency virus RNA, 2006–2008. Arch Intern Med2010; 170: 66–74.
34.
Langfeldt SA, Hughes-Oliver JM, Ghosh SK, et al. Optimal group testing in the presence of blockers. Technical Report, Institute of Statistics Mimeograph Series No. 2297. North Carolina University, Raleigh, NC, USA, 1997.
35.
XieMTatsuokaKSacksJet al.Group testing with blockers and synergism. J Am Stat Assoc2001; 96: 92–102.
36.
HabtesllassieYGHainesLMMwambiHGet al.Array-based schemes for group screening with test errors which incorporate a concentration effect. J Stat Plann Inference2015; 167: 41–57.
37.
BilderCRTebbsJMChenP. Informative retesting. J Am Stat Assoc2010; 105: 942–955.
38.
BlackMSBilderCRTebbsJM. Group testing in heterogeneous populations by using halving algorithms. J R Stat Soc Ser C Appl Stat2012; 61: 277–290.
Please find the following supplemental material available below.
For Open Access articles published under a Creative Commons License, all supplemental material carries the same license as the article it is associated with.
For non-Open Access articles published, all supplemental material carries a non-exclusive license, and permission requests for re-use of supplemental material or any part of supplemental material shall be sent directly to the copyright owner as specified in the copyright notice associated with the article.