






Abstract
Excessive zeros are common in practice and may cause overdispersion and invalidate inference when fitting Poisson regression models. There is a large body of literature on zero-inflated Poisson models. However, methods for testing whether there are excessive zeros are less well developed. The Vuong test comparing a Poisson and a zero-inflated Poisson model is commonly applied in practice. However, the type I error of the test often deviates seriously from the nominal level, rendering serious doubts on the validity of the test in such applications. In this paper, we develop a new approach for testing inflated zeros under the Poisson model. Unlike the Vuong test for inflated zeros, our method does not require a zero-inflated Poisson model to perform the test. Simulation studies show that when compared with the Vuong test our approach not only better at controlling type I error rate, but also yield more power.
1 Introduction
Count or frequency outcomes such as the number of heart attacks, suicide attempts, days of alcohol drinking, and unprotected vaginal sex occasions during a period of time arise quite often in biomedical and psychosocial research. Poisson loglinear regression is the most popular approach for modeling such count responses. However, in practice it is often the case that there are excessive zeros beyond the amount of zeros expected by the Poisson law. One common cause is the heterogeneity of the study population; subjects who are not at risk for the phenomenon of interest always yield a zero outcome, or structural zero. For example, when modeling behavioral outcomes such as the number of unprotected vaginal sex over a period of time in human immunodeficiency virus (HIV) prevention research, if the study population contains a subgroup of individuals who are not at risk for such health-risk behavior during the study period, every subject in this subgroup will yield a zero outcome. If a Poisson regression model is appropriate for modeling the count outcome for the at-risk subjects, the whole population follows a mixture of a Poisson distribution and a degenerate distribution at zero. A popular choice for such a mixture is the zero-inflated Poisson (ZIP) model, consisting of a Poisson regression model for the count outcome for the at-risk subjects and a regression for a binary outcome indicating the structural zero, or the nonrisk subgroup.1–5 The inherent methodological problems with zero-inflated outcomes have received a great deal of attention in the literature.6–12 However, surprisingly testing whether there are excessive zeros in the first place, a more fundamental question, has not been well investigated.
While descriptive statistics such as frequency tables or/and histograms may be informative in raising the question of whether there are excessive zeros, they should not be relied upon for decision making in place of formal statistical tests. In practice, goodness-of-fit tests may also be used to check if there are issues of fitting Poisson models, such as overdispersion. However, such tests are not really targeting the excessiveness of zeros. The Vuong test, which compares model fitting between the Poisson and a ZIP model, 13 is widely used and has been implemented in popular statistical software packages such as SAS and Stata. A search of “zero-inflated Vuong” on Google Scholar returned about 3430 results (on 15 August 2017). However, as a general tool for comparing model fitting between two non-nested models, the Vuong test has many limitations and should not be used for testing excessive zeros in the current context.
First, the Vuong test compares the goodness of fit of the Poisson model with the ZIP model. Although not in a standard way, the Poisson is essentially nested within the ZIP model, as it corresponds to the cases where the degenerate component of the mixture (structural zeros) does not exist, that is, the probability of structural zeros is zero. Thus, it is not appropriate to apply the Vuong test for non-nested models to test inflated zeros. More specifically, the asymptotic theory which was proved under the null hypothesis that the two competing non-nested models fit the data equally well does not apply. In fact, our simulation study shows that the empirical type I error using the Vuong test may seriously deviate from the nominal type I error, confirming that it is not appropriate to apply the Vuong test for the task.
Second, a fully specific ZIP model is needed to apply the Vuong test. Building such a full-blown ZIP model can be time-consuming and may not be worth the effect, if one is only interested in testing whether there are excessive zeros under the Poisson model. Further, there may be different ways to set up the ZIP model such as using different covariates in the binary regression models for the binary indicator of structural zeros, yielding different test results.
In this paper, we develop a statistical test for excessive zeros under the Poisson model. Unlike the Vuong test, it does not require the specification of a ZIP model. The null hypothesis for the proposed test is that the Poisson model is correct and the alternative is that there are more zeros than that are predicted by the Poisson model. In Section 2, after a brief review of the Vuong test, we develop new test statistics to test for inflated zeros under the Poisson model. Simulation studies are carried out in Section 3 to evaluate the performance of the proposed tests, with a real study example given in Section 4. The paper is concluded with a discussion in Section 5.
2 A new test of inflated zero
Consider an independent sample
In some studies, there are often excessive zeros in the count response. This may cause overdispersion and produce biased inference. Zero-inflated regression models such as ZIP model are formally used to address such violations. Under a ZIP regression model
There is an extensive literature on inference and application of ZIP and related models for zero-inflated count responses, including mixed and marginal models,8,9 and estimating equations.10,12 Zero-inflated models can correct overdispersion caused by excessive zeros and identify the nonrisk subgroup in the study population. However, a more fundamental question, which has received much less attention in the literature, is testing the existence of excessive zeros. Currently, the Vuong test 13 is “the” test of choice and has been implemented in popular statistical software packages such as SAS and Stata. We briefly review this popular test below.
2.1 Vuong test
Let
Let
To use this ratio of likelihood functions as a test statistic, we need to find a distribution of this statistic. To this end, let
The Vuong test for comparing f1 and f2 is defined by the following statistic and associated asymptotic distribution
To use the Vuong test for Poisson-distributed data, we must have a second, alternative model such as ZIP, in addition to the Poisson loglinear regression model. Often the Poisson model is treated as the null, and the alternative is the second model such as the ZIP which includes the Poisson model as a special (limiting) case. The null is rejected only if the Vuong test is significant in favor of the second model. In other words, when the Vuong test is not significant or significant but in favor of the Poisson model, we do not reject the null.
The lack of statistical tests for inflated zeros in the standard testing paradigm may be due to the fact that the two models are essentially nested, albeit in a nonstandard way. The Poisson model corresponds to the special case of ZIP model when the probability for structural zeros is zero. However, under ZIP model, a logistic model is assumed for the mixture probability, which assumes a priori the presence of structural zeros, with the proportion (probability) of such zeros inside the open interval (0,1). In other words, the Poisson model corresponds to the limiting case of ZIP model as some parameters go to negative infinity, rather than a member of the ZIP model in conventional sense. For example, if there is no covariate in the logistic component of ZIP model, then the Poisson model corresponds to the case when the intercept is negative infinite. The issue is more complicated if there are covariates in the model. There are more than one parameter in the logistic component and the limiting situation can become quite complicated. Thus, fitting a second model such as the ZIP when using the Vuong test not only involves additional more complex modeling (than Poisson model), but may suffer convergence issue as well, especially when the probabilities of being structural zeros is small.
2.2 A naive test
Intuitively, one may compare the amount of zeros observed with that expected under the Poisson regression model. Let ri be the indicator of yi = 0, that is,
Under equation (1), E(s) = 0 and
However, neither s nor
The parameter β can be estimated using maximum likelihood, or equivalently, by solving the score equations
Let
Inference based on this naive statistic against the asymptotic standard normal will be biased because it treats the estimated
2.3 A new approach
For a valid statistical test based on equation (3), we need to correctly handle the variation associated with the estimated β. To this end, first note that equation (3) can be expressed as an estimate of
By stacking equation (7) with the estimating equations for β (equation (5)), we obtain a system of estimating equations which simultaneously solve β and S. It is easy to check that the solution for S is exactly the same as
Specifically, let
The following theorem provides the asymptotic distribution for
Under the null hypothesis of the Poisson model in equation (
1
), we have that
Under the null hypothesis of the Poisson model in equation (1), the estimating equations for
Theorem 1
Proof
Based on this theorem, we can test excessive zeros simply based on the null hypothesis of the Poisson model, without assuming any alternative model such as the ZIP as in applying the Vuong test. If we test against the alternative in which the amount of zeros is different from that expected by the Poisson model in either direction, a two-sided test based on
In practice, we often test against the alternative with excessive zeros and may use a one-sided test to have more power. In this case, the alternative is in the direction of excessive zeros beyond that of the Poisson model and we reject the null if
3 Simulation studies
We conduct simulation studies to assess the performance of the proposed test. We simulate data in different scenarios (Poisson distribution and regression models, ZIP models with linear and nonlinear components, and negative binomial (NB) models) with different sample sizes (50, 100, 200, 500, and 1000) to compare the new, naive, and the Vuong tests. We first simulate data from Poisson models to assess the performances in terms of type I errors. Next, we simulate data from ZIP models to assess the performance in terms of power. We simulate data using constant, linear, and nonlinear models for the structural zero components. Finally, we simulate data following NB models. The NB has the same first moment as the Poisson distribution, but a larger variance than the Poisson distribution.
All the tests are one-sided unless stated otherwise. For our new and naive tests, the alternative is that there are more zeros than those predicted by the Poisson model. For Vuong test, the alternative is the ZIP model with the same Poisson model for the count component and a logistic model for the structural zero component. All simulations are performed with 10,000 Monte Carlo replicates and the statistical significance level at
The simulation is carried out using R. 14 R programs are developed for the new test, and they are available upon request. ZIP models are fitted using the “zeroinfl” function and the Vuong statistics are computed using the “vuong” function in the R package “pscl”. 15 Note that the original “vuong” function outputs the test results, but we have made simple changes to output the Vuong statistic.
3.1 Poisson response
We consider two situations, with the first (second) involving no (one) covariate. We express both scenarios in one model as follows
The two situations correspond to
For the first scenario, we simulate data from Poisson distributions with mean
For the second case with covariate x, we set
For the Vuong test, we consider two alternative ZIP models, the first with a constant mixing probability
Note that the null (alternative) hypothesis is the form of a model within the current context, rather than specific values of parameters as in testing hypotheses concerning the values of parameters.
Empirical type I errors (%) for comparing three methods under different scenarios for Poisson response for the simulation study.
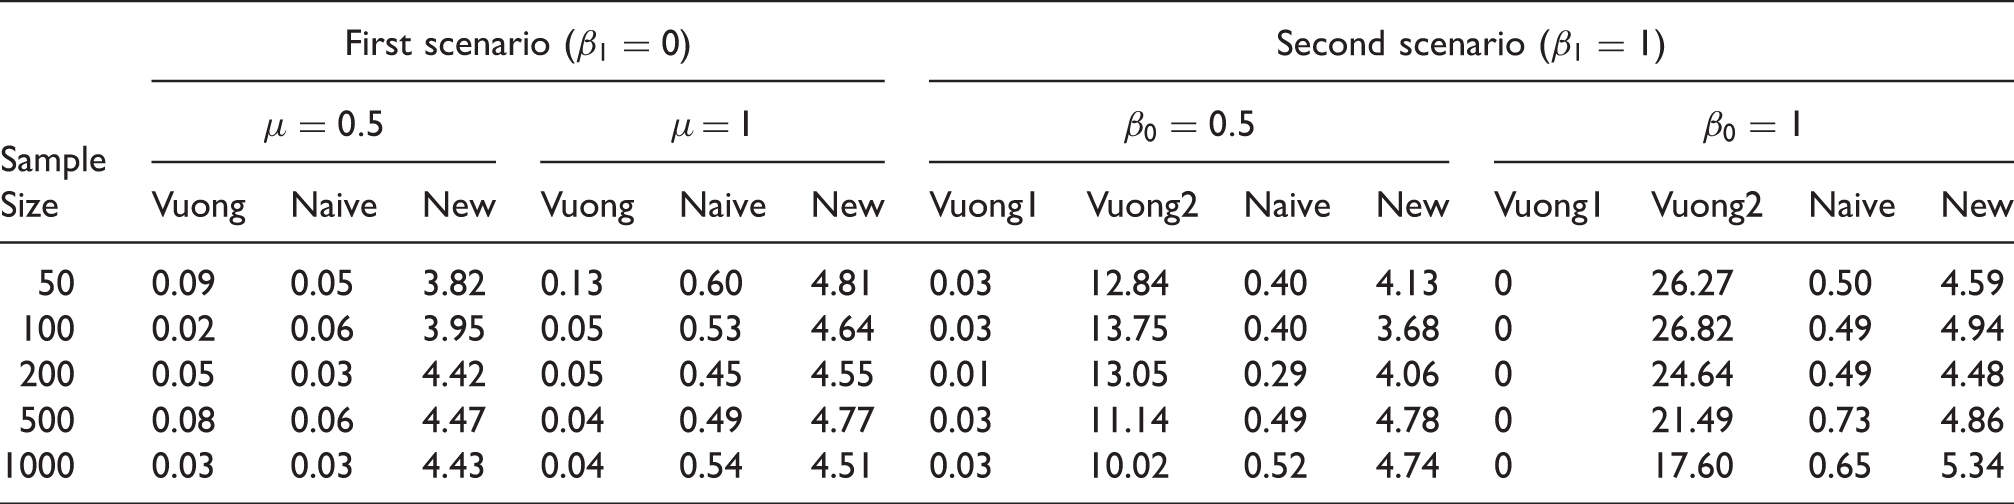
Note: In the second scenario, “Vuong1” and “Vuong2” are for the Vuong tests with the alternative zero-inflated Poisson models (3.10) and (3.11), respectively.
Since the Poisson model is essentially nested within the ZIP model, the Vuong test comparing the goodness of fit of the two models in general favors the ZIP model over the Poisson regression model. The degree to which it favors the ZIP over the Poisson model varies with different situations. When there are no covariates in the model for the structural zero component, the advantage of the ZIP over the Poisson model seems minimal and their difference in likelihood is small, resulting in rejection rates that are close to zero (all less than 0.15%). However, when covariates are included in the model for the structural zero component, more parameters are added to the ZIP model and the additional parameters bring more flexibility for the ZIP model to fit the data and may yield a substantially higher increase in the likelihood for the ZIP model. In fact, by simply switching the ZIP model from not including the covariate to including the covariate, the rejection rates change from close to zero to much higher than the nominal 5% type I error, neither of which is what we desired. The substantial deviations of the empirical type I errors from the nominal level in both directions prove that the Vuong test totally failed in controlling type I error, invalidating its application in testing inflated zeros.
Shown in Figure 1 are QQ plots of the p-values for comparing model-based and empirical type I errors for the simulation study; the plots in the four rows represent the four cases in Table 1. Within each row, the plots correspond to the Vuong, naive, and new test, respectively. For the Vuong test in the third and fourth rows in the second scenario, the curves above (below) the diagonal lines are for the test using ZIP models without (with) the covariate in the structural zero component. The plots also show that the new test performed quite well, because the points showed near perfect diagonal lines. On the other hand, the QQ plots for the naive and the Vuong test show quite deviations from the diagonal line. For all cases, the bottom-left end of the plot for the naive test lied above the diagonal line, indicating that the model-based p-values were far bigger their empirical ones, hence resulting in much lower rejection rates. For the Vuong test, the plots showed similar patterns for the two cases in the first scenario as well as in the second scenario when the covariate is not included in the structural zero component of the ZIP model. But, when the covariate is included in the zero component of the ZIP model in the second scenario, the points all lied below the diagonal line, indicating that the estimated p-values were smaller than the empirical ones, leading to much higher rejection rates.
QQ plots of p-values for comparing model-based and empirical type I errors in the four Poisson response cases with sample sizes 50, 100, 200, 500, and 1000. For the Vuong test in the last two rows, the curves above (below) the diagonal lines are for the test using zero-inflated Poisson models without (with) the covariate in the structural zero component.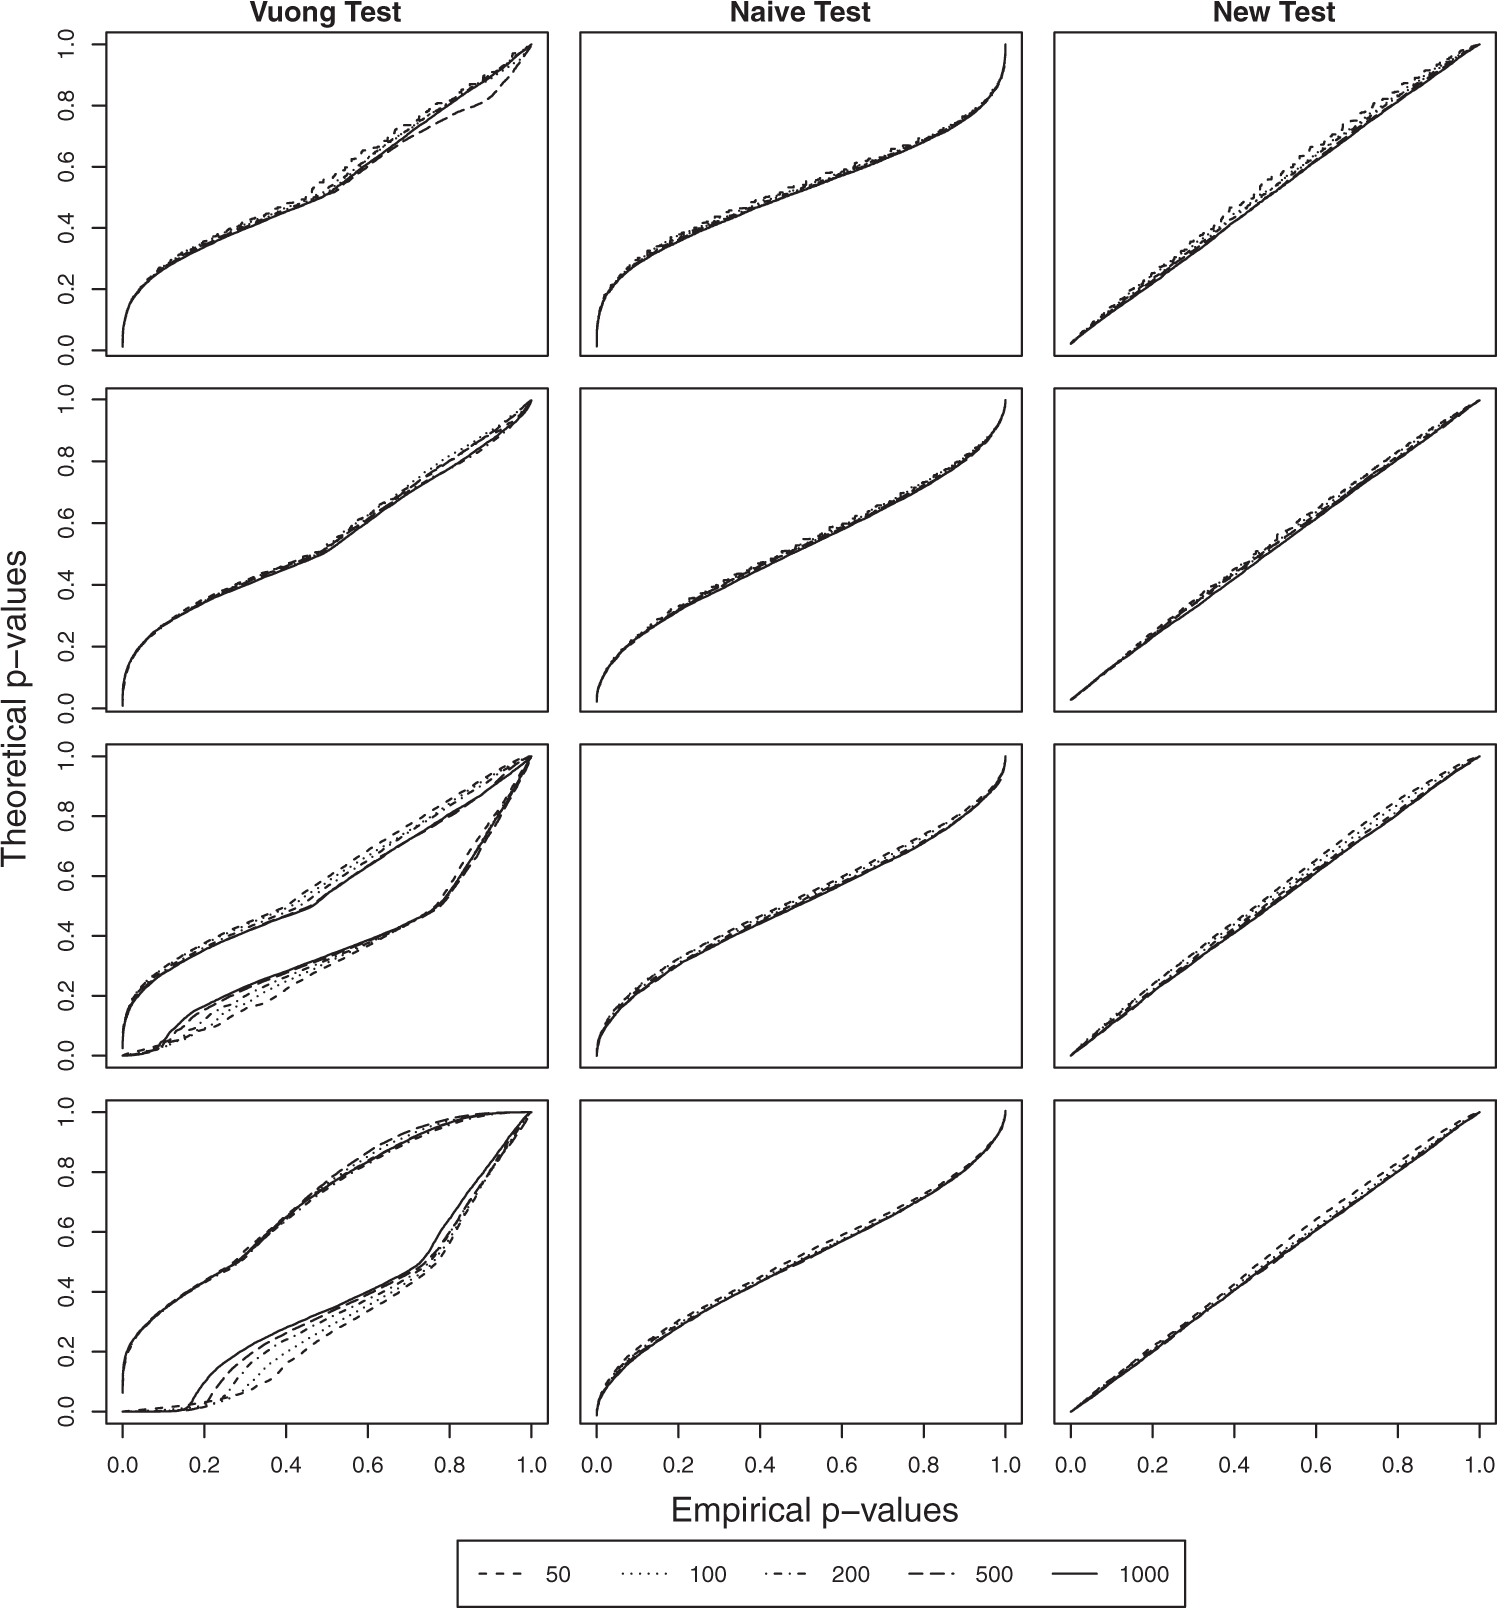
3.2 ZIP response
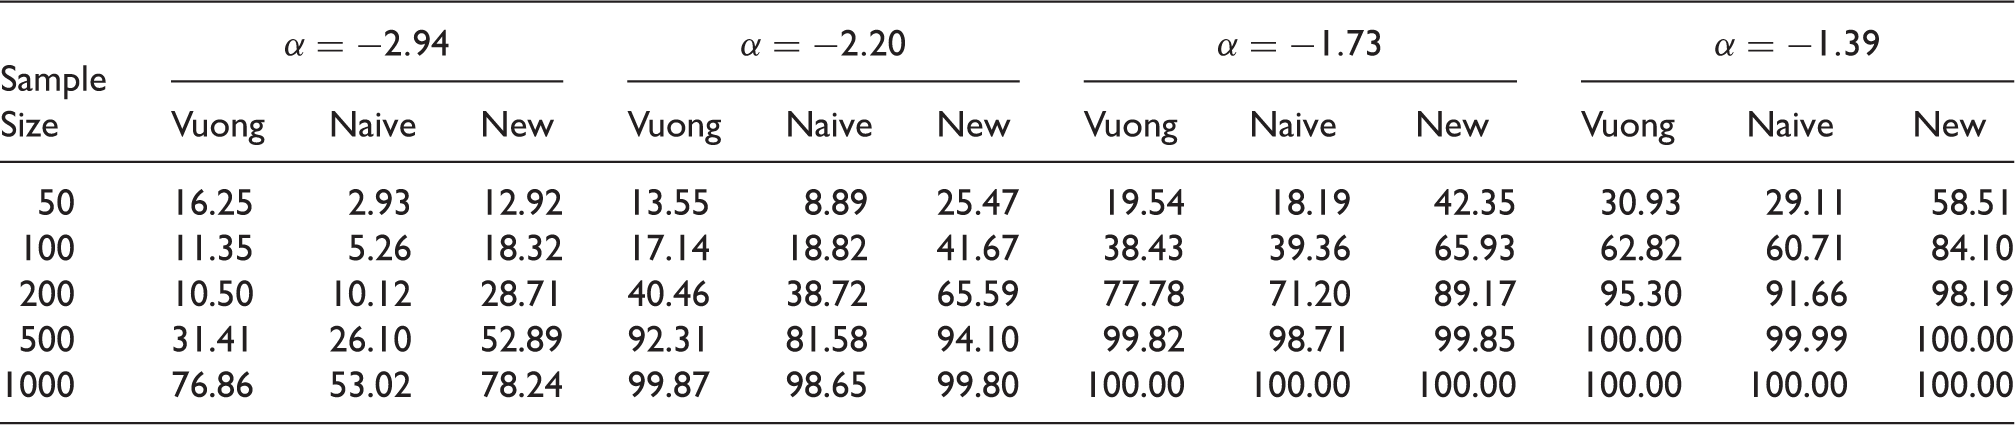
Next, we simulate responses from the ZIP model and focus on the performance of the tests in terms of power. Again, we assume a single explanatory variable. The Poisson component of the ZIP model is given by
For the logistic part (mixture probability), we simulate data from three scenarios; (1) a logistic regression with only the intercept (constant mixing probability); (2) a logistic model with a linear predictor; and (3) a logistic model with a nonlinear predictor.
The null considered is the Poisson model
For the Vuong test, we need to specify a ZIP model. We use the following ZIP model
3.2.1 Constant mixing probability
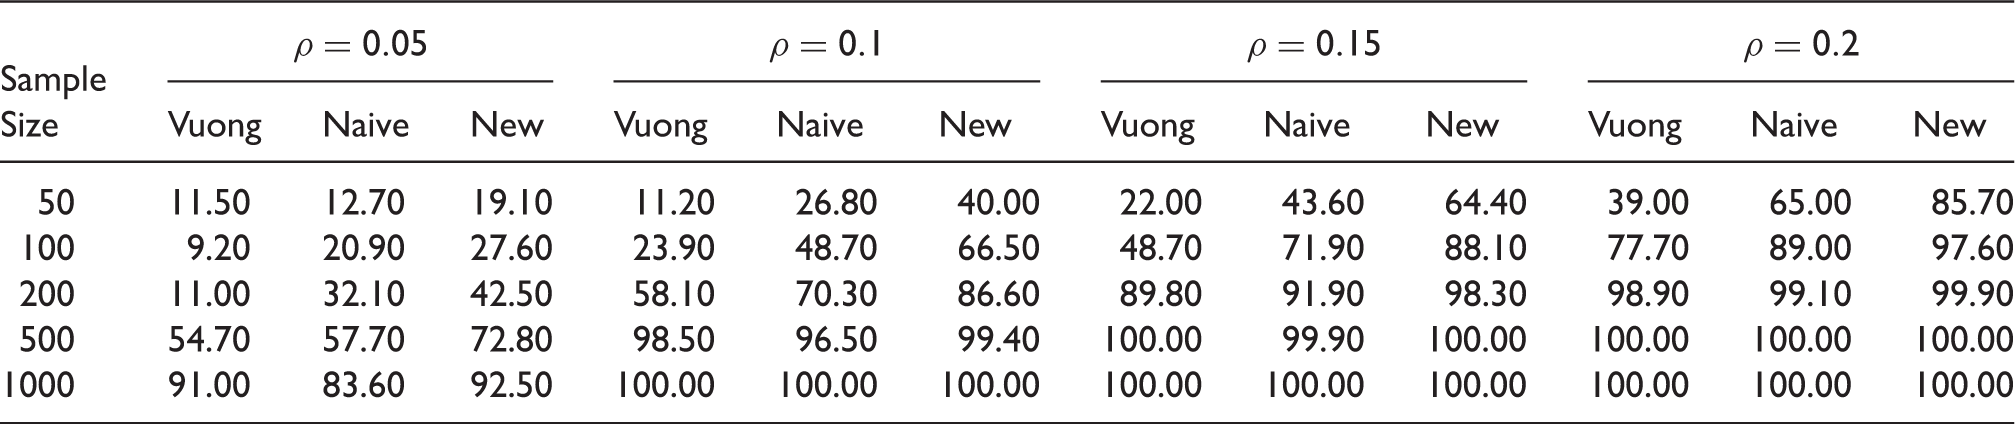
In this case, all subjects have the same likelihood of being a structural zero, ρ. So, it reduces to the Poisson case if ρ = 0. Here, we simulate data using
Power (%) for comparing three methods under different scenarios for zero-inflated Poisson response with constant mixing probability for the simulation study.
3.2.2 Logistic model with a linear predictor mixing probability
The mixing probability in this case follows a generalized linear model with the logit link and a single covariate,
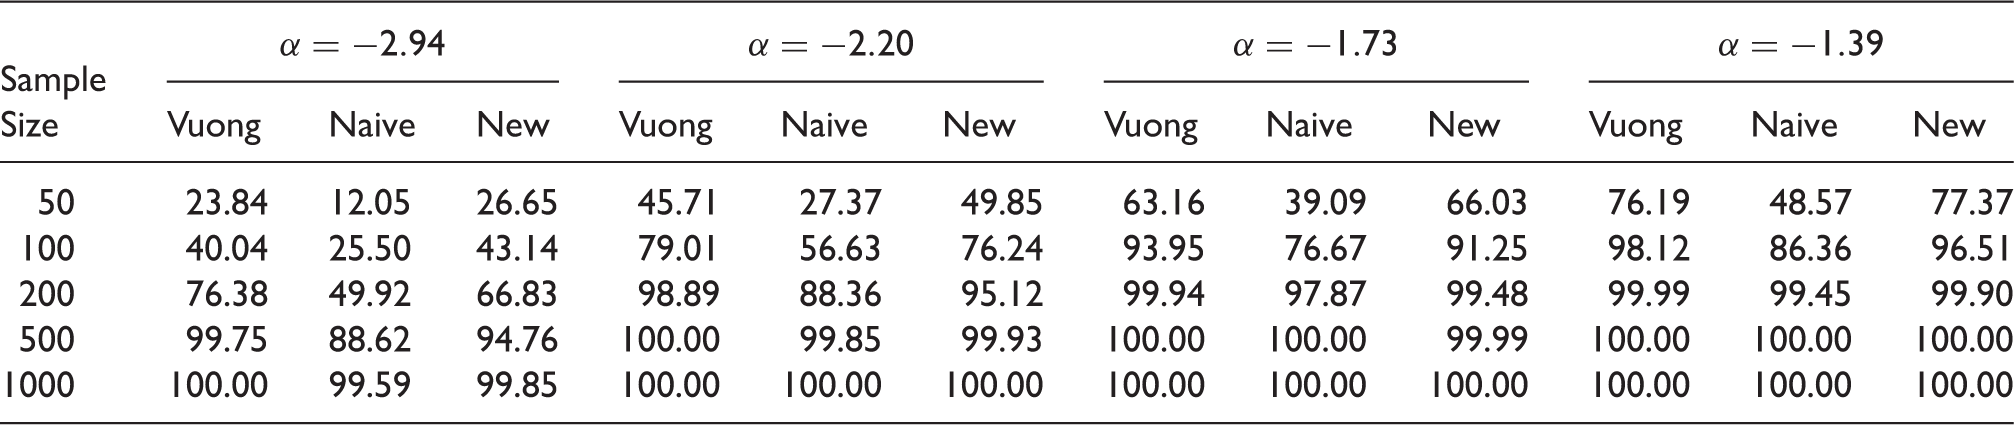
The different values of α lead to approximately 10%, 15%, 20%, and 25% of structural zeros.
Power (%) for comparing three methods under different scenarios for zero-inflated Poisson response with mixing probability modeled by logistic regression with a linear predictor for the simulation study.
3.2.3 Logistic model with a nonlinear predictor as mixing probability
The mixing probability here still follows a logistic model, but linking to the covariate in a nonlinear fashion,
As in the earlier case, the mixing probability increases if α increases.
For the Vuong test, ZIP models with generalized linear models for both components (equation (10)) are used as the alternative.
Power (%) for comparing three methods under different scenarios for zero-inflated Poisson response with mixing probability modeled by logistic regression with a nonlinear predictor for the simulation study.
3.3 NB response
Data in this section are simulated from an NB regression model:
In the simulation, we set τ = 1 and
Power (%) for comparing three methods under different scenarios for negative binomial response for the simulation study.
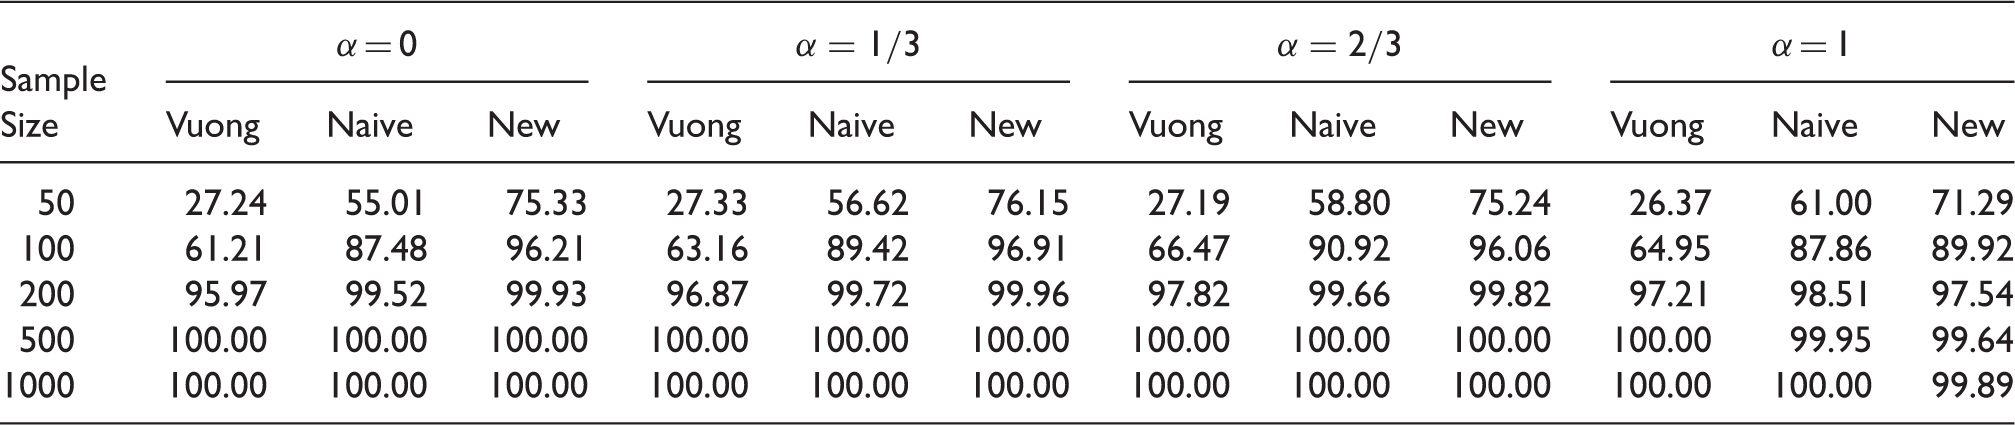
Note that the rejection of the null by the Vuong test indicates that the ZIP model fits the data better than the Poisson model, while the rejection by the new test shows that there are more zeros than those predicted by the Poisson model. Within the current simulation context, the latter is true, because there are more zeros in an NB than in a Poisson model, if the two models have the same mean. However, the rejection of the null hypothesis here does not imply inflated zeros or existence of structural zeros. The new test only compares the amount of zeros with that expected by the Poisson model. Thus, whether the inflated zeros detected by the proposed test can be interpreted as the indication of the existence of the structural zeros depends on whether the at-risk group follows the Poisson model, which may be checked by comparing the positive count outcome with the corresponding zero-truncated Poisson model.
4 Case study
In a randomized clinical trial, teaching awareness and self-monitoring skills to indwelling urinary catheter users conducted in New York state, 202 subjects were recruited and randomized to the intervention and control groups. 17 The primary outcomes of interest are whether the subjects experienced urinary tract infections (UTIs), catheter blockages, and catheter displacements during the last two months, as well as the corresponding counts of these experiences. This is a randomized longitudinal study where each subject was measured every 2 months, however, for illustrative purpose, we only consider the count responses at enrollment.
We would like to apply Poisson regression models to model the count responses. At the enrollment, the distributions of the count outcomes are presented in the following plot.
Based on the plot, it looks like that there may be the zero-inflation issue for these count outcomes. To formally test if it is indeed the case, we use the following Poisson regression model
From Figure 2, there are three measures in catheter blockages that were obvious too large (outliers). For illustrative purpose, we simply delete these measures in the analysis, although more complicated methods such as winsorizing may be applied. Based on the Poisson regression models (equation (13)) for the three outcomes, the p-values for the tests of zero-inflation based on our proposed methods are 0.68, 0.0000015, and 0.0016, respectively.
Distributions of the counts of urinary tract infection, catheter blockages, and catheter displacements.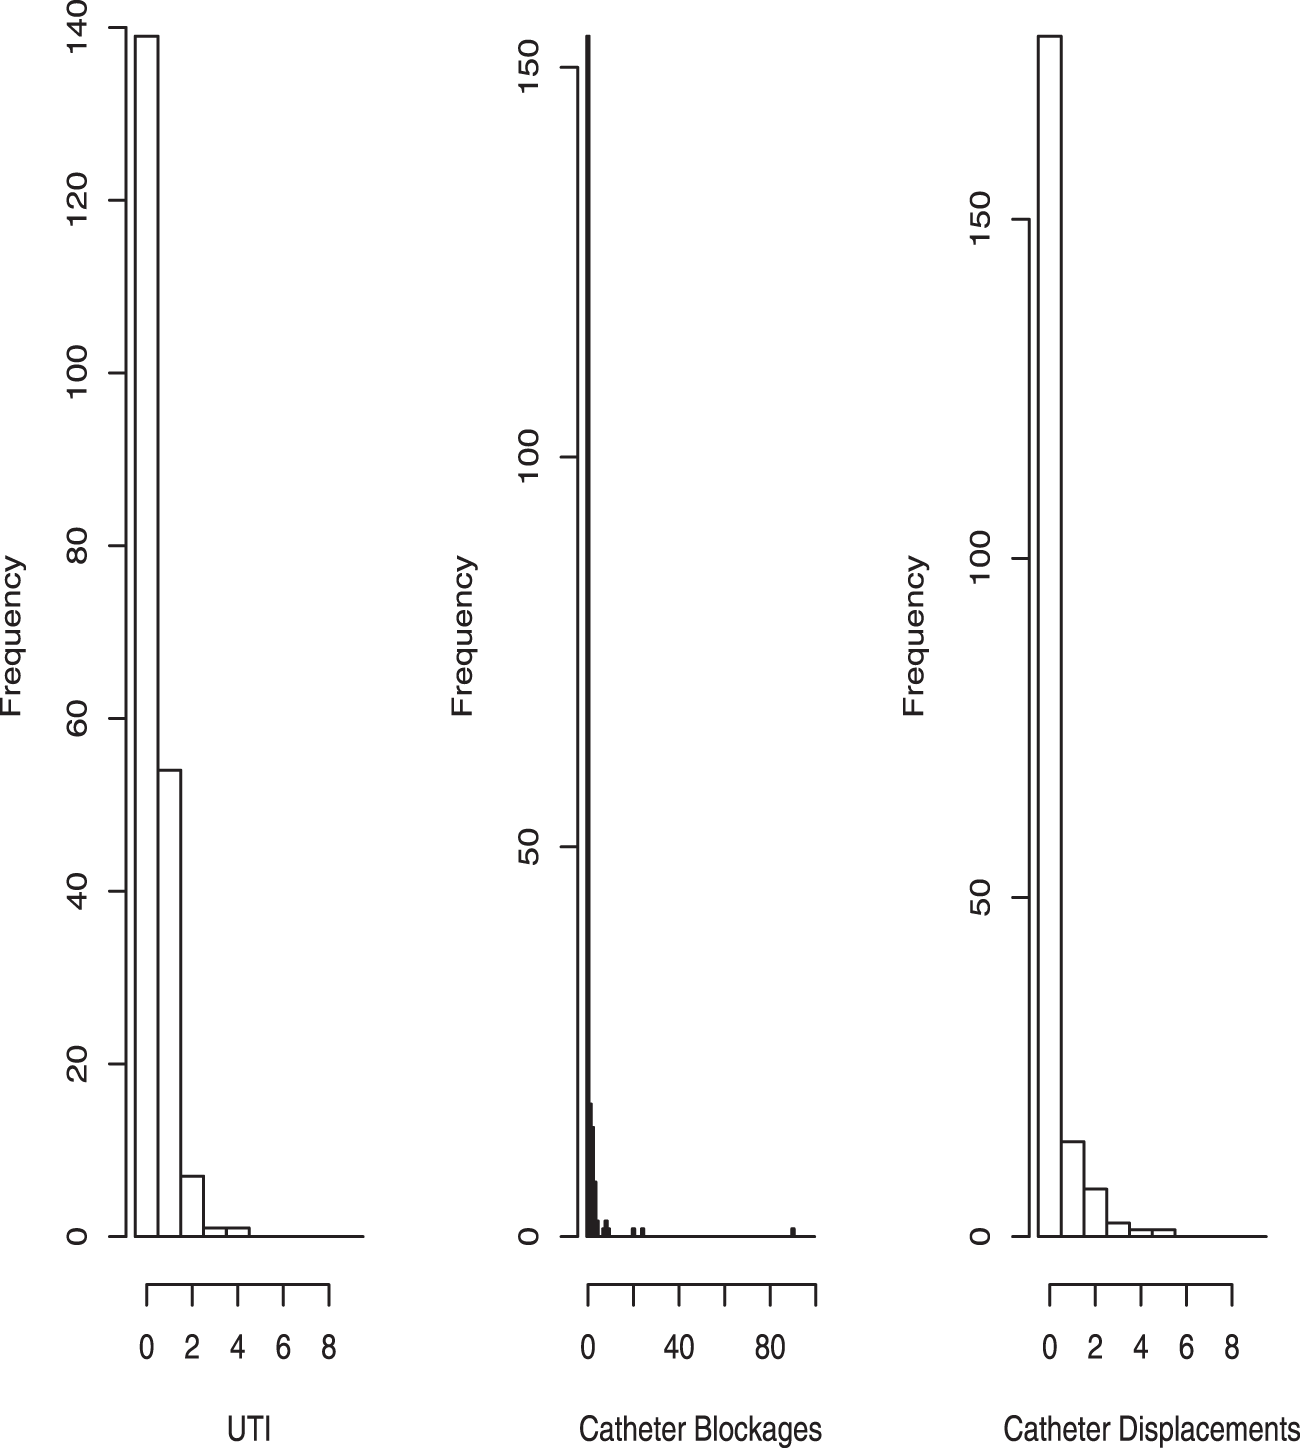
To apply the Vuong test, we need to set up an alternative ZIP regression model. We assume the Poisson regression models (equation (13)) for the count component. For the binary component for inflated zeros, there are
For UTI, the corresponding p-values under the Vuong tests are 0.37, 0 39, 0.44, 0.49, 0.42, 0.04, 0.10, and 0.084, respectively, for the eight ZIP models.
For catheter blockages, the corresponding p-values under the Vuong tests are 0.0015, 0.0015, 0.00098, 0.00098, 0.0015, 0.0010, 0.0010, and 0.00054, respectively, for the eight ZIP models.
For catheter displacement, the corresponding p-values under the Vuong tests are 0.043, 0.043, 0.044, 0.033, 0.030, 0.044, 0.012, and 0.012, respectively, for the eight ZIP models.
Based on these tests, the p-values for the Vuong tests vary with the model specification for the zero component. For UTI, they vary a lot, from 0.04 to 0.49. Different conclusions may be achieved with 5% type I error. Similarly, the p-values change with the different models applied for the zero-component for catheter blockages and displacement. Different conclusions may be resulted with 0.1% type I error for catheter displacement.
5 Discussion
Inflated zeros is a ubiquitous issue in biomedical and psychosocial research and practice. Although an extensive literature exists on zero-inflated models and their applications, testing of inflated zeros is underdeveloped and the Vuong test is “the” test for such purposes. However, the Vuong test is not appropriate for testing inflated zeros, because of the serious problem with type I error. The Poisson model is essentially nested in the ZIP model and hence the asymptotic theory of the Vuong statistic for non-nested models is no longer valid. As our simulation study shows, the empirical type I error of the Vuong test may seriously deviate from the nominal one in either directions, even when the sample size is large.
In this paper, we developed a new statistic to address the gap in the current literature. Unlike the Vuong test, the proposed approach specifically tests inflated zeros, with straightforward interpretations. Asymptotic properties for our new test are developed for large samples, and simulation studies show that it also performs quite well, in terms of both controlling type I error and power, for small to moderate sample sizes. In all the cases considered, our test shows much better performance in controlling type I error and similar or better performance in power than the Vuong test. Further, unlike the Vuong test, there is no need to specify a ZIP model to perform the test. Thus, our method avoided the uncertainty associated with the specification of different ZIP models.
The new test is based on a Poisson model, so different conclusions may still be obtained if different Poisson models are utilized. This seems unavoidable since the phenomenon of zero-inflation refers to the fact that there are more zeros than that would be expected under some models such as Poisson. Note that our test does not test the validity of the Poisson model. Thus, ideally, the test may be applied when a Poisson model is validated for the at-risk group. For example, one may apply a goodness-of-fit test for the corresponding zero-truncated Poisson model to the data with all zero responses deleted.
We only considered the Poisson model in this paper. The approach may be extended to other distributions. Although analytic forms may vary, the same considerations should apply when considering other distributions.
Footnotes
Declaration of conflicting interests
The author(s) declared no potential conflicts of interest with respect to the research, authorship, and/or publication of this article.
Funding
The author(s) disclosed receipt of the following financial support for the research, authorship, and/or publication of this article: This work was supported in part by NIH grants R33 DA027521, R01GM108337, and P20GM109036.