
Abstract
Very often, data collected in medical research are characterized by censored observations and/or data with mass on the value zero. This happens for example when some measurements fall below the detection limits of the specific instrument used. This type of left censored observations is called “nondetects”. Such a situation of an excessive number of zeros in a data set is also referred to as zero-inflated data. In the present work, we aim at comparing different multivariate permutation procedures in two-sample testing for data with nondetects. The effect of censoring is investigated with regard to the different values that may be attributed to nondetected values, both under the null hypothesis and under alternative. We motivate the problem using data from allergy research.
1 Introduction
Investigating the Immunoglobulin E (IgE) values related to specific allergens is crucial for assessing possible allergic diseases. Indeed, the presence of IgE antibodies is a necessary, but not sufficient, condition for the development of the corresponding allergy. The ImmunoCAP ISAC® is a miniaturized immunoassay platform that allows for multiplex measurement of specific IgE antibodies to many allergen components from human serum or plasma, resulting in fluorescent signals (microarray) which are then transformed into a semi-quantitative ISAC Standardized Unit (ISU). It is common when dealing with microarray data that observations may fall below the detection limits, thus leading to a large proportion of left-censored data (“nondetects”), often resulting in recorded zero values, or the smallest value detectable. When this data collection process results in an excessive number of zeros, this problem is also known as zero-inflated data. 1 These types of zeroes or nondetects cannot be considered missing values since they contain valuable information about the phenomenon of interest as they contain information on dependence relations among the many observed variables. Thus, we must take them into account in the analysis. Most of the literature on censored data revolves around survival analysis with right-censoring.2–4 Quite recently, Dobler and Pauly 5 have proposed nonparametric statistical inference procedures for both the Mann-Whitney effect P and the odds of the Mann-Whitney effect W in a classical survival model with non-informative randomly censored data, even allowing for ties in the data.
Furthermore, in case of diagnostic markers, it is common to use the receiver operating characteristic (ROC) curve and the area under the curve (AUC).6–8 Schisterman et al. 9 discuss an approach based on the Box–Cox power transformation, useful when dealing with ROC curves.10,11 The authors show how this transformed normal approach can be developed to estimate the AUC for positive continuous data that may have zero values with positive probability.
In the framework of ANOVA and in the field of likelihood ratio tests, Farcomeni 12 has developed an asymptotic test for multivariate lognormal data with a point mass at zero, generalizing Wilks' lambda and Hotelling's T2-test to the case of semicontinuous data. In the same framework, Thulin 13 discusses some parametric and nonparametric multivariate tests for biomarker data with nondetects. They argue that parametric tests perform better than their nonparametric alternatives.
In this paper, we aim at providing and comparing different solutions for multivariate two-sample testing with nondetects, with particular attention towards allergy research or immunology. In such a context, it is common to investigate specific IgE values related to several allergens, thus we refer to multiple endpoints. In many biological or medical data applications, the data distribution is far from normal, in particular in a multivariate setting, and this can impact the reliability of traditional parametric approaches. This is the main reason why we decide to stay within a nonparametric framework in the context of permutation tests. Here, no assumption for the underlying population is required, except for the “equality of underlying distributions” under null hypothesis, that is, when there are no treatment effects and treatments are randomized to subjects.
Bathke et al.14–18 and Liu et al.
19
proposed nonparametric versions of some parametric multivariate test statistics, also providing small sample approximations. The four rank-based tests they considered were of the ANOVA type, Wilks' Lambda type, Lawley-Hotelling type, and Bartlett-Nanda-Pillai type. Furthermore, recently Ellis et al.
20
and Burchett and Ellis
21
developed an R package (
In the present paper, we also propose three permutation tests based on known test statistics following the nonparametric combination (NPC) methodology 22 as a tool for obtaining multivariate results. In particular, we consider (1) a permutation test based on the Anderson-Darling test statistic with normalized distribution function, 23 (2) a permutation test based on Mann–Whitney test statistics with mid-ranks, and (3) a permutation test based on the traditional difference of sample means.
The following sections present the description of the permutation procedures and an overview on the NPC methodology. A comparative simulation study is presented to assess the behaviour of competing tests with data affected by nondetecs both under the null hypothesis and with regard to their power. We investigate the effect of censoring in different situations depending on the value assigned to non-detected observations (say ND). We also investigate the effect of different types of nondetected values with different scores. Finally, a recent study on exposure to allergens and the influence on IgE sensitization has been considered as a genuine application example.
2 Competing permutation tests
In the present section, we review some permutation tests based on the R package
We assume that
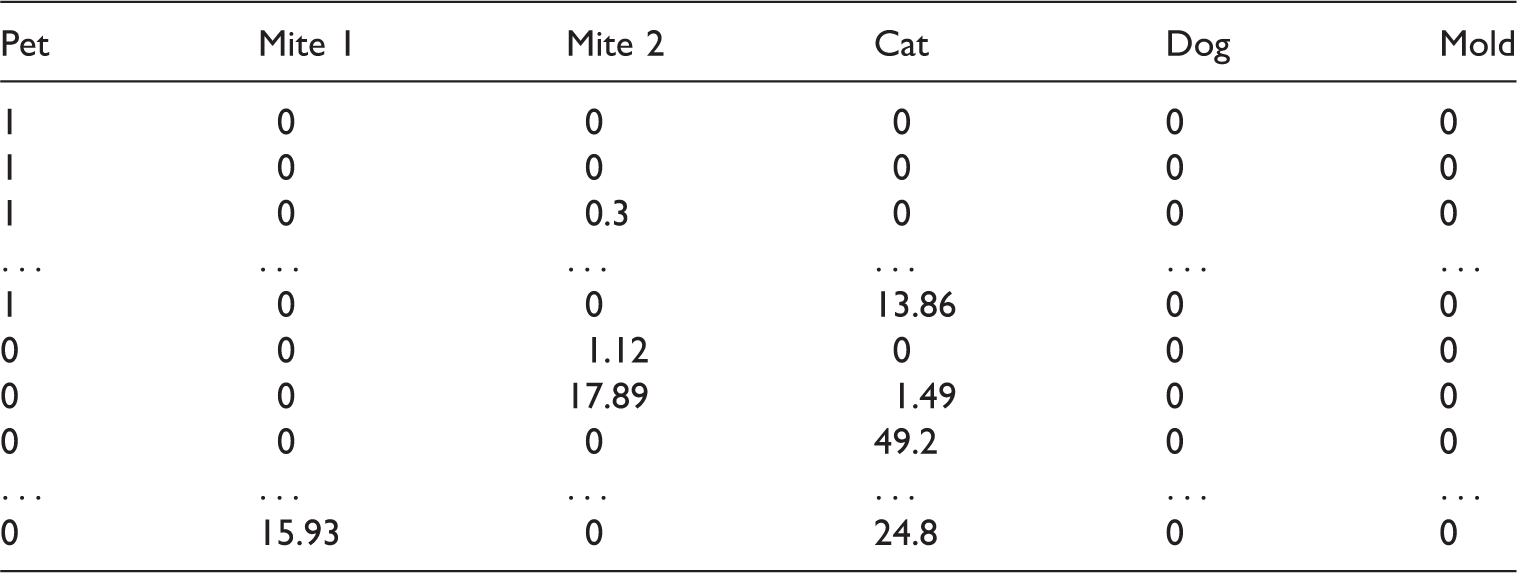
Example allergy data.
2.1 Multivariate tests from npmv package
Before elaborating on permutation tests for inference on multivariate data using the R package
2.1.1 ANOVA type statistic
The ANOVA type statistic is defined as

2.1.2 Wilks' Lambda type
Wilks' Lambda type statistic is defined as

2.1.3 Lawley Hotelling type
The Lawley Hotelling type statistics is calculated as

2.1.4 Bartlett Nanda Pillai type
The Bartlett Nanda Pillai type statistic is defined as

For each of these tests, the permutation distribution is computed by permuting the N data vectors and recalculating the multivariate test statistics each time. The corresponding p-value statistics are computed considering the quantiles of the permutation distribution. That is, they are calculated as the percentage of values of the permutation distribution that are exceeding or equal to the value of the observed test statistic. Indeed the so-called p-value statistic, considered as a transformation of a permutation test T, namely
2.2 NPC-based tests
Let us now define the multivariate permutation tests in the NPC framework. 22 It is quite common in testing hypotheses that two or more aspects are of interest, and in such a case it is convenient to process data using a finite number of different partial tests (e.g. one for each aspect of interest). These partial tests, if jointly considered, can provide information on a general overall hypothesis that typically represents the objective of the simultaneous or multivariate testing problem. However, in the majority of real situations, independence between partial tests is difficult to be justified. Indeed, often partial tests are dependent in a way that is difficult to model explicitly, and to handle.
Furthermore, due to conditioning on the pooled data vector
Let us define the three test statistics:
2.2.1 Anderson–Darling
The Anderson–Darling test statistic with normalized distribution function is defined as

2.2.2 Mann–Whitney
The Mann–Whitney test statistic based on midranks is defined as

2.2.3 Difference of means
The difference of means test statistic is defined as

Note that these test statistics have to be computed separately for each of the K components, but jointly (or synchronized) in the sense of being computed with just the same permutation of individual vectors so as to preserve sufficiency of pooled data X, and thus the underlying unknown dependence structure between the response variables, resulting in a K-dimensional vector of test statistics. Also in this case we compute the permutation distribution of each test by permuting the N data vectors and recalculating the test statistics each time and for each variable. Based on these distributions, we can compute a K-dimensional vector of p-value-statistics
In order to obtain a multivariate result, let us introduce the method of NPC of a finite number of dependent tests. Substantially, this approach corresponds to a method of analysis carried out in two successive phases, the first focusing on K partial aspects, and the second on their combination. Obviously, in order to preserve the sufficiency property of X, especially with respect to the underlying dependence structure among the variables, permutations must always be carried out on individual data vectors, so that all component variables must be jointly analyzed.
The NPC in one second-order test the Fisher omnibus combining function defined as the Liptak combining function defined as the Tippett combining function defined as
3 Nondetects in allergy research
Exposure to indoor allergens is crucial for IgE sensitization and development of allergic symptoms. Exposure to allergens is a prerequisite for initiating an allergic sensitization leading to the production of allergen-specific IgE antibodies. However, there exist findings that show that the repeated exposure to allergens can lead to an immune response with an increase of the IgE antibody levels in the blood. 37 In a study conducted in Austria, 24 501 adolescents from Salzburg were involved, where serum samples of participants were analyzed for specific IgE to Der p 1 (Mite 1), Der p 2 (Mite 2), Fel d1 (Cat), Can f 1 (Dog), and Alt a 1 (Mold) using a multiplex array ImmunoCAP ISAC.
Summary of nondetects in example data.
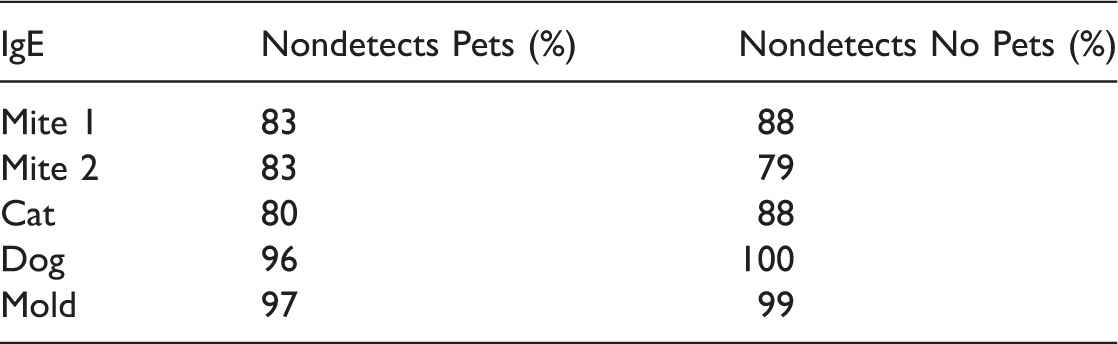
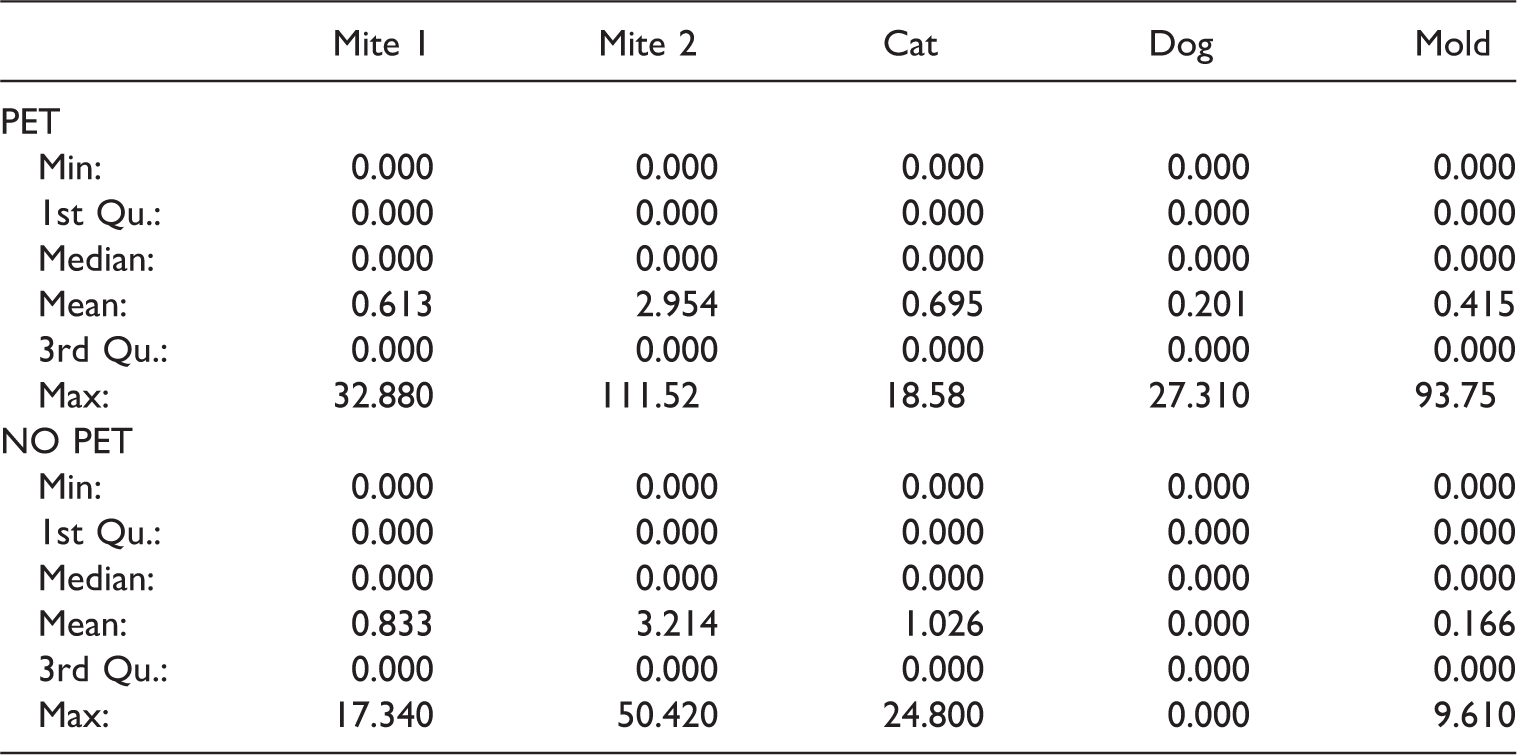
Figure 1 shows the sample distributions in the two groups through violin plots of IgE values for five antibodies. As we can see from the solid dots which represent the sample means, in each variable, the data present very close means, but rather different distributions. Furthermore, some descriptive statistics of the data are shown in Table 3.
Violin plot of IgE values for five allergens: comparison between participants with pet and no pet. Dot represents sample mean. Main descriptive statistics of the example data.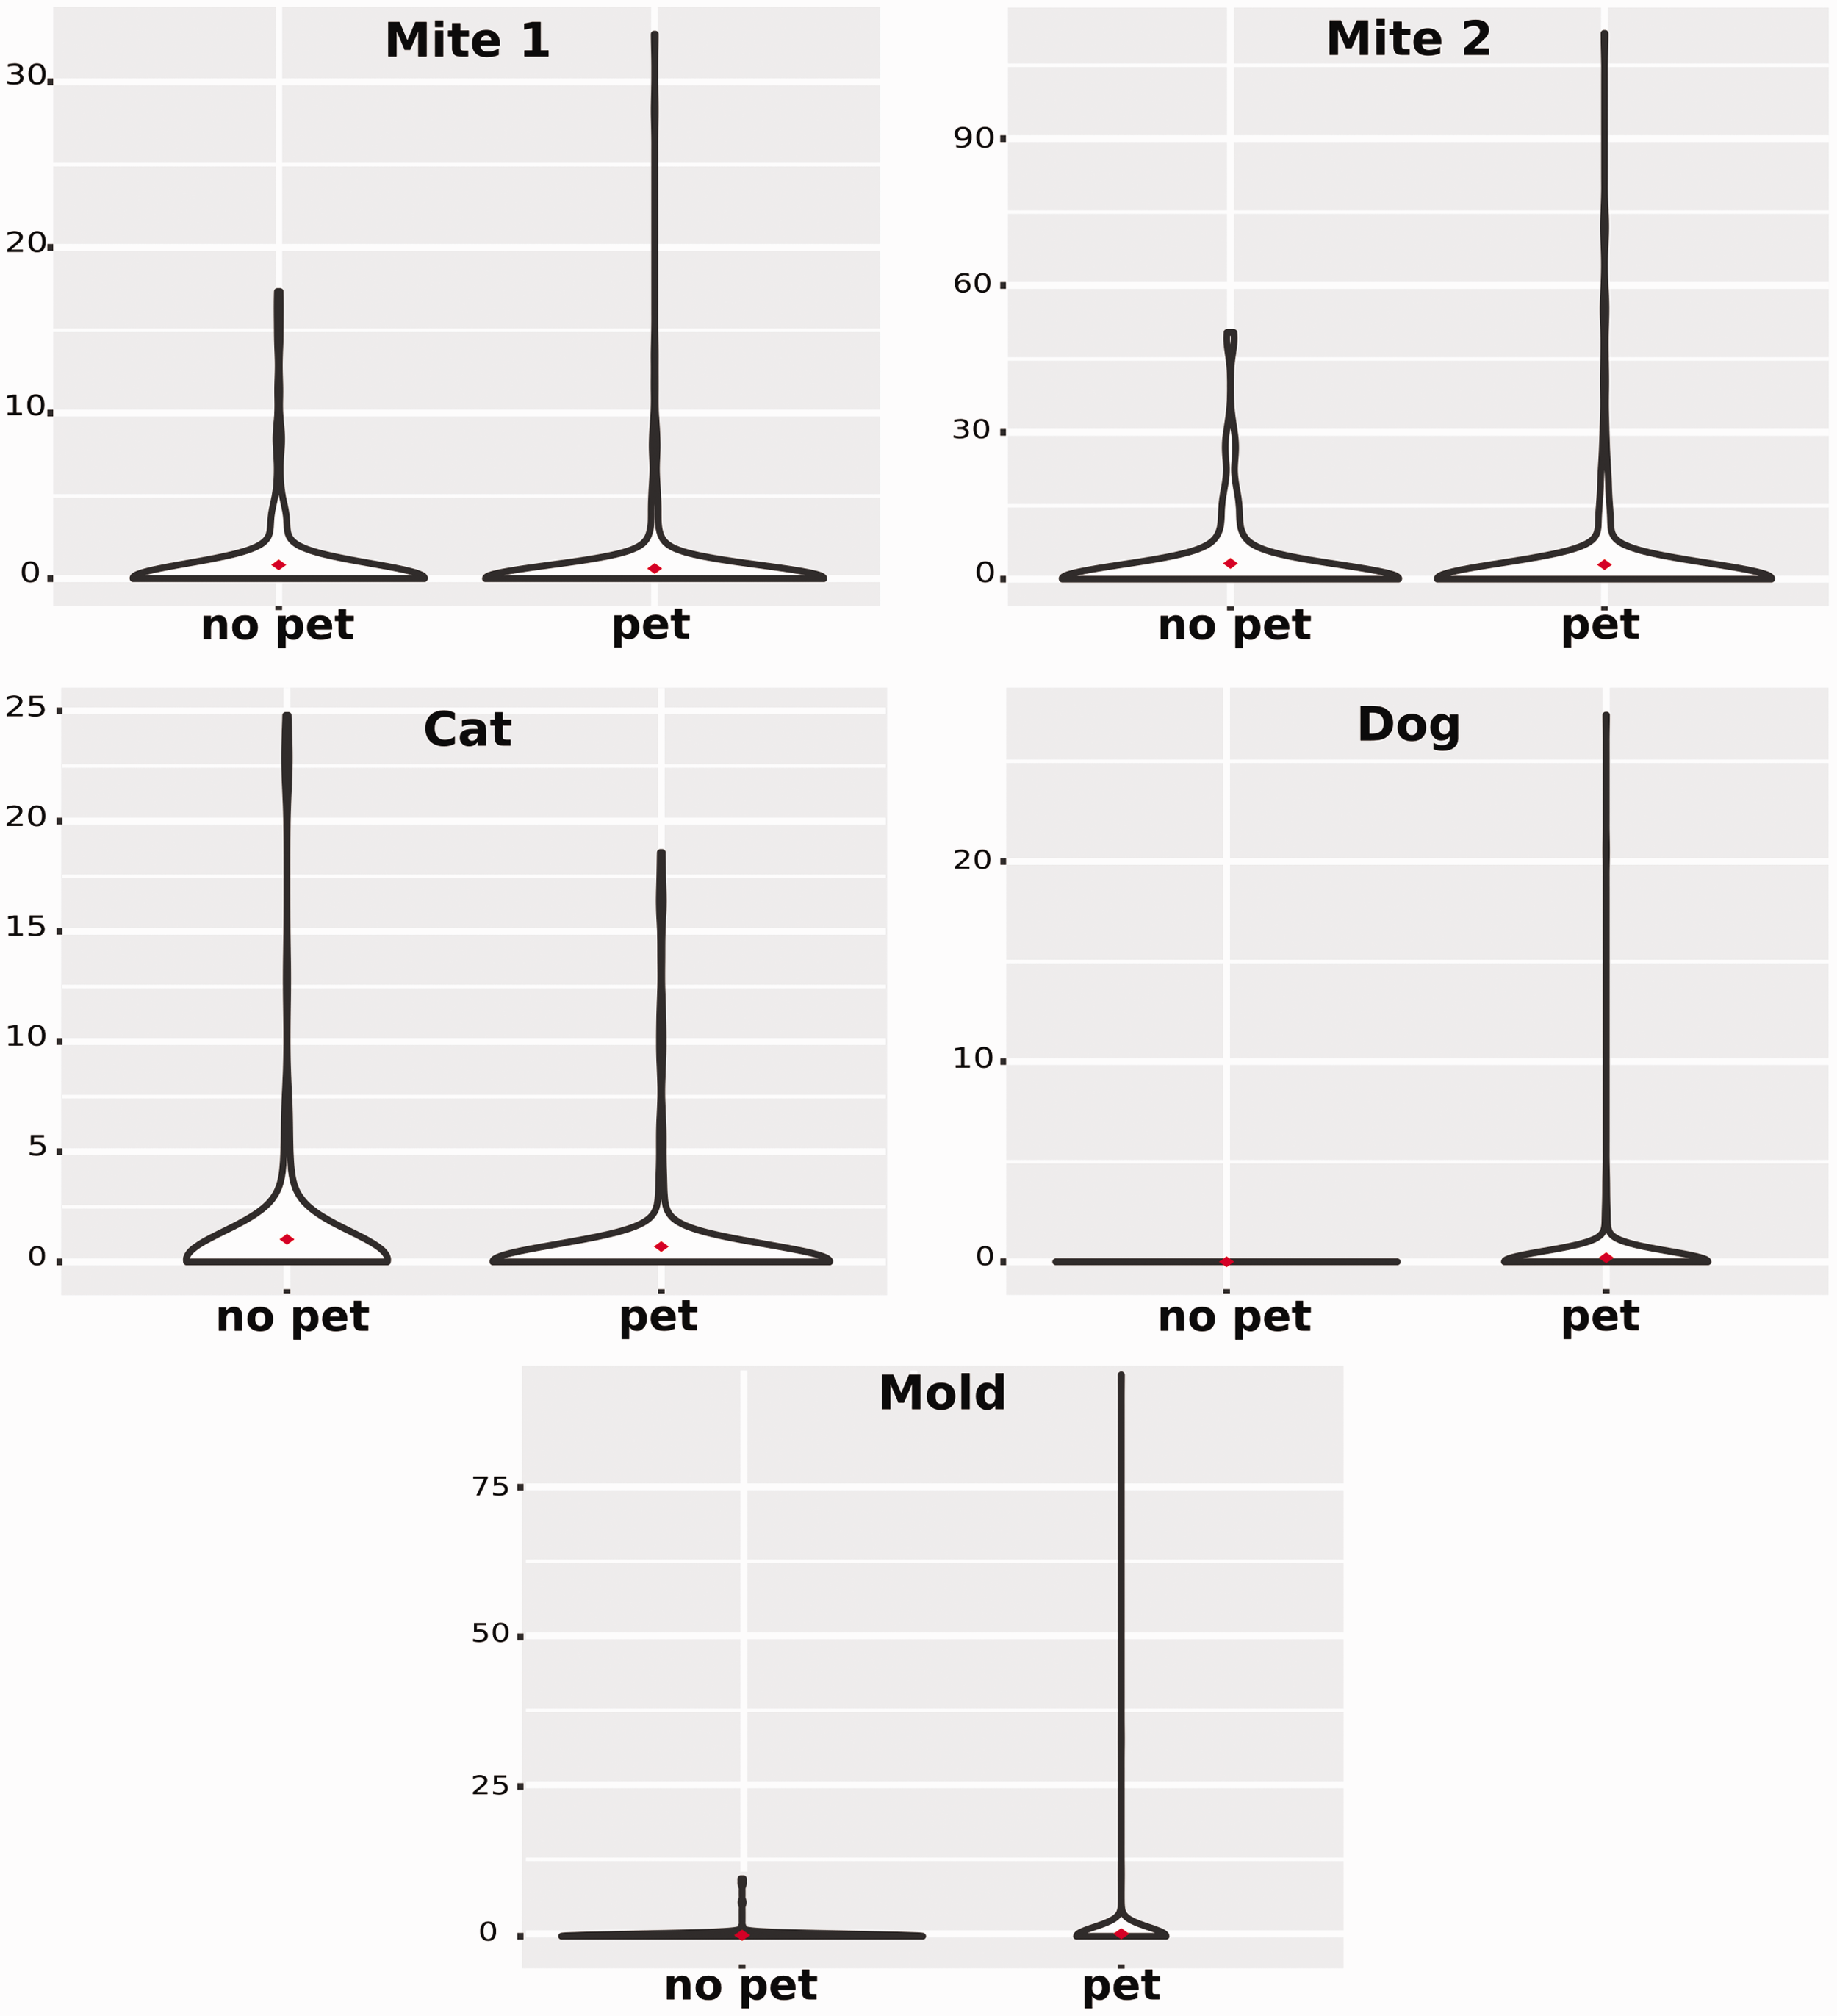
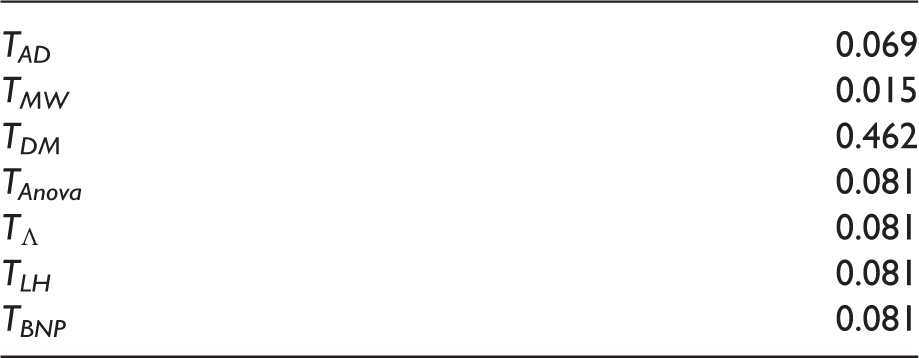
P-values of global tests: Anderson-Darling (TAD), Mann–Whitney (TMW), difference of means (TDM), Anova type (TAnova), Wilks' Lambda type (
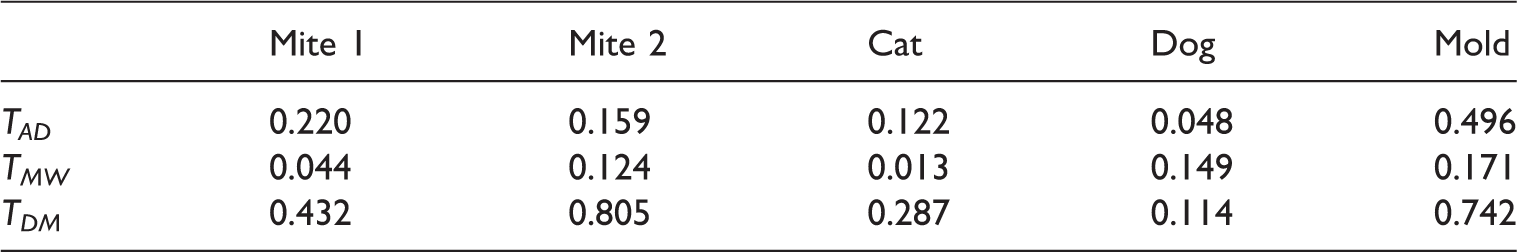
P-values of partial tests for NPC-based tests Anderson-Darling (TAD), Mann–Whitney (TMW), difference of means (TDM) using 10,000 permutations.
4 Simulation study
In this section, we show the results of a simulation study aiming at comparing the seven permutation tests described in the previous section.
4.1 Assessing different values assigned to nondetects
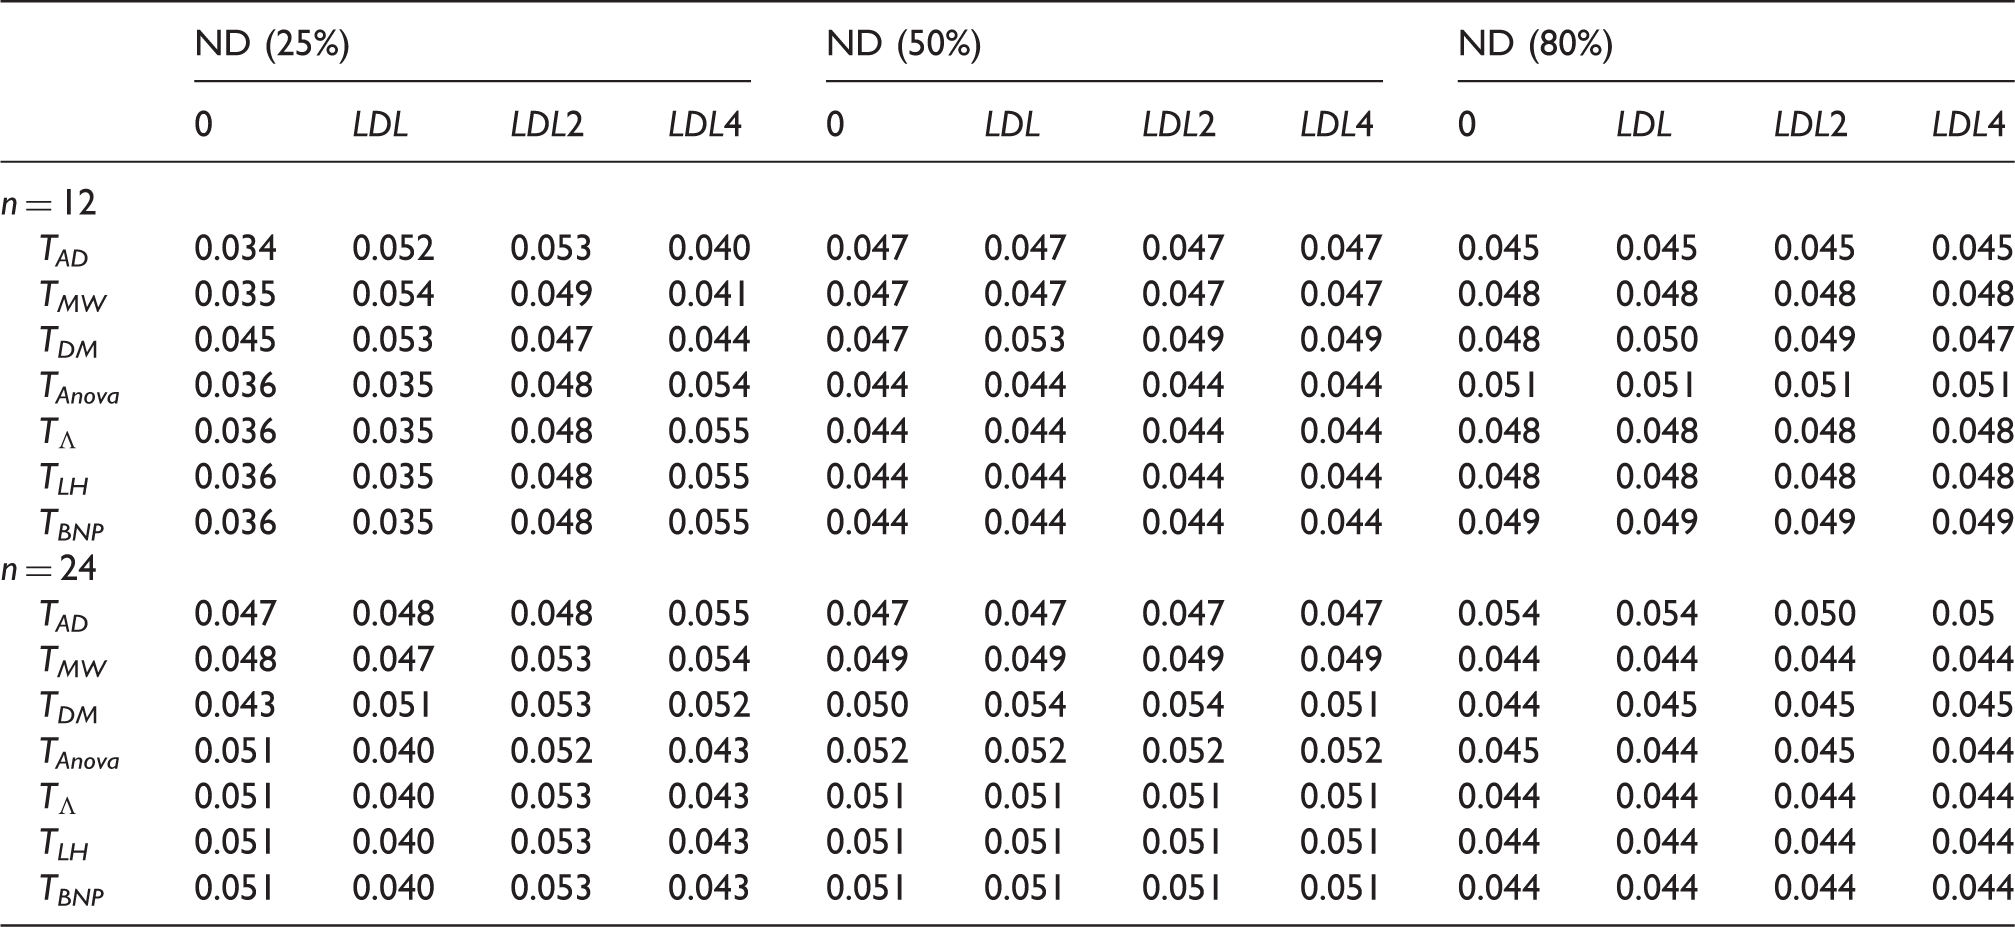
In this first part of the simulation study, we investigate how the type I error rates of the compared tests are affected by censoring. Here we also try to assess if different values assigned to ND observations affect the results of the tests. It is common that when a measure falls below detection limit, it is assigned the value zero or the lowest detection limit (LDL). In this simulation study, we investigate the following situations: (a) ND fixed at 0; (b) ND fixed at LDL; (c) ND fixed at - Data randomly generated by - Independent variables vs. correlated variables ( - Equal sample sizes: - - Fixed percentage of ND: 25%, 50%, 80%; -
We performed 2000 random permutations on each of 1000 MC simulations.
Note that for these settings, we kept the percentage of ND fixed, and for each sample size and correlation setting, we compared the seven tests in each situation (a)–(d). For example, when the percentage of ND was fixed at 25%, the lowest detection limit was 0.96. Therefore, values generated below 0.96 were set to (a) 0, (b) 0.96, (c) 0.48, (d) 0.24.
Simulated sizes of the tests Anderson-Darling (TAD), Mann–Whitney (TMW), difference of means (TDM), Anova type (TAnova), Wilks' Lambda type (
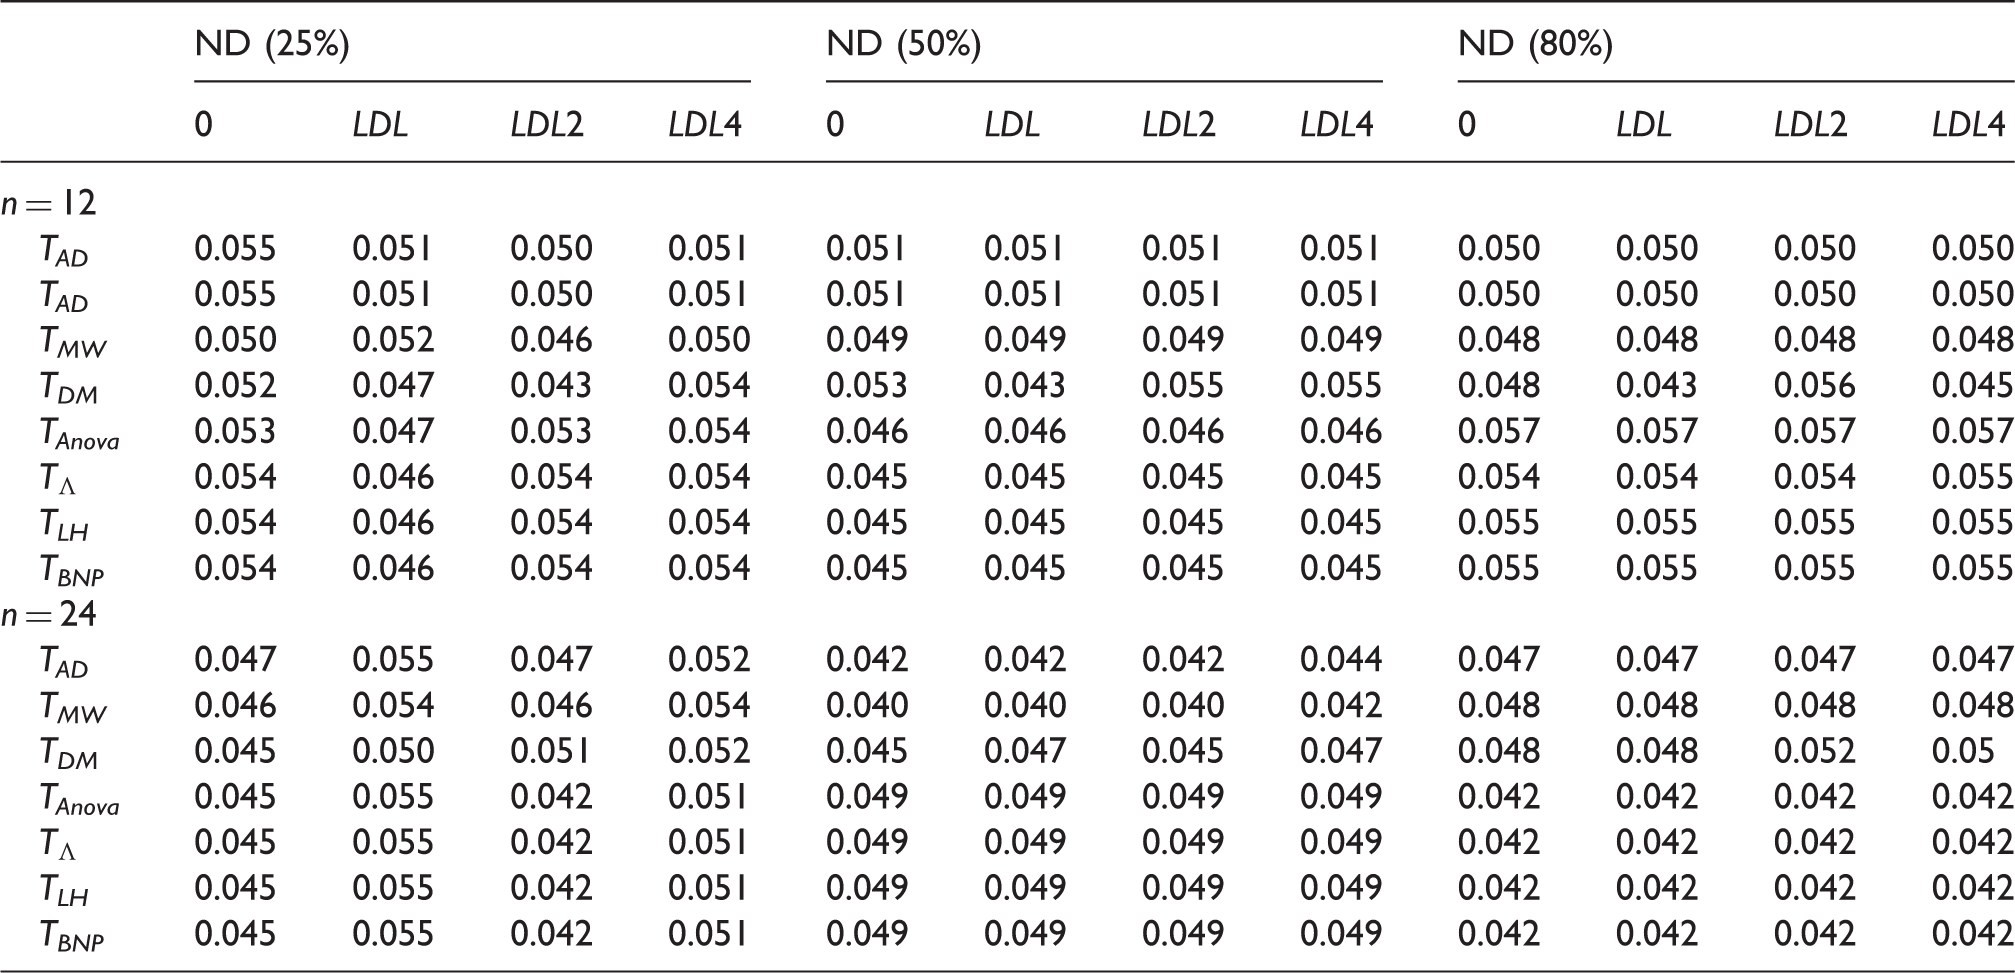
Size of the tests Anderson-Darling (TAD), Mann-Whitney (TMW), difference of means (TDM), Anova type (TAnova), Wilks' Lambda type (
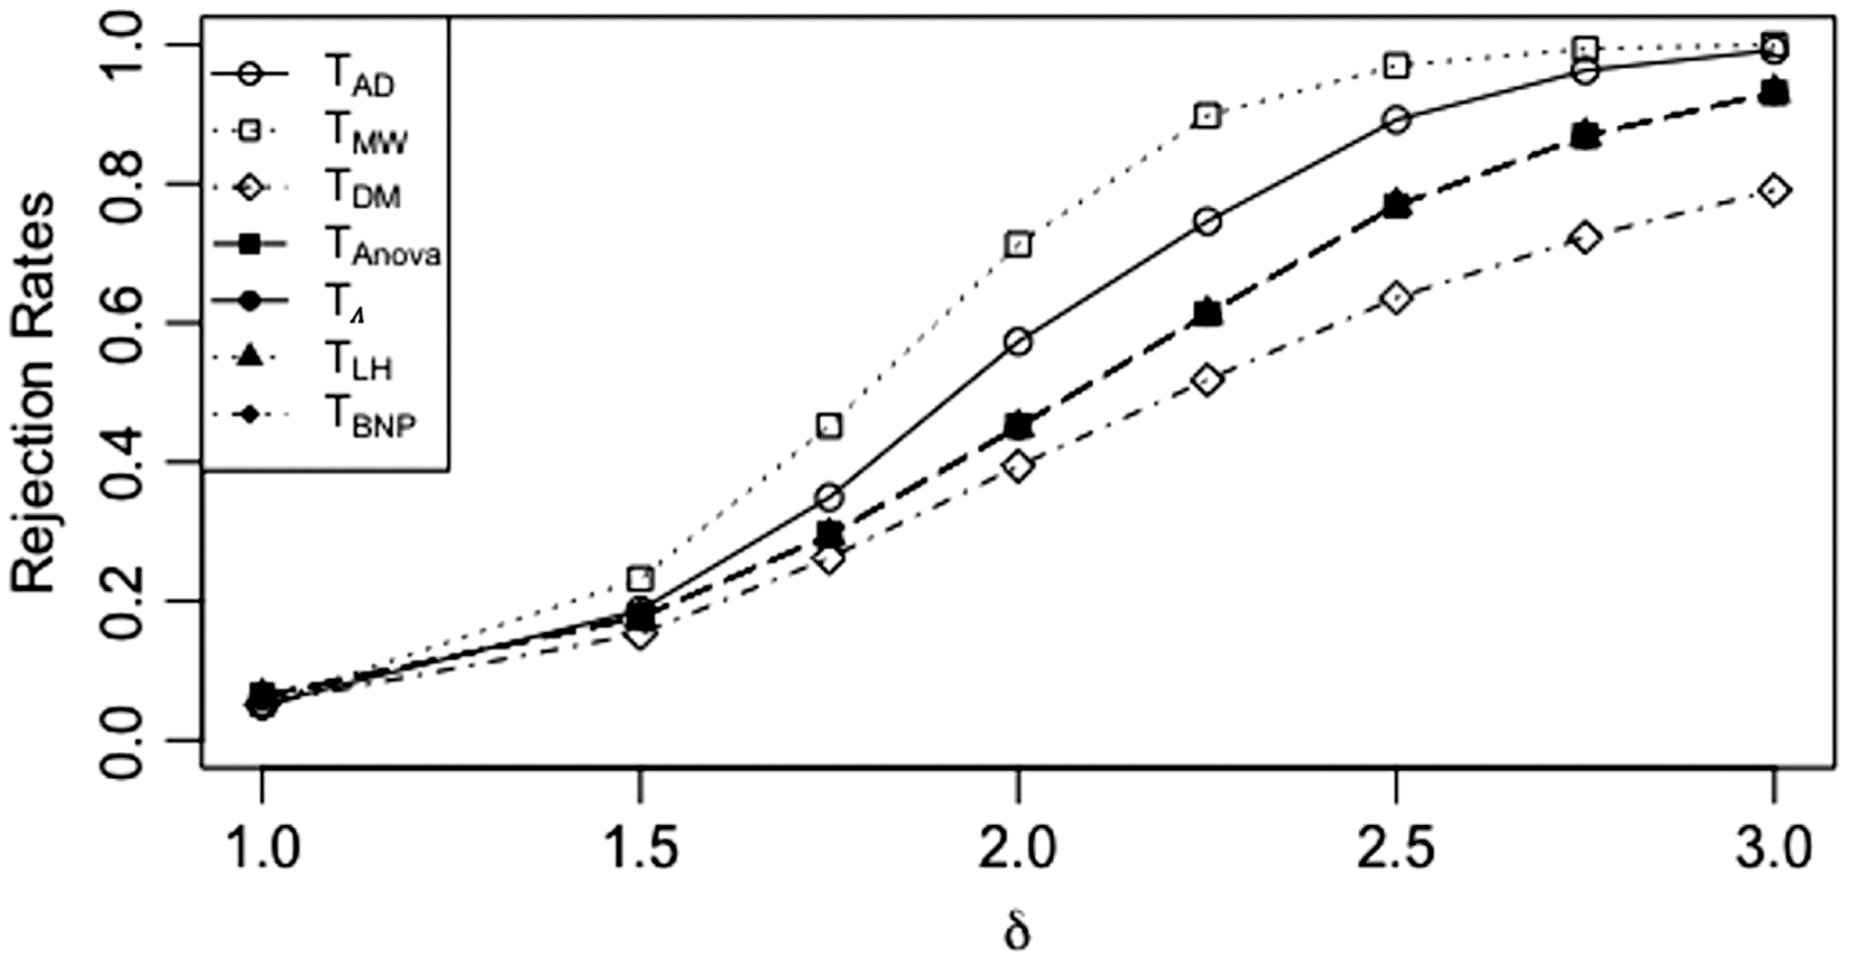
In order to investigate the behaviour under the alternative hypothesis, we consider a multiplicative shift Rejection rates of the seven tests Anderson-Darling (T
AD
), Mann-Whitney (T
MW
), difference of means (T
DM
), Anova type (T
Anova
), Wilks' Lambda type ( Rejection rates of the seven tests Anderson-Darling (T
AD
), Mann-Whitney (T
MW
), difference of means (T
DM
), Anova type (T
Anova
), Wilks' Lambda type (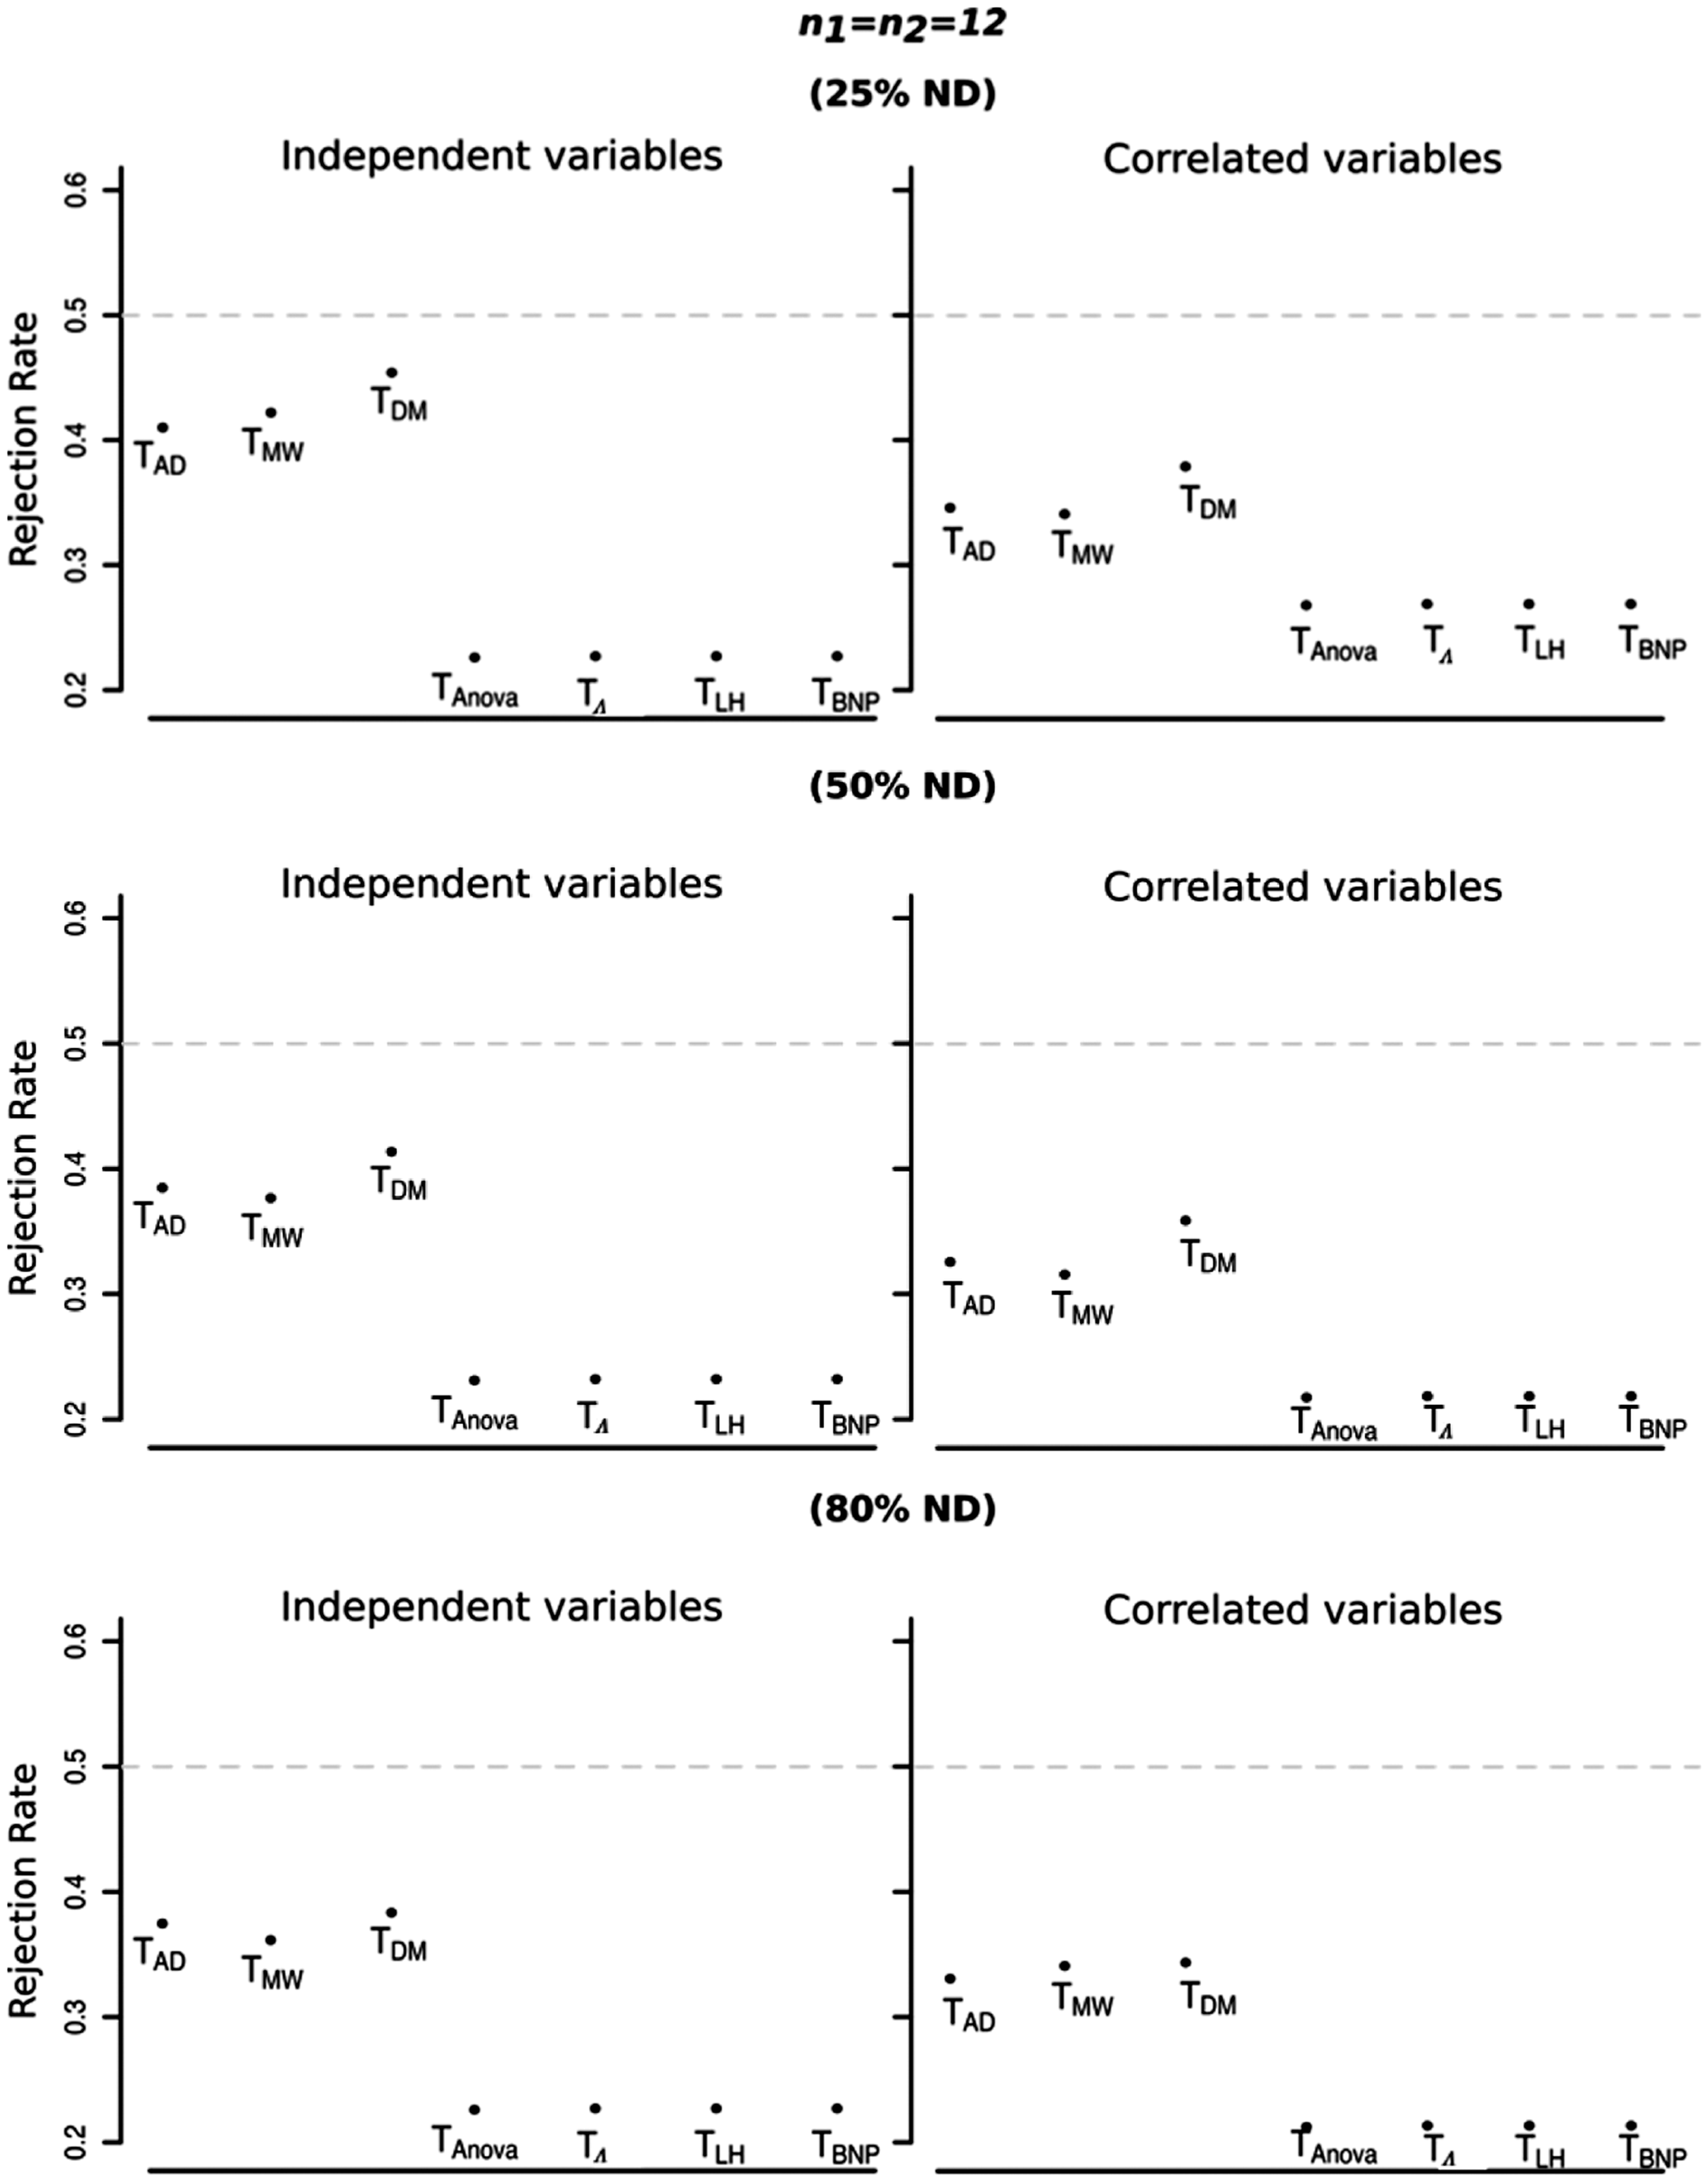
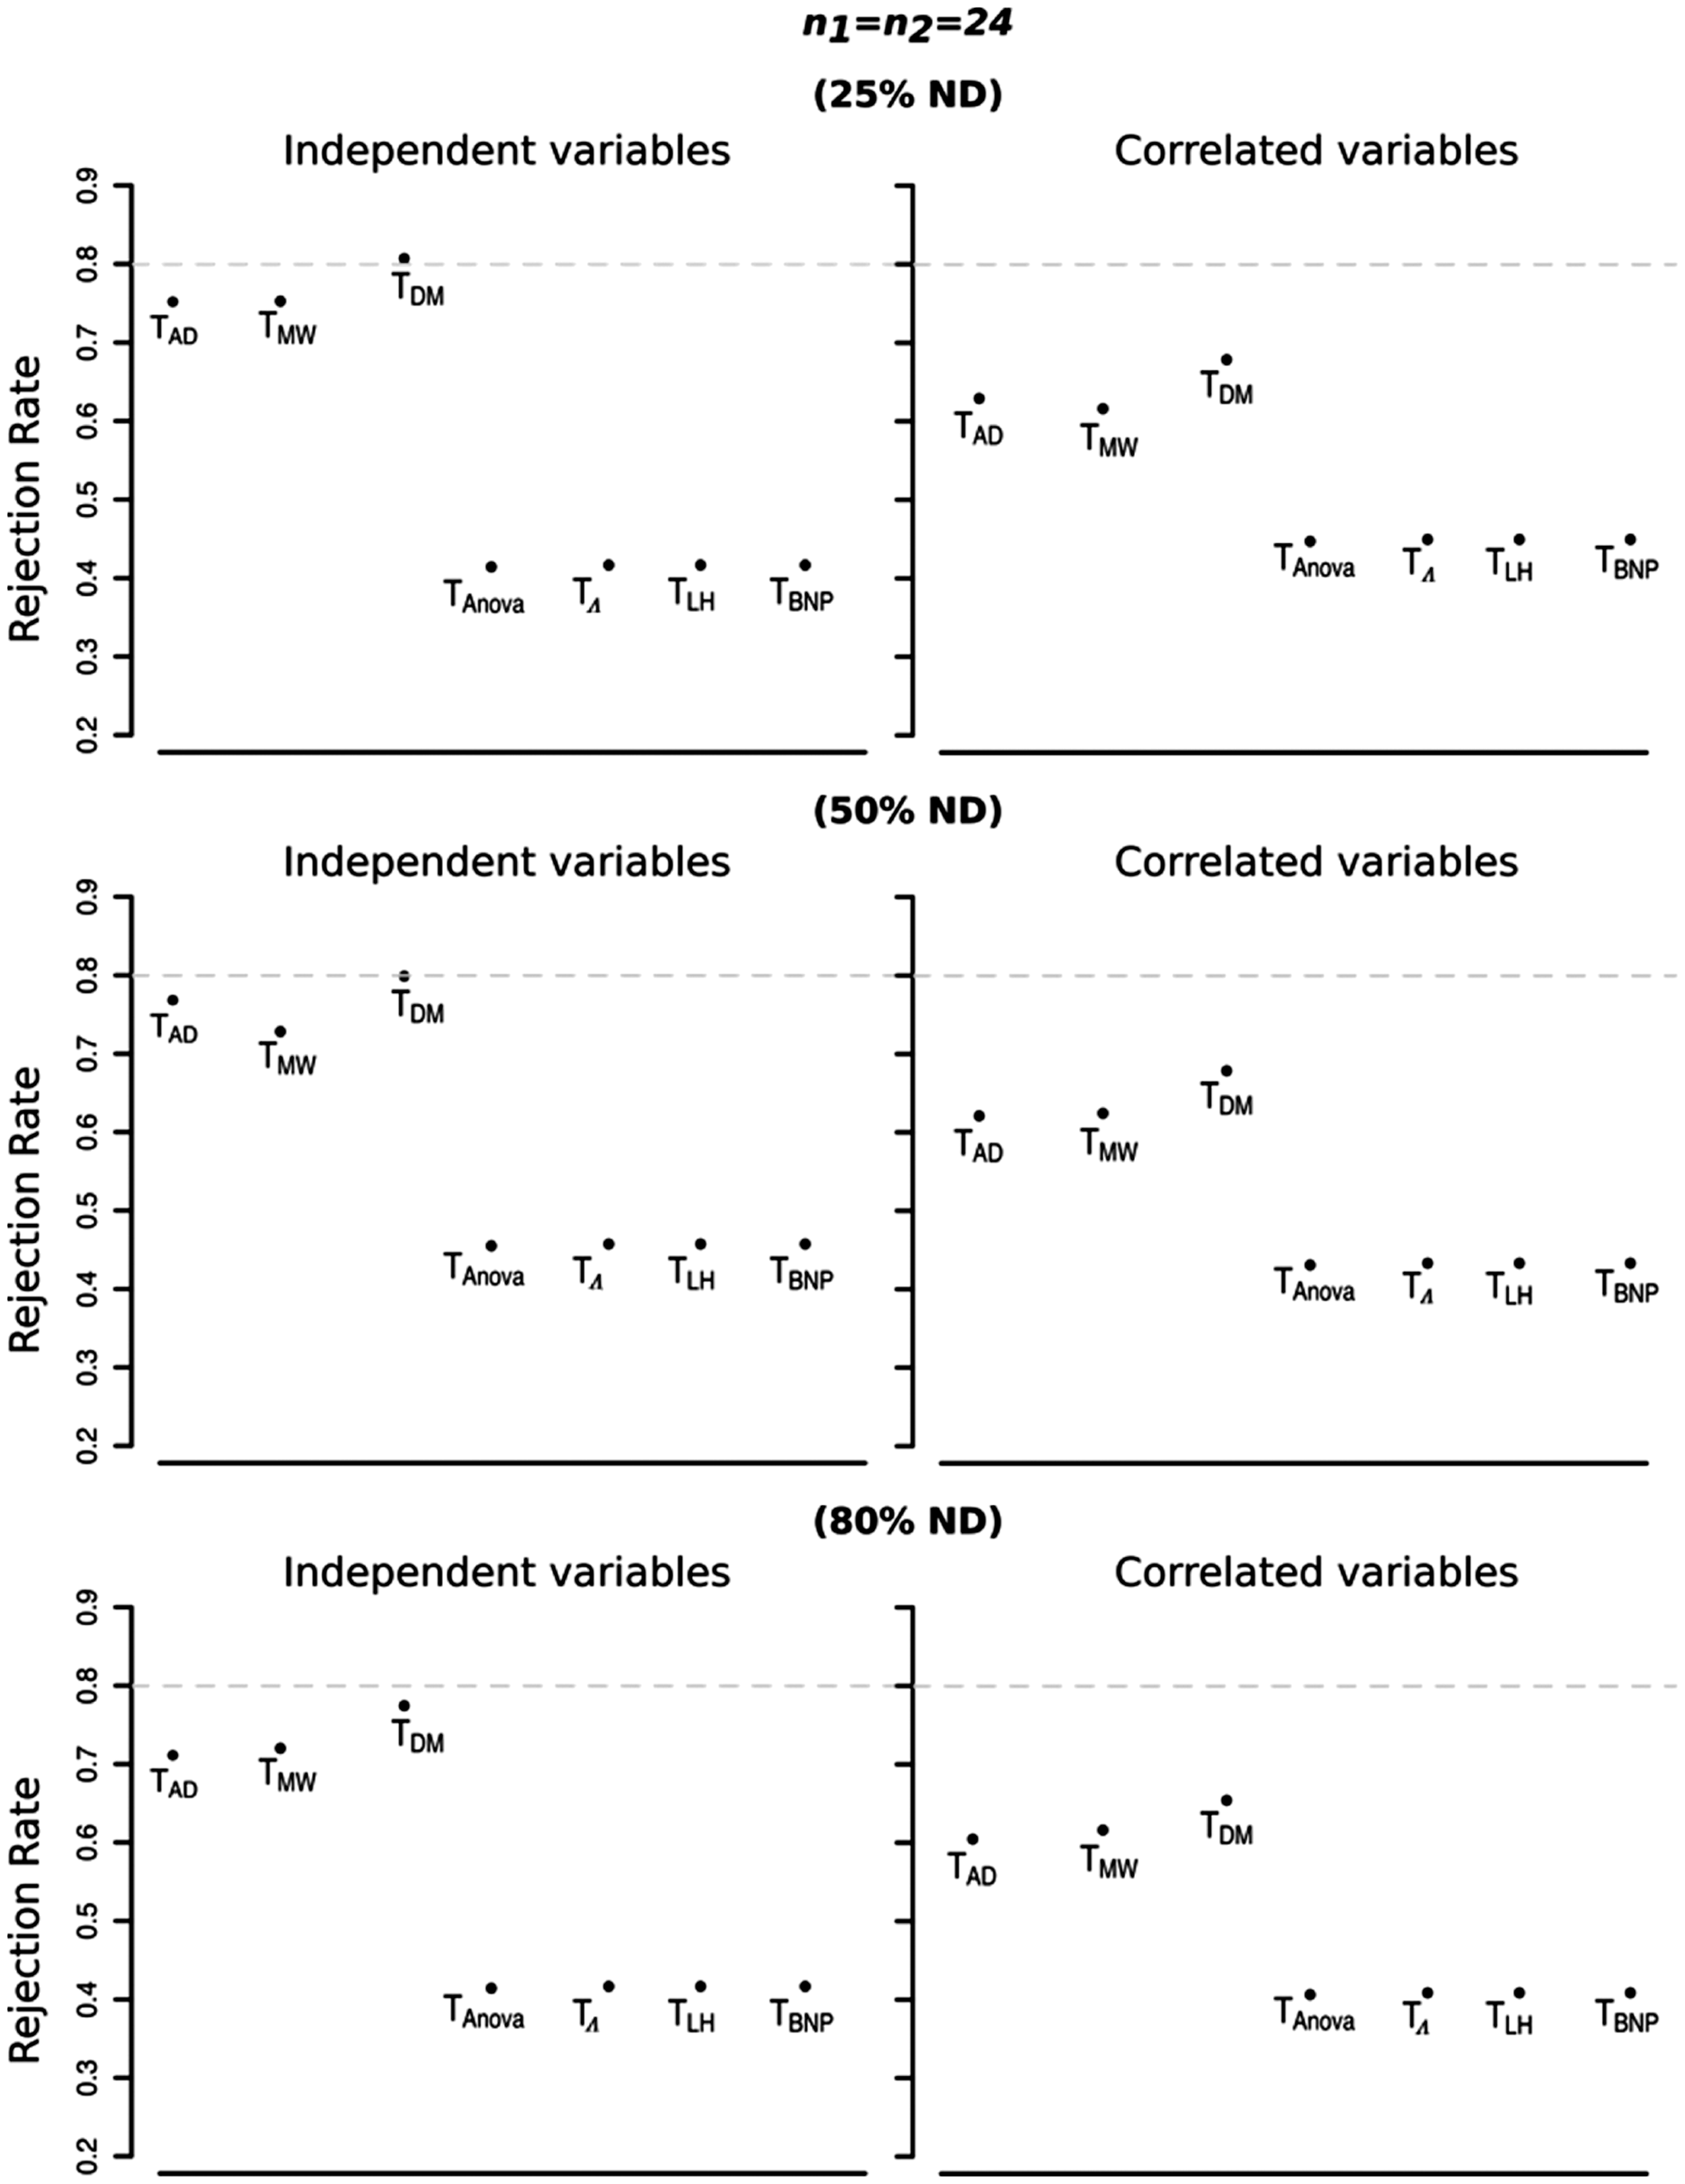
In general, we can see that methods from npmv package behaved very similarly to each other in all situations whereas NPC-based methods performed quite similarly to each other and always better than methods from
4.2 Evaluating performance for increasing percentage of nondetects
After having assessed that the values assigned to ND do not affect the performance, we further investigate the general behaviour of the tests as the percentages of ND increase. In what follows, we consider the value of ND fixed at 0. We firstly continue to considering Effects of increasing percentage of ND for different sample sizes and variance/covariance matrices. (a) Rejection rates for 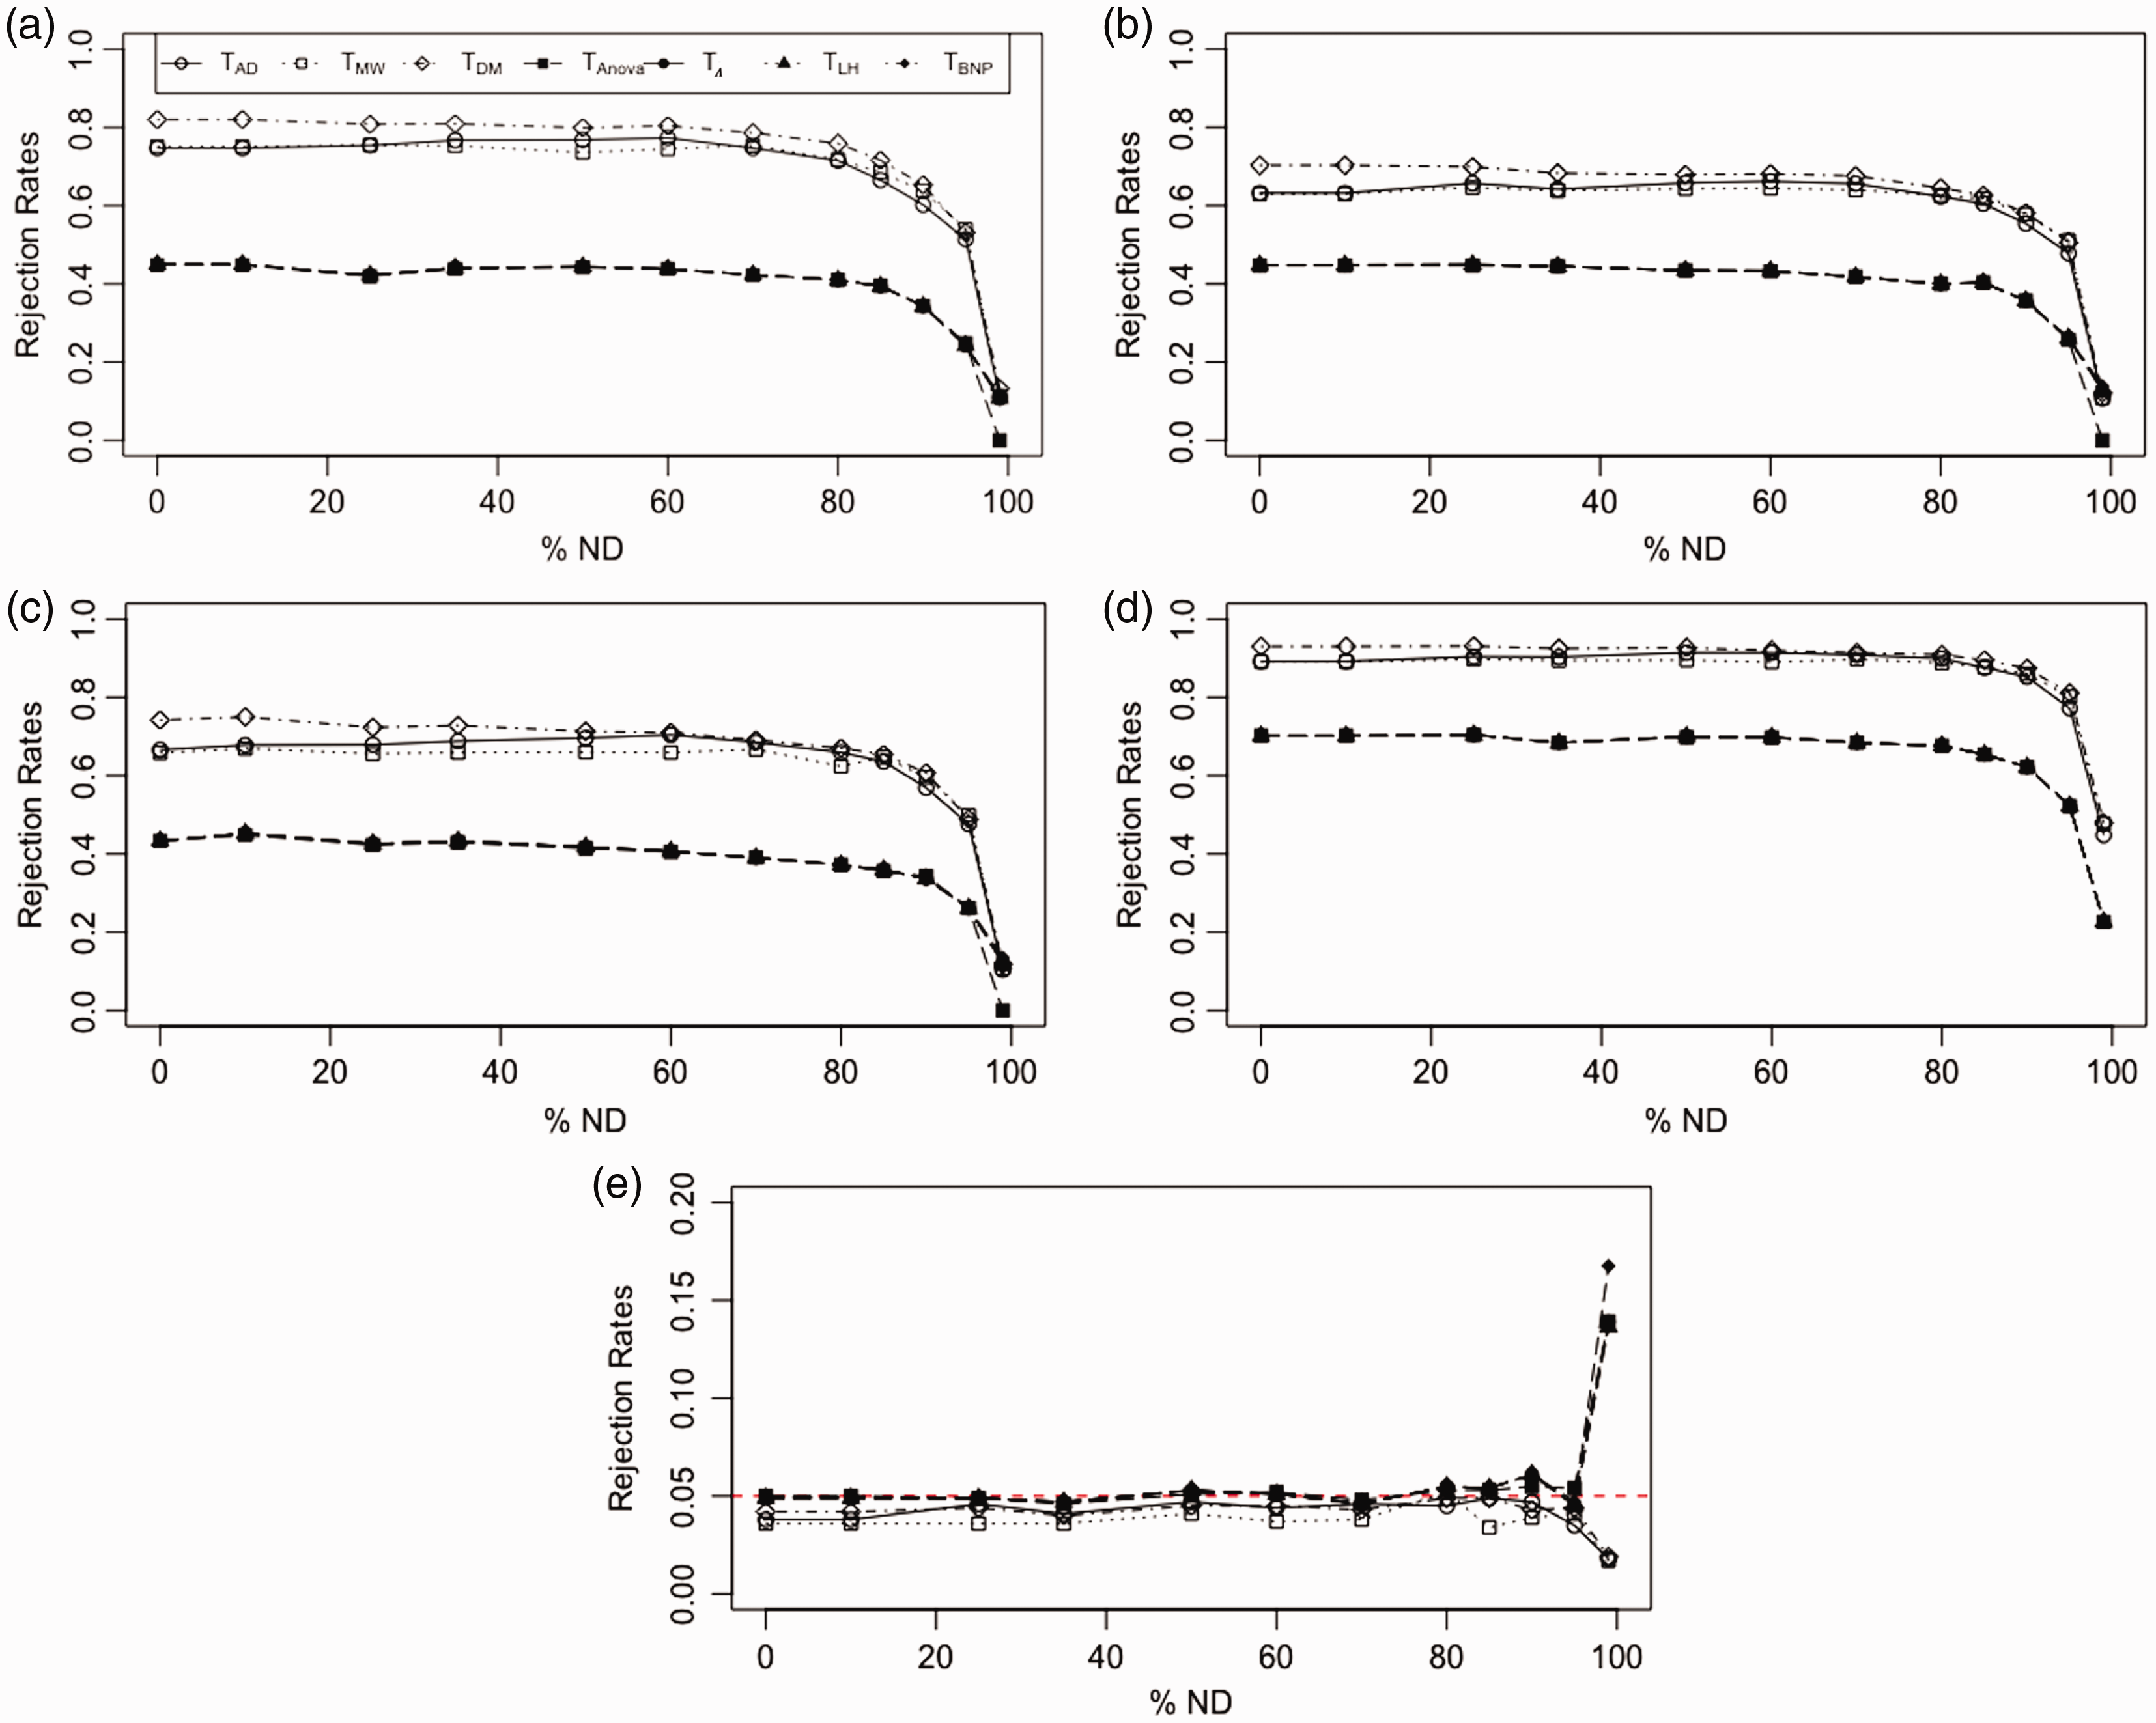
In order to consider a distribution which mostly reflects the extreme situation of our real dataset, we chose the Pareto distribution with shape parameter a = 1. As we can see from Figure 5(a), in this extreme situation, T
DM
becomes ineffective for detecting differences as shown by the lower rejection rates. Figure 6 displays the rejection rates of the tests as the effect δ increases for a percentage of ND fixed at 85%. The curves of the tests from the Effects of increasing percentage of ND when data are generated from Power of the tests with data from 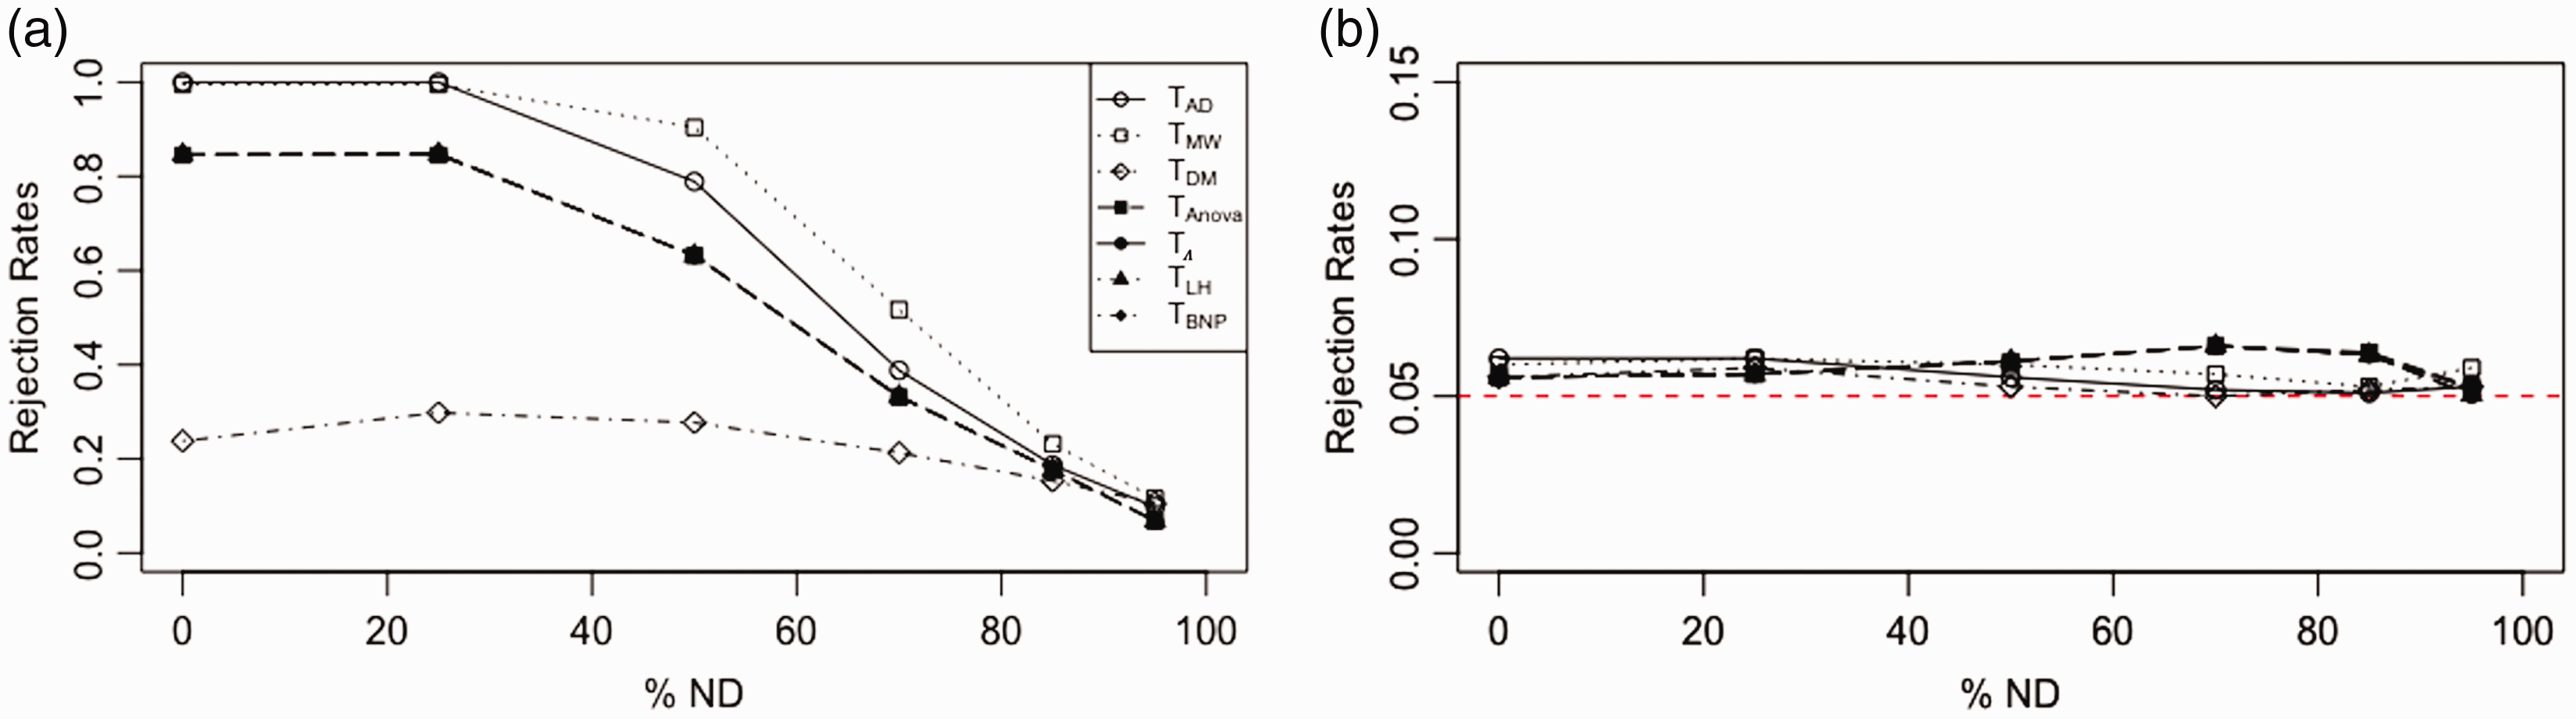
5 Conclusions and future perspectives
In this work, we have addressed the problem of analyzing data including nondetects, that is, left-censored data where the censoring may often be due to insufficient precision of the measurement instrument when trying to detect small data values. For example, this is a very common feature of data originating from microarrays. We motivate the problem showing a genuine example from allergy research, where data were characterized by a large amount of zeroes or nondetect values. In the application example, we were interested in assessing whether being a pet owner impacted the IgE levels for different groups of antibodies. Several of the measured IgE values were zero (or too small to be detected), and this was useful information related to the problem.
Regarding two-sample permutation tests studied in the present paper, it emerged that T
DM
may become ineffective in extreme situations such as when the data come from a distribution like
The R codes to achieve the NPC-based tests presented in this work are available in a public GitHub repository under the name NPCnondetects.
In a next step, similar to testing in the presence of non-ignorable missing data
22
(pp.232–251), we plan to consider a multi-aspect test
39
approach. That is, for each endpoint two tests are performed separately but simultaneously, one for the proportion of zeroes or nondetects, and one for observed positive data, and these are combined using NPC. In this way, we can investigate the probability of zeros or nondetects, as well as the “visible” effects of the treatment (or pseudo-treatment). From preliminary simulations, we conjecture that this way of testing presents good operating characteristics both under the null hypothesis and in power. Moreover, since
Footnotes
Acknowledgements
The authors would like to thank the Editor and Referees for useful comments and suggestions which helped improving the manuscript and Professor Ludwig Hothorn for pointing out the problem, and for several interesting discussions in this context.
Declaration of conflicting interests
The author(s) declared no potential conflicts of interest with respect to the research, authorship, and/or publication of this article.
Funding
The author(s) disclosed receipt of the following financial support for the research, authorship, and/or publication of this article: The research was supported by Austrian Science Fund (FWF) I 2697-N31 and UNIPD BIRD185315/18.