
Abstract
Brain functional connectivity is a widely investigated topic in neuroscience. In recent years, the study of brain connectivity has been largely aided by graph theory. The link between time series recorded at multiple locations in the brain and the construction of a graph is usually an adjacency matrix. The latter converts a measure of the connectivity between two time series, typically a correlation coefficient, into a binary choice on whether the two brain locations are functionally connected or not. As a result, the choice of a threshold τ over the correlation coefficient is key. In the present work, we propose a multiple testing approach to the choice of τ that uses the Bayes false discovery rate and a new estimator of the statistical power called average power function to balance the two types of statistical error. We show that the proposed average power function estimator behaves well both in case of independence and weak dependence of the tests and it is reliable under several simulated dependence conditions. Moreover, we propose a robust method for the choice of τ using the 5% and 95% percentiles of the average power function and False Discovery Rate bootstrap distributions, respectively, to improve stability. We applied our approach to functional magnetic resonance imaging and high density electroencephalogram data.
1 Introduction
Functional connectivity is defined as the temporal dependency within spatially remote neurophysiologic events. 1 In the past years, an increasing body of neuroimaging studies explored functional connectivity by measuring the level of co-activation of time series between brain regions.
Graph theory is increasingly used to study brain connectivity either through summary measures of the topological network organisation or by means of connection-level analyses.2,3 In the graphical representation of a brain network, a node corresponds to a brain region while an edge corresponds to an interaction between two brain regions. 4 Nonetheless, there still exists a lack of consensus on how to convert continuous connectivity measures into binary brain networks. Many authors advocated the use of an absolute threshold over the connectivity measure, some preferred the use of a threshold on the network sparsity (proportional thresholding) and other authors recommended multiple-thresholding approaches in which the connectivity matrix is binarised at different values (or different numbers of edges are retained) and the subsequent network properties are studied either as a function of the varying threshold or by integrating over all possible configurations.3,5–10
In the present study, we focus on methods that derive brain functional networks by choosing an absolute threshold on the connectivity matrix. The absolute thresholding rationale is that of bringing out the true underlying network structure by removing all spurious noise-generated edges which are often low-connected pairs in the connectivity matrix.
The first attempts in this direction were made by preserving highly connected edges only, using an arbitrary threshold; however, the results were unreliable and potentially misleading as they were associated with an unknown amount of lost information.6,10
In order to minimise the error generated by the binarisation process, a statistical approach has been proposed that takes into account the properties of connectivity measures and their distribution under a simple null hypothesis. The idea was to move the threshold from an arbitrary value on the connectivity measure to a generally acceptable value of the probability of an observed test statistic under H0. Nevertheless, this probability must be tested for each edge of a network rendering the whole process massively affected by the multiple testing problem.7,11 This is particularly relevant to neuroimaging studies where even high correlations may appear simply by chance. 7
Several approaches were proposed in the neuroscientific literature to address the problem of multiple testing. First attempts were based on adjusting the statistical threshold through a function of the number of tests. 7 However, the extraordinary development of neuroscientific technologies in the last decades has enabled high-resolution brain recording from hundreds to thousands of sites across the brain. This translated into a multitude of pair-wise tests whose Family Wise Error Rates (FWER) could not be controlled without a substantial loss of statistical power.
Developments were made by employing more complex statistical tools such as the false discovery rate (FDR).12,13 By controlling the expected number of false positives, FDR is a less conservative approach which gained popularity in the neuroscientific community.10,14
Important theoretical improvements have been attained in the study of large-scale inference problems in the last 20 years. Storey 15 introduced the positive FDR (pFDR) which represents the expected number of false positives conditioned on a positive number of findings. By fixing a threshold on the p-values and estimating the alpha rate over that threshold, it is possible to conservatively control the pFDR. Efron 16 proposed the local Bayes FDR which can be interpreted as the posterior chance of incurring in a false discovery given the observed p-value. Such approach has the advantages of requiring minimal modelling assumptions and it has a straightforward empirical Bayes estimator.
More recently, a growing awareness in the common practice of statistical testing of the importance of statistical power in the interpretation of evidence has led some authors to explore new paradigms where both type I and type II errors can be combined in the decision process. 17 In the filed of brain networks, Sala et al. 11 proposed a method to derive graphs from pairwise correlation test statistics by controlling type I and type II error rates using pFDR and positive False Nondiscovery Rate (pFNR) and a method for balancing the two errors.
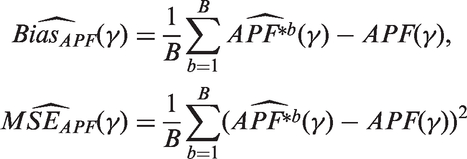
The present study proposes a new Bayesian estimator of the Average Power Function (APF) which extends the so-called Average Power (AP) 17 by making it dependent on the rejection region threshold. We couple the APF with the Bayes FDR 16 for threshold selection in multiple testing procedures. The APF estimator is proven to be unbiased and to asymptotically approximate the actual value of the parameter both in the case of independent and stationary-associated p-values. In the case of brain connections analysis, such an asymptotic approximation is typically adequate because the number of tests involved is fixed but very large. Simulation results show that APF estimator has low bias and mean squared error (MSE) over its full range and also for several types and strengths of spatial dependence among tests.
Furthermore, as small variability in the number of erroneously rejected or accepted hypotheses (i.e. stability) is an important feature of a testing procedure, 18 we propose a robust approach based on the use of tail probabilities instead of point estimates. For this purpose, we employ the 95th and 5th percentiles of FDR and APF, respectively, to identify a threshold on the p-values that guarantees both a small false discovery error and a reasonably high power with 95% probability. The proposed method is general and can be applied to various statistics; here we used Spearman's test statistics and its approximate distribution to test our approach with a Monte Carlo (MC) simulation study and a real data analysis of functional Magnetic Resonance Imaging (fMRI) and High Density Electroencephalogram (HD-EEG) data recorded from a healthy subject.
2 Multiple testing
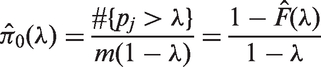
In order to deal with multiple testing, we consider m pairs of hypotheses H0 and H1, with a priori probabilities defined by
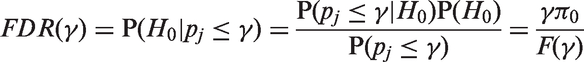
Let us also consider the probability of false discoveries, called Bayes FDR
16

Let us define the AP as the probability of rejecting the null hypothesis when the alternative is true, which can be calculated through the integral of the power function weighted by the prior distribution.
17
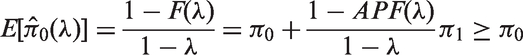
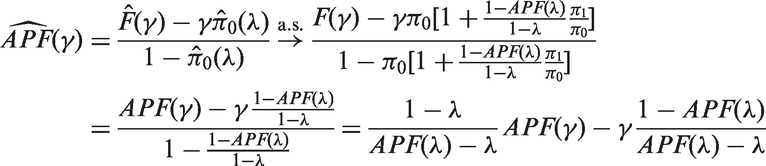
Here, we introduce the APF where the rejection region is made vary w.r.t the threshold γ. We define the APF as
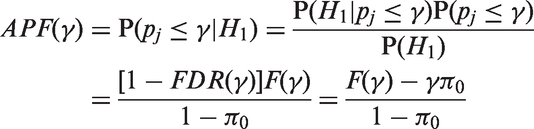
We propose the following estimates
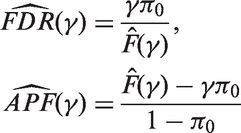
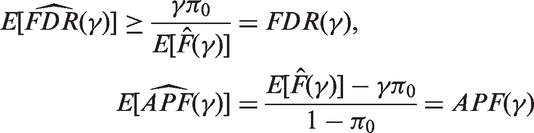
It is worth noting that the FDR estimate is conservative while the APF estimate is unbiased.
Information regarding the a priori probability

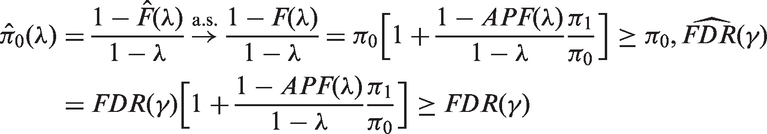
Therefore, the empirical Bayes estimates of FDR and APF are
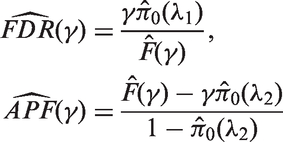
The optimal values of λ for the two estimates allow us to construct the one-sided
The use of confidence intervals instead of point estimates allows us to obtain a more informative, robust and conservative procedure.
Since it is not sufficient to control the FDR alone, we propose a flexible approach to balance the two types of error rate. The trade-off can be made by first choosing the alpha value for both the
2.1 Asymptotics
In order to prove that, for a large number m of p-values, the limiting behaviour of the proposed estimators is essentially the same, both under the assumption of independence of p-values and under a suitable assumption of weak dependence, we start by noting that
More precisely, in case of stationary associated p-values, if
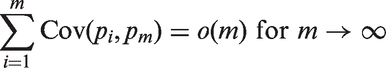
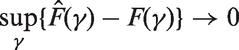
And
In particular, when λ is chosen so that
As a final point, we may observe that, in the case of independent and identically distributed p-values, the almost sure convergence of the empirical cdf follows directly from the strong law of large numbers and implies the almost sure convergence of the proposed estimators by means of the continuous mapping theorem.
2.2 The case of nonparametric independence testing
Let us consider the case of m pairs of hypotheses H0: independence vs. H1: dependence, with a priori probabilities defined by
The idea of basing multiple testing procedures on correlation coefficients is common in the biological literature.
22
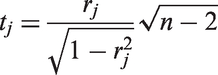
Pearson and partial correlations are often employed by neuroscientists; however, we propose here the use of Spearman's statistics as a nonparametric alternative which could capture more general forms of dependence and further help the identification of co-activated brain areas. Nonetheless, the method can be employed with other measures of dependence; in particular, if we assume the normal distribution of the data, we could use Pearson correlations replacing the Student t distribution with the standard normal. Information regarding the a priori probability
3 Simulation study
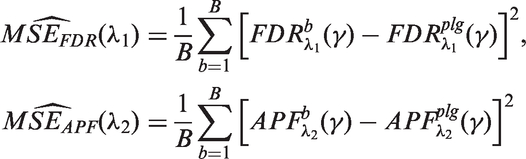
We performed a Monte Carlo (MC) simulation study to assess the performance of the proposed APF estimator together with the FDR estimator. Multiple tests of the form
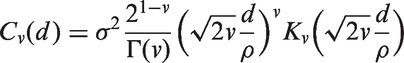
Monte Carlo Bias and MSE for a sensible range of γ values, different covariance functions and correlation intensities.
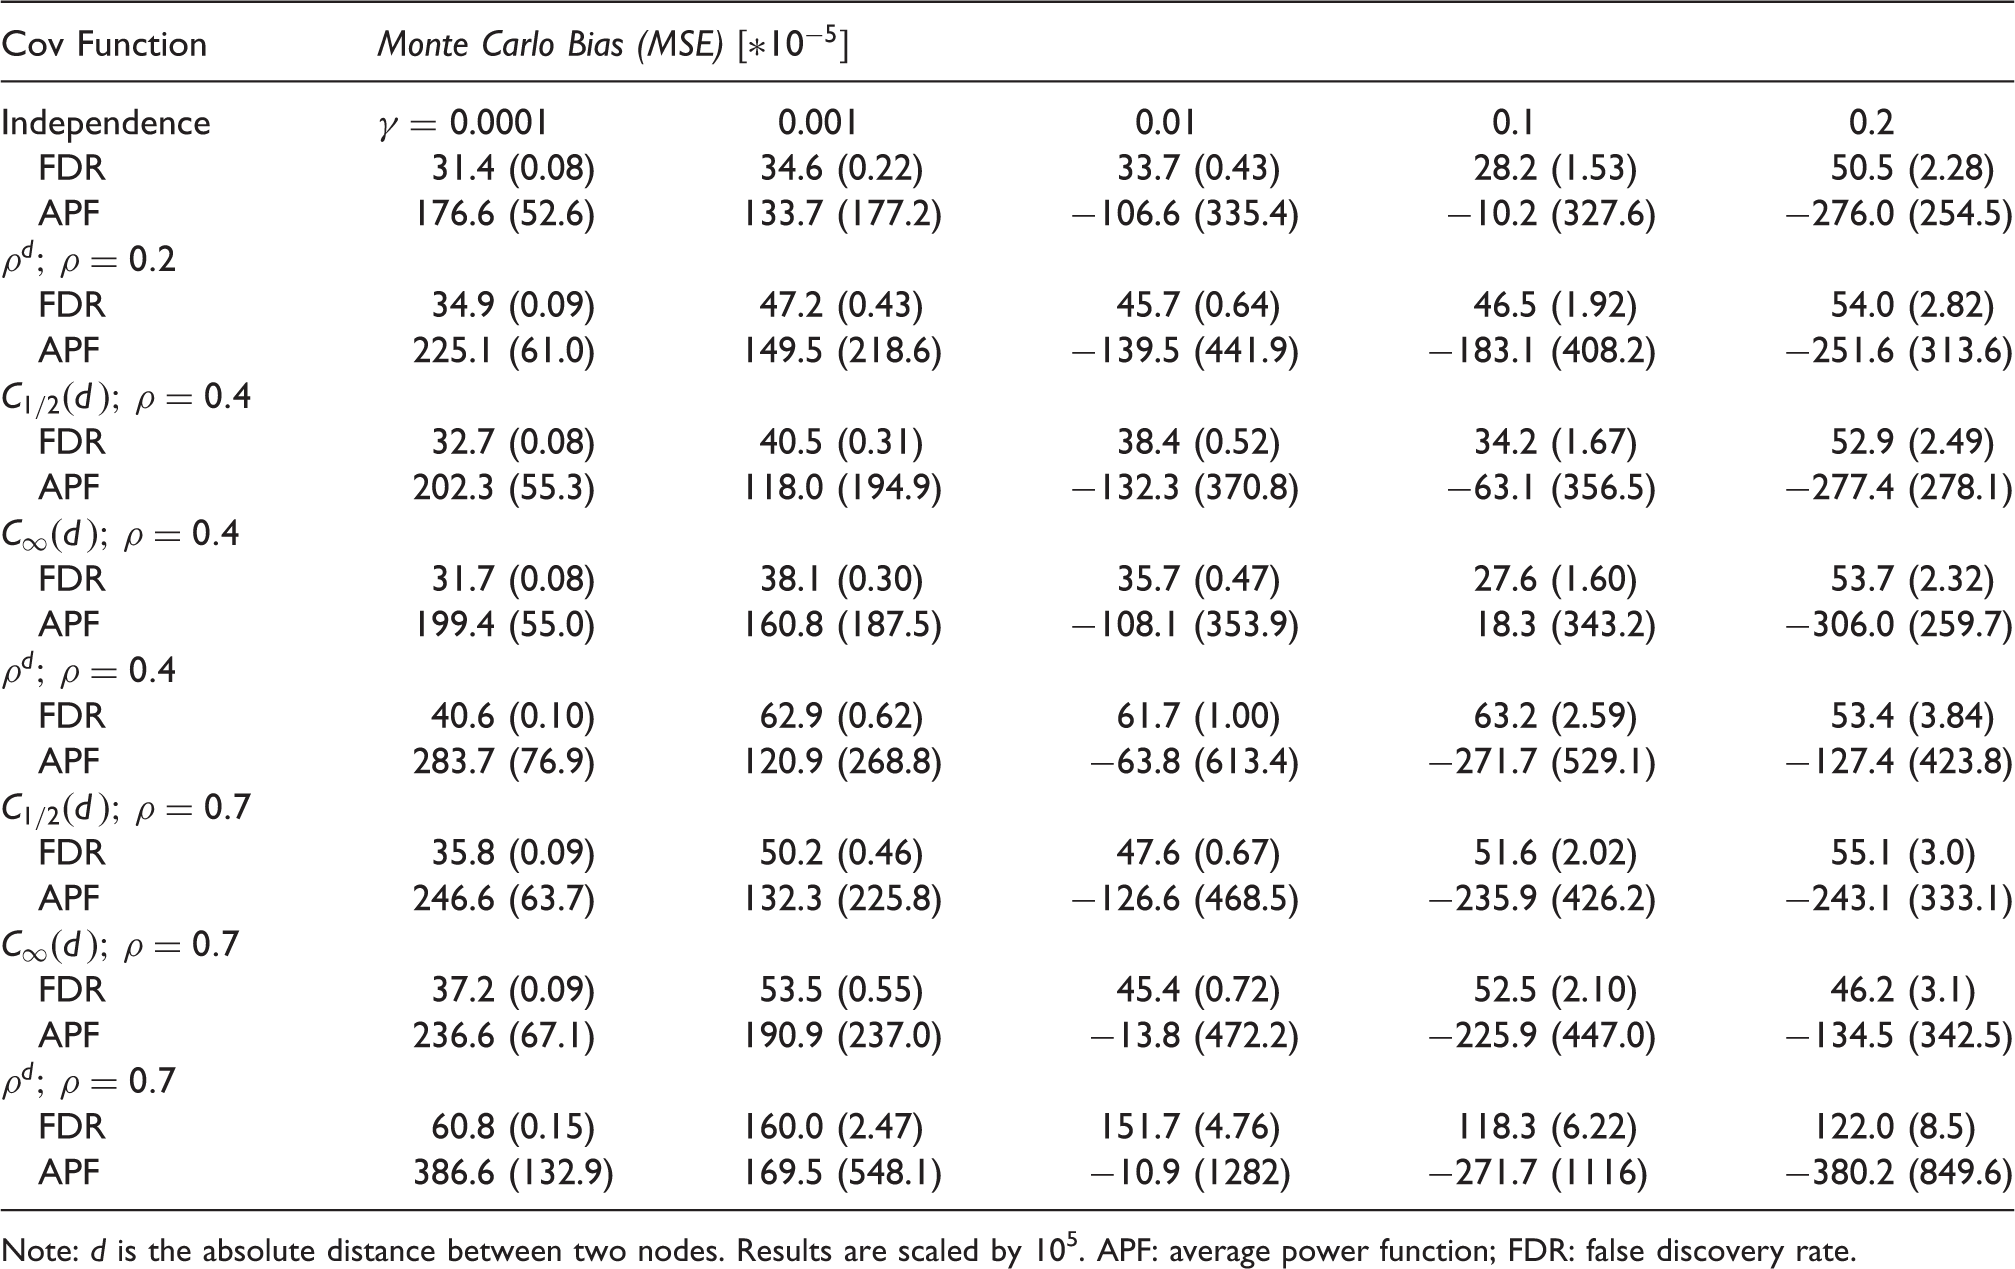
Note: d is the absolute distance between two nodes. Results are scaled by 105. APF: average power function; FDR: false discovery rate.
4 Application
In this section we apply the combined FDR and APF approach to resting-state fMRI and HD-EEG correlation data recorded from the same healthy subject. The underlying properties of these data offer the opportunity to explore the behaviour of our method under different correlation scenarios; in fact, resting-state fMRI typically has lower correlations than resting-state HD-EEG which is affected by the well-known physical phenomenon of Volume Conduction (VC). 25
A 30-year-old healthy woman from the research team of the Scientific Institute Santa Maria Nascente of the Don Gnocchi Foundation (Milan, Italy) volunteered for the study. She underwent resting state functional Magnetic Resonance Imaging (fMRI) and High Density electroencephalogram (HD-EEG) recordings. Each exam lasted 20 minutes and was recorded at the same hour of the day in a darkened room with the subject laid in supine position with eyes closed. She was instructed to keep alert and relaxed; no specific mental task was requested.
4.1 fMRI
The resting state fMRI was carried out at the Department of Radiology using a 1.5 T Siemens Magnetom Avanto (Erlangen, Germany) MRI scanner with an eight-channel head coil. BOLD EPI images were collected at rest for approximately eight minutes. High-resolution T1-weighted 3D scans were also collected to be used as anatomical references for fMRI data analysis. Standard pre-processing involved the following steps: motion and EPI distortion corrections, non-brain tissues removal, high-pass temporal filtering (cut-off 0.01 Hz) and artefacts removal using the FMRIB ICA-based Xnoiseifier (FIX) toolbox. 26
After the pre-processing, the resulting 4D dataset was aligned to the subject's high-resolution T1-weighted image, registered to MNI152 standard space and subsequently resampled to
4.2 HD-EEG
The high density EEG (HD-EEG) was recorded in the Neurophysiology Lab using a BrainVision Recorder 1.20 (Brain Products GmbH, Germany) and a pre-cabled EEG recording cap equipped with 64 Ag/AgCl electrodes with FCz as the reference. Analog signals were digitalised at 500 Hz sampling rate and bandpass filtered from 0.1 to 100 Hz. Raw data were further notch filtered at 50 Hz and band-pass filtered (1–30 Hz) off-line. Before segmentation, both visual inspection and Independent Component Analysis (ICA) were used for semi-automated removal of ocular artefacts. 28 Data were then segmented into consecutive non overlapping 2.5-seconds epochs yielding 120 epochs available for successive analyses.
EEG time series for each ROI were obtained by first applying the standard procedures for the computation of mean spectral density. The cross-spectral matrix was used as input for sLORETA source analysis. 29 Source activities were combined into 84 regions of interest (ROIs). Each ROI centre was placed at the respective BA centroid and then the time series of the electric neuronal activity at the ROIs were extracted.
5 Results
Figure 1 and Table 1 report the results of the Monte Carlo simulation study. Figure 1 shows the difference between the true values of APF (blue) and their point estimates computed throughout the full γ range for different covariance functions and correlation intensities. The estimates are close to the true values of APF for the full γ range and in almost every scenario tested, the highest variability being observed with the most correlated spatial structure. Table 1 reports MC Bias and MSE of APF and FDR for a meaningful set of γ values and for different correlation patterns and intensities. All the estimates of FDR and APF show low bias and MSE. The APF bias turns out to be always conservative for γ values equivalent to the range of power most useful in applications (0.4 to 0.9). The MSE tends to grow, especially for the APF, as γ increases or the spatial correlation structure becomes stronger.
True APF values (dark line) and 50 replications of their point estimates for different covariance functions and correlation intensities. Results are shown over all range of γ (x-axis).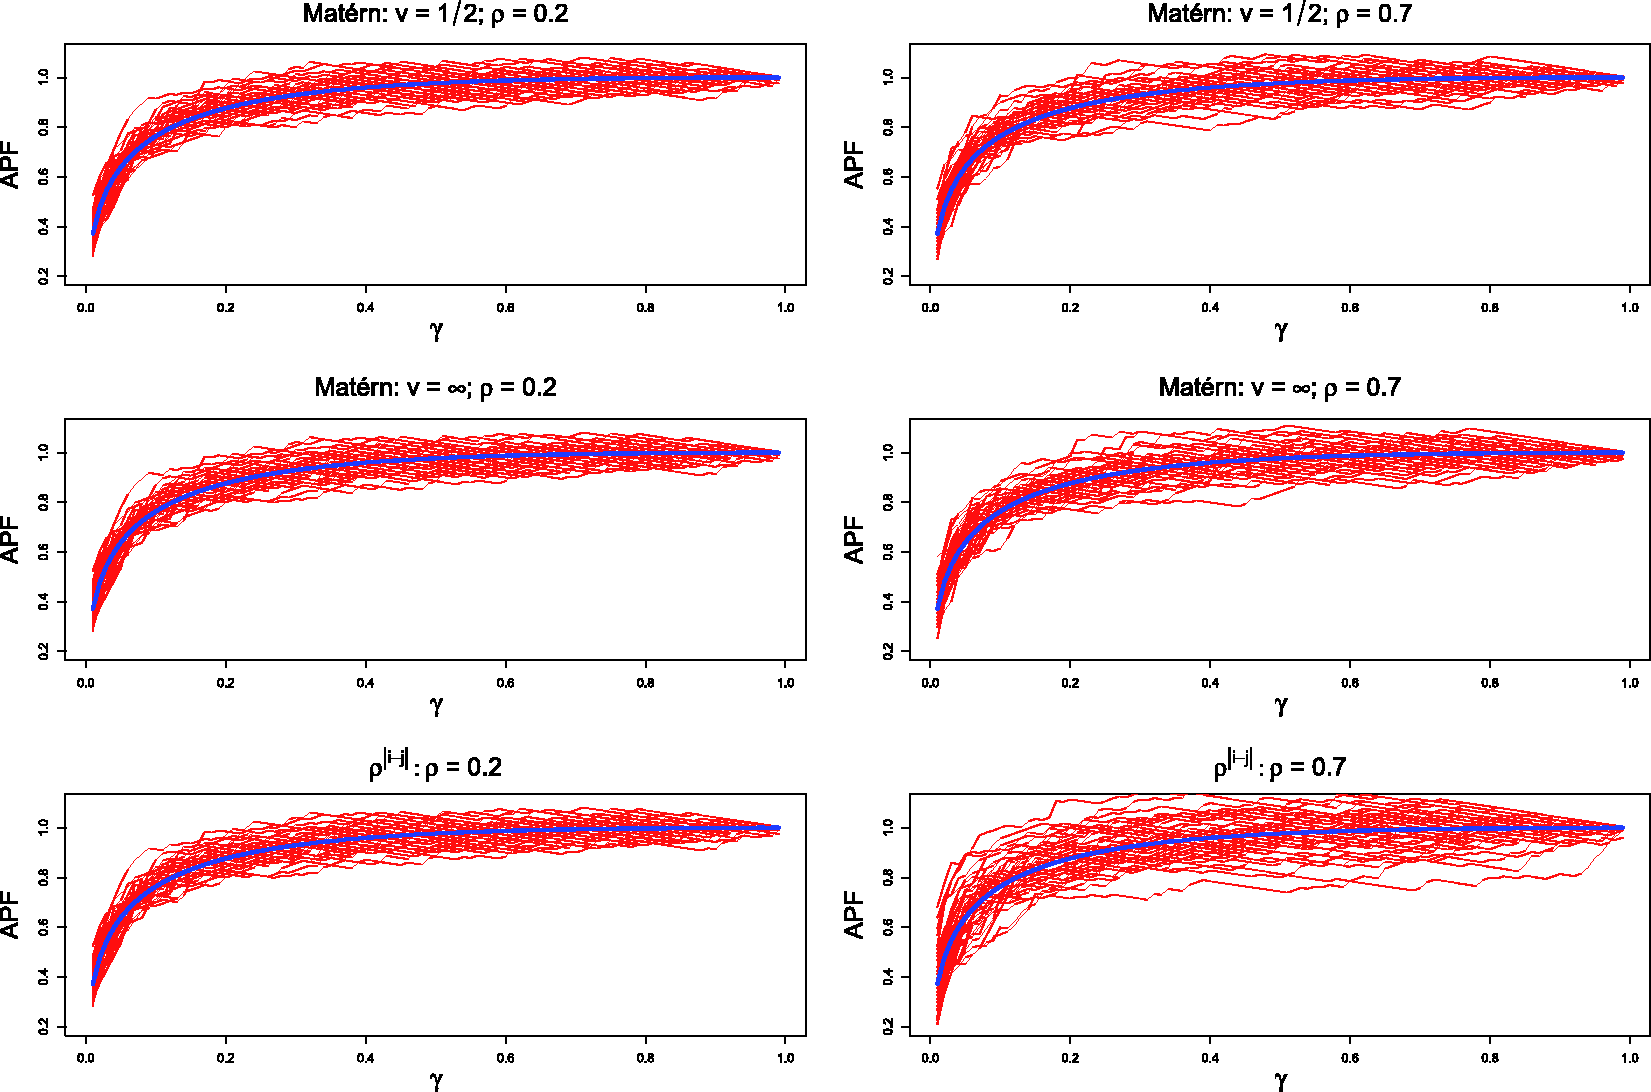
5.1 fMRI and HD-EEG brain network construction
Figure 2 shows the empirical distributions of fMRI and HD-EEG correlations. As expected, both distributions are right-skewed due to predominance of positive correlations in resting-state recordings
30
with the HD-EEG data showing a far more heavy-tailed distribution due to correlation inflation caused by the VC phenomenon. We computed the Empirical distributions of Spearman's r for the fMRI and HD-EEG data. 95th bootstrap percentile of the FDR (upper) and 5th bootstrap percentile of the APF (lower) for a range of τ values. Bootstrap quantiles are reported for both the fMRI (line) and HD-EEG (dashed) data. Trade-off between Examples of thresholds γ on the p-values and τ on the Spearman's test statistics for the fMRI and HD-EEG networks. Note: The 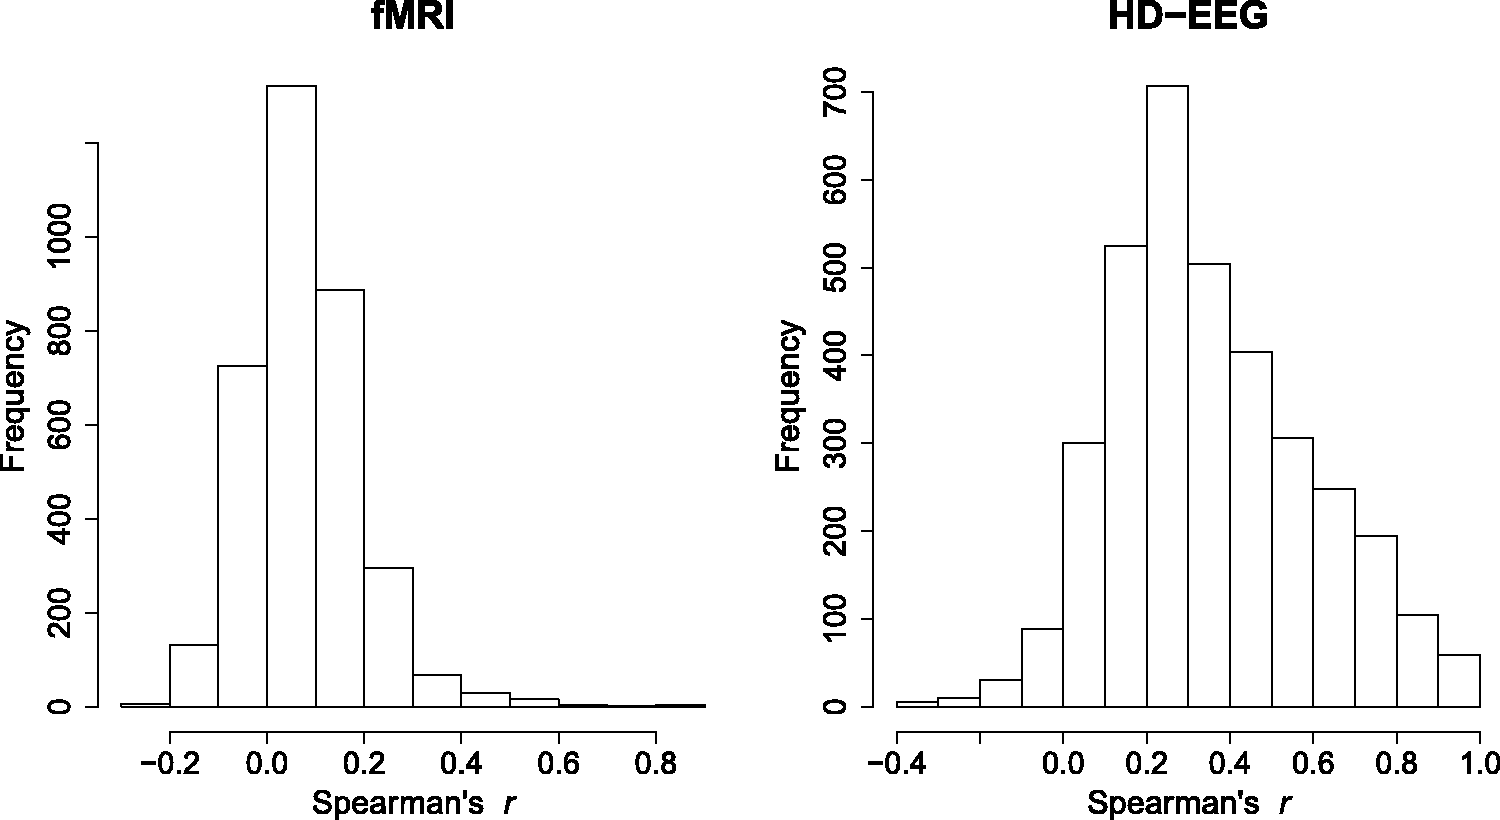
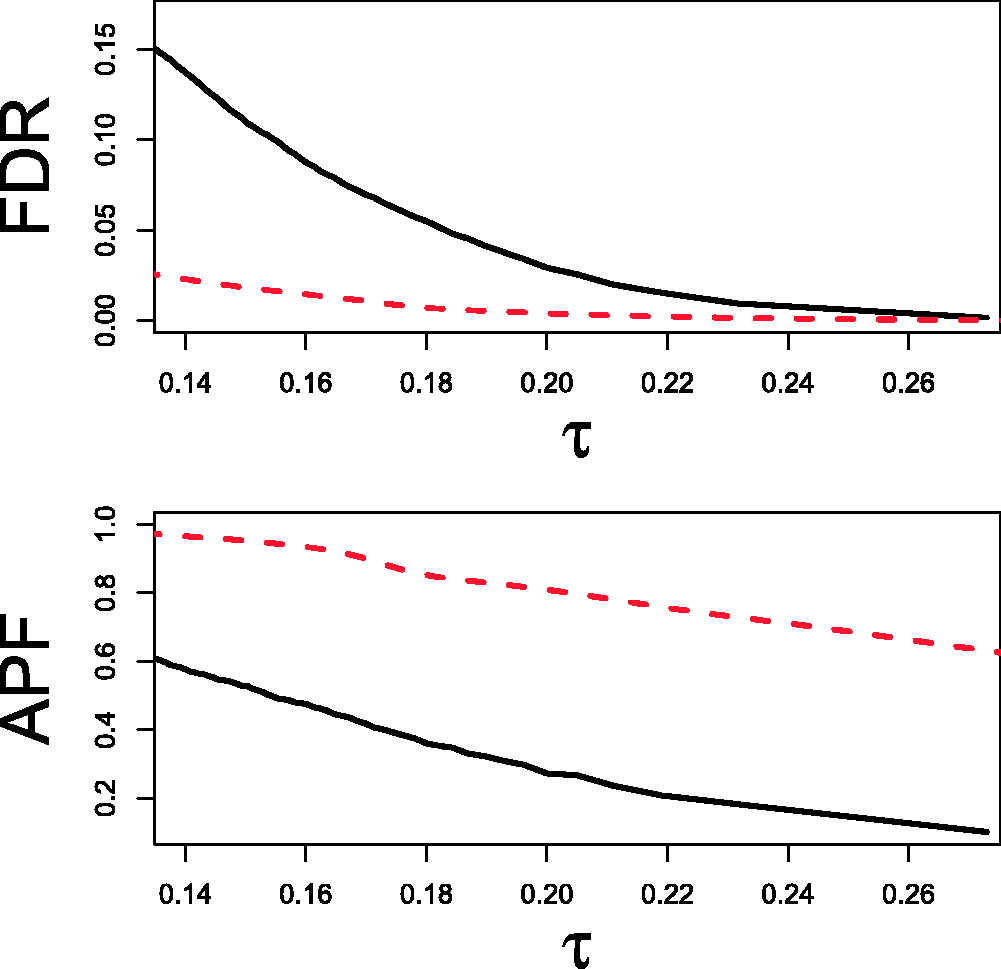
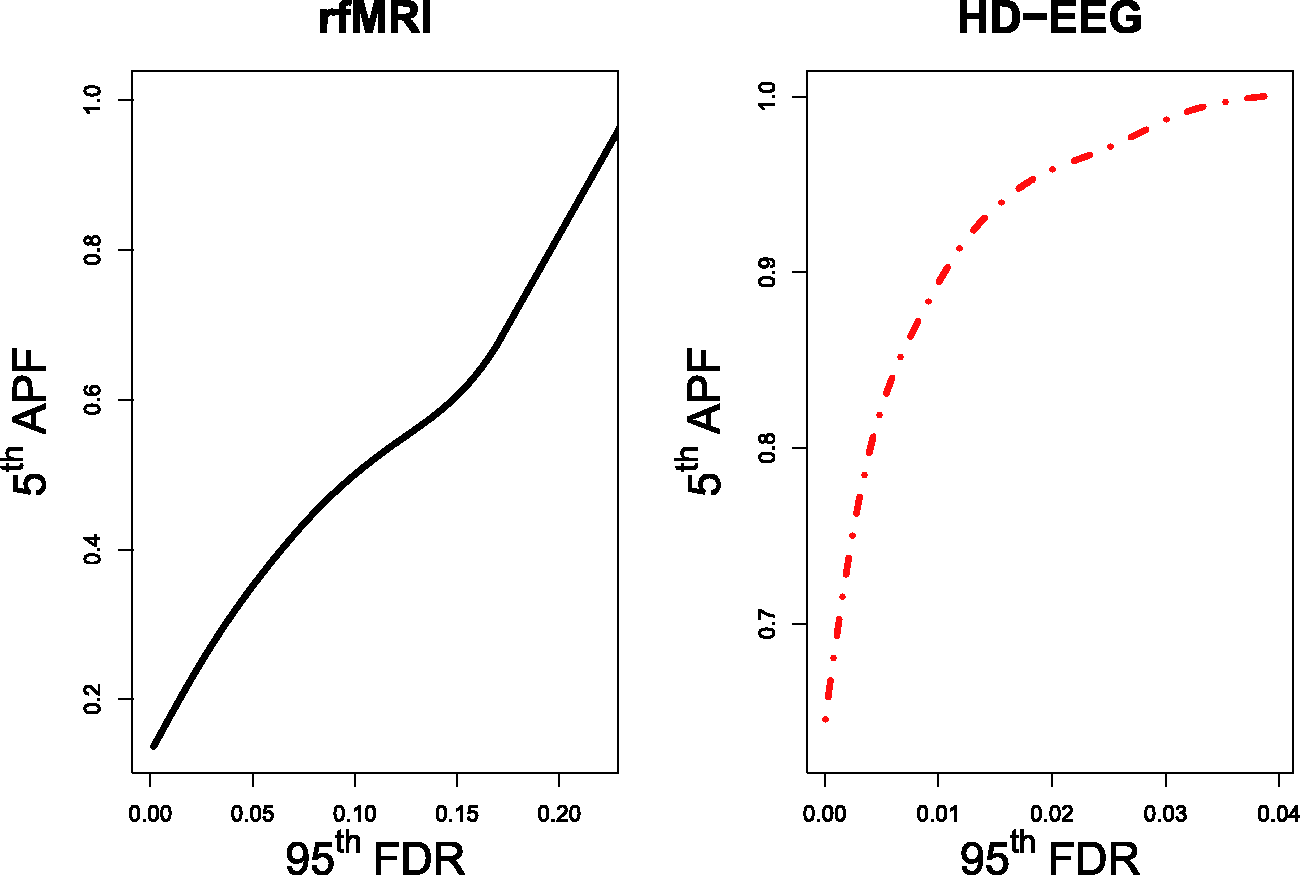
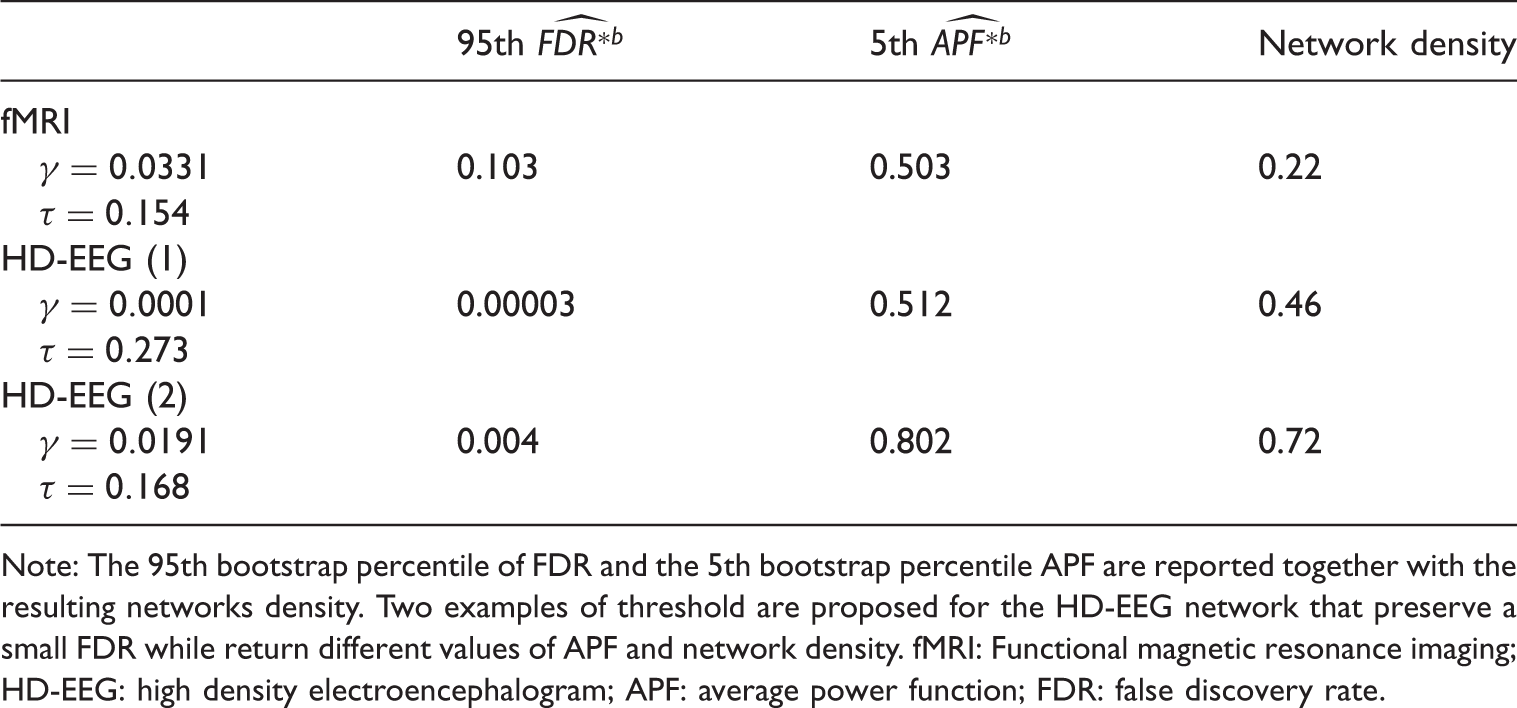
The FDR–APF trade-off for the fMRI network (Figure 4, left) did not provide alternatives: to control both errors sensibly, we had to select a threshold τ returning estimates of FDR and APF not greater than
The resulting network featured nodes with high degree of connectivity in the pre-motor, temporal, parietal and occipital areas (Figure 5) as indicated by different graph measures of centrality such as degree, closeness and betweenness. These results are in line with other studies on functional brain networks.31–33 It is worth observing that a threshold τ returning an FDR of at most Functional brain hubs as extracted from the fMRI network obtained using the FDR-APF approach. The hubs (blue dots) and their edges (lines) are dividend in central-temporal and parietal-occipital areas (left/right) and identified by the number of the relative Brodmann area on the circles. Hubs are defined using multiple graph measures of centrality.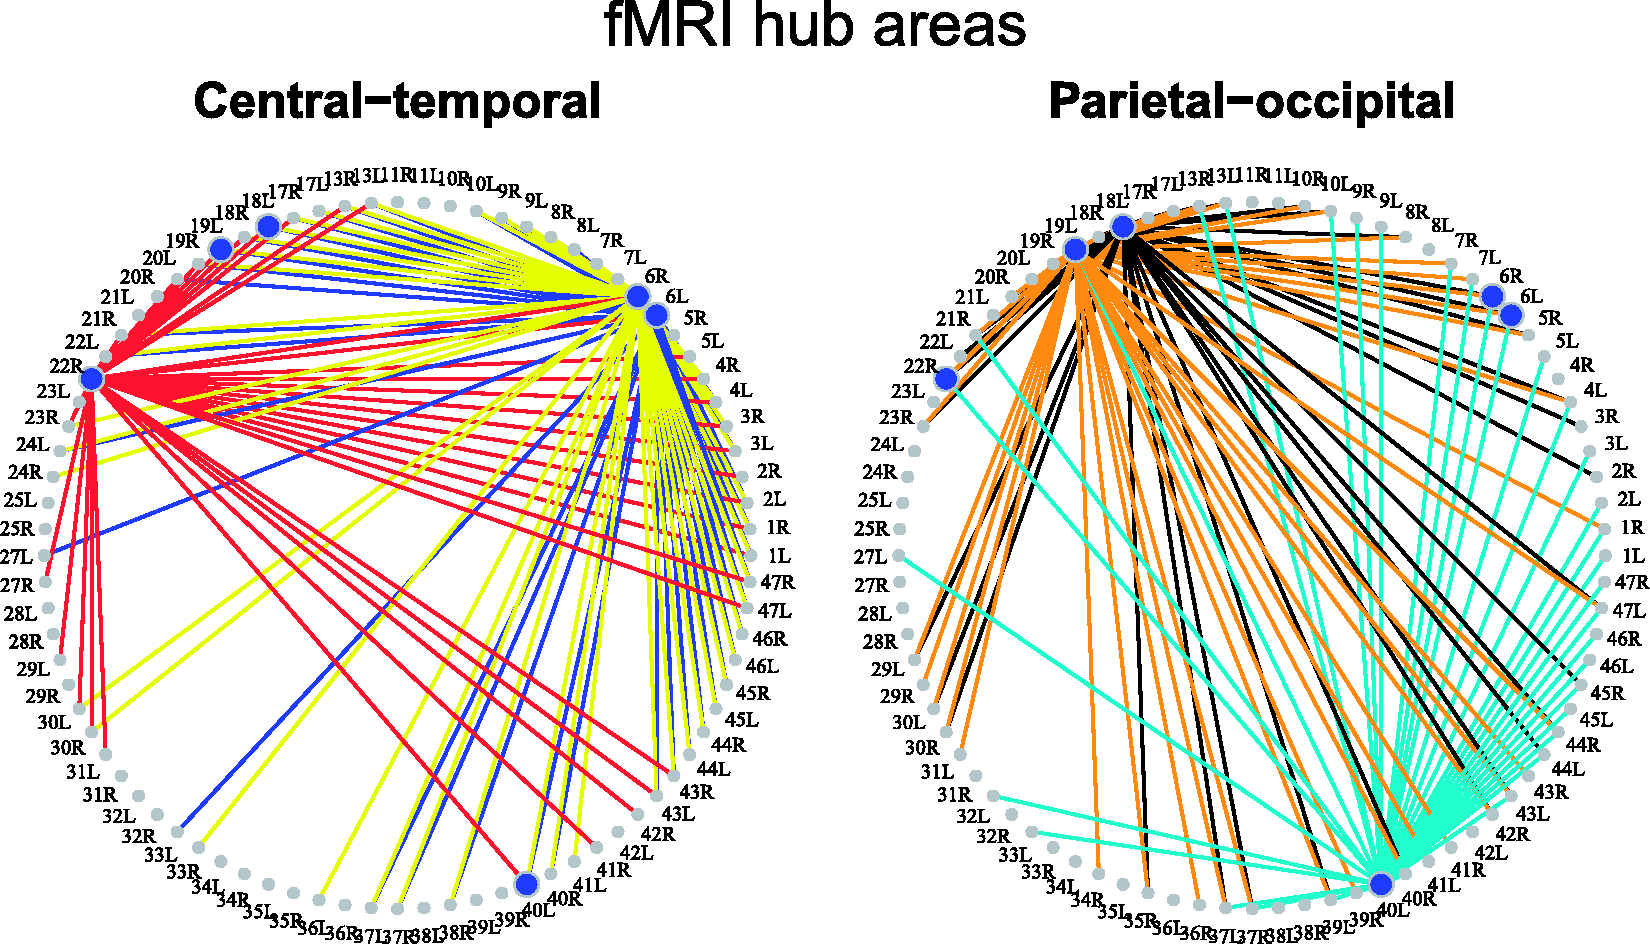
On the other hand, without any a priori knowledge about the HD-EEG network, the FDR–APF trade-off allowed different reasonable choices of the threshold τ (Figure 4, right). For instance, the researcher could arguably favour a low upper bound for the FDR and guarantee no more than at least
6 Discussion
The present study addresses the problem of setting a threshold τ on the correlation coefficient between time series of brain activity recorded from several brain areas. An adjacency matrix is consequently defined for the construction of networks which are widely employed by the neuroscientific community for the study of the brain activity.
To this purpose, we proposed a new estimator of the APF and paired it with the Bayes FDR estimator 16 to account for both type I error and statistical power in the choice of τ.
In the introduction, we mentioned other approaches to define functional brain networks. It is our opinion that many of them do not address properly the important problem of separating true connections from spurious ones. This is particularly important as brain functional measures are well known to be affected by several non-neural phenomena which can heavily mask the true connectivity structure. 7 Therefore, methods such as proportional thresholding,5,6 multiple thresholding and cost-integration,3,8,10 and those working with fully connected graphs 9 have the limit of providing no direct control on the amount of error that affects their results.
To the same extent, advanced methods in the neuroimaging literature for controlling the FWER such as random field and permutation test do not provide researchers with complete information on both type I error and power associated with the choice of a threshold while they come either with several assumptions or computational costs and lack of generality. 35
On the contrary, functional brain networks obtained by balancing Bayes FDR and APF have the advantage of directly disclosing the level of false discovery error and power attached to each graph.
As pointed out in Sala et al., 11 combining the two types of error helps the construction of reliable brain networks.
In Neuroscience as well as in many other applications, the assumption of independence between tests is unlikely to hold. Spatial dependence of multiple tests is of concern as it can affect the selection of the threshold τ. To this extent, we showed that the APF estimator improves substantially the current literature 11 as we were able to prove its unbiasedness and its almost sure convergence to the actual value of the parameter, not only when assuming independence but also with weakly dependent p-values. Furthermore, we tested the behaviour of the APF and FDR estimators under different types and strengths of dependence obtaining low Monte Carlo bias and MSE for both estimates even when moderate-to-highly dependent tests were considered.
Nevertheless, it is worth stressing that we explored standard forms of spatial dependence and thus our results might not be the same in other scenarios, particularly when a high level of dependence between tests is expected.
Another important point is reproducibility of results in neuroscientific studies employing testing procedures.
18
Here, we proposed the combined use of
The application to the construction of fMRI and HD-EEG networks supported the added value of our method: When there is only one sensible choice for the threshold τ, as for the fMRI data, the pair FDR-APF informs researchers on both the statistical errors they are willing to accept. Furthermore, by exploring features of the resulting network using graph measures, we were able to identify important nodes that are consistent with other works on functional networks and brain hubs.31–33 On the other hand, when multiple choices of τ are possible, as for the HD-EEG example, the addition of the APF enables a more informed choice of the threshold than the FDR alone. Our method is not limited to fMRI and EEG networks; we believe the additional information on power helps researchers who employ multiple tests to strengthen their results.
It is worth noting that, in the case of HD-EEG, a highly dense brain network was expected as a result of the well-known phenomenon of volume conduction. 25 Nonetheless, there were different sensible choices of τ which returned even moderately dense HD-EEG networks. In such example, the combined use of FDR and APF proved to be a helpful tool in selecting the threshold which most effectively captures the correct density structure of the underlying phenomenon.
Footnotes
Declaration of conflicting interests
The author(s) declared no potential conflicts of interest with respect to the research, authorship, and/or publication of this article.
Funding
The author(s) disclosed receipt of the following financial support for the research, authorship, and/or publication of this article: The study was supported by a grant of the Italian Ministry of Health, Ricerca Corrente funding program 2015–2016 [RC2015].