Non-response is a commonly encountered problem in many population-based surveys. Broadly speaking, non-response can be due to refusal or failure to contact the sample units. Although both types of non-response may lead to bias, there is much evidence to indicate that it is much easier to reduce the proportion of non-contacts than to do the same with refusals. In this article, we use data collected from a nationally representative survey under the Demographic and Health Surveys program to study non-response due to refusals to HIV testing in Malawi. We review existing estimation methods and propose novel approaches to the estimation of HIV prevalence that adjust for refusal behaviour. We then explain the data requirement and practical implications of the conventional and proposed approaches. Finally, we provide some general recommendations for handling non-response due to refusals and we highlight the challenges in working with Demographic and Health Surveys and explore different approaches to statistical estimation in the presence of refusals. Our results show that variation in the estimated HIV prevalence across different estimators is due largely to those who already know their HIV test results. In the case of Malawi, variations in the prevalence estimates due to refusals for women are larger than those for men.
In sub-Saharan Africa, home to around 23 million people living with HIV,1 accurate measurement of the trends of important diseases such as HIV is essential for governments to design policies and aid programs. In the past two decades, national population-based surveys have become an important source for such measurement.2,3 A major challenge in using these survey data is the potential bias from missing data created by non-response. There is much evidence that non-respondents may have patterns of outcome and/or behaviour that are very different from those of the rest of the population.4
The problem of non-response has always been a concern for those who work with survey data. One reason why non-response has captured so much attention from researchers is because the nature of the problem is complex. It is widely acknowledged that non-response does not arise from a unitary source under a well-defined situation. Rather, the causes and processes that lead to non-response are varied and often a function of multiple factors, such as the population under study, the nature of the outcome, and the way the survey is designed and conducted. A most challenging issue is that information about the non-respondents is usually scant, making it very difficult for surveyors to determine the nature of non-response.
Non-response arises when sample units in a survey refuse to respond or when the surveyors fail to contact a sample unit.5 Many researchers distinguish between non-contacts and refusals because the processes leading to these two types of non-response are believed to be distinct. There are good reasons for espousing this belief. For example, in the context of an HIV survey in rural Africa where the sample units are asked to participate in an HIV test, a non-contact is often the result of migration of the household or absence for work. However, a refusal may be the result of the sample unit's knowledge of his/her HIV status.6 Furthermore, we can argue that a non-contact is the result of a passive behaviour since a move of address is a family-based decision that is less likely to be related to the sample unit's HIV status whereas a refusal is an active decision by the sample unit not to provide information about his/her HIV status.a
Therefore, different approaches are required to address non-contact and refusal. For example, as the study of six national surveys in the UK indicates, repeated efforts to contact the subject may be able to reduce non-contacts but the same cannot be said about refusals.7
While there has been a lot of attention paid to issues related to non-response, most of the attention has been directed towards surveys carried out in the developed world.7–11 We argue that there is a need to consider the problem separately for surveys carried out in developing countries. Our argument rests on three observations. First, in some parts of the developed world, many non-response problems can be, at least partially, resolved by linking survey data to administrative records,12–15 which is often rich in content and well documented. The same cannot be done easily in many parts of Africa and elsewhere in the developing world as such records often do not exist, are poorly archived, or outdated. Second, many researchers advocated using callbacks to reduce the non-response rate.16–18 While the developing world has witnessed a massive expansion of mobile phone and broadband networks, such means of contacting sampled units remain practically infeasible in impoverished areas where telephones and computers are not affordable or in sparsely populated areas without easy access to such networks. Third, it is often difficult to rule out that non-response is non-informative. In that situation, unbiased inferences are still possible by combining the survey data with information from longitudinal data in a comparable population.19,20,9 In many parts of the developing world, however, the organisation of a nationally representative longitudinal study is difficult due to mobility of individuals and lack of reliable demographic records, especially in rural areas, statistical capacity and necessary financial resources. Hence, such a strategy needs to be adapted to the conditions in the developing world.
In this paper, we study non-response due to refusals to HIV testing using data collected from a nationally representative survey under the Demographic and Health Surveys (DHS) program. Some relevant earlier works include, Garcia-Calleja et al.,3 who carried out a scenario study for 20 sub-Saharan countries using HIV relative risks between the non-respondents and respondents. However, they did not treat non-contacts and refusals separately. Marston et al.4 examined non-response bias in a nine-country study. They assumed non-response is non-informative and estimated the prevalence among the non-respondents by multiple imputation.21 Similarly, Mishra et al.22 used a logistic regression to predict the HIV prevalence among the non-respondents under a non-informative non-response assumption in a 12-country study. Hogan et al.23 adjusted non-response bias by a selection model,24 which allows non-response to be informative but requires the existence of a valid instrumental variable that explains non-response but not the outcome. Reniers and Eaton25 and Floyd et al.26 corrected refusal bias in population surveys by using auxiliary longitudinal data. Their methods rely on the assumption that refusal behaviour in different populations is comparable. In some of the methods discussed below, we also adopt a similar assumption.
The main contribution of this paper is threefold. First, we put together existing methods and re-examine their underlying assumptions; we discuss the possible merits and demerits of each of these assumptions. Second, we introduce a few alternative novel approaches to HIV prevalence estimates that adjust for refusal behaviour and compare them to existing methods on a common platform. This comparison allows us to determine how important refusal bias may be. Third, based on thorough robustness checks against potential refusal bias, we draw lessons that could be applied elsewhere.
2 Study design and survey data
In health and population studies in Africa, the following three types of survey data are often available: national population-based surveys, sentinel surveillance surveys and longitudinal surveys. National population-based surveys are usually large scale, cross-sectional studies with the intent of drawing nationally representative samples. They collect detailed demographic characteristics and various outcomes of interest, such as health, nutrition and land use. Sentinel surveillance surveys are useful for capturing cross-sectional data over time, such as outbreak of disease, nutritional trends and changes in land use, at sentinel sites. The sentinel sites are typically located in the more densely populated urban areas and hence may not be representative of the general population in many developing countries, since most of them have a sizable proportion of rural population. Longitudinal surveys collect data on vital events and migration for individuals and households over time. When linked with appropriate data, such as individual demographic and behaviour information, longitudinal survey data make it possible to evaluate cause-specific impacts on outcome of interest. However, since longitudinal surveys are often carried out in smaller communities at specific locations, inferences drawn from them are unlikely to be directly applicable to the general population. We use all of these three types of surveys in Malawi for empirical illustration. We examine the relevance and implications of different approaches to the estimation of HIV prevalence.
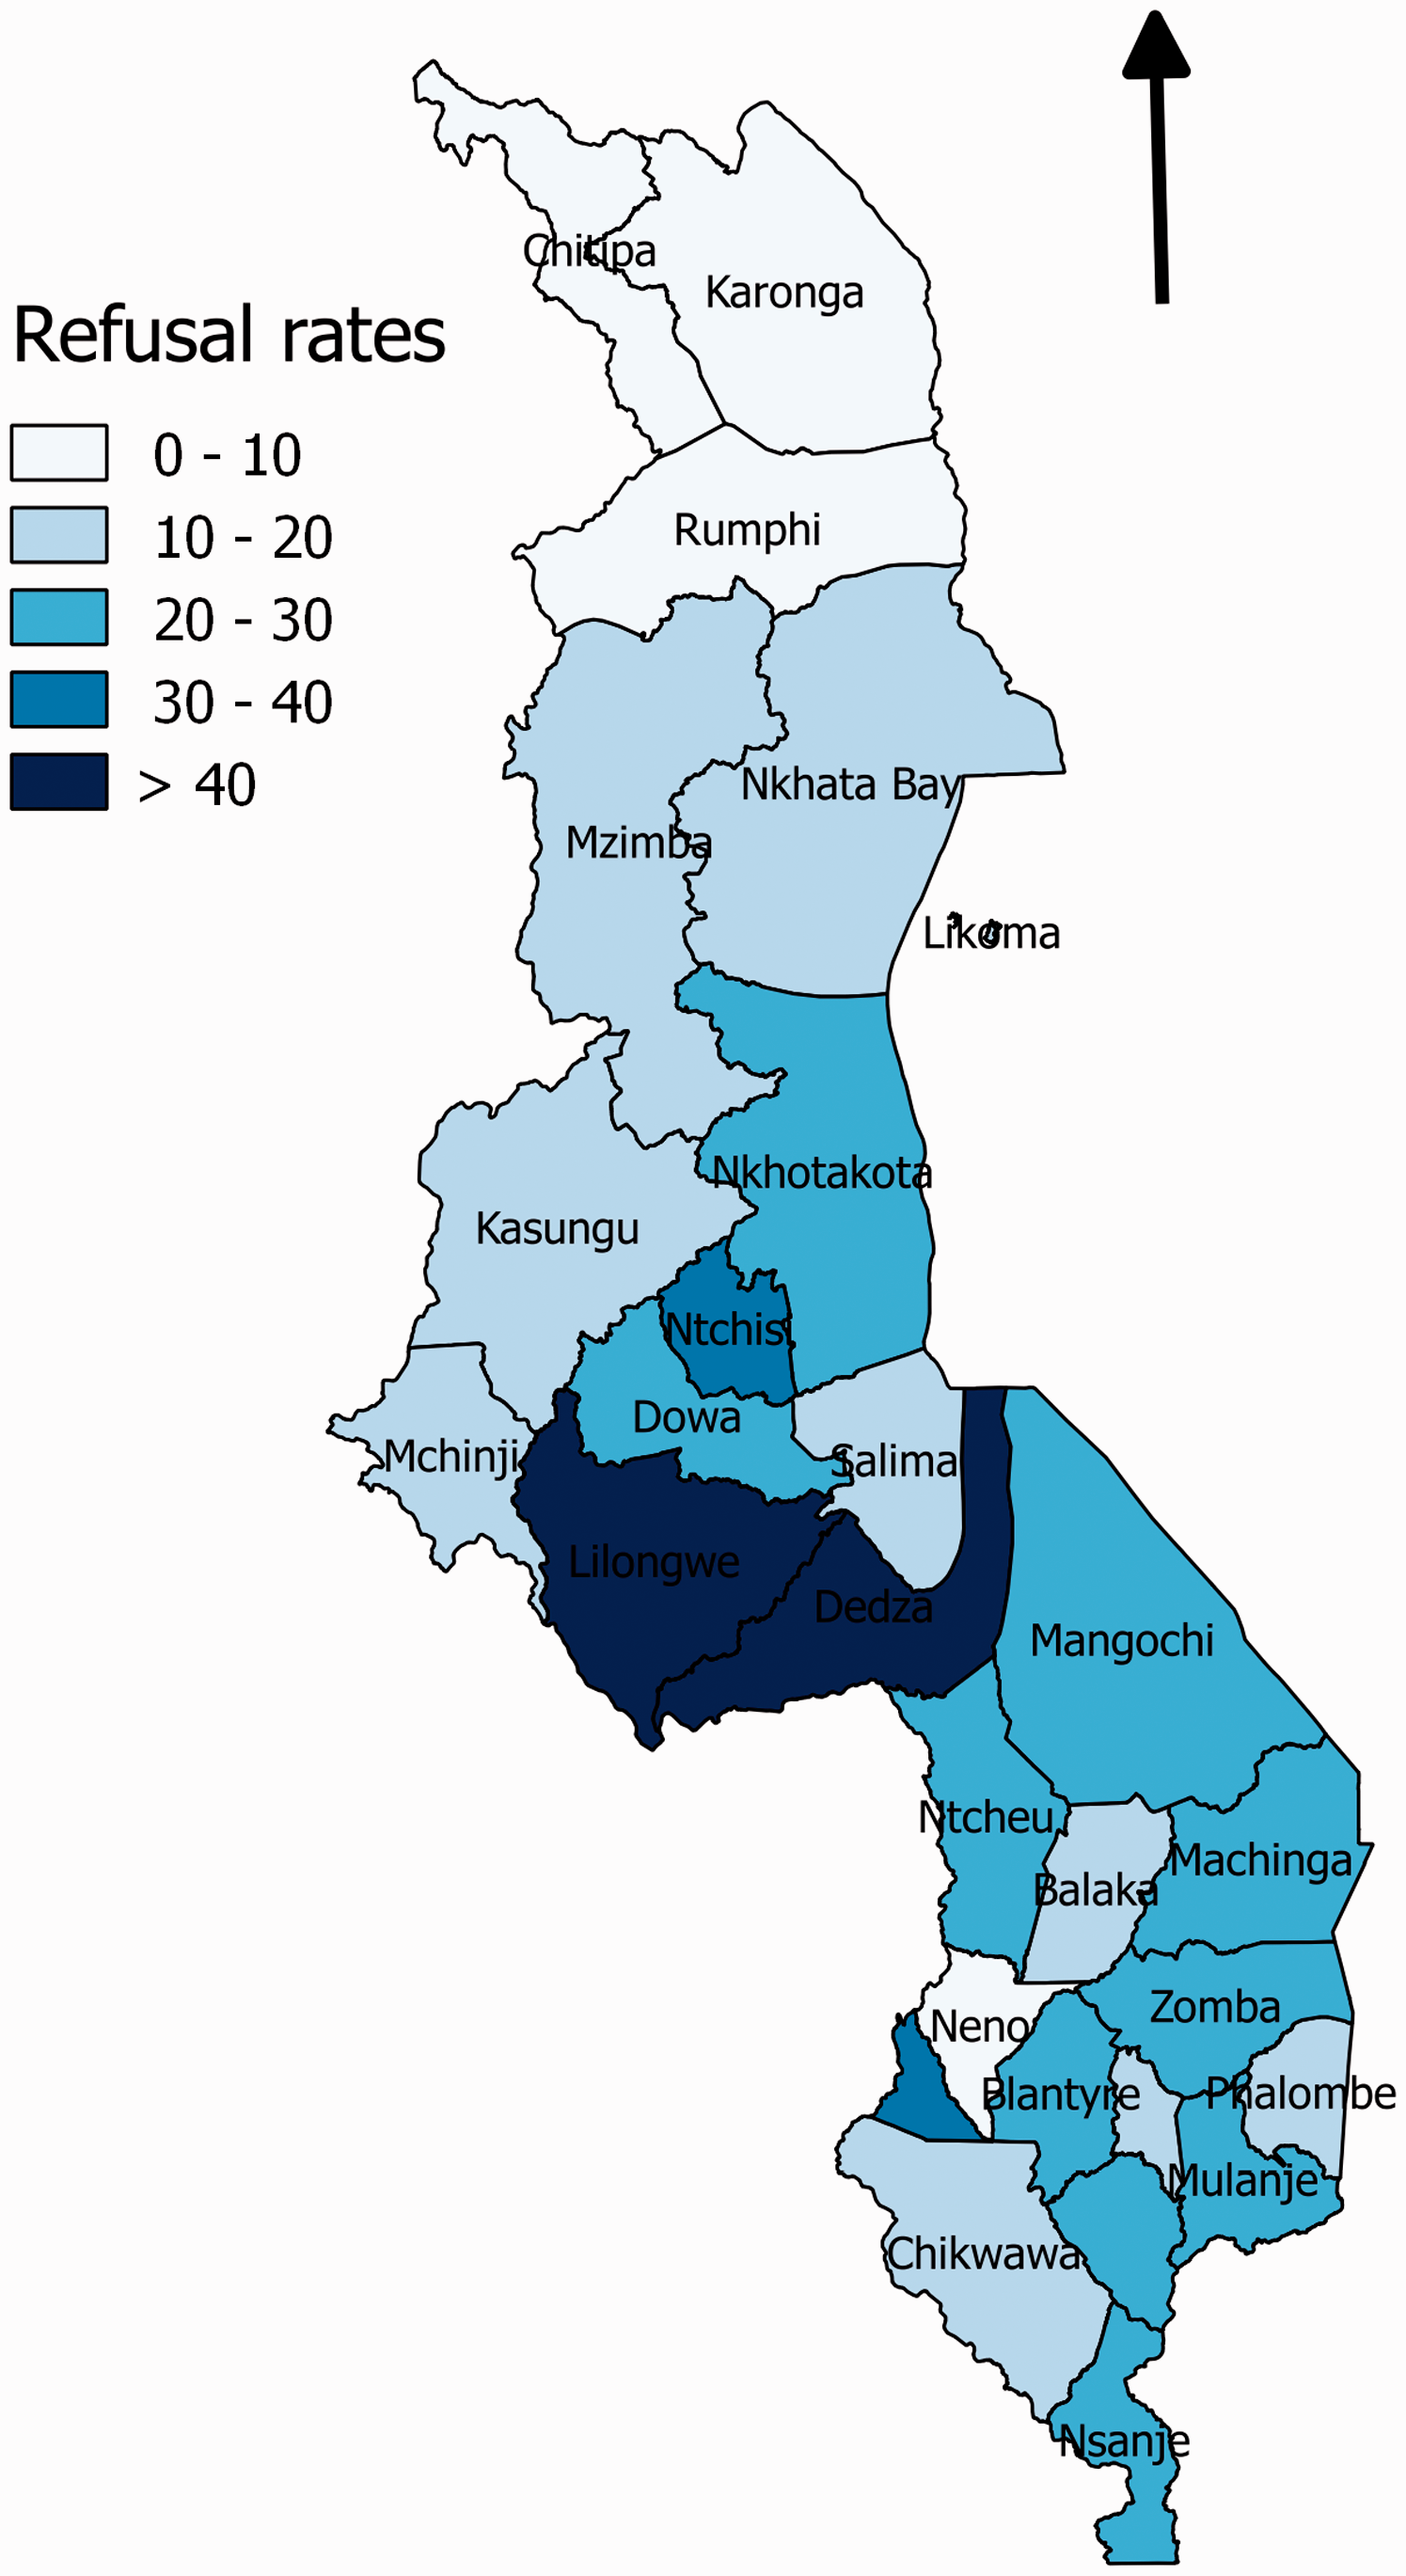
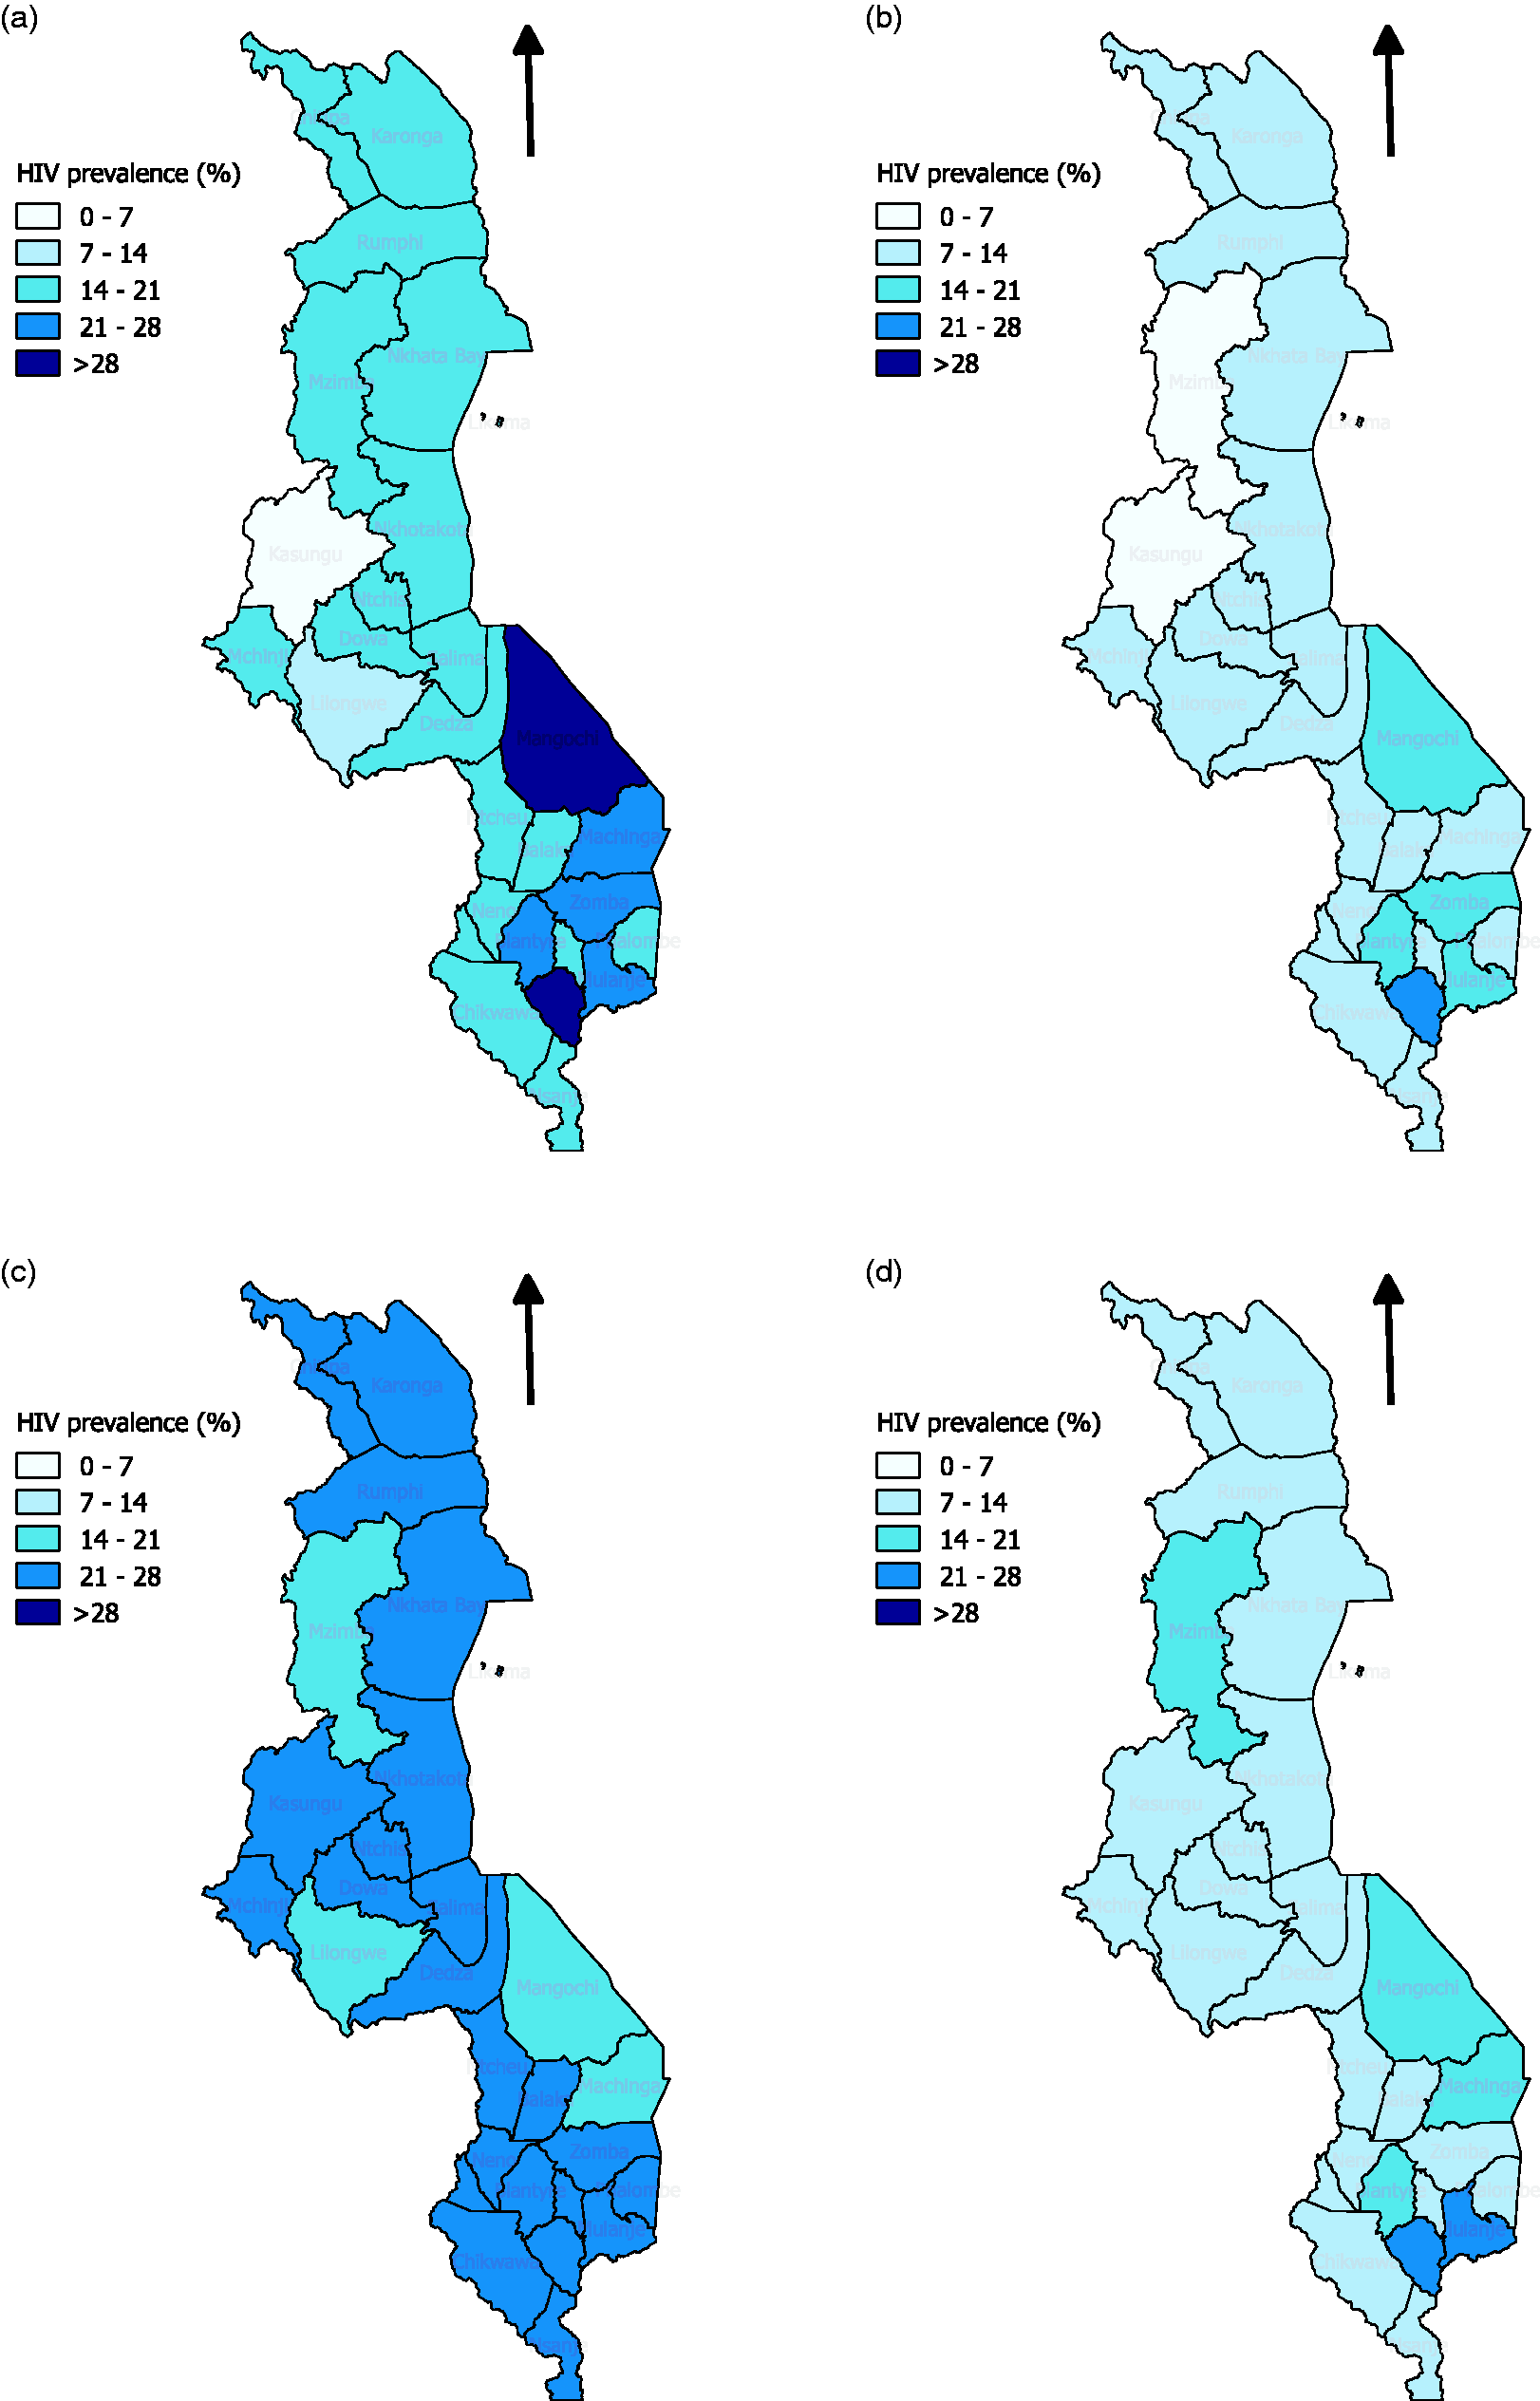
The primary data source for this study is the 2004 Malawi Demographic and Health Survey (MDHS), which is a nationally representative survey. All women aged 15–49 years in a selected household are eligible for interview. In about one in three selected households, male members of the household aged 15–54 years are also surveyed and HIV testing is offered to both male and female members. We focus on those aged 49 years or below to keep the same age group for both women and men, and also make our study comparable to the MDHS report.27 In addition, we exclude those who refused to answer the individual questionnaire, those who consented but their HIV testing results are not available (e.g., technical problem), and those whose previous HIV testing history (i.e., whether the individual has previously taken an HIV test) is not known. We note that Lilongwe district has an unusually high refusal rate (54%) and low observed prevalence (Figure 1). In an earlier report,27 separate analyses were carried out with and without Lilongwe. To facilitate comparison with earlier studies,25,27 we elect to include Lilongwe in the main article; the results of a parallel analysis, excluding Lilongwe, are given separately as online supplemental materials.
Malawi district level HIV testing refusal patterns in 2004 MDHS. (a) MDHS: urban, (b) MDHS: rural, (c) ANC: urban and (d) ANC: rural.
In addition to the MDHS data, we also use the 2003 Malawi antenatal clinics (ANC) survey data.28 The collection of HIV data in the Malawi ANC started in 1990 and by 2003, there were 19 ANC sites in Malawi. In the 2003 ANC, HIV data were collected on nearly 8000 pregnant women, of which 20%, 49% and 31% are in rural, semi-urban and urban areas, respectively.28
Lastly, we use a dataset collected under the Malawi Diffusion and Ideational Change Project (MDICP), which consists of a series of longitudinal surveys conducted in the rural areas in three districts of Malawi, one from each of the Southern, Central, and Northern regions of Malawi. As such it is not representative of the general population of Malawi. The sample is made up of married women and their husbands in the selected households. We only use the 2004 (MDICP-3) and 2006 (MDICP-4) phases as HIV test component is available only for these phases.
3 Assumptions and methods for estimating HIV prevalence
The goal of our research is to estimate HIV prevalence in a population of interest using sample surveys (such as DHS) drawn randomly from the population. However, such surveys might suffer from non-responses due to refusals which might lead to bias. In this section, we discuss various methods for estimating HIV prevalence, including those previously used in the literature and some newly introduced in this study. We begin our analysis by first ignoring selection bias and estimate HIV prevalence by simply taking the sample proportion of HIV status based on only those who accept an HIV test.
Let Di be an indicator variable that takes one if individual i is HIV positive and zero otherwise. The goal of our research is to identify , where i is drawn randomly from the population of interest. Sometimes, we are also interested in HIV prevalence of certain sub-populations. In that case, the parameter of interest is , where Zi is a variable that characterises the sub-populations, which may include the location of residence, gender, occupation and education level. However, we drop Zi hereafter, because the same method can be used for estimating HIV prevalence in each sub-population of interest by restricting the sample used for estimation accordingly.
We typically estimate from sample surveys such as DHS, because it is prohibitively expensive and practically infeasible to measure Di for all individuals in the population. Let N be the total number of individuals in our MDHS sample and Ri is an indicator variable for refusal such that Ri = 0 indicates individual i accepts an HIV test. Therefore, if we ignore the selection on non-refusals, can be estimated by the complete case estimator
An advantage of the estimator is that it is easy to calculate and requires no additional models. However, even if the sample is random, is only an unbiased estimator for and not for in general. Hence, unless we have is good only as an estimator of HIV prevalence of those who would agree to take an HIV test when such a test is offered.
In practice, we have no strong reason to believe a priori that holds. To address this issue, certain additional assumptions and/or data are required. For example, assume that HIV status can be explained by a set of covariates Xi observable on every individual in the MDHS data and that there is no refusal bias.
In the current context, this method requires
If an unbiased estimator of can be obtained from those with observed HIV status, then we can estimate the prevalence by a method equivalent to the mean score imputation (MSI) method, e.g., Pepe et al.,29 in the missing data literature
As we pointed out earlier, the estimator is generally a biased estimator of . Another possibility is to model the probability of refusal using covariates Xi and assume that Di is conditionally independent of refusal, given Xi (equation (2)). To keep the presentation simple, we temporarily assume that Xi is discrete but this assumption can be relaxed. With these assumptions, we have
Let be an indicator function (which takes one if its argument is true and zero otherwise), we can estimate by
The estimator above is unbiased if a suitable discrete covariate Xi can be found. In practice, a discrete covariate is often not sufficient to completely explain selection due to refusal. A more general estimator
is unbiased for . We use ‘IF’, which stands for infeasible, to qualify this estimator because is generally unknown. If we replace by an estimator in and call this estimator , then it becomes the well-known inverse probability or inverse propensity score estimator.30 The estimator can be viewed as a continuous version of equation (4). Unbiasedness of requires , which is the conditional independence assumption for equation (4).
A common strategy to come up with is to use a parametric model, usually a logistic regression using variables that are thought to predict acceptance of an HIV test (see, for example, National Statistical Office and ORC Macro, 2005 Appendix G27). However, this strategy works only if the model of acceptance is known and covariates in the model are observable.
To address refusal due to the prior knowledge of HIV status, Reniers and Eaton25 suggested a method to estimate under the following two assumptions
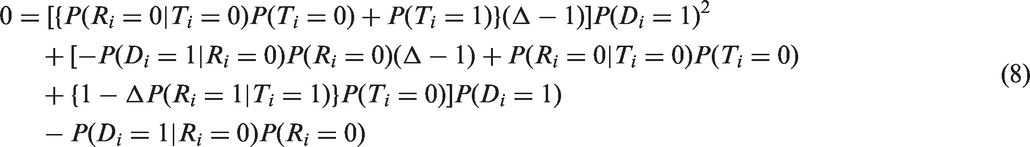
where Ti = 0 means that a subject does not know his/her HIV status and Ti = 1 means that a subject has had an HIV test and knows the test result. The first assumption given in equation (6) states that refusal is independent of HIV status given that the subject has never taken an HIV test before. The second assumption in equation (7) states that being tested previously does not depend on one's HIV status. Under these assumptions, the following quadratic equation in can be shown to hold
where the relative risk of refusal Δ is defined as follows
Reniers and Eaton25 used MDICP data to estimate Δ and MDHS data to estimate the remaining quantities in equation (8). Their estimator of is the unique root of the quadratic equation on the unit interval.
There are a few issues with the assumptions above. First, notice that equations (6) and (7) imply
This suggests we can estimate the prevalence of HIV by
Therefore, once equations (6) and (7) are assumed, we do not need MDICP data to estimate the HIV prevalence. Second, both of these assumptions may be problematic in practice. Equation (6) is not compelling because individuals may know the risk of HIV infection even without HIV testing. Equation (7) may also be called into question, because those who have taken HIV tests before may be systematically different from others.
Given these issues, we propose to estimate lower and upper bounds of under the following assumptions
where differs slightly from the definition of Ti used by Reniers and Eaton25 in that means a subject has not taken a prior HIV test and represents a subject has had an HIV test but may or may not know the result of the test. The first inequality in equation (11) captures the idea that those who refuse to take HIV test are no less likely to be HIV positive than those who participate, given that they have never taken an HIV test before. Note that the first inequality becomes an equality when equation (6) is satisfied. The second inequality captures the idea that those who have previously taken an HIV test are no less likely to be HIV positive than those who have never taken a test given they refuse to participate in the HIV testing.
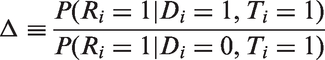
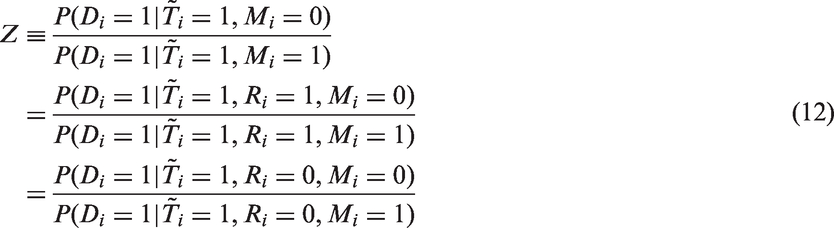
In addition to these assumptions, we explicitly account for the fact that MDICP is not representative of the general population of Malawi, because the data are taken only from a few rural districts. We use Mi = 1 to denote individual i belongs to the population that the MDICP sample represents, and zero otherwise. We assume that the relative risk of HIV between MDICP population and non-MDICP population is independent of refusal given that an individual has had a previous HIV test. Mathematically, our assumption implies
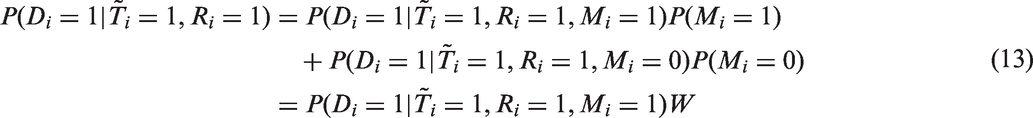
Under this assumption, the numerator and denominator of the last line of equation (12) can be estimated with the MDHS and MDICP data, respectively. Letting , we can write
where we additionally made the assumption that . In the MDICP data, we observe the HIV status of those who participate in the first HIV test but refuse the second HIV test. Therefore, we can estimate by the proportion of HIV positives in the first test among those who refuse the second test. To use equation (13), we also need to estimate W, which in turn requires estimates of , and Z. Since the MDICP sample was taken to match closely the rural sample of the 1996 MDHS, we may take to represent the proportion of rural population in Malawi and the urban population, both of which can be estimated using population census data. For Z, we can use the MDHS and MDICP data to estimate the numerator and denominator, respectively.
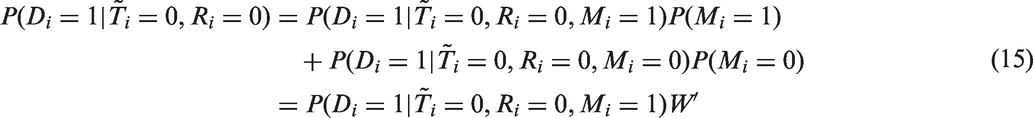
We also define
and letting , we can write
Estimation of equation (15) follows easily since the numerator and denominator of can be estimated using data from MDHS and MDICP, respectively.
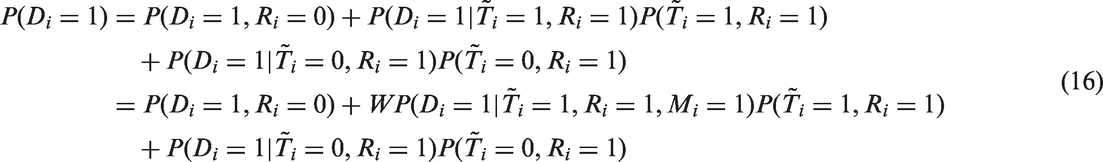
Using equation (13), we have the following relationship
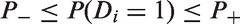
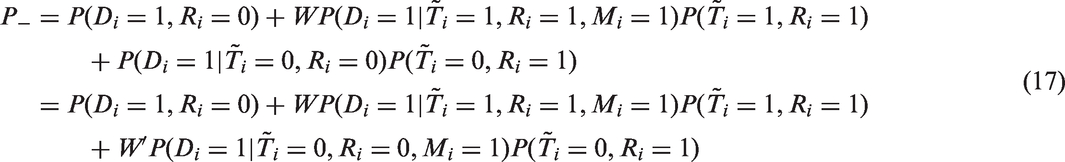
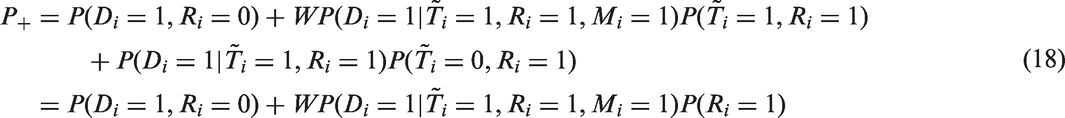
Notice that in equation (16), cannot be estimated because test results are not available for those individuals who have had no prior HIV test and decline the current test. Hence, the estimation of equation (16) is not feasible. However, by equations (11), (15) and (16), we can form bounds
where
We can estimate and with the MDHS data. Other terms can be estimated by equations (12), (13), (14) and (15) with the MDICP data. For the computation of the estimators, the following definitions in the MDICP data are used: if an individual has a test in MDICP-3, Di = 1 if an individual tests positive in MDICP-3 or MDICP-4, Ri = 1 if an individual tests in MDICP-3 but refuses a test in MDICP-4. Using these estimates, we obtain the estimates and of and , respectively.
A third source of data that allows estimation of is the ANC surveys.31,28 To produce national prevalence estimates, the district-area prevalence estimates obtained using ANC data are combined with census data. For each district-area c captured in ANC surveys, let wc be a weight that gives the proportion of individuals living in district-area c from the census. (We use 1998 census figures for all district-areas except Likoma and Mzuzu. For Likoma and Mzuzu, separate figures were not given in the 1998 census, so we use figures from the 2008 census.) Then an estimator of the population HIV prevalence is
where is the prevalence estimator in district-area c using ANC data. This method has also been used in cross-national studies comparing ANC-based to population-based survey estimates.32
If we let be an indicator for an individual who has been tested at an ANC site, then makes the following assumption
where Ci is defined as the index of the district-area in which the i-th individual resides, such that Ci = c means that an individual comes from district-area c. In other words, given that individuals are matched by district-area, HIV prevalence of the ANC attendees is the same as that in the general population.
When refusal to an HIV test may be due to the (unobservable) HIV status of a sampled unit,25,26 then the use of known data to estimate will not yield the desired results. This is the classical problem of non-ignorable missingness in the missing data literature.33
We propose a method that mitigates the problem of non-ignorable missingness by using information routinely recorded in ANC surveys. We assume
for some known function g that depends on the HIV status Di and some observable covariates Xi. Of course, equation (21) cannot be used because Di is unknown for those who refuse an HIV test. Therefore, we make the following assumption
which says that for an individual in a particular district-area, acceptance of an HIV test is independent of the individual's HIV status, given the covariates and the HIV prevalence in that district-area estimated from the ANC data.
The conditional independence assumption equation (22) allows us to have a workable solution since can be obtained using data in every HIV sentinel surveillance report.28,34 Let be an estimator of which may be based on a logistic regression model. Then, we estimate by
We consider two estimators based on . The first one uses and a stepwise regression procedure to select from the same list of covariates Xi used in for the estimation of . The second one uses only for modelling the propensity score. These propensity scores are the used in equation (23) to give different prevalence estimators, and , respectively.
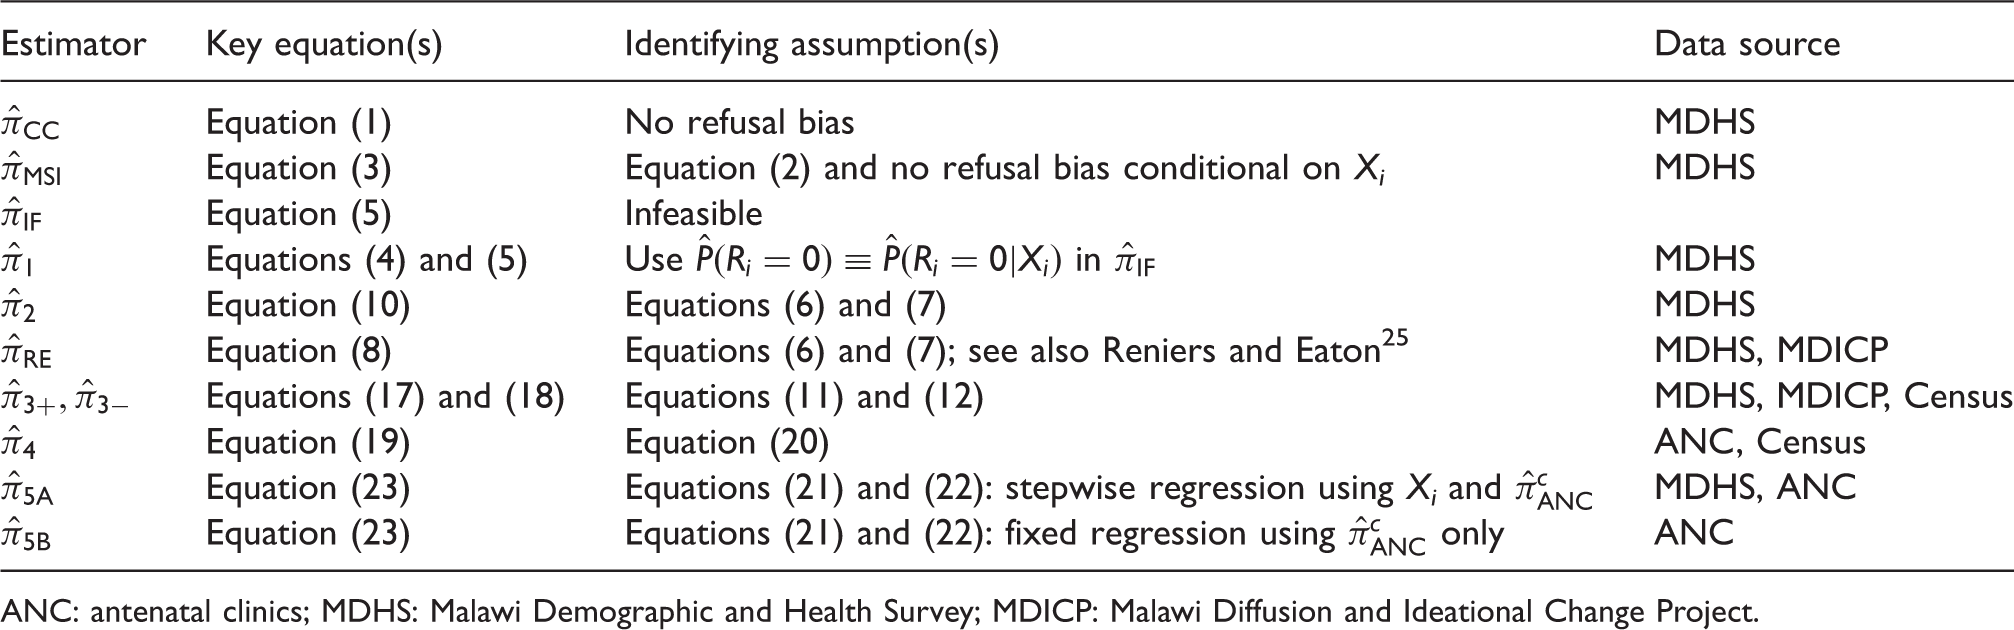
A summary of this and other estimators considered in this paper with their key estimation equations, identifying assumptions and data requirement is given in Table 1.
Summary of estimators considered in this study.
Estimator
Key equation(s)
Identifying assumption(s)
Data source
Equation (1)
No refusal bias
MDHS
Equation (3)
Equation (2) and no refusal bias conditional on Xi
MDHS
Equation (5)
Infeasible
Equations (4) and (5)
Use in
MDHS
Equation (10)
Equations (6) and (7)
MDHS
Equation (8)
Equations (6) and (7); see also Reniers and Eaton25
MDHS, MDICP
Equations (17) and (18)
Equations (11) and (12)
MDHS, MDICP, Census
Equation (19)
Equation (20)
ANC, Census
Equation (23)
Equations (21) and (22): stepwise regression using Xi and
MDHS, ANC
Equation (23)
Equations (21) and (22): fixed regression using only
ANC
ANC: antenatal clinics; MDHS: Malawi Demographic and Health Survey; MDICP: Malawi Diffusion and Ideational Change Project.
4 Results
4.1 Refusal patterns
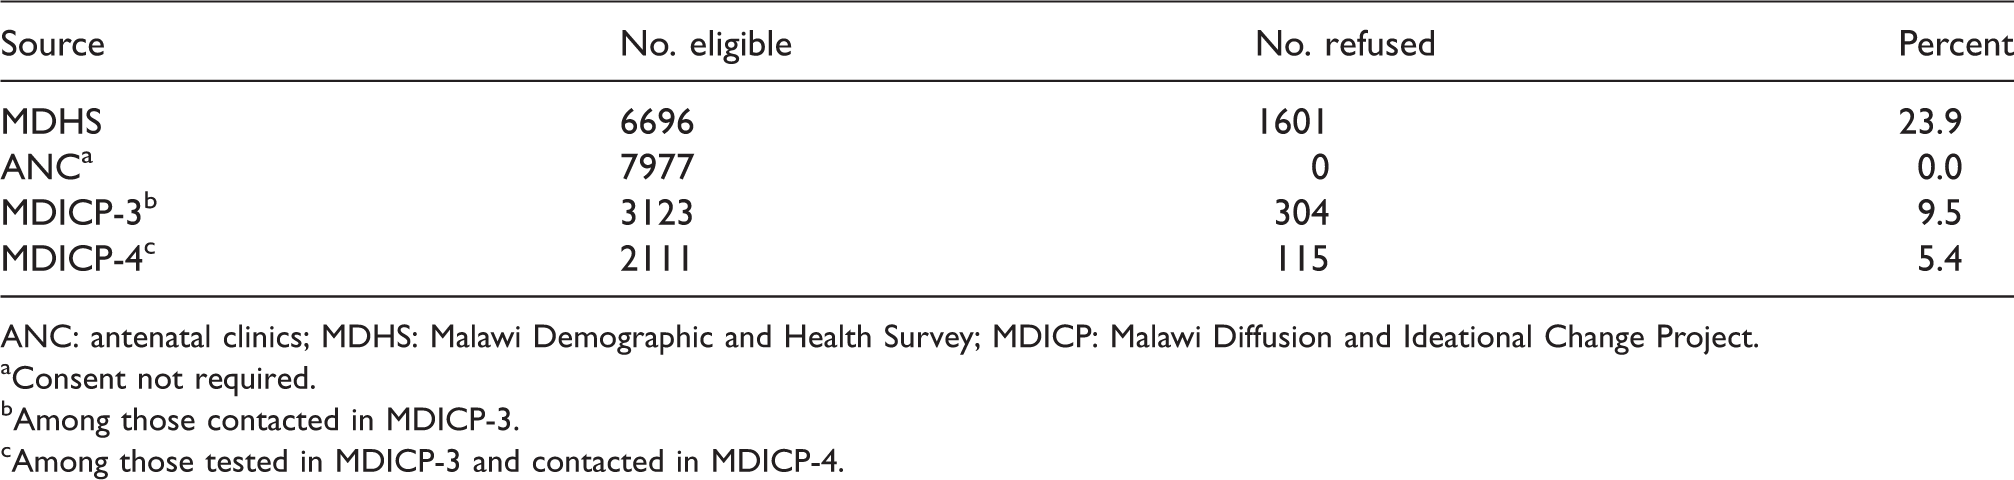
We first study the possible bias in the prevalence estimates due to refusals. We begin by summarising the refusal patterns in the data in Table 2. It is clear from the table that the refusal rate of around 23.9% in MDHS is far higher than those in the other two surveys. There are no refusals in the ANC survey as HIV test was carried out based on blood samples left behind for syphilis test and no consent was sought. For MDICP-3, the refusal rate is about 9.5% and for MDICP-4, we obtain a refusal rate of 5.4%, among those who tested in MDICP-3. The refusal rates among men are similar to those in women, in all surveys. For MDHS, the refusal rate for men is and for women is ; the corresponding figures for MDICP-3 are and , respectively, and for MDICP-4, and , respectively. Similar patterns of refusal rates are reported elsewhere.25,35 The slight differences between our figures and those reported in Reniers and Eaton25 and Obare35 can be attributed to the different baseline samples used (for example, Reniers and Eaton25 included males aged 15–54 whereas we only used those aged 15–49, in line with the 2004 MDHS report). The district-level HIV refusal map for MDHS shown in Figure 1 indicates higher rates in the central and southern parts of Malawi. There is high variation in the refusal rates across the districts.
ANC: antenatal clinics; MDHS: Malawi Demographic and Health Survey; MDICP: Malawi Diffusion and Ideational Change Project.
Consent not required.
Among those contacted in MDICP-3.
Among those tested in MDICP-3 and contacted in MDICP-4.
4.2 Adjustment of HIV prevalence estimates
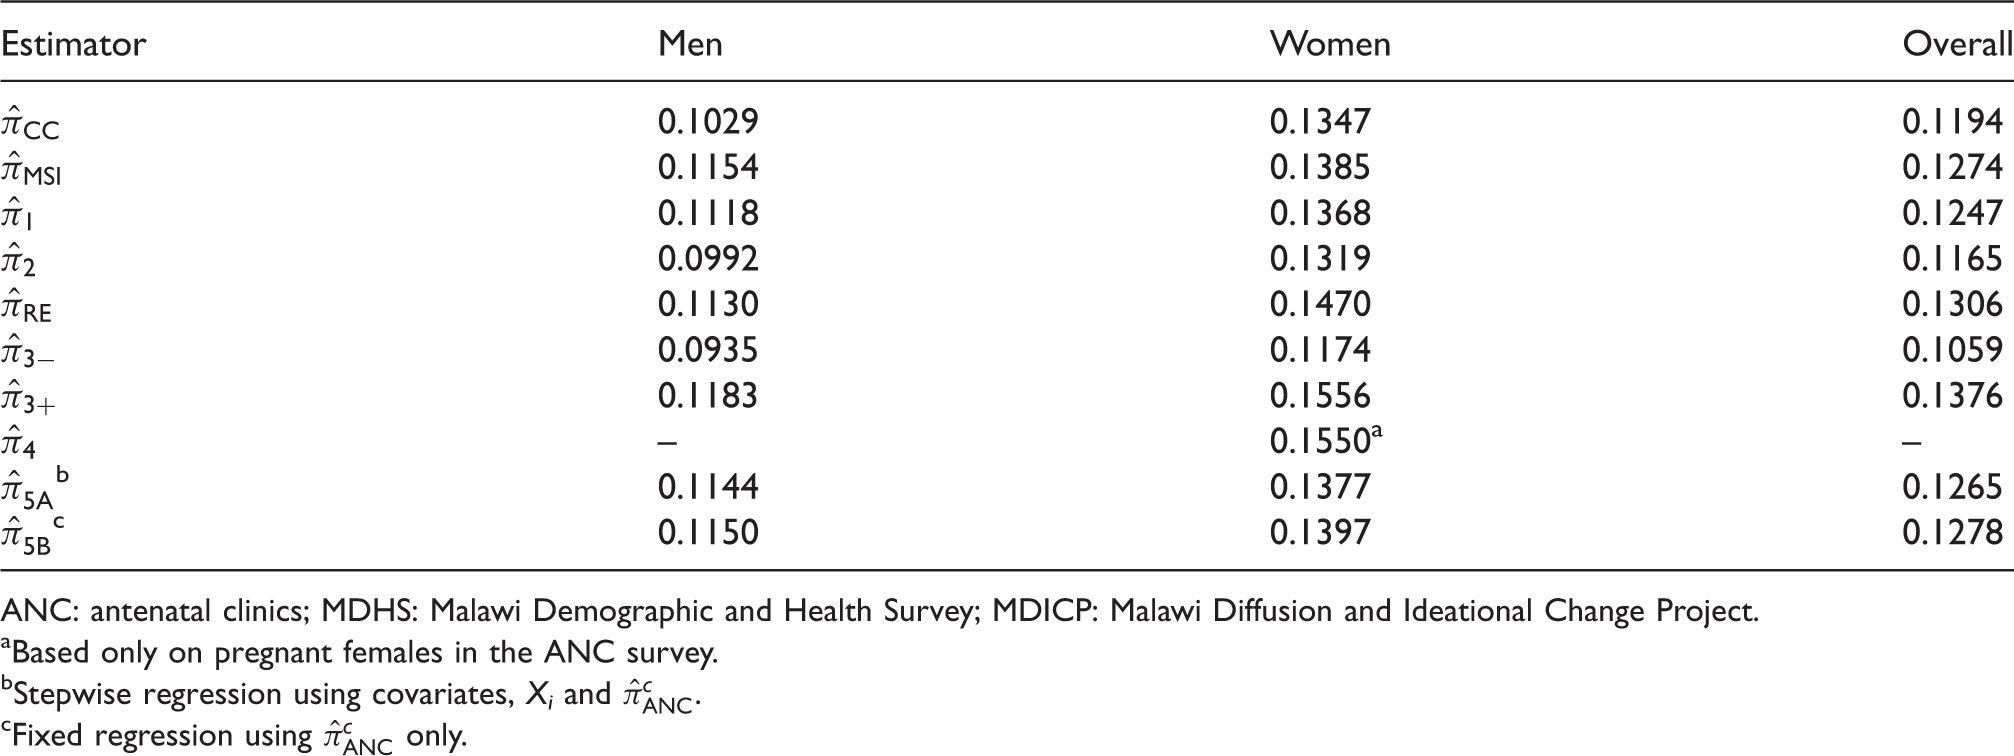
We apply various estimators considered in the previous section to MDHS, ANC and MDICP data. A summary of the results is given in Table 3. For each estimator, we obtain separate HIV prevalence estimates for women and men. The estimates are then combined to derive overall estimates. In deriving these estimates, sampling weights need to be considered. The 2004 MDHS report27 (Tables 12.5, Appendix G.1, and p. 452) uses sampling weights for calculating HIV prevalence and adjusted rates. These sampling weights are made up of three types: (1) HIV sampling weights for those who are tested; (2) individual sampling weights for those interviewed but not tested; and (3) household sampling weights for those who are not interviewed and not tested. In Reniers and Eaton,25 the sampling weighting scheme of the 2004 MDHS report was applied to the MDHS data but no weights (except by the subgroup proportion of the population) were applied to the MDICP data. Sampling weights do not apply to ANC data since they come from women who visited ANC sites. To facilitate comparison to earlier results, we follow the same strategy as earlier studies in handling sampling weights for the MDHS data and MDICP data. For the ANC data, data are weighted by their proportional representation from census. We return to the discussion of sampling weights and their relationship to refusal bias subsequently.
HIV prevalence estimates using MDHS, ANC and MDICP data.
ANC: antenatal clinics; MDHS: Malawi Demographic and Health Survey; MDICP: Malawi Diffusion and Ideational Change Project.
Based only on pregnant females in the ANC survey.
Stepwise regression using covariates, Xi and .
Fixed regression using only.
There are 6696 individuals eligible for HIV testing in our MDHS sample. Out of these individuals, 1601 individuals (886 women and 715 men) expressly refuse to take an HIV test. Among the remaining 5095 individuals, 647 individuals (418 women and 229 men) are found to be HIV positive and 4448 individuals (2408 women and 2040 men) are HIV negative, giving an overall unweighted HIV prevalence of . All subsequent analyses are, however, based on weighted cases, as described earlier. The complete case estimate of HIV prevalence in women is 0.1347. Similarly, the complete case prevalence estimate for men is approximately 0.1029. The overall estimate combining the women and men estimates is about 0.1194. Compared to , the estimator uses additional information from those who do not take an HIV test. For the prediction of HIV status, we use the same set of covariates as those in the MDHS 2004 report, Appendix G,27 that includes both demographic and behavioural variables: age, wealth index, education, geographical region, rural/urban residence, age at first sex, work status, marital status, smoking/tobacco use, media exposure, religion, STI or STI symptoms, condom use, higher-risk sex in the last year (sex with a non-marital, non-cohabiting partner), test for AIDS, number of sexual partners in the last 12 months, sexually transmitted disease in the last year, and willingness to care for a relative with AIDS. Separate logistic regressions are carried out for women and men. The model is then applied to impute HIV status for those who refuse an HIV test. Using this procedure, the prevalence estimates for women and men are 0.1385 and 0.1154, respectively.
The inverse probability estimator assumes acceptance of HIV testing may be non-random and that the probability of acceptance can be captured by some observable covariates. We use the same list of covariates from the MDHS 2004 report for estimating the propensity score for acceptance of HIV testing. Due to some individuals with no information on some of the covariates, the model for men includes only 2304 observations from MDHS, as opposed to the entire sample of 2984 men. Out of the 2304 men, 1759 men accepted an HIV test with a weighted average acceptance rate of 0.835, but the interquartile range of the estimated propensity score is from 0.840 to 0.962. Similarly for women, the model is based on 2623 women instead of the entire sample of 3712 women. Out of these 2623 women, 2019 women accepted an HIV test with a weighted average acceptance rate of 0.747, but the interquartile range of the estimated propensity score is 0.813 to 0.932. So for both men and women, the estimated propensity scores are somewhat different from to their respective means, and accounts for such differences by adjusting the complete case estimates. Indeed, for women and men, the values of are 0.1368 and 0.1118, respectively, slightly higher than their complete case counterparts.
Out of the 6696 individuals in our MDHS sample, 5816 report that they do not have a prior HIV test. These individuals form the basis for calculating . Among women who do not have a prior HIV test, 359 have a positive HIV test result while 2138 are HIV negative, giving a weighted HIV prevalence estimate of 0.1319, and the corresponding estimate for men is 0.0992.
A total of 2874 individuals (1539 females and 1335 males) consent to an HIV test and provide complete information for analysis in MDICP-3. Of these individuals, 1996 consent to an HIV test in MDICP-4 and 115 refuse, while the HIV status for the rest is missing for other reasons. Among those individuals who are tested in MDICP-3, 185 (111 females and 74 males) are HIV positive and 2689 (1428 females and 1261 males) are HIV negative.
We repeat the analysis of Reniers and Eaton25 using our data. Since we exclude males aged 50–54 years from the MDHS data whereas Reniers and Eaton included them, we do not expect the two sets of estimates to be identical. To compute the estimate using , we need to know whether an individual has taken the first-round HIV test (MDICP-3), whether the individual knows the test result, the actual test result, and the refusal of the second-round HIV test conducted in MDICP-4. The estimates for males and females are 0.1130 and 0.1470, respectively, and the combined overall estimate is 0.1306, which is quite similar to the figure of 0.132 in Reniers and Eaton (Table 2).25 The same set of data is also used to find and . The bounds for men are 0.0935 and 0.1183, and for women, they are somewhat wider at 0.1174 and 0.1556, respectively.
To implement the estimator , we first extract the number of ANC attendees and HIV positive cases from the 19 sentinel sites in the 2003 ANC data.28 The site-specific numbers are then used to represent the HIV prevalence in the rural and urban areas in each of the 28 districts defined in the 2003 ANC Technical Report (Table 2).36 The resulting rural HIV rates in the 28 districts range from 0.0969 to 0.2315 with a mean of 0.1349 while the urban rates range from 0.0993 to 0.3288 with a mean of 0.2010. Finally, the district-area numbers are weighted by the population size from the 1998 Census data (IPUMS, University Minnesota and Malawi National Statistical Office, 1998 Population and Housing Census) to give an overall HIV prevalence estimate of 0.1550. Since the ANC data are based on pregnant women only, only one HIV prevalence estimate is obtained. Estimates using ANC survey data have been used as indicators for national HIV trends.37–40
The estimator allows refusal to be dependent on the (unobservable) HIV status (for those who refuse testing). To model the propensity score function for (non)-refusal, we impute the unobservable HIV status with HIV prevalence estimates from the ANC data. The ANC prevalence estimates are obtained for different district-areas; for each individual who resides in a particular district-area, his/her HIV status is imputed by .
We consider two estimates based on . The first one, , uses and a stepwise regression procedure to select from the same list of covariates used in to model the propensity score. The second one uses only for modelling the propensity score. These estimated propensity scores are then used in to give different prevalence estimates.
Using and a selection of other covariates to model the propensity score, the corresponding HIV prevalence estimates, , for women and men are 0.1377 and 0.1144, respectively. When the propensity score is modelled only with , the corresponding HIV prevalence estimates, for women and men are 0.1397 and 0.1150, respectively.
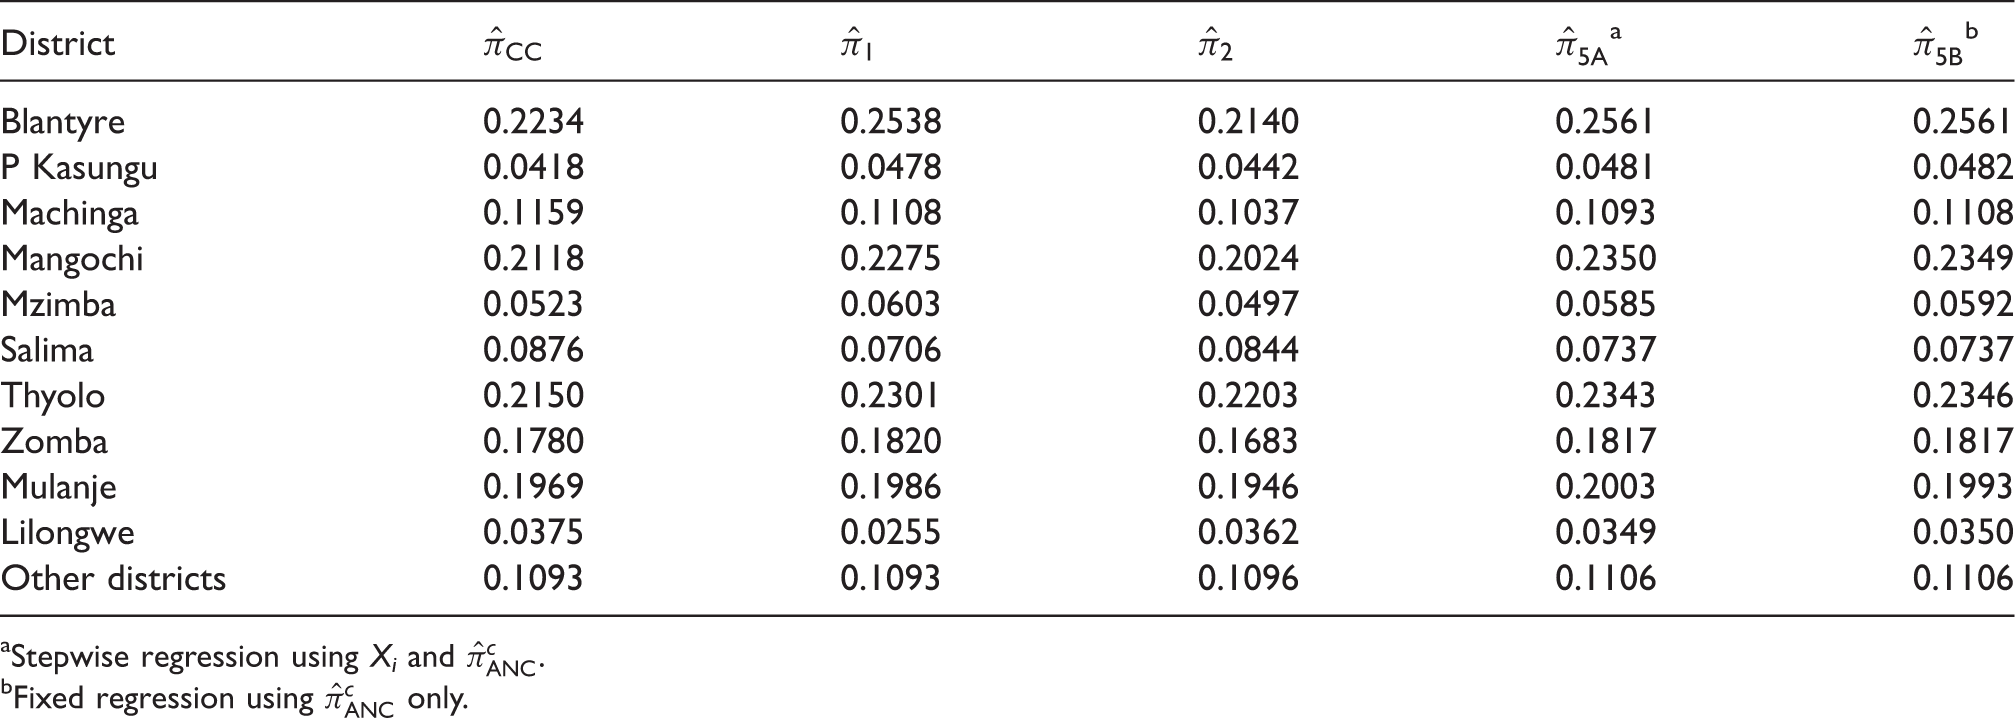
Table 4 gives the district-level estimates of HIV prevalence estimates using various methods discussed in this paper. There is high variation in HIV prevalence estimates across districts of Malawi, with values ranging from around 5% in Kasungu to as much as 25% in Blantyre. HIV prevalence estimated by and are very similar; in most districts, these estimators give higher values than . On the other hand, is similar to in most districts. District-level HIV prevalence rates for urban and rural areas directly calculated from MDHS and ANC data are presented in Figure 2. In both data sources, HIV prevalence rates are higher in the urban areas than the rural areas.
Estimated HIV prevalence rates. (a) Complete case estimates using urban MDHS data. (b) Complete case estimates using rural MDHS data. (c) District-area estimates using urban ANC data. (d) District-area estimates using rural ANC data.
District-level HIV prevalence estimates various methods.
This study explored several methods for adjusting refusal bias in HIV prevalence estimates in population-based surveys. It also conducted a thorough investigation of robustness against refusal bias. Compared to the naïve complete case estimator , all point estimators except give higher adjusted estimates for both men and women (and overall). These results are consistent with those observed in earlier studies.27,22,25,6
Recall that for , the key assumptions are equations (6) and (7), which essentially mean that is a type of complete case estimator applied to those who had never been tested before the 2004 MDHS survey. Hence, it is not surprising that the estimates are not too different from the naïve estimates. Both estimators implicitly assume missing completely at random. In the case of , the observed data are considered a random sample of the population. In the case of , the subsample of those with no prior HIV test and who accepted HIV test form a random sample.
Using the remaining methods, the prevalence for men is consistently adjusted upwards (from the complete case estimate) by about one percentage point, irrespective of the method used.
The case for women is somewhat different. The adjustment is method dependent. The results can be broadly classified into three groups, based on the methods used. The first group of methods, which includes and , uses covariates to model the missing HIV test results (or the propensity that HIV test results are observed). Their results are all quite similar, all give an upward adjustment of HIV prevalence of around 0.5% from the complete case estimate. These methods are related in the sense that they are premised on the HIV status (and hence propensity to accept HIV test) can be modelled using observable demographic and behavioural covariates. Therefore, the methods would not be effective if these covariates have low predictive powers. A multi-country study of bias in HIV estimates from DHS22 found that HIV prevalence is not strongly related to observable covariates.
The methods that combine the MDHS data and MDICP data () suggest upward adjustments of about one percentage point. Compared to the complete case estimator, the estimator adjusts the prevalence of women upwards by 1.3%. Reniers and Eaton25 found that, compared to those who accept an HIV test, individuals who refuse an HIV test are more than 4.5 times as likely to be HIV positive and hence, the upward adjustment is reasonable based on this fact. On the other hand, , while using the same assumptions as , does not give an upward adjustment of the complete case rates (either men, women or overall). This raises the question of why they are different. Comparing equation (8) to equation (10), we notice that the latter ignores those who refused to be tested (see above for the complete case interpretation of ) while the former explicitly estimates the missing HIV status using MDICP data. Hence, is more similar to a MSI or imputation approach.29,41 Naturally, if we assume that equations (6) and (7) hold and that the MDICP data can be used to replace the missing MDHS data, uses additional covariate information from observations with missing HIV status, hence more accurate than .
Another method that also uses the MDICP data is . We observe the lower and upper bounds for the HIV prevalence are fairly tight around the complete case estimates. Since these bounds are created with very mild assumptions, the fact that they are very close to the complete case estimates suggests that the refusal bias in the MDHS estimates may be quite small. Between men and women, the bounds for women are much wider. In particular, the upper bound for women is over 2% points above that of the complete case estimate for women. This result is consistent with the behaviour of , which adjusts the estimate for women upwards.
The third group is the method that uses the ANC data. The ANC survey provides a single prevalence estimate () for women, and is significantly higher than most of the prevalence rates from other methods. This result is not surprising since ANC surveys only capture data from pregnant women in more urbanised areas who choose to go to an ANC during their pregnancy and have rates higher than the national average. There are indeed some evidence that applying ANC prevalence directly to give population prevalence estimates leads to biases.42–44 Nevertheless, ANC prevalence does reflect the actual but unknown prevalence within each district-area and is free of refusal (or other kinds of non-response) bias.
6 Conclusion and implication for future research
The motivation for our paper is to provide a coherent and comprehensive conceptual framework for studying survey data with non-response due to refusals. We revisited some existing methods and also introduced new ones. Our paper offers a novel approach to the challenges that refusals create and proposes possible solutions for them. We compared various methods, clarifying their underlying assumptions, implications and data requirements. The approach offered in this paper is especially useful for practitioners in charge of planning and analysis. The primary application of our approach is the estimation of HIV prevalence particularly in Africa, where HIV/AIDS remains epidemic or endemic. Our approach is also applicable to other issues and areas with similar challenges.
Longitudinal surveys are still uncommon in many parts of the developing world, since they are difficult to implement and the quality of data from such surveys is often poor because of the difficulty with tracking mobile populations. While longitudinal studies are still relatively rare, the availability of nationally representative longitudinal studies is on the rise in developing countries. One of our contributions lies in proposing ways to meaningfully bring together the following three very different three types of data: MDHS, ANC and MDICP. We show how these data can be combined when none of them can allow us to reliably estimate HIV prevalence in Malawi on their own.
A common approach for adjusting (refusal) bias in surveys is by weighting. Methods such as in this paper, whether using sampling weights, or weights based on fitting a propensity function, use this approach. This approach works only if refusal is independent of the outcome, given the covariates that are used to model the propensity function. In the missing data literature, this condition is called missing at random. However, it can never be confirmed whether the missing at random assumption actually holds. We considered alternative methods to solve this problem, by exploiting information from auxiliary surveys. Using the assumptions of Reniers and Eaton,25 we identified a new method () using only MDHS data. The method uses data from those who have never been tested and do not know their HIV status, and hence, their decision to accept a HIV test is arguably less susceptible to bias.
Further, we introduced a ‘bound’ approach using data from MDICP, by which we estimated the plausible lower and upper bounds () of the prevalence based on a set of weak and reasonable assumptions. This approach is potentially useful because it is often difficult to validate or falsify an underlying assumption. Furthermore, it shows that a carefully designed and implemented localised study may also be helpful for understanding the magnitude of non-response bias.
We also proposed two different methods using the ANC data. The first method () uses summary statistics from antenatal care units and combines them with census data to obtain prevalence estimates. An advantage of this approach is that no micro-data is needed and therefore the method can be implemented easily. The second method () combines the MDHS data with the ANC data to produce prevalence estimates. The novel feature of this method is the use of weights based on ANC data that adjust for non-ignorable missingness. Since ANC surveys are relatively free from refusal bias and are carried out at more frequent intervals than DHS, these two methods offer the possibility of obtaining prevalence estimates on a more contemporaneous basis.
In the presence of non-responses, all analytic methods require some assumptions and it is hard to determine what method is best. However, when there are available alternative methods, a way to go about addressing the refusal bias problem is to use all methods and compare their results. In the current study, the prevalence estimates range from 0.0935 to 0.1183 for men, from 0.1174 to 0.1556 for women, and 0.1059 to 0.1376 overall (see Table 3, last column). The relatively narrow range for men tells us that the refusal bias, if it exists at all, is practically not a major issue. The refusal bias for women may be larger but it is still small in absolute value and would be no larger than 3%. As these results indicate, the range reflects (the lack of) limits to which we can place our confidence in our results.
Our findings of acceptable level of refusal bias in the Malawi prevalence estimates can be contrasted from that reported in Obare,35 where substantial potential bias is attributed to refusal/absence using the MDICP data. In that report, the percentage of HIV positive is 4.4 among those who accept an HIV test in both MDICP-3 and MDICP-4, compared to 15.5 and 13.0, respectively, for those who refuse or are absent for the test in MDICP-4. However, using our own analysis, we found this difference is due largely to those who already know their HIV test results from MDICP-3. Among those who do not know the results of the first-round HIV test, the proportion of people who refuse is similar between HIV-positive and HIV-negative individuals. In contrast, among those who know the results of the first-round HIV test, the proportion of people who refuse is substantially higher for HIV-positives than HIV-negatives. We may argue that a person who knows his/her HIV positive status is more likely to decline a second test because HIV positive status cannot be changed and the person may feel another test is meaningless. In our paper, the estimates and are calculated using those who do not know their HIV status, whereas the bounds and explicitly allow for differences in refusal rates between those who know and those do not know their HIV status under a set of weak assumptions. The ANC surveys can be assumed to be free from refusal bias, and uses this assumption to come up with refusal bias-free prevalence estimates; for , the ANC data are used indirectly to create weights that adjust for refusals. None of the methods considered in this paper show a large upward adjustment from the weighted estimate and the unadjusted estimate .
Supplemental Material
Supplemental material for Refusal bias in HIV data from the Demographic and Health Surveys: Evaluation, critique and recommendations
Supplemental Material for Refusal bias in HIV data from the Demographic and Health Surveys: Evaluation, critique and recommendations by Oyelola A Adegboye, Tomoki Fujii and Denis HY Leung in Statistical Methods in Medical Research
Footnotes
Acknowledgements
We acknowledge ORC Macro for granting us access to the MDHS data. We thank the Population Studies Center, University of Pennsylvania for providing us with the MDICP data. In particular, we gratefully acknowledge the help of Dr Philip Anglewicz for sending us the data and documentations for MDICP‐3 and MDICP‐4. The ANC data were obtained from the 2003 Malawi National AIDS Commission report. The census data were part of the 1998 and 2008 Population and Housing Census carried out by the National Statistical Office, Government of Malawi and made available by the Minnesota Population Center (Integrated Public Use Microdata Series, International: Version 6.1 [Machine‐readable database]. Minneapolis: University of Minnesota, 2011).
Declaration of conflicting interests
The author(s) declared no potential conflicts of interest with respect to the research, authorship, and/or publication of this article.
Funding
The author(s) received no financial support for the research, authorship, and/or publication of this article.
Note
Supplemental material
Supplemental material for this article is available online.
References
1.
Global HIV/AIDS response: epidemic update and health sector progress towards universal access: progress report 2011. Geneva: WHO, 2011.
2.
BoermaJTGhysPDWalkerN. Estimates of HIV-1 prevalence from national population-based surveys as a new gold standard. Lancet2003; 362: 1929–1931.
3.
Garcia-CallejaJGouwsEGhysPD. National population-based HIV prevalence surveys in sub-Saharan Africa: results and implications for HIV and AIDS estimates. Sex Transm Infect2006; 82: iii64–iii70.
4.
MarstonMHarrissKSlaymakerE. Non-response bias in estimates of HIV prevalence due to the mobility of absentees in national population-based surveys: a study of nine national surveys. Sex Transm Infect2008; 84: i71–i77.
5.
GrovesRMDillmanDAEltingeJL, et al.Survey nonresponse, Chichester: Wiley, 2002.
6.
ObareFFlemingPAnglewiczP, et al.Acceptance of repeat population-based voluntary counseling and testing for HIV in rural Malawi. Sex Transm Infect2009; 85: 139–144.
7.
LynnPClarkeP. Separating refusal bias and non-contact bias: evidence from UK national surveys. The Statistician2002; 51: 319–333.
8.
HawkesDPlewisI. Modelling non-response in the National Child Development Study. J R Stat Soc A2006; 169: 479–491.
9.
BilletJPhilippensMFitzgeraldR, et al.Estimation of nonresponse bias in the European Social Survey: using information from reluctant respondents. J Official Stat2007; 23: 135–162.
10.
DurrantGBSteeleF. Multilevel modelling of refusal and non-contact in household surveys: evidence from six UK Government surveys. J R Stat Soc A2009; 172: 361–381.
11.
LynnP. Non-response biases in surveys of schoolchildren: the case of the English Programme for International Student Assessment (PISA) samples. J R Stat Soc A2012; 175: 915–938.
12.
ThomsenIHolmøyAMK. Combining data from surveys and administrative record systems: The Norwegian experience. Int Stat Rev1998; 66: 201–221.
13.
ZanuttoEZaslavskyAUsing administrative records to impute for nonresponse. In: GrovesRMDillmanDAEltingeJL, et al.(eds). Survey non-response, Chichester: Wiley, 2002.
14.
YucelRMZaslavskyAM. Imputation of binary treatment variables with measurement error in administrative data. J Am Stat Assoc2005; 100: 1123–1132.
15.
van den BergGJLindeboomMDoltonPJ. Survey non-response and the duration of unemployment. J R Stat Soc A2006; 169: 585–604.
16.
StoopIA. Survey nonrespondents. Field Methods2004; 16: 23–54.
17.
KreuterFMüllerGTrappmannM. Nonresponse and measurement error in employment research: making use of administrative data. Public Opin Q2010; 74: 880–906.
18.
OlsonK. Do non-response follow-ups improve or reduce data quality?: a review of the existing literature. J R Stat Soc A2013; 176: 129–145.
19.
AlhoJM. Adjusting for nonresponse bias using logistic regression. Biometrika1990; 77: 617–624.
20.
BurtonJLaurieHLynnP. The long-term effectiveness of refusal conversion procedure on longitudinal surveys. J R Stat Soc A2006; 169: 459–478.
21.
RubinDB. Multiple imputation for nonresponse in surveys, New York, NY: Wiley, 1987.
22.
MishraVBarrereBHongR, et al.Evaluation of bias in HIV seroprevalence estimates from national household surveys. Sex Transm Infect2008; 84: i63–i70.
23.
HoganDRSalomonJACanningD, et al.National HIV prevalence estimates for sub-Saharan Africa: controlling selection bias with Heckman-type selection models. Sex Transm Infect2012; 88: i17–i23.
24.
HeckmanJJ. Sample selection bias as a specification error. Econometrica1979; 47: 153–161.
25.
ReniersGEatonJ. Refusal bias in HIV prevalence estimates from nationally representative seroprevalence surveys. AIDS2009; 23: 1–9.
26.
FloydSMolesworthADubeA, et al.Underestimation of HIV prevalence in surveys when some people already know their status, and ways to reduce the bias. AIDS2013; 27: 233–242.
27.
National Statistical Office and ORC Macro. Malawi demographic and health survey 2004. National Statistical Office and ORC Macro, 2005.
28.
National AIDS Commission. HIV sentinel surveillance report. Ministry of Health and Population, Malawi, 2003.
29.
PepeMSReillyMFlemingTR. Auxiliary outcome data and the mean-score method. J Stat Plann Inference1994; 42: 137–160.
30.
HorvitzDGThompsonDJ. A generalization of sampling without replacement from a finite universe. J Am Stat Assoc1952; 47: 663–685.
31.
The POLICY Project. Estimating national HIV prevalence in Malawi from sentinel surveillance data. The National AIDS Control Programme, Lilongwe, Malawi, 2001.
32.
MontanaLSMishraVHongR. Comparison of HIV prevalence estimates from antenatal care surveillance and population-based surveys in sub-Saharan Africa. Sex Transm Infect2008; 84: i78–i84.
33.
Little RJA and Rubin DB. Statistical analysis with missing data. New York, NY: Wiley, 2002.
34.
National AIDS Commission. HIV and syphilis sero-survey and national HIV prevalence and AIDS estimates report for 2007. Ministry of Health, Malawi, 2008.
35.
ObareF. Nonresponse in repeat population-based voluntary counseling and testing for HIV in rural Malawi. Demography2010; 47: 651–665.
36.
National AIDS Commission. Estimating national HIV prevalence in Malawi from Sentinel surveillance data. Technical Report, Ministry of Health and Population, Malawi, 2003.
37.
KigadyeRMKlokkeANicollA, et al.Sentinel surveillance for HIV-1 among pregnant women in a developing country: 3 years' experience and comparison with a population serosurvey. AIDS1993; 7: 849–855.
38.
FylkesnesKNdhlovuZKasumbaK, et al.Studying dynamics of the HIV epidemic: population-based data compared with sentinel surveillance in Zambia. AIDS1998; 12: 1227–1242.
39.
GlynnBACM JrMusondaRMKahindoM, et al.Factors influencing the difference in HIV prevalence between antenatal clinic and general population in sub-Saharan Africa. AIDS2001; 15: 1717–1725.
40.
Asamoah-OdeiEGarcia CallejaJMBoermaJT. HIV prevalence and trends in sub-Saharan Africa: no decline and large subregional differences. Lancet2004; 364: 35–40.
41.
ChenYH. A robust imputation method for surrogate outcome data. Biometrika2000; 87: 711–716.
42.
ZabaBWCarpenterLMBoermaJT, et al.Adjusting ante-natal clinic data for improved estimates of HIV prevalence among women in sub-Saharan Africa. AIDS2000; 14: 2741–2750.
43.
GregsonSTerceiraNKakowaM, et al.Study of bias in antenatal clinic HIV-1 surveillance data in a high contraceptive prevalence population in sub-Saharan Africa. AIDS2002; 16: 643–652.
44.
GouwsEMishraVFowlerTB. Comparison of adult HIV prevalence from national population-based surveys and antenatal clinic surveillance in countries with generalised epidemics: implications for calibrating surveillance data. Sex Transm Infect2008; 84: i17–i23.
Supplementary Material
Please find the following supplemental material available below.
For Open Access articles published under a Creative Commons License, all supplemental material carries the same license as the article it is associated with.
For non-Open Access articles published, all supplemental material carries a non-exclusive license, and permission requests for re-use of supplemental material or any part of supplemental material shall be sent directly to the copyright owner as specified in the copyright notice associated with the article.