
Abstract
Survival analysis is commonly conducted in medical and public health research to assess the association of an exposure or intervention with a hard end outcome such as mortality. The Cox (proportional hazards) regression model is probably the most popular statistical tool used in this context. However, when the exposure includes compositional covariables (that is, variables representing a relative makeup such as a nutritional or physical activity behaviour composition), some basic assumptions of the Cox regression model and associated significance tests are violated. Compositional variables involve an intrinsic interplay between one another which precludes results and conclusions based on considering them in isolation as is ordinarily done. In this work, we introduce a formulation of the Cox regression model in terms of log-ratio coordinates which suitably deals with the constraints of compositional covariates, facilitates the use of common statistical inference methods, and allows for scientifically meaningful interpretations. We illustrate its practical application to a public health problem: the estimation of the mortality hazard associated with the composition of daily activity behaviour (physical activity, sitting time and sleep) using data from the U.S. National Health and Nutrition Examination Survey (NHANES).
Keywords
1 Introduction
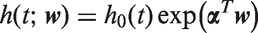
Statistical survival analysis methods are commonly used in medical and public health studies where the outcome of interest is time to a specific event. 1 This event is often a hard end outcome such as death, relapse of a disease or development of a new disease. For example, in public health, scientists might be interested in quantifying the risk of mortality to being exposed to specific behavioural or environmental factors over time. 2 Similarly, clinical trials are conducted to assess the efficacy of interventions or new treatment regimes and the risk of potential adverse effects. These studies involve following participants for a long time and recording time to the event of interest. Cox’s proportional hazards regression analysis 3 is one of the most common statistical modelling tools used to analyse such types of data.
The Cox regression model simplifies the analysis of survival rates by defining an instantaneous rate of mortality (or some other event) referred to as the hazard function, and estimating the proportional difference in the hazard function either between treatment groups or associated with changes in the exposure variables. 4
The hazard function h is formally defined with reference to the probability of survival as


Compositional data are common in many disciplines, including medical and public health research. Some recent discussions and applications of compositional methods in the area include nutritional epidemiology, 5 health care research, 6 microbiome and next-generation sequencing studies,7,8 and physical activity epidemiology.9,10 The key fact is that the measured values of a part of a composition are only meaningful when they are put in contrast to the values of the other parts or components. Importantly, the results and conclusions should be the same regardless of the chosen scale (what is referred to as the scale invariance property). Moreover, when the data are closed (i.e. represented with an arbitrary but fixed sum of the parts, commonly 1 or 100), a multicollinearity problem arises in regression analysis as a consequence of the singularity of the raw covariance matrix between compositional variables, which was already recognised in early approaches to mixture experiments.11–14 Although for model fitting purposes this could be technically overcome using, e.g., Moore-Penrose pseudo-inverse matrix, this does not guarantee the quality of the regression estimation, and does not allow the investigation of the relative importance and role of the parts of the composition from the model coefficients. 15 If the special nature of compositions is not considered adequately, the relationships between parts and inferences about any of them will be dependent on the presence or absence of other parts, what is known as the subcompositional incoherence problem. 16 This is, for example, highly relevant in physical activity research, where analyses of the allocation of time across daily activities considering either the entire 24-hour day or the waking day only (excluding sleep time) might lead to conflicting conclusions when both data sets are represented, e.g. in percentages. The log-ratio methodology for compositional data analysis 16 provides a coherent statistical framework which resolves these issues through the use of log-ratio type representations of the compositional variables. Although approaches have been presented for ordinary regression modelling with compositions,9,16–20 and survival analysis has been applied in respect of compositional outcomes such as the composition of different strains of bacteria, 12 to our knowledge survival analysis based on the Cox regression model, or indeed survival analysis in general, with compositional explanatory variables remains formally unexplored.
In the following sections, we introduce and discuss Cox regression analysis and related inference for the case of compositional exposure variables. We then illustrate the methodology by applying it to model the relationship between mortality and the composition of time spent in sleep, physical activity and sedentary behaviour using U.S. National Health and Nutrition Examination Survey (NHANES) data.
2 The compositional Cox regression model
The formal definition of compositional data has evolved from the particular case of multivariate positive data subject to a fixed sum constraint, as for example the distribution of the use of time over the 24-h day cycle (either expressed in percentages adding up to 100 or in hours per day), to a more general characterisation as interdependent data with parts carrying relative information with respect to each other, with the observations not necessarily adding up to a same constant value.
16
Thus, a composition
2.1 Defining log-ratio coordinates
In order to deal with the particularities of compositional data in our survival analysis context, we adhere to the well-established methodological approach originated from the seminal work by Aitchison 22 and based on working with real-valued log-ratios between parts of the composition. Statistical results obtained using log-ratio coordinates can be then transferred back to the simplex to be represented in terms of the original composition. There have been a number of proposals to constructing such log-ratios and we briefly review them in the following sections.
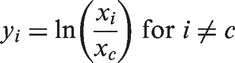
2.1.1 Additive log-ratios
For modelling purposes, Aitchison
22
originally proposed the so-called additive log-ratio (alr) transform, so that a set of
2.1.2 Isometric log-ratios
Recent advances in the geometric characterisation of the simplex as representation of the sample space of compositional data, namely a simplex
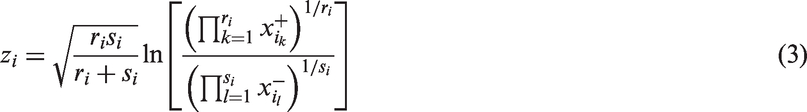
A procedure known as sequential binary partition (SBP) can be used to construct tailored ilr-coordinates, usually called compositional balances (zi, for
Note that there are infinite possible ilr-coordinate representations of a composition. However, these are all orthogonal rotations of each other and the fitted models from the same data will be entirely equivalent, with the only difference being obviously the value of the coefficients associated to the particular system of ilr-coordinates used. The rotations can be defined with reference to a different orthogonal mapping
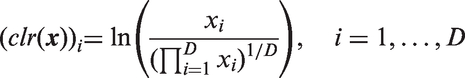
A direct consequence of the ability to define any ilr-coordinates with reference to an orthogonal mapping on uniquely defined clr-transformed parts, is that we can switch between two different partitions by an orthogonal mapping. For example, switching from a basis defined by

It is worth noting that regression models using either alr- or ilr-coordinates will be equivalent in that the predicted responses will be identical, and they will also produce the same overall estimates and performance measures. However, when working in ilr-coordinates, the regression coefficient of a particular ilr-coordinate remains invariant to the choice (by rotation) of the other ilr-coordinates in the system due to the orthogonality property. Using an alr mapping though, the regression coefficients of models based on either
2.1.3 Pivot isometric log-ratios
The use of ilr-coordinates guarantees desirable formal properties like scale invariance, subcompositional coherence, and orthonormality.
24
Given a composition which is relevant for the scientific question at hand, a particular system of ilr-coordinates obtained by SBP can be helpfully used to highlight in the first ilr-coordinate the relative importance or dominance of one part against the geometric average of the others in that particular composition of interest.
26
Thus, without loss of generality, if we wished to investigate the relative importance of the part xj against all other parts (e.g. one physical activity behaviour versus all the others) we would express a composition
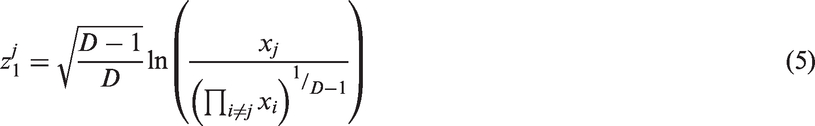
Pivot ilr-coordinates are particularly useful in first approaches to a problem with no a priori knowledge. They also allow the provision of results in a format which resembles common outputs from regression model fits, which eases the transition from ordinary to compositional modelling. The extra computational burden from actually fitting several regression models, one for each orthogonal rotation to assess the statistical significance of the corresponding first pivot coordinate, is actually not noticeable in practical settings using statistical software which automates such calculations.
Alternatively, the practitioner may prefer to define tailored ilr-coordinates generally through SBP as described in section 2.1.2 for a more specific analysis, focusing on (and e.g. test statistical significance of) particular log-ratios of interest based on domain-specific knowledge or on a data-driven procedure.27,28 For example, if the parts of the composition can be meaningfully partitioned into two or more subsets, then it may be sensible to focus on balances between them. In the physical activity context, one might wish to consider moderate and vigorous physical activity (MPA and VPA, respectively) together by amalgamating them in relation to the subcomposition of all other activity types. In practice, VPA is absent from a large number of people’s daily routines to an extent that makes imputation of time to this category unreliable, and the pragmatic decision in the area is often to combine time in any of these behaviours into MVPA. Notably, amalgamation of compositional parts is fully relevant within the log-ratio framework when it is done beforehand.23,25
Compositional data analysis based on ilr-coordinates has become in recent years the most popular choice in varied scientific areas. As a particular case, the characteristics of pivot ilr-coordinates have been important in our view to successfully introduce and popularise compositional analysis in physical activity research.10,20,29,30 Hence, we deemed it preferable to elaborate the following within this framework for consistency with other studies and mainstream methodological literature.
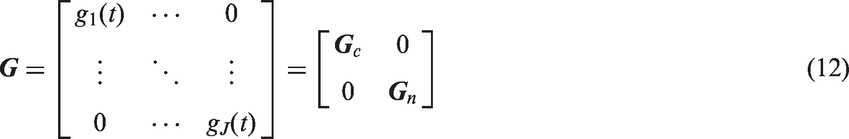
2.2 Cox model using log-ratio coordinates
As the ilr-coordinates zi,


If the ilr-coordinates chosen are rotated using the rotation matrix

Model selection for Cox regression is typically conducted using a modified Akaike Information Criterion (AIC) which replaces the likelihood in the standard expression with the partial likelihood above (or some approximation thereof). Again, once the composition has been mapped into real space expressed through ilr-coordinates, there are no obstacles to continue using standard model selection and validation tools.
2.3 Hypothesis testing
When fitting a Cox regression model, it is important to assess the appropriateness of the underlying proportional hazards assumption. Standard statistical tests of this assumption, such as the test of Harrel and Lee, 33 remain appropriate, however a new complication arises. These tests, and also graphical methods such as observed vs. predicted survivor curves and estimated log-log survival curves, 34 are applied to individual explanatory variables, and this clashes with the essentially inseparable multivariate nature of compositional variables. For this reason, it is appropriate to consider the validity of the proportional hazard assumption with respect to the whole composition by adapting global tests such as Grambsch and Therneau’s non-proportionality test statistic based on Schoenfeld residuals. 35
The Grambsch-Therneau test statistic is defined with reference to a specific hypotheses of time dependence, where a regression coefficient


The time dependence is defined for all J covariates, and can be expressed as a diagonal matrix
The test statistic can now be calculated as a sum over the distinct times of the K events

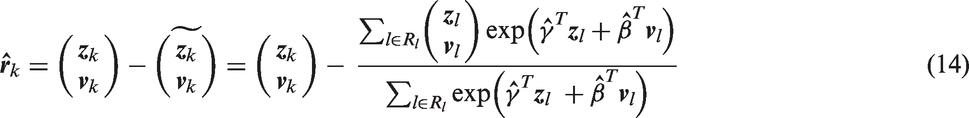
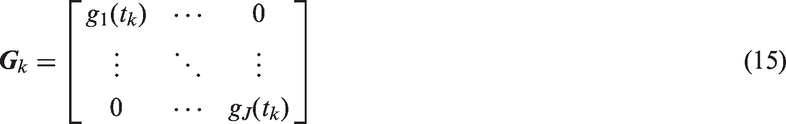

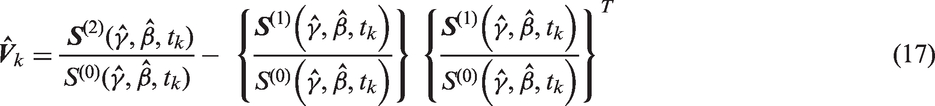


This test statistic is defined for the complete set of explanatory variables, but it can be applied separately to a subset of them. Thus, we adapt it to deal with the compositional variables only. Importantly, it can be checked that this test is invariant to rotations of the ilr-coordinates, provided the hypothesised time dependence is identical for each ilr-coordinate. That is


Moreover, we consider a test of the significance of the association between the hazard rate and the composition as a whole. The natural approach is to adapt the likelihood ratio test using the partial likelihood from equation (7) based on the statistic

3 Hazard ratios with compositional covariates
Hazard ratios are commonly used in the interpretation of the output from a fitted Cox regression model. To use them it is necessary to define a baseline set of explanatory variables
This presents a complication for compositional variables as zero-values for the ilr-coordinates (corresponding to equal allocations to each component in the raw compositional data) may not give a baseline that is meaningful in terms of a real-world problem. The most natural option would be a composition corresponding to the mean ilr-coordinates, which conveniently corresponds by isometry with the compositional centre in the raw compositional data set (rescaled appropriately). 11 However, the scientific question being investigated can also inform this choice.
Note that using equation (3), the exponential part in the hazard function
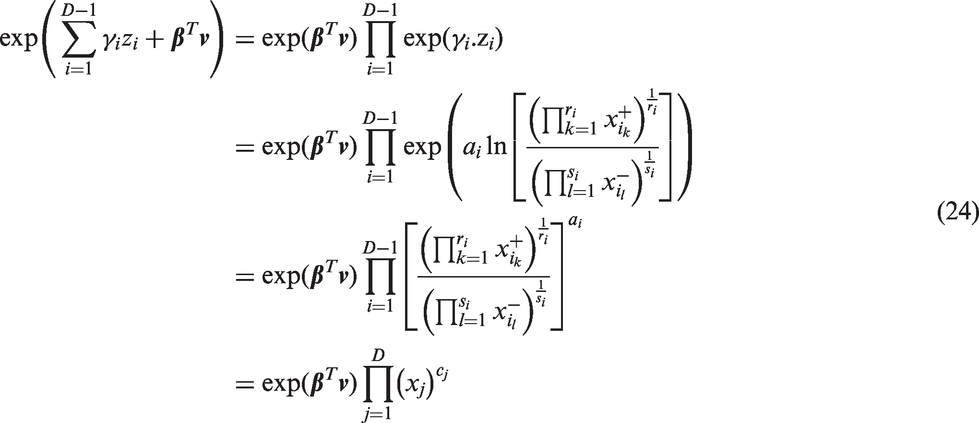

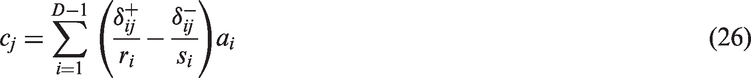
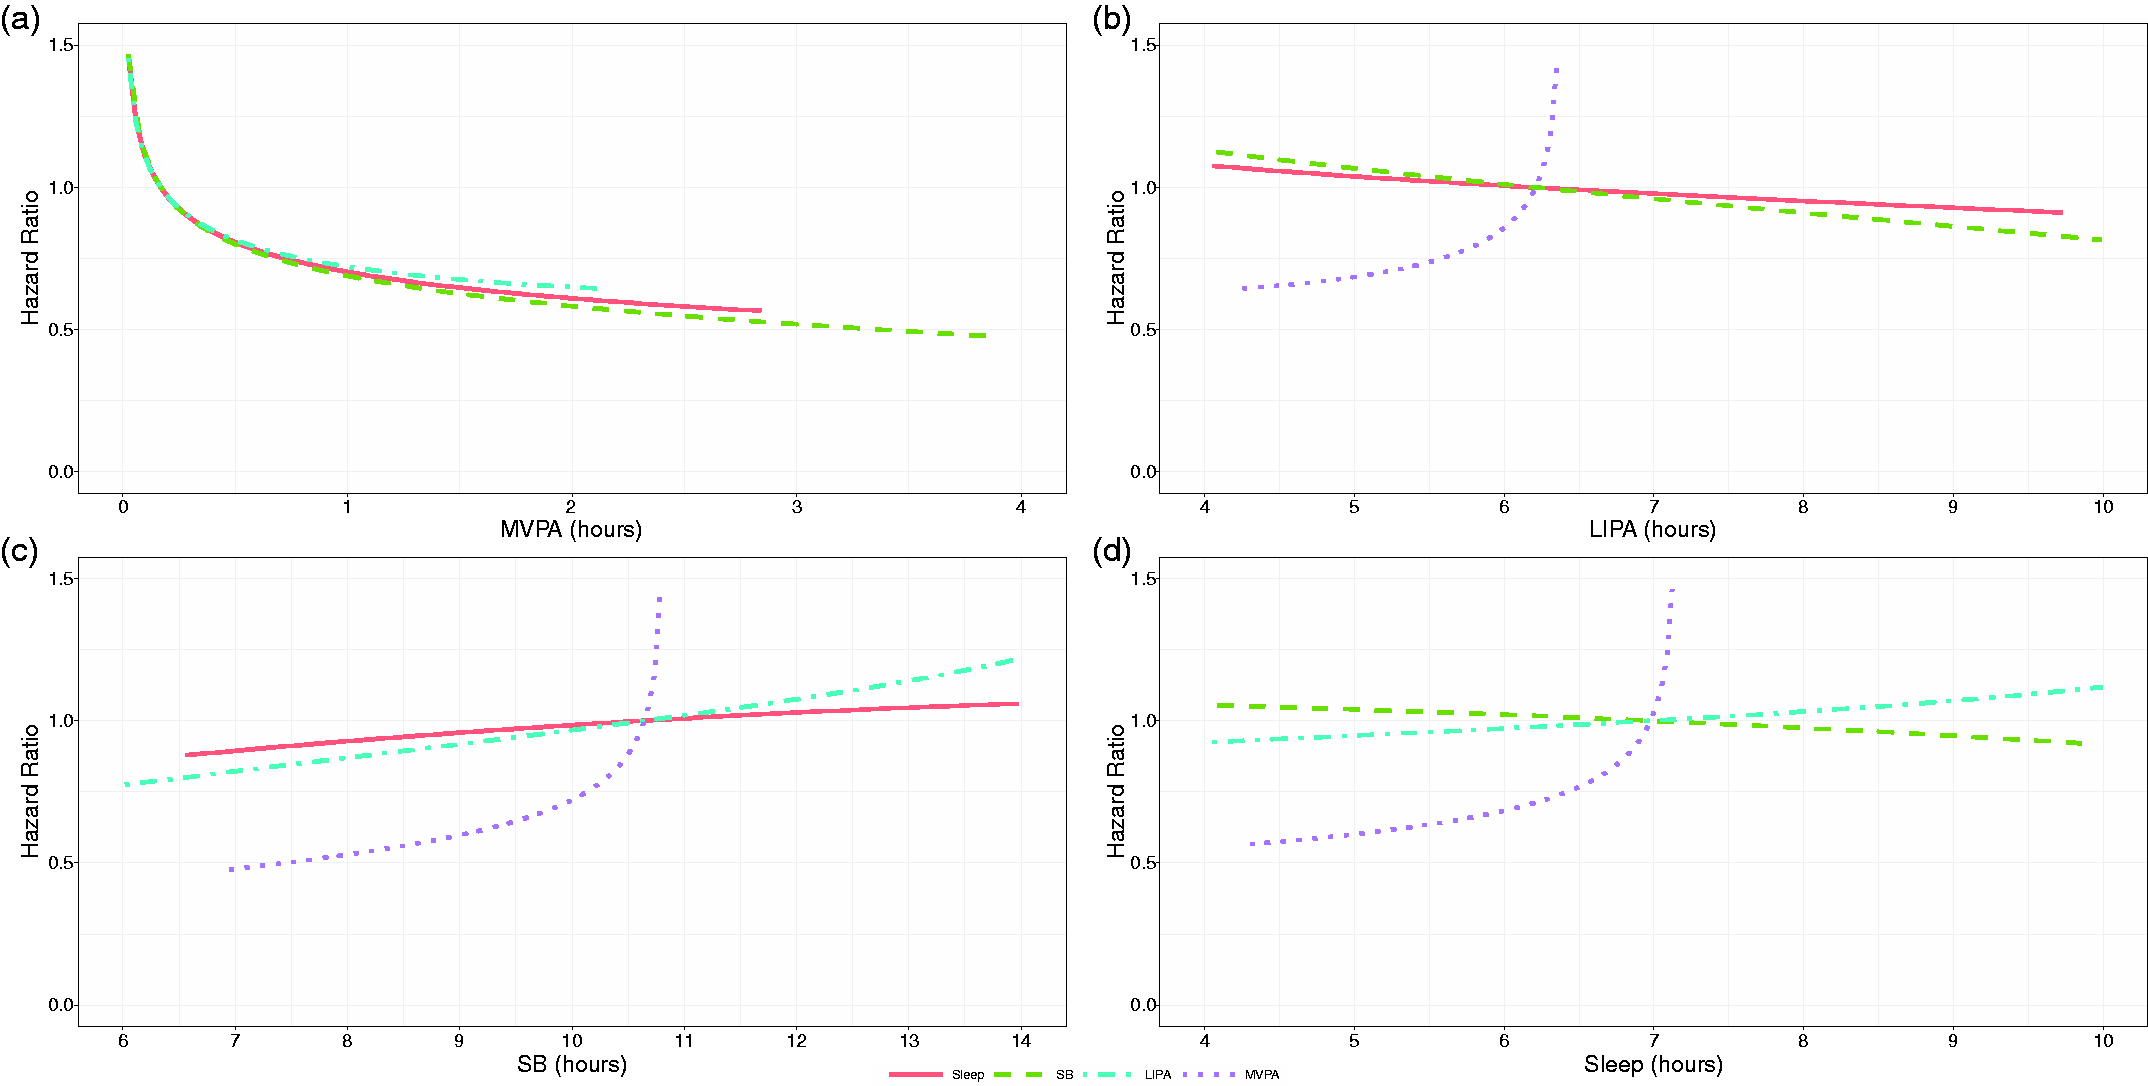
Essentially, the use of the Cox regression model in combination with an ilr representation of compositional covariates enables a simple expression for the hazard function in terms of the product of the components of the composition raised to indices determined by the fitted regression coefficients. When the objective of the analysis is to determine the association of the compositional variables with the survival outcome, then the expression for the hazard ratio (HR) between a composition
At first sight, the coefficients


This will remain constant if we consider only exchanges between two parts at a time (without loss of generality). It is therefore possible to produce two-dimensional graphs of the hazard ratio against
Finally, note that when working with compositional covariates it would be acceptable to centre their ilr-coordinates to use
4 Application to physical activity research: association between mortality and physical activity patterns from the NHANES survey
To illustrate the use of the compositional Cox regression model developed in the previous sections, we set out a case study from physical activity research using data from the NHANES 2005-06 database. NHANES is a bi-annual health survey conducted by the Centre for Disease Control on a representative sample of the population of the USA. The 2005-06 wave included an assessment of physical activity behaviour and sleep. Further details of the NHANES survey can be found on the Centre for Disease Control website. All analyses were conducted on the R system for statistical computing, 37 using the survival package 38 for the Cox regression fitting, the ggfortify package 39 to produce the Kaplan–Meier survival curves and the ggtern package 40 to create the ternary plots. This study involved analysis of publicly available secondary data only. The original study was approved by the ethics committee of the Centers for Disease Control and Prevention (CDC) and all participants gave informed consent. NHANES operates under the approval of the National Center for Health Statistics Research Ethics Review Board, Protocols #98-12, #2005-06, and #2011-17.
Here, we consider the link between all-cause mortality and the time-use composition of the day (after allowing for other relevant covariates). The time-use composition consisted of sleep (S), sedentary behaviour (SB), light intensity physical activity (LIPA) and moderate to vigorous physical activity (MVPA), hence a composition
After removing these individuals, there were 1196 records, including 114 deaths. The total exposure of the data was 82,165 person months. Five records had zero-valued MVPA. These zeroes were imputed using the log-ratio EM algorithm.
43
The resulting mean composition (computed as the vector of geometric mean times spent on each behaviour closed to 100%) was Kaplan–Meier survival curves for subset of NHANES 05-06 data stratified by gender and age tertile (+symbols indicate an observation ceasing on an individual rather than a death).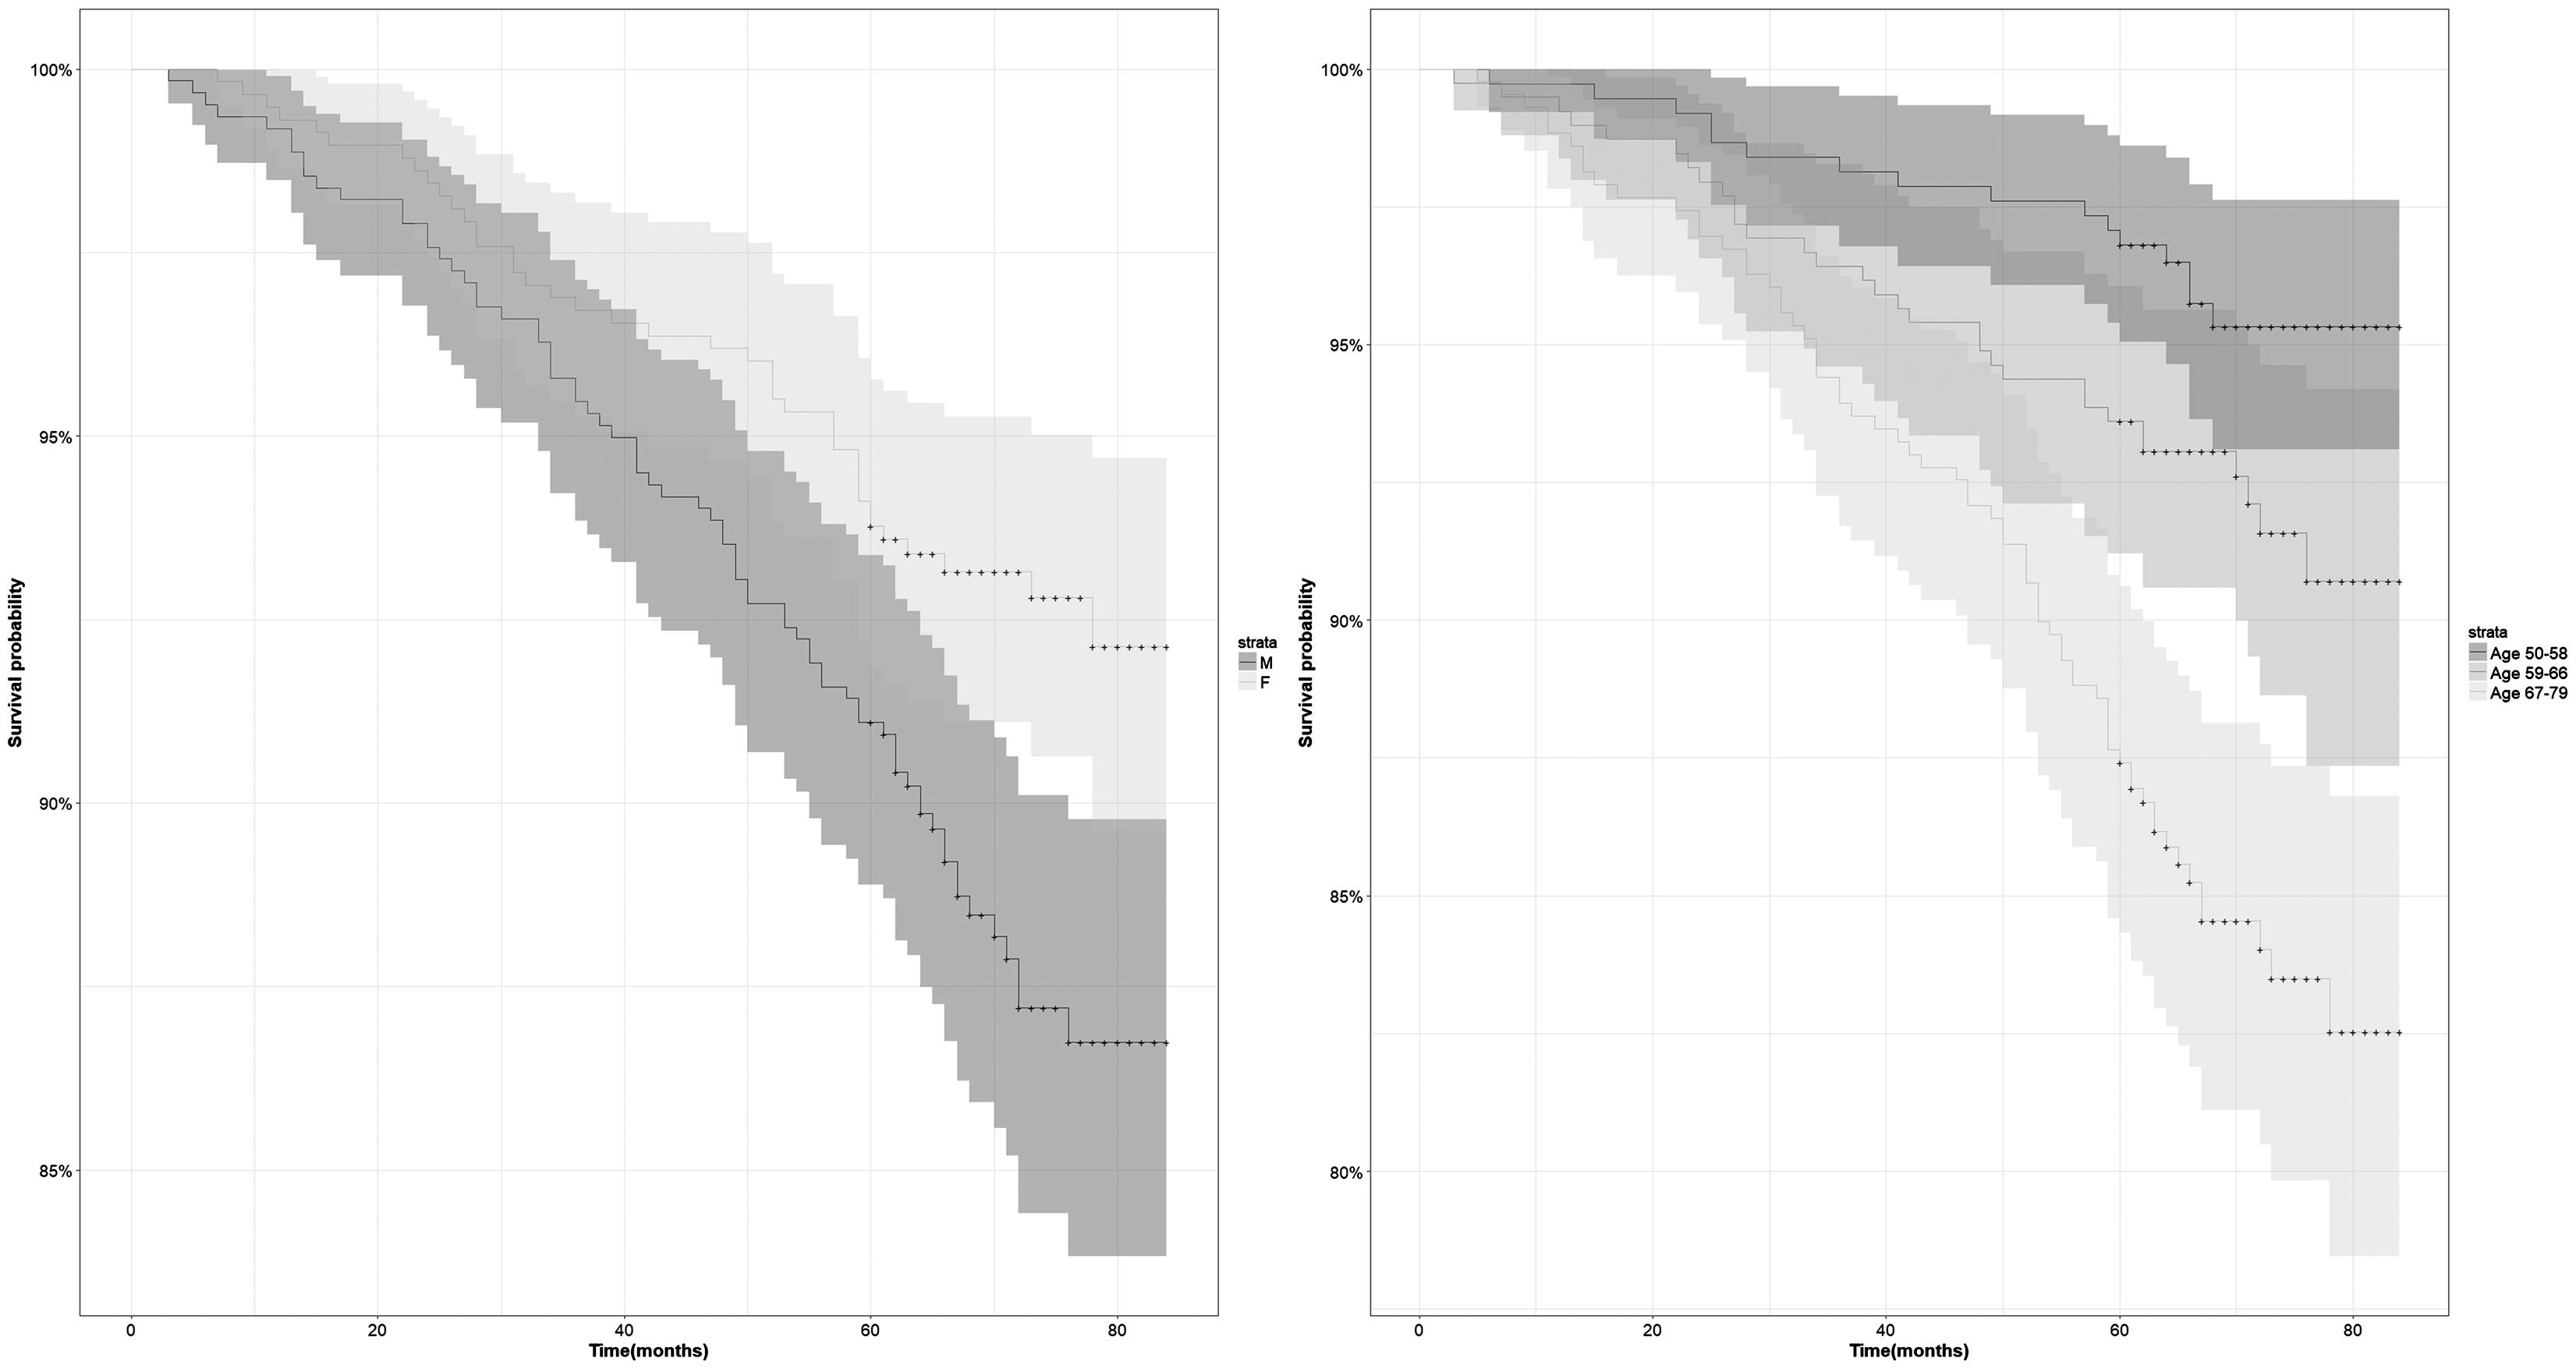
A set of three ilr-coordinates


These ilr-coordinates were then incorporated into the Cox model (6) to produce the following Model 1

The covariates in


Each one of these triplets isolated the relative importance of SB, LIPA, and MVPA against the other behaviours in the first ilr-coordinate, respectively. These ilr-coordinates can then be incorporated into equation (6) in the usual manner, giving rise to Model 2 in terms of

In the following, we seek to test the proportional hazards assumption underlying the model. The Gramsch-Therneau’s test (equation (13)) requires a hypothesised time dependence. We have used a scaling to time based on the Kaplan–Meier curve, set out in equations (9) to (11) (this is the default time dependence used in the survival package in R). Based on this hypothesis, we obtained a test p-value equal to 0.106, indicating no support for rejecting the proportional hazards assumption at the usual 5% significance level.
Cox regression coefficients and 95% confidence limits of ilr-coordinates under different model formulations.
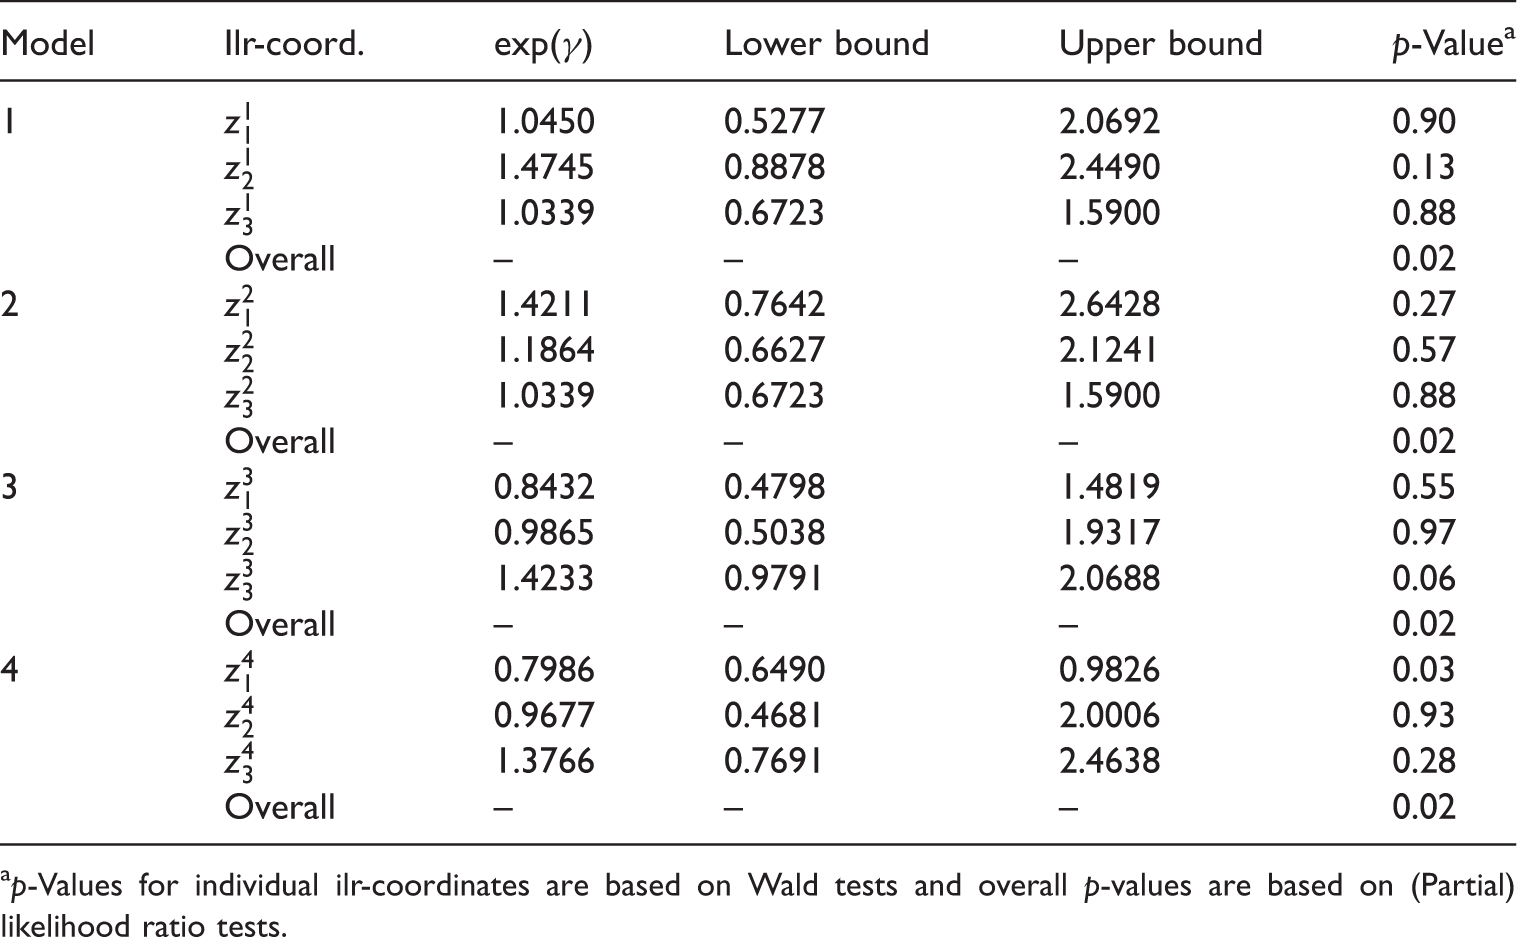
p-Values for individual ilr-coordinates are based on Wald tests and overall p-values are based on (Partial) likelihood ratio tests.
In respect of the individual terms, only the term
The second coordinate in model 4,
It might be also of interest to consider an alternative basis for the subcomposition (LIPA, SB, Sleep) by rotating the ilr-coordinates 
Recall that, due to the orthonormality of ilr-coordinates, the regression coefficient and p-value of the first coordinate
Finally, data-driven approaches can be also applied. For example, we could apply hierarchical clustering techniques, such as the Ward’s method, 44 to the clr transformed data in line with the approach in Palarea-Albaladejo et al. 45 and generate a hierarchical structure of proportionality relationships in the composition. It is then straightforward to construct a set of balances according to this. In our illustrative example, this approach leads to the same basis as shown in equation (38).
A key feature of Cox regression is the ability to express the survival probability relative to some baseline as a hazard ratio. Where the intention is to determine the association of mortality and the composition of physical activity, we would typically hold other covariates fixed, and so the hazard ratio becomes
The size and sign of these coefficients could naively be considered to give an indication of the strength of the association between mortality and each behaviour, and whether the behaviour is beneficial (negative coefficient) or detrimental (positive coefficient). However, it should be recalled that these parameters are constrained, and as noted in the previous section, it is not possible to alter a single component in isolation, meaning the individual values are not really meaningful. The values of these coefficients can be considered pairwise to some benefit. For example, we note
Rewriting this equation as
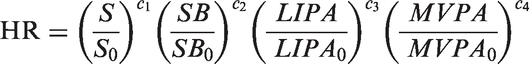
Heatmap of hazard ratios against different percentage allocations of physical activity time-use, with fixed (a) Sleep = 29.1%, (b) SB = 44.4%, (c) LIPA = 25.9%, and (d) MVPA = 0.7%. The blue point indicates the reference (geometric) mean composition. Hazard ratios under isotemporal substitution, reallocating time between (a) MVPA, (b) LIPA, (c) SB or (d) Sleep, and the component indicated in the legend, whilst holding the remaining components fixed) with respect to (geometric) mean composition.
The choice of reference composition is the practitioner’s decision. Defaulting to ilr-coordinates equal to zero (i.e. an even distribution of time across all four components) would be unrealistic (e.g. it would mean considering 25% MVPA = 6 h/day). Using zero activity as reference composition would not be feasible as that would not actually define a composition and log-ratios cannot be computed. We instead used the geometric mean physical activity composition as a sensible reference. However, note that any other could be used. For example, one representing an individual complying with some set of national guidelines on physical activity.
We used a ternary heatmap to represent the outcome of our model. As it is a four-part composition but only three can be represented in a ternary plot, we plotted the hazard ratio (relative to the average composition baseline) against the four possible subcompositions. In Figure 2(a), we omit Sleep and illustrate the hazard ratio against the subcomposition (SB, LIPA, MVPA) whilst holding Sleep fixed. In Figure 2(b), we hold SB fixed and consider the hazard ratio against (Sleep, LIPA, MVPA). In Figure 2(c) we hold LIPA fixed and consider the hazard ratio against (Sleep, SB, MVPA). In Figure 2(d) we hold MVPA fixed and consider the hazard ratio against (Sleep, SB, LIPA). For a given model, the allocation of time to a fixed component does not affect the relationship between hazard ratio and the subcomposition in accordance with the subcompositional coherence property of log-ratio analysis. However, if a different model is fitted based only on the subcomposition, there will be small differences in the hazard ratio as information from one part is not available. The blue point indicates the reference composition in each ternary plot.
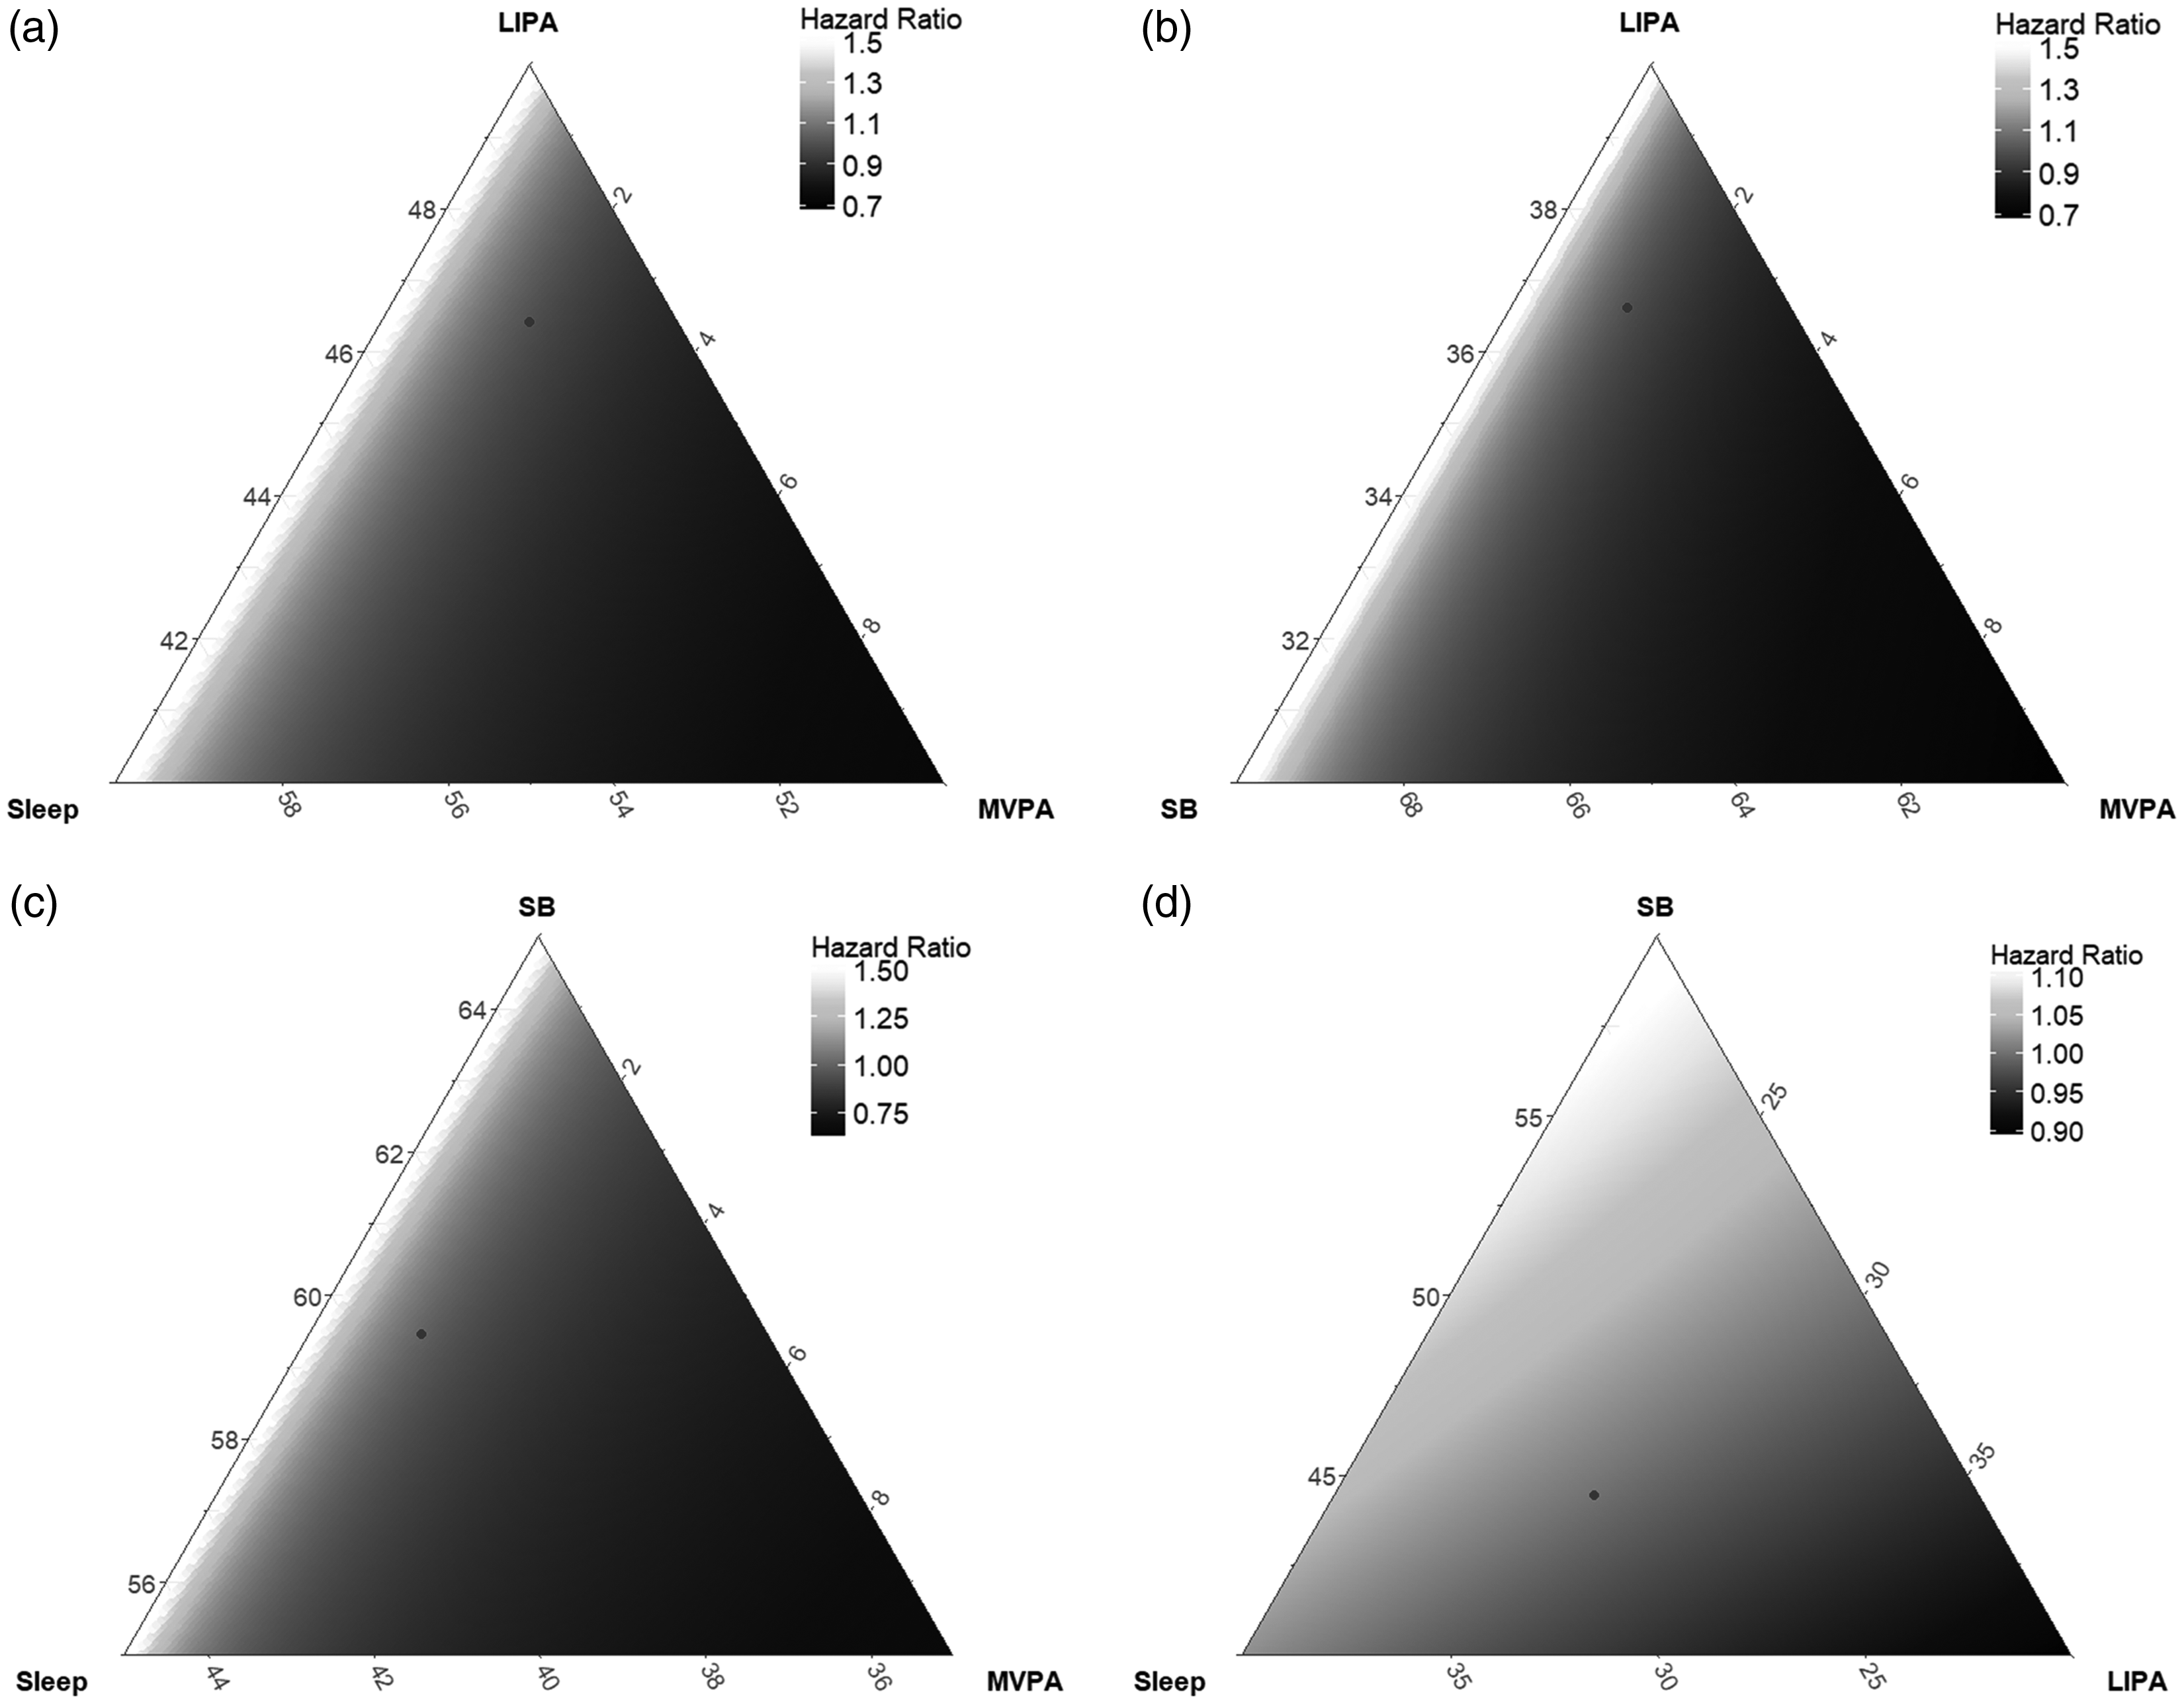
Alternatively, the impact of reallocations between two particular behaviours can be illustrated graphically in a manner similar to the isotemporal substitution analysis commonly used in physical activity research. 46 Figure 3(a) shows the hazard ratio against the time allocated to MVPA assuming the only permitted compositions are fixed amounts of time reallocated between MVPA and another component of the composition. For example, the green line indicates the effect of reallocating time between MVPA and SB, holding Sleep and LIPA fixed at the compositional average. Similarly, Figure 3(b) shows the hazard ratio against time allocated to LIPA, Figure 3(c) shows the hazard ratio against time allocated to SB, and Figure 3(d) shows the hazard ratio against time allocated to Sleep. In each case, time is reallocated between the component displayed on the x-axis and the component indicated by the colour of the line. Figure 3(a) clearly illustrates that reallocating time to MVPA from the other three behaviours is associated with lower mortality but that the beneficial association weakens as MVPA increases. Figure 3(b) confirms that reallocating time from MVPA to LIPA increases the mortality rate, but reallocating time from Sleep or SB to LIPA is associated with lower mortality; however, the association is less strong than for MVPA. Figure 3(c) and 3(d) can be read in the same manner. It is worth remarking that the time allocated to each behaviour is constrained to be positive, hence one cannot reallocate time between two behaviours without limit, and where a line stops mid-graph this indicates the replaced behaviour has reached zero.
4.1 Mortality and balance between active and non-active behaviours
As noted in section 2.1.3, the parts of the composition can be meaningfully partitioned into two or more subsets of practical relevance. For example, we can define an ilr-representation 
The Cox regression model was fitted to these ilr-coordinates as in the previous section, and we focused on the change in the hazard function associated with an increase of 1 unit in the first coordinate through exp(
5 Discussion
In this work we have shown how to extend survival data analysis based on the Cox regression model to deal with compositional covariables using the log-ratio methodology. It is well established that fitting raw compositional variables in ordinary regression analysis introduces both technical and interpretability issues due to their failure to account for their specific nature induced by scale invariance. Compositional data analysis is being increasingly and successfully used in cross-sectional studies; however, to date it has not been introduced in survival data analysis to the best of our knowledge.
Survival analysis based on compositional data has been applied in the past that do not adopt this log-ratio methodology; however, inadequacies in the conventional approach as stressed above can lead to misleading estimates, as some of the effects attributed to a component (in the absolute sense) will in fact arise from the displacement of other components, and this may give qualitative conclusions that are misleading as well, particularly for smaller marginal effects, such as the associations between mortality and levels of light intensity physical activity.
The resolution of the formal issues around compositional data analysis requires some changes in how the results are interpreted which can be initially perceived as less intuitive and more challenging, as it deviates from the usual variable-by-variable analysis. In our context of application, the use of log-ratio coordinates prompts the discussion in terms of changes in behaviours which are always relative to each other. This in fact aligns with the intuitive idea that changes in time devoted to an activity are necessarily linked to changes in opposite direction in some other activity or activities, and this exchange may have implications to mortality risk as investigated here. As stressed above, the choice of specific log-ratio coordinates can be guided by practical and scientific considerations of the domain of application, so that they are tailored to investigate the most relevant research questions in each case. This will facilitate the communication of conclusions in a way which is meaningful for the target audience. The relative merits of alternative log-ratio representations are an open topic of debate and are out of the scope of this work. In this work, we advocated for the use of isometric log-ratios and balances for the reasons discussed in section 2.1. However, it is important to remark that the differences are only in how the information in the composition is represented using log-ratios. Thus, overall estimates, test statistics, performance measures or predictions, including the coefficient of determination, from the Cox regression model will be the same. When working with large compositions, it may also be beneficial to consider the elimination of individual log-ratio coordinates through, e.g., via the modified AIC or similar, once the association with the composition has been established to identify its key drivers. As noted previously, models excluding some log-ratio coordinates are perfectly valid. Carried out in tandem with rotation of coordinates, this can bring significant simplifications of the final model, and make clearer which of the internal dynamics of the composition are driving the outcome.
Finally, note that working with log-ratios means that zero values in the data set are problematic. In most real-world situations, these values are related to under-reporting, existence of technical detection limits or rounding-off errors. A number of compositional statistical methods have been proposed to deal with different forms of irregular data, including zeros, censored and missing data, in a sound way as part of the data pre-processing stage.43,49–51 Alternatively, in some cases a meaningful amalgamation of parts into a smaller composition can be a sensible pragmatic choice to address the problem in a real-world setting.
Supplemental Material
Supplemental material for Cox regression survival analysis with compositional covariates: Application to modelling mortality risk from 24-h physical activity patterns
Supplemental Material for Cox regression survival analysis with compositional covariates: Application to modelling mortality risk from 24-h physical activity patterns by DE McGregor, J Palarea-Albaladejo, PM Dall, K Hron and SFM Chastin in Statistical Methods in Medical Research
Footnotes
Acknowledgements
The results of the present study are presented clearly, honestly, and without fabrication, falsification, or inappropriate data manipulation. The work was conducted at Glasgow Caledonian University and Biomathematics and Statistics Scotland. All persons designated as authors qualify for authorship, and all those who qualify for authorship are listed.
Declaration of conflicting interests
The author(s) declared no potential conflicts of interest with respect to the research, authorship, and/or publication of this article.
Funding
The author(s) disclosed receipt of the following financial support for the research, authorship, and/or publication of this article: DM and JP-A have been supported by the Scottish Government’s Rural and Environment Science and Analytical Services Division (RESAS). JP-A has also been supported by the Spanish Ministry of Economy and Competitiveness under the project CODA-RETOS MTM2015-65016-C2-1(2)-R. KH has been supported by a research grant by the Czech Science Foundation under reg. no. 18-09188S and the grant COST Action CRoNoS IC1408.
Supplemental Material
Supplemental material for this article is available online.
Note
References
Supplementary Material
Please find the following supplemental material available below.
For Open Access articles published under a Creative Commons License, all supplemental material carries the same license as the article it is associated with.
For non-Open Access articles published, all supplemental material carries a non-exclusive license, and permission requests for re-use of supplemental material or any part of supplemental material shall be sent directly to the copyright owner as specified in the copyright notice associated with the article.