
Abstract
Net survival is used in epidemiological studies to assess excess mortality due to a given disease when causes of death are unreliable. By correcting for the general population mortality, it allows comparisons between regions or periods and thus evaluation of health policies. The Pohar-Perme non-parametric estimator of net survival has been recently proposed, soon followed by an appropriate log-rank-type test. However, log-rank tests are known to be under-optimal in non-proportional settings (e.g. crossing of the hazard functions). In classical survival analysis, one solution is to compare the restricted mean survival times. A difference in restricted mean survival time represents a life benefit or loss over the studied period. In the present article the restricted mean net survival time was used to derive a specific test statistic to compare net survivals in proportional and non-proportional hazards settings. The new test was generalized to more than two groups and to stratified analysis. The test performance was assessed on simulation study, compared to the log-rank-type test, and its use illustrated on a population-based colorectal cancer registry. The new test for net survival comparisons proved robust to non-proportionality and well-performing in proportional hazards situations. Furthermore, it is also suited to the classical survival framework.
Keywords
1 Introduction
Cancer registries collect population-based data that are critical for evaluating and improving the quality of cancer care. In the analysis of registry data, one key indicator is survival; it provides useful information on cancer control at the scale of a whole healthcare system. As cancer patients can die from other causes than cancer itself –which is becoming increasingly frequent due to progress in therapy– several approaches have been proposed to adjust survival data for competing causes of death. This led to the concept of net survival, the survival that would be observed if only deaths from cancer were considered.
1
However, in cancer registries, the exact cause of death is often unavailable or unreliable; thus, particular methods have been developed to estimate cancer net survival.
2
These methods rely on the assumption that, at an individual level, the observed instantaneous hazard of death (
Due to its intrinsic properties, net survival allows comparisons of cancer burden between subpopulations of patients or between periods while correcting for differences in baseline population mortalities. In 2012, Pohar-Perme et al. 3 proposed a non-parametric and consistent estimator of net survival. Its use has been advocated to estimate net survival in large-scale studies with significant non-homogeneity in population hazards of death resulting, for instance, from different age structures [see literature4–6]. More recently, Grafféo et al. 7 introduced a specific log-rank-type test to compare two or more net survival distributions, with a stratification version to control for categorical covariates having different distributions in the groups to be compared and are known to affect the survival. This test is currently implemented using relsurv R package for relative survival analysis. 8 However, it is known that though the usual log-rank test is optimal under the assumption of proportional hazards (PH), its power is poor when this assumption does not hold. 9 Indeed, by construction of the log-rank statistic, early positive differences between groups can be negated by later negative differences, leading to a non-significant result. The same limitation is expected with the test adapted to net survival by Grafféo et al., 7 even as non-proportional effects of some covariates have been uncovered in population-based cancer studies [see e.g. Giorgi et al. 10 and Remontet et al. 11 ]. Several statistics have then been proposed as alternatives to the usual log-rank test for such a setting in the field of classical survival [see literature9,12–14 for examples]. However, their direct implementation in the field of net survival is not straightforward because registries do not have, usually, the distribution of the times to deaths specifically due to a given cancer. To face this problem, the concept of restricted mean survival time (RMST; i.e. the average life expectancy over a given period) seems much more appealing because: (i) the RMST can be directly obtained from the time-survival curve by integration; (ii) RMST-based tests have been already proposed to compare survival distributions and found robust in non-PH settings;15,16 (iii) in net survival, the restricted mean net-survival time (RMNST) and its meaningful complement, the restricted mean net time loss (RMNTL; i.e. life years lost due to cancer over a given period of time) are attractive measures at population level, which provide an excellent alternative to hazard ratio to compare net survival distributions in settings with non-proportional excess hazards.
The present article proposes a permutation test to compare distributions of net survival that is robust to non-proportionality of the excess hazards of death from cancer or another disease. This test is based on a statistic derived from the RMNST. In this article, Sections 2 and 3 present, respectively, the Pohar-Perme estimator of net survival and the RMNST, and discusses their interests and interpretations. Section 4 presents the absolute difference RMNST statistic (AD-RMNST) between two groups and introduces the AD-RMNST test based on permutations, the extension of the test to more than two groups, and its stratified version. Section 5 assesses the performance of the test through an extensive simulation study. Section 6 provides an application to colorectal cancer data. Section 7 is a brief discussion of the achievements and future developments of the newly proposed AD-RMNST permutation test.
2 Estimation of net survival
Consider registry data on n patients, with
Let
The cumulative excess hazard over time
3 The RMNST
In survival analysis, one parameter of interest is the mean survival time. It is defined as the mathematical expectation of
Extending these concepts to the net survival setting implies using
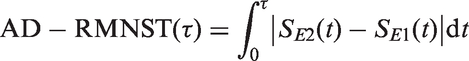
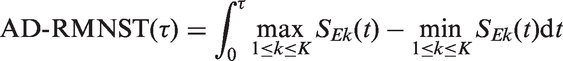
The reader should keep in mind that (a) Illustration of a net survival function of time with the respective restricted mean net survival time (RMNST, shaded area under the curve) and restricted mean net time loss (RMNTL, non-shaded area above the curve). (b) Net survival functions for two groups with the corresponding absolute-difference restricted mean net survival time (AD-RMNST, shaded area). (c) Net survival functions for three groups with the corresponding AD-RMNST (shaded area).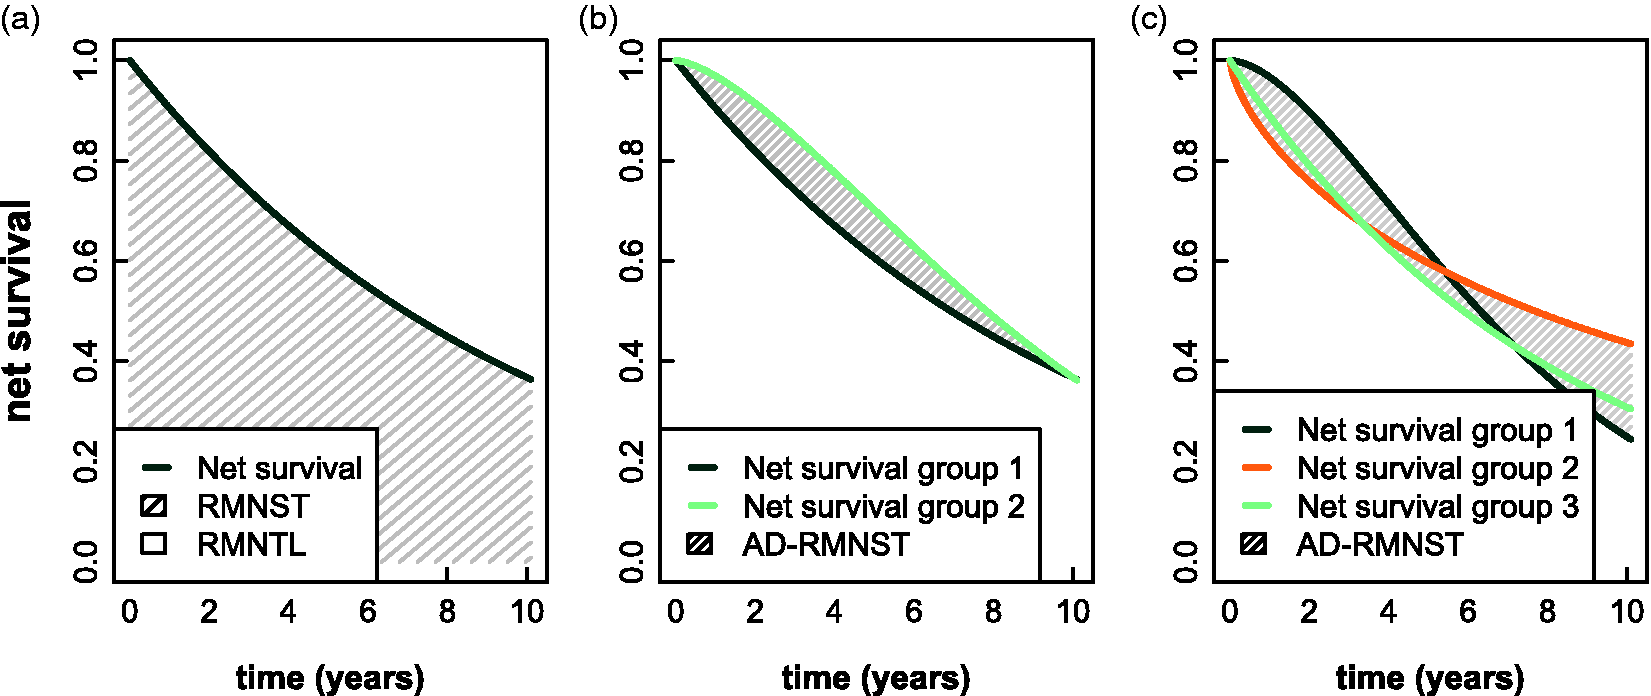
Eventually, when comparing the net survival between two groups, the difference in RMNSTs,
4 The absolute difference RMNST test
4.1 The absolute difference RMNST statistic
It goes without saying that this formulation conceals the epidemiological significance of the statistic in case of survival curve crossing. This significance is kept when there is no crossing, even when the underlying hazards are not proportional (which is the most frequent setting). On a time versus survival plot, the
This statistic may be extended to any number
Testing for the equality of all K net survival time distributions over a follow-up period limited to time τ amounts to testing for the following null hypothesis


4.2 A permutation test for the absolute difference RMNST statistic
Testing whether the calculated
Because, under the null hypothesis, group indices k are exchangeable (allegedly no group effect on survival), computing the
When B is the number of permutations, drawn at random (with replacement) among all possible permutations of group indices k,
4.3 Stratified version of the AD-RMNST permutation test
A stratified version of the AD-RMNST permutation test is proposed for adjusting for the effect of categorical covariates which present different distributions in the groups to be compared and which are known to affect the survival. A partition of the covariate space is defined by


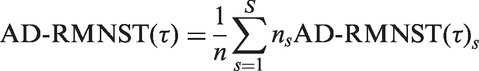
The stratified version of the statistic consists in a weighted sum over all strata of
Its distribution under the null hypothesis may be also approached by permutations, as in the non-stratified case, the only difference being that the permutations of group indices k are carried out within each stratum
The AD-RMNST permutation test and its stratified version are proposed to compare
5 Simulations
A simulation study was conducted to assess the performance of the proposed
5.1 Data generation and simulation design
For each patient i, a group covariate
Survival times were generated using a multivariable additive excess hazard model; this provided a consistent parametric estimator of net survival after adjustment on demographic covariates.
4
This model assumes that the instantaneous observed hazard
In each series of simulations, five scenarios were considered to assess the performance of the test. In each scenario, the set of parameters Simulation scenarios for the unstratified series: excess hazards for each group modelled using a flexible power-generalized Weibull function (upper panels), with the resulting net survival functions (lower panels).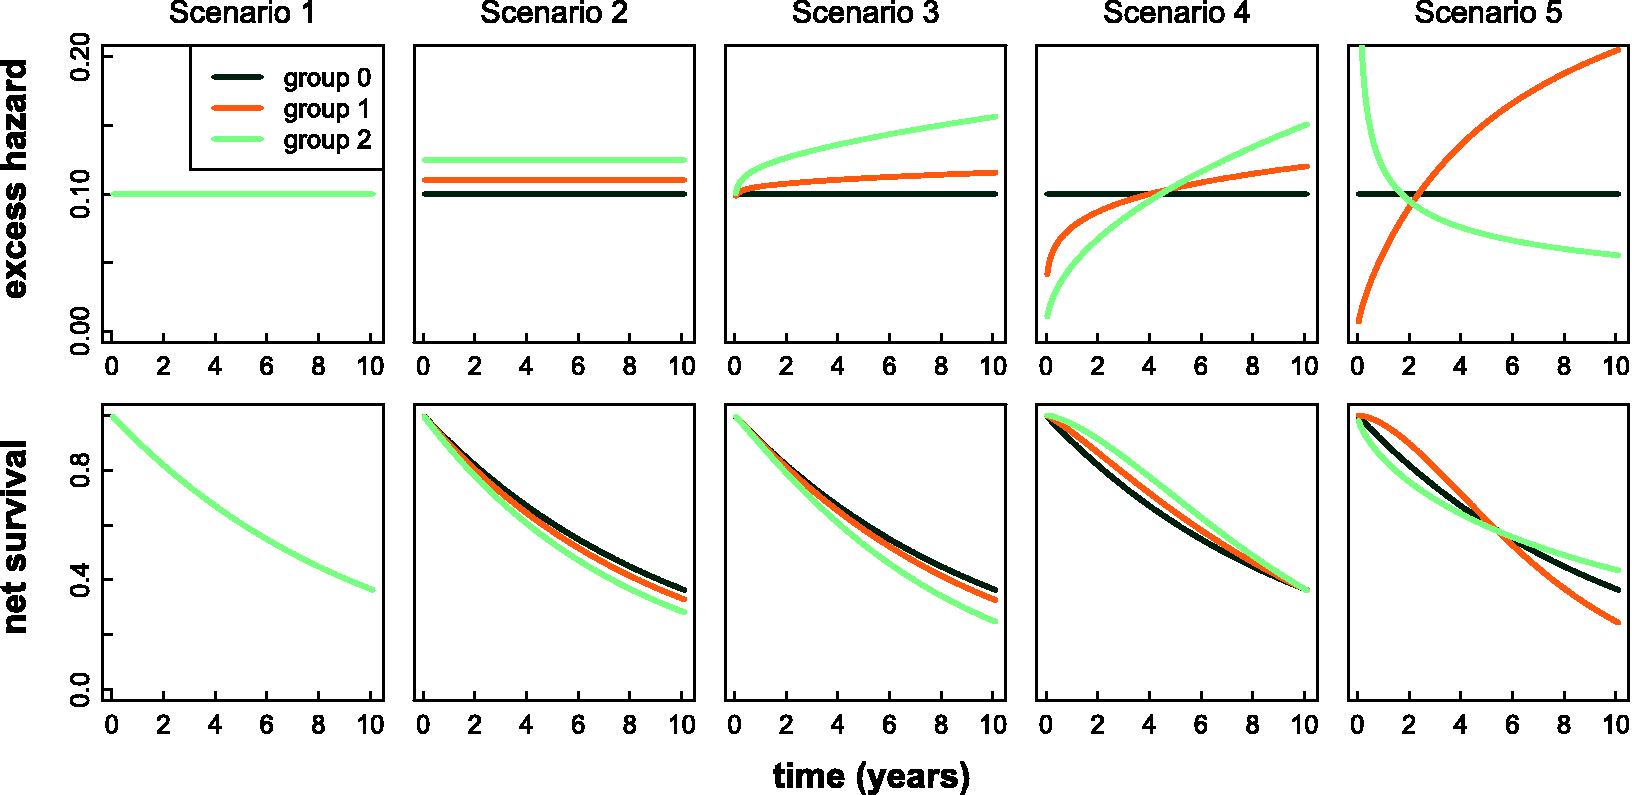
A censoring time
As in Grafféo et al.,
7
providing cancer is the only cause of death, an individual's hypothetical follow-up time would be
For each scenario, a simulation run consisted of 5000 datasets (2000 for the stratified simulations) of 1000 individuals generated independently. Permutation tests were based on B = 5000 permutation samples. This value was retained according to results obtained in an exploratory analysis based on independent datasets (not used later) that showed that the standard deviation of the p value of the permutations was around 0.005. In each scenario, the probability of rejecting the null hypothesis was defined as the proportion of simulations with a p value < 0.05 in the AD-RMNST permutation test, which corresponds to the type I error rate for Scenario 1 and to the test power for Scenarios 2 to 5. The same type I error rate and power were calculated for the log-rank-type test, as well as for the usual log-rank and AD-RMNST permutation tests applied to “hypothetical data”.
5.2 Results
Percentage (with 95% confidence interval) of rejection of the null hypothesis H0 by the AD-RMNST permutation test and the log-rank-type test applied to “observed data” with all five simulation scenarios, for a level of significance of 0.05.
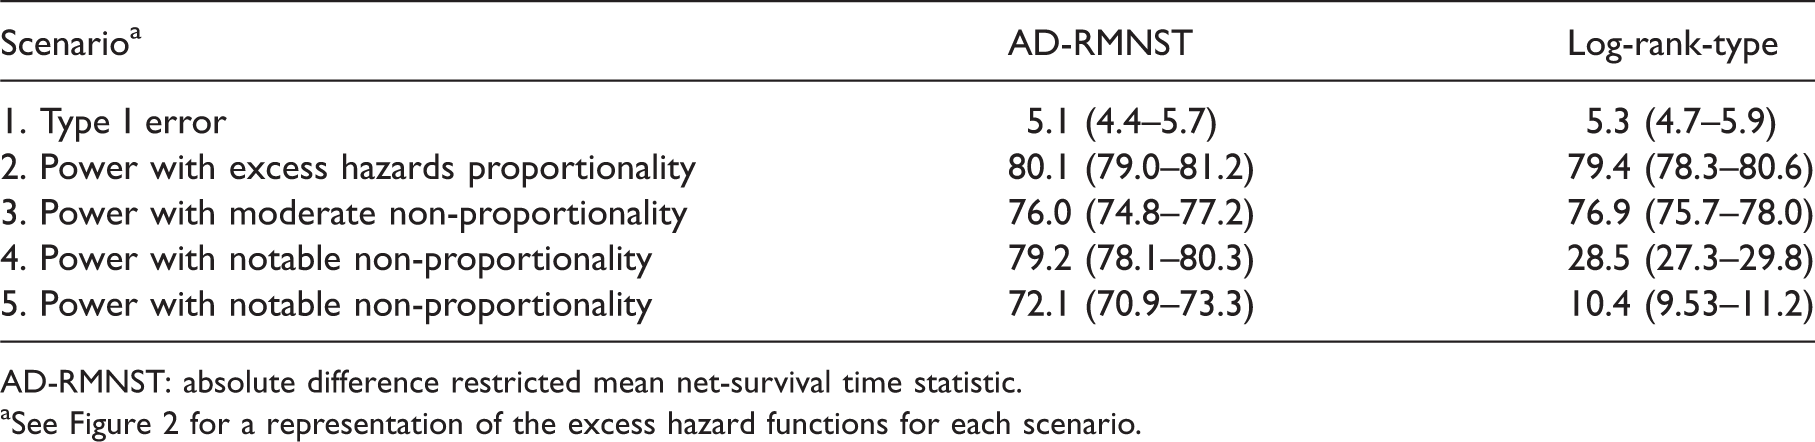
AD-RMNST: absolute difference restricted mean net-survival time statistic.
See Figure 2 for a representation of the excess hazard functions for each scenario.
In Scenario 2 (with proportional hazards), the AD-RMNST permutation test and the log-rank-type test showed similar powers: 80.1% versus 79.4%, with a
In Scenarios 3, 4, and 5, the power of the log-rank-type test decreased with the degree of non-proportionality, whereas the AD-RMNST permutation test kept a convincing discrimination power.
Percentage (with 95% confidence interval) of rejection of the null hypothesis H0 by the AD-RMNST permutation test and the log-rank test applied to “hypothetical data” and all five simulation scenarios, for a level of significance of 0.05.
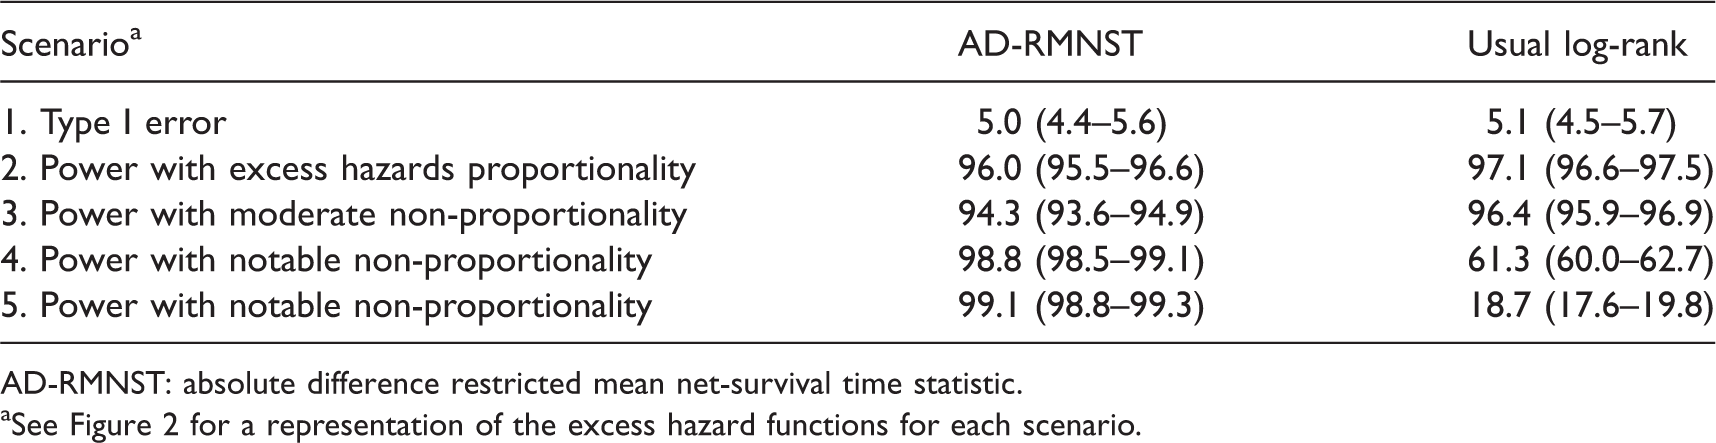
AD-RMNST: absolute difference restricted mean net-survival time statistic.
See Figure 2 for a representation of the excess hazard functions for each scenario.
Percentage (with 95% confidence interval) of rejection of the null hypothesis H0 by the stratified AD-RMNST permutation test compared to the unstratified AD-RMNST permutation test, applied to “observed data” and “hypothetical data” for all five stratified simulation scenarios, for a level of significance of 0.05.
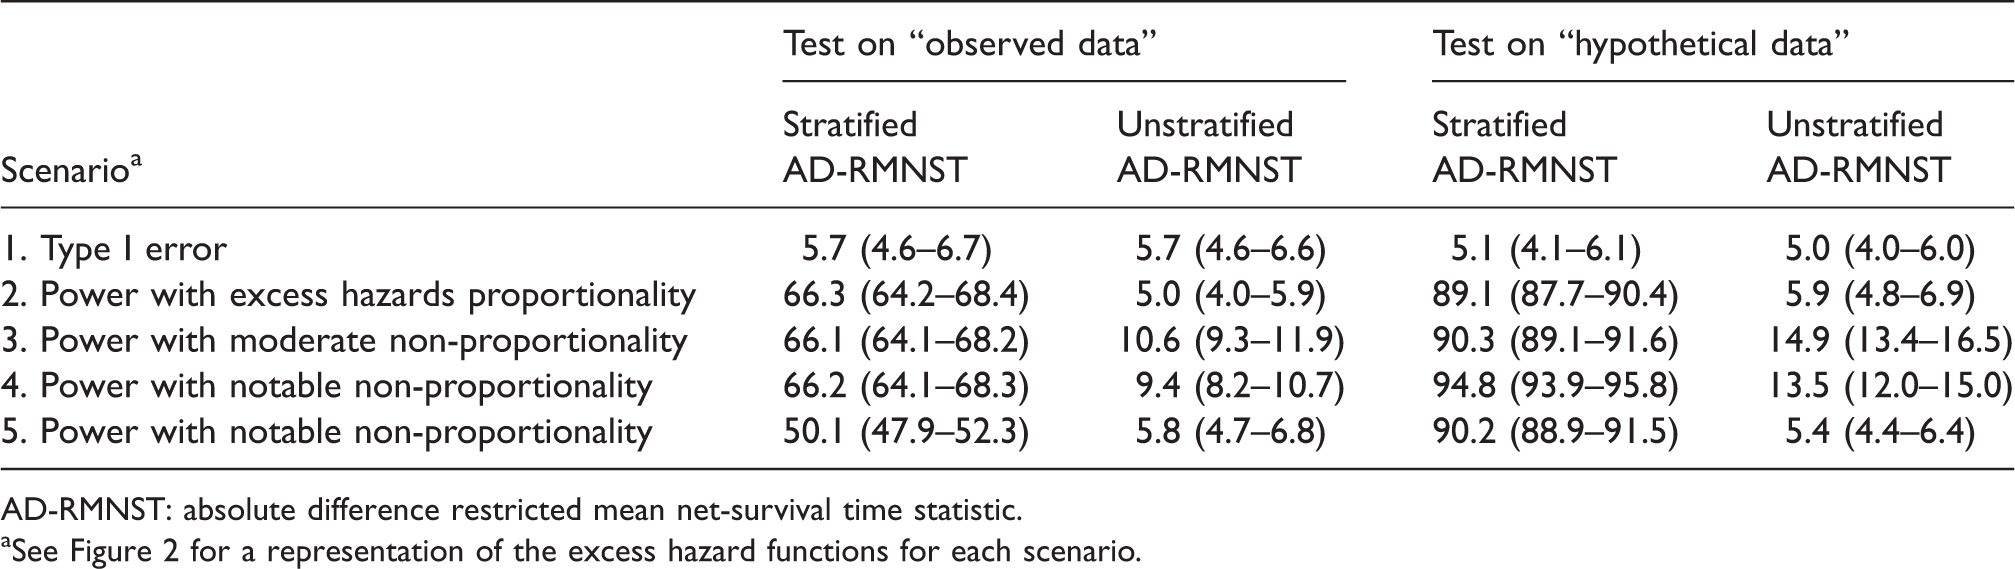
AD-RMNST: absolute difference restricted mean net-survival time statistic.
See Figure 2 for a representation of the excess hazard functions for each scenario.
6 Application
Distribution of the colon cancer prognostic factors, and p values of the differences in observed survival (usual log-rank) and in net survival distributions (log-rank-type test and AD-RMNST permutation test).
AD-RMNST: absolute difference restricted mean net-survival time statistic.
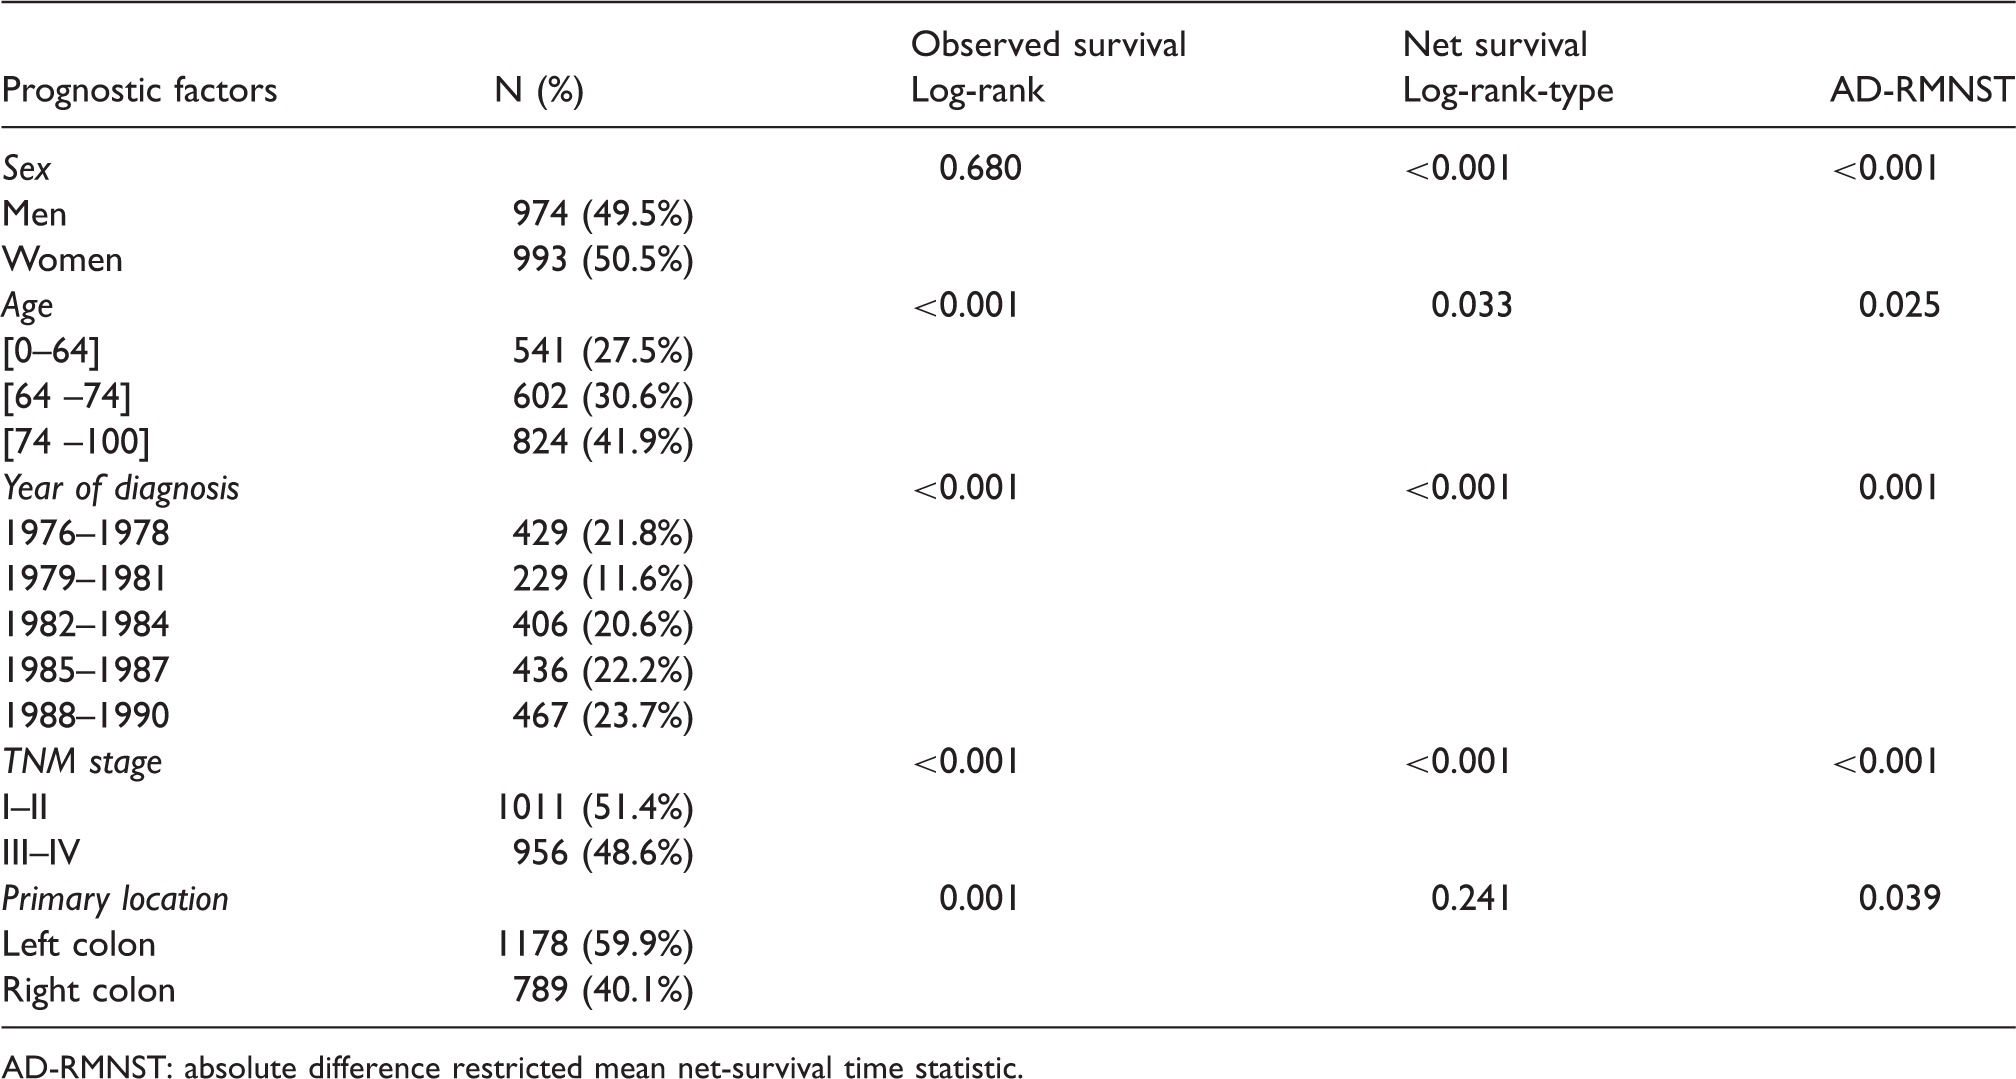
Age, year of diagnosis, and TNM stage at diagnosis had undisputable influence on observed survival and net survival to cancer over the first 10 years of follow-up: all tests detected significant differences between subgroups regarding these factors (Table 4). Sex did not seem to affect observed survival (log-rank p-value: 0.68) but survival to cancer (log-rank-type and AD-RMNST p values < 0.001): data not shown here indicated that women had poorer net survival to colorectal cancer than men despite lower mortality rates in the general population. This would explain the presence of differences detected by tests on net survival and the absence of differences in observed survival.
In this illustration, primary tumour location seemed to be a prognostic factor for observed survival (log-rank p value: <0.001), but whose influence on net survival was unclear: the result of log-rank-type test (non-significance) contradicted the result of the AD-RMNST permutation test. Figure 3(a) shows the survival of Burgundy registry patients according to tumour location. Patients diagnosed with left-sided colon cancer showed higher survival probabilities than patients diagnosed with right-sided cancer. A maximum difference of 10.8% between survival probabilities was seen at 1.3 year after diagnosis (63.3% versus 52.5%), this difference decreased afterwards to 4.8% at 10 years (the survival rates were then 26.8% and 22.0% for left- and right-sided locations, respectively). The RMST over the 10-year-period was of 4.4 years and 3.7 years for left- and right-colon cancer, respectively. In terms of RMTL, the group diagnosed with right-colon cancer lost on average 8 months more of life during the first decade after diagnosis.
(a) Observed survival of patients with left and right-sided colon tumours (Kaplan-Meier curves with 95% CI, p value of the log-rank test). (b) Net survival of patients with left and right-sided colon tumours (Pohar-Perme estimation with 95% CI, p values of the log-rank type and AD-RMNST permutation tests). AD-RMNST: absolute difference restricted mean net-survival time statistic.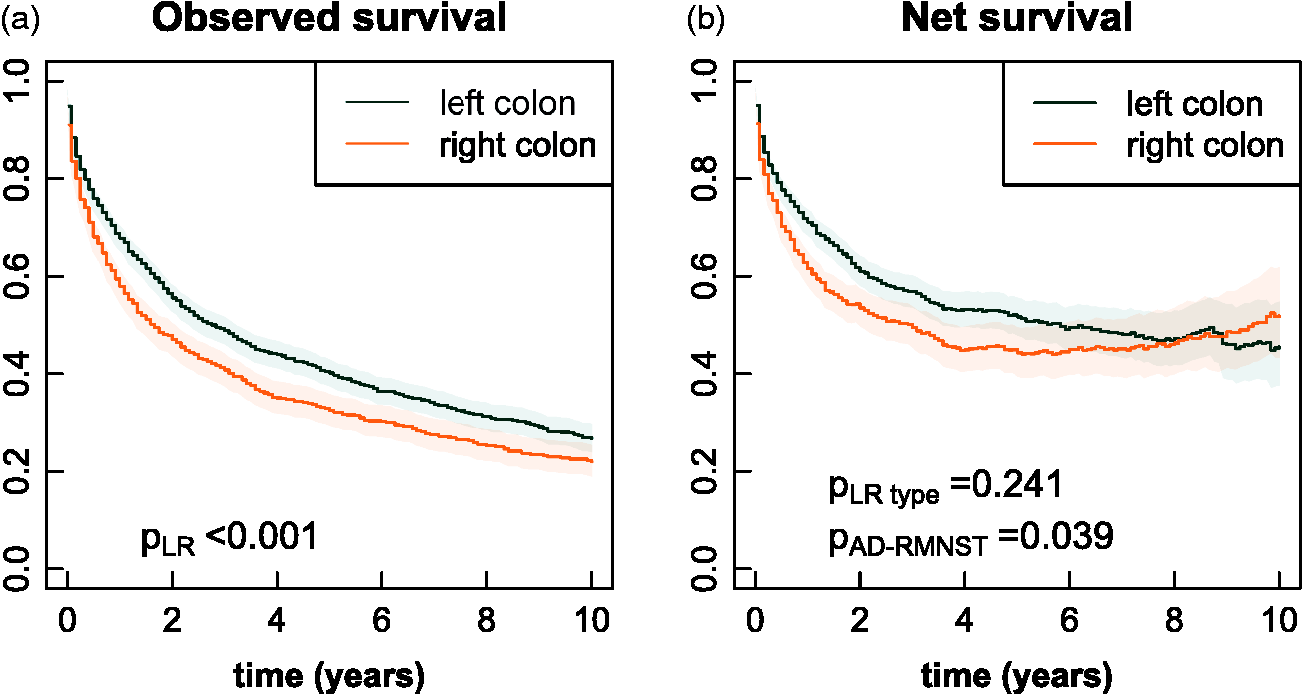
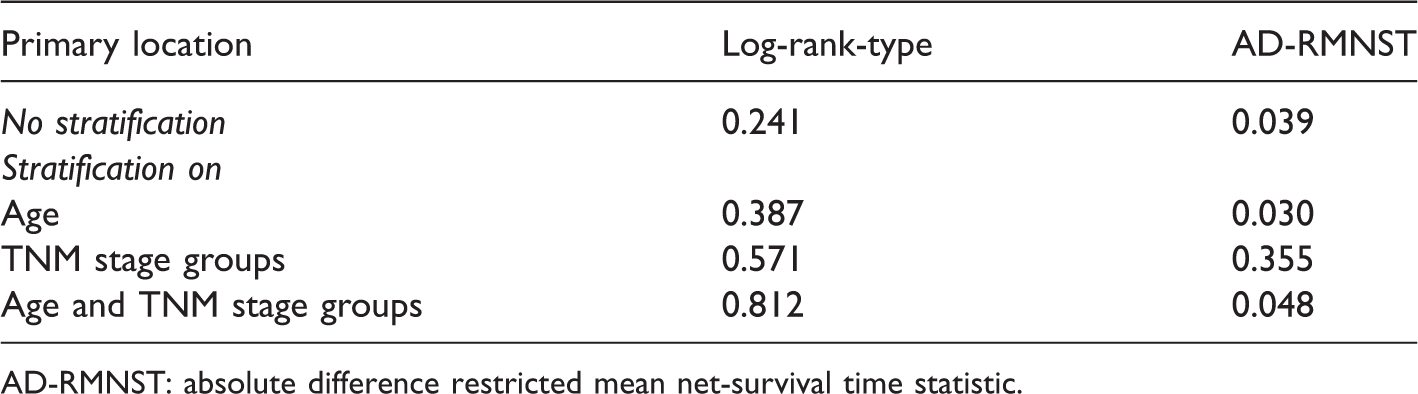
Figure 3(b) shows a similar difference regarding net survival: patients diagnosed with left-sided colorectal cancer had higher net survivals over the first 9 years of follow-up than those diagnosed with right-sided cancer (maximum difference of 10.5% at 16 months and net survivals of 66.8% versus 56.2%). An inversion occurred after 9 years: the survival to colorectal cancer at 10 years of patients with right-sided tumours was slightly higher (by 3.8%, although the confidence interval of the difference included 0). The RMNST over 10 years of follow-up was 5.5 and 5.0 years for left- and right-sided cancer, respectively. Incidentally, these observations indicate that the underlying excess hazards do not stay proportional over the 10-year-long period of follow-up. Therefore, the inability of the log-rank-type test to detect a significant difference in net survival (p value: 0.24) is not surprising. In contrast, the AD-RMNST permutation test concluded to a significant difference in net survival between left-sided and right-sided cancer patients (p value: 0.039).
p values for log-rank-type test and AD-RMNST permutation test comparing net survival to right- and left-sided colon cancer with and without stratification.
AD-RMNST: absolute difference restricted mean net-survival time statistic.
7 Discussion
The proposed new AD-RMNST permutation test is a statistical tool that allows net survival comparisons even in settings where the PH hypothesis does not hold. Up to now, the only means of non-parametric comparison was the log-rank-type test developed by Grafféo et al. 7 The present study shows that the log-rank-type test performs well under the PH assumption, keeps some power in case of moderate non-proportionality but is not suited for high non-proportionality settings. The new AD-RMNST permutation test uses the consistent non-parametric Pohar-Perme estimator of net survival and derives from the RMNST, an indicator that can be interpreted on a time scale. [For more details on these indicators, see literature21,22]. The proposed test statistic can be also used in the classical survival framework when an observed survival estimator is plugged in, e.g. the Kaplan-Meier estimator.
The AD-RMNST statistic corresponds to the geometric area between the lower and upper limits defined by the net survival curves; thus, it is not affected by the crossing-over of hazard functions. Furthermore, it can be extended to more than two groups and is suited to stratified analysis. The distribution under the null hypothesis of the AD-RMNST statistic is obtained by numerical permutations. A series of simulations designed to test the Type I error rate and the power showed good performances of the AD-RMNST permutation test in proportional as in non-proportional hazard settings: the new test was equivalent to the log-rank-type in the former settings and outperformed it in the latter. This is very interesting because alternatives to the log-rank test in non-proportional hazard settings perform commonly worse in settings of proportional hazards. Similar results were observed when the proposed test was used in the classical survival framework and compared with the usual log-rank test. Furthermore, the slight improvement in statistical power in comparison with the net survival framework can be explained by the use of the Kaplan-Meier estimator, which has a lower variance than the Pohar-Perme estimator. The stratified version of the AD-RMNST test statistic was also validated by simulation.
A practical application on data from a colorectal cancer registry illustrated the use of the AD-RMNST permutation test for net survival analysis. The new test detected differences in survival to cancer between patients with left- and right-sided colon tumours, while the difference was deemed non-significant by the log-rank-type test (due to the non-proportionality of the underlying excess hazards). Physiological evidence supports this difference [for example, see Ulivi et al. 23 ]. Firstly, these locations may be considered as two distinct neoplasms due to different embryologic origins, microenvironments, and blood supplies; therefore, treatment designed for left-sided tumours might be less effective on right-sided tumours. Secondly, symptoms appear with more advanced tumours in right-sided than in left-sided tumours, which compromises their prognosis.
Technically, the AD-RMNST permutation test has been implemented in R with parallel processing of the permutation process, which reduces the computation time down to a few minutes (2 Intel® Xeon® 2.10 GHz 8-cores CPU E5-2620 v4). The code is available (on demand) for net survival and classical survival comparisons with plug-in Pohar-Perme and Kaplan-Meier estimators, respectively.
Most net survival analyses on cancer data involve modelling. Flexible regression models may be used to obtain unbiased estimations of net survival. They allow non-proportionality of the excess hazards,4,10,11 and, as recently demonstrated, are also well-suited for comparisons. 24 The new non-parametric test is a simple and easy-to-use tool for preliminary analyses that requires no modelling strategy. In the same perspective, adapting other test statistics from the classical survival framework designed for non-proportional hazards settings, such as the Lin and Wang squared log-rank statistic 25 or PP-plot-based test, 26 is an ongoing work. It could also be of interest to detect the time-point at which the RMNST difference is the most significant. 27 Following this line, other options might be investigated to address the non-proportionality issue, as applying the same test at multiple time-points, and using a non-parametric combination (NPC) approach to obtain a single output statistic and p value. 28
Finally, another prospect of this work would be the derivation of the mathematical form of the distribution under the null hypothesis to propose a fully analytical non-parametric comparison test for both classical and net survival comparisons in any PH or non-PH setting.
Footnotes
Declaration of conflicting interests
The author(s) declared no potential conflicts of interest with respect to the research, authorship, and/or publication of this article.
Funding
The author(s) received no financial support for the research, authorship, and/or publication of this article.