
Abstract
Researchers increasingly use meta-analysis to synthesize the results of several studies in order to estimate a common effect. When the outcome variable is continuous, standard meta-analytic approaches assume that the primary studies report the sample mean and standard deviation of the outcome. However, when the outcome is skewed, authors sometimes summarize the data by reporting the sample median and one or both of (i) the minimum and maximum values and (ii) the first and third quartiles, but do not report the mean or standard deviation. To include these studies in meta-analysis, several methods have been developed to estimate the sample mean and standard deviation from the reported summary data. A major limitation of these widely used methods is that they assume that the outcome distribution is normal, which is unlikely to be tenable for studies reporting medians. We propose two novel approaches to estimate the sample mean and standard deviation when data are suspected to be non-normal. Our simulation results and empirical assessments show that the proposed methods often perform better than the existing methods when applied to non-normal data.
1 Introduction
Meta-analysis is a statistical approach for pooling data from related studies that is widely used to provide evidence for medical research. To pool studies in an aggregate data meta-analysis, each study must contribute an effect measure (e.g., the sample mean for one-group studies, the sample means for two-group studies) of the outcome and its variance. However, primary studies may differ in the effect measures reported. Although the sample mean is the usual effect measure reported for continuous outcomes, authors often report the sample median when data are skewed and may not report the mean. 1 This occurs commonly for time-based outcomes, such as time delays in the diagnosis and treatment of tuberculosis2,3 or colorectal cancer 4 or length of hospital stay.5–7 Other examples in medical research include muscle strength and mass, 8 molecular concentration levels, 9 tumor sizes, 10 motor impairment scores, 11 and intraoperative blood loss. 12 When primary studies report the sample median of an outcome, they typically report the sample size and one or both of (i) the sample minimum and maximum values and (ii) the first and third quartiles.
The same effect measure must be obtained from all primary studies in an aggregate data meta-analysis. In order to meta-analyze a collection of studies in which some report the sample mean and others report the sample median, Hozo et al., 13 Bland, 14 Wan et al., 15 Kwon and Reis, 16 and Luo et al. 17 have recently published methods to estimate the sample mean and standard deviation from studies that report medians. These methods have been widely used to meta-analyze the means for one-group studies and the raw or standardized difference of means for two-group studies. Reflecting how commonly these methods are used, Google Scholar listed 3315 articles citing Hozo et al. 13 and 866 articles citing Wan et al. 15 as of 23 October 2019.
Commonly used methods that have been proposed to estimate the sample mean and standard deviation in this context can be divided into formula-based methods and simulation-based methods. The methods developed by Luo et al. 17 and Wan et al. 15 are the best-performing formula-based methods for estimating the sample mean and standard deviation, respectively. A major limitation of these methods is that they assume the outcome variable is normally distributed, which may be unlikely because otherwise the authors would have reported the mean. Consequently, Kwon and Reis 16 recently proposed a simulation-based method which is based on different parametric assumptions of the outcome variable. Although the Kwon and Reis 16 sample mean estimator has not been compared to the formula-based method of Luo et al., 17 their proposed standard deviation estimator performed better than the formula-based method of Wan et al. 15 for skewed data when the assumed parametric family is correct. Limitations of this simulation-based method are that (i) it is computationally expensive, (ii) requires users to write their own distribution-specific code, and (iii) its performance can be highly sensitive to several conceptual and computational decisions that one must make when implementing the method (see section 5).
We propose two novel methods to estimate the sample mean and standard deviation for skewed data when the underlying distribution is unknown. The proposed methods overcome several limitations of the existing methods, and we demonstrate that the proposed approaches often perform better than the existing methods when applied to skewed data.
The objectives of this paper are to describe the existing and proposed methods for estimating the sample mean and standard deviation, systematically evaluate their performance in a simulation study, and empirically evaluate their performance on real-life data sets.
In section 2, we describe the existing and proposed methods. In section 3, we report the results of a simulation investigating the performance of the methods. We illustrate these methods on an example data set and evaluate their accuracy in section 4. In section 5, we summarize our findings and provide recommendations for data analysts.
2 Methods
Throughout this paper, we use the following notation for sample summary statistics: minimum value (
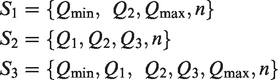
2.1 Comparator methods
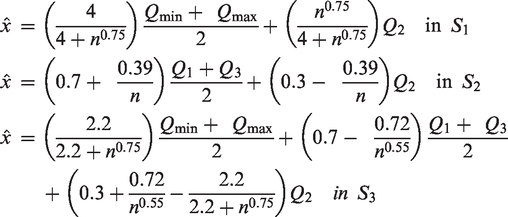
The sample mean estimator of Luo et al. 17 and the sample standard deviation estimator of Wan et al. 15 are formula-based methods that are derived from the assumption that the outcome variable is normally distributed.
Luo et al. developed the following sample mean estimators in scenarios
Building on the sample mean estimators of Hozo et al.,
13
Wan et al.,
15
and Bland
14
in
Wan et al.
15
proposed the following sample standard deviation estimators in scenarios
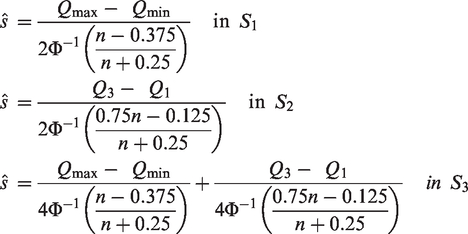
The standard deviation estimators of Wan et al. 15 are derived using relationships between the distribution standard deviation and the expected values of order statistics for normally distributed data. The expected values of the minimum and maximum values and first and third quartiles are estimated by the respective sample values. The expected value of other order statistics are estimated using Blom’s method. 18
Wan et al.
15
were the first to propose a standard deviation estimator in
For the purpose of the analyses presented herein, we refer to the approach which uses the method of Luo et al. to estimate the sample mean and the method of Wan et al. 15 to estimate the sample standard deviation as the Luo/Wan method.
2.2 Proposed methods
The sections 2.2.1 and 2.2.2 describe the proposed methods for estimating the sample mean and standard deviation from
2.2.1 Quantile estimation (QE) method
The QE method was originally introduced in McGrath et al.
20
for estimating the variance of the median when summary measures of
We pre-specify several candidate parametric families of distributions for the outcome variable, namely the normal, log-normal, gamma, beta, and Weibull. The parameters of each candidate distribution are estimated by minimizing the distance between the observed and distribution quantiles. Let
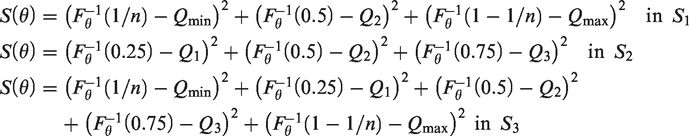
Details concerning the implementation of the optimization algorithm for minimizing
The distribution with the best fit (i.e., yielding the smallest value of
2.2.2 Box–Cox method
Luo et al.
17
and Wan et al.
15
assumed that a sample
In brief, the BC method consists of the following four steps. First, an optimization algorithm, such as the algorithm of Brent,
22
optimizes the power parameter
Box–Cox transformations
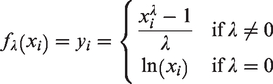
Equivalently, inverse Box–Cox transformations
Box and Cox
23
argued that Box–Cox transformations can transform a dataset into a more normally distributed dataset. Moreover, for every value of
The optimization step for finding


Appendix 2 describes the implementation of the optimization algorithm used to find
Then, the BC method applies the Box–Cox transformations with this value of
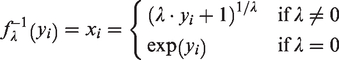
Let
The mean and standard deviation of

Numerical integration can solve the above two equations. Moreover, the following Monte Carlo simulation can compute the mean and standard deviation of
Recall that
3 Simulation study
3.1 Design of simulation study
We conducted a simulation study to systematically compare the performance of the existing and proposed approaches when the truth is known.
To be consistent with the work already conducted in this area, we generated data from the same distributions considered in previous studies.13–17 As used by Bland,
14
we used the normal distribution with
For each distribution, a sample of size
We used the following sample sizes in our simulations: 25, 50, 75, 100, 150, 200, 250, 300, 350, 400, 450, 500, 550, 600, 650, 700, 750, 800, 850, 900, 950, 1000. A total of 1,000 repetitions were performed for each combination of data generation parameters under scenarios
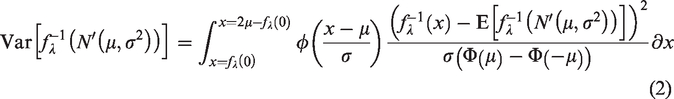
As used in previous studies,13,15,16 the average relative error (ARE) was used as a performance measure. For repetition
As used in Luo et al.,
17
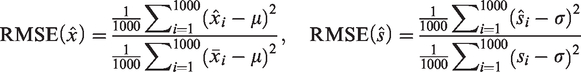
we also used the relative mean squared error (RMSE) to evaluate the performance of all methods. Letting
3.2 Results of simulation study
In the following sections, we present the results of the simulation study using the set of outcome distributions considered by Bland, 14 as these distributions were selected to investigate the effect of skewness on the estimators. The results of the sensitivity analyses where we used the set of outcome distribution used by other authors13,15–17 is given in Section 1 of Supplementary Material.
Because the simulation results in scenarios
3.2.1 Comparison of methods under scenario
Figure 1 displays the ARE of all sample mean and standard deviation estimators under scenario
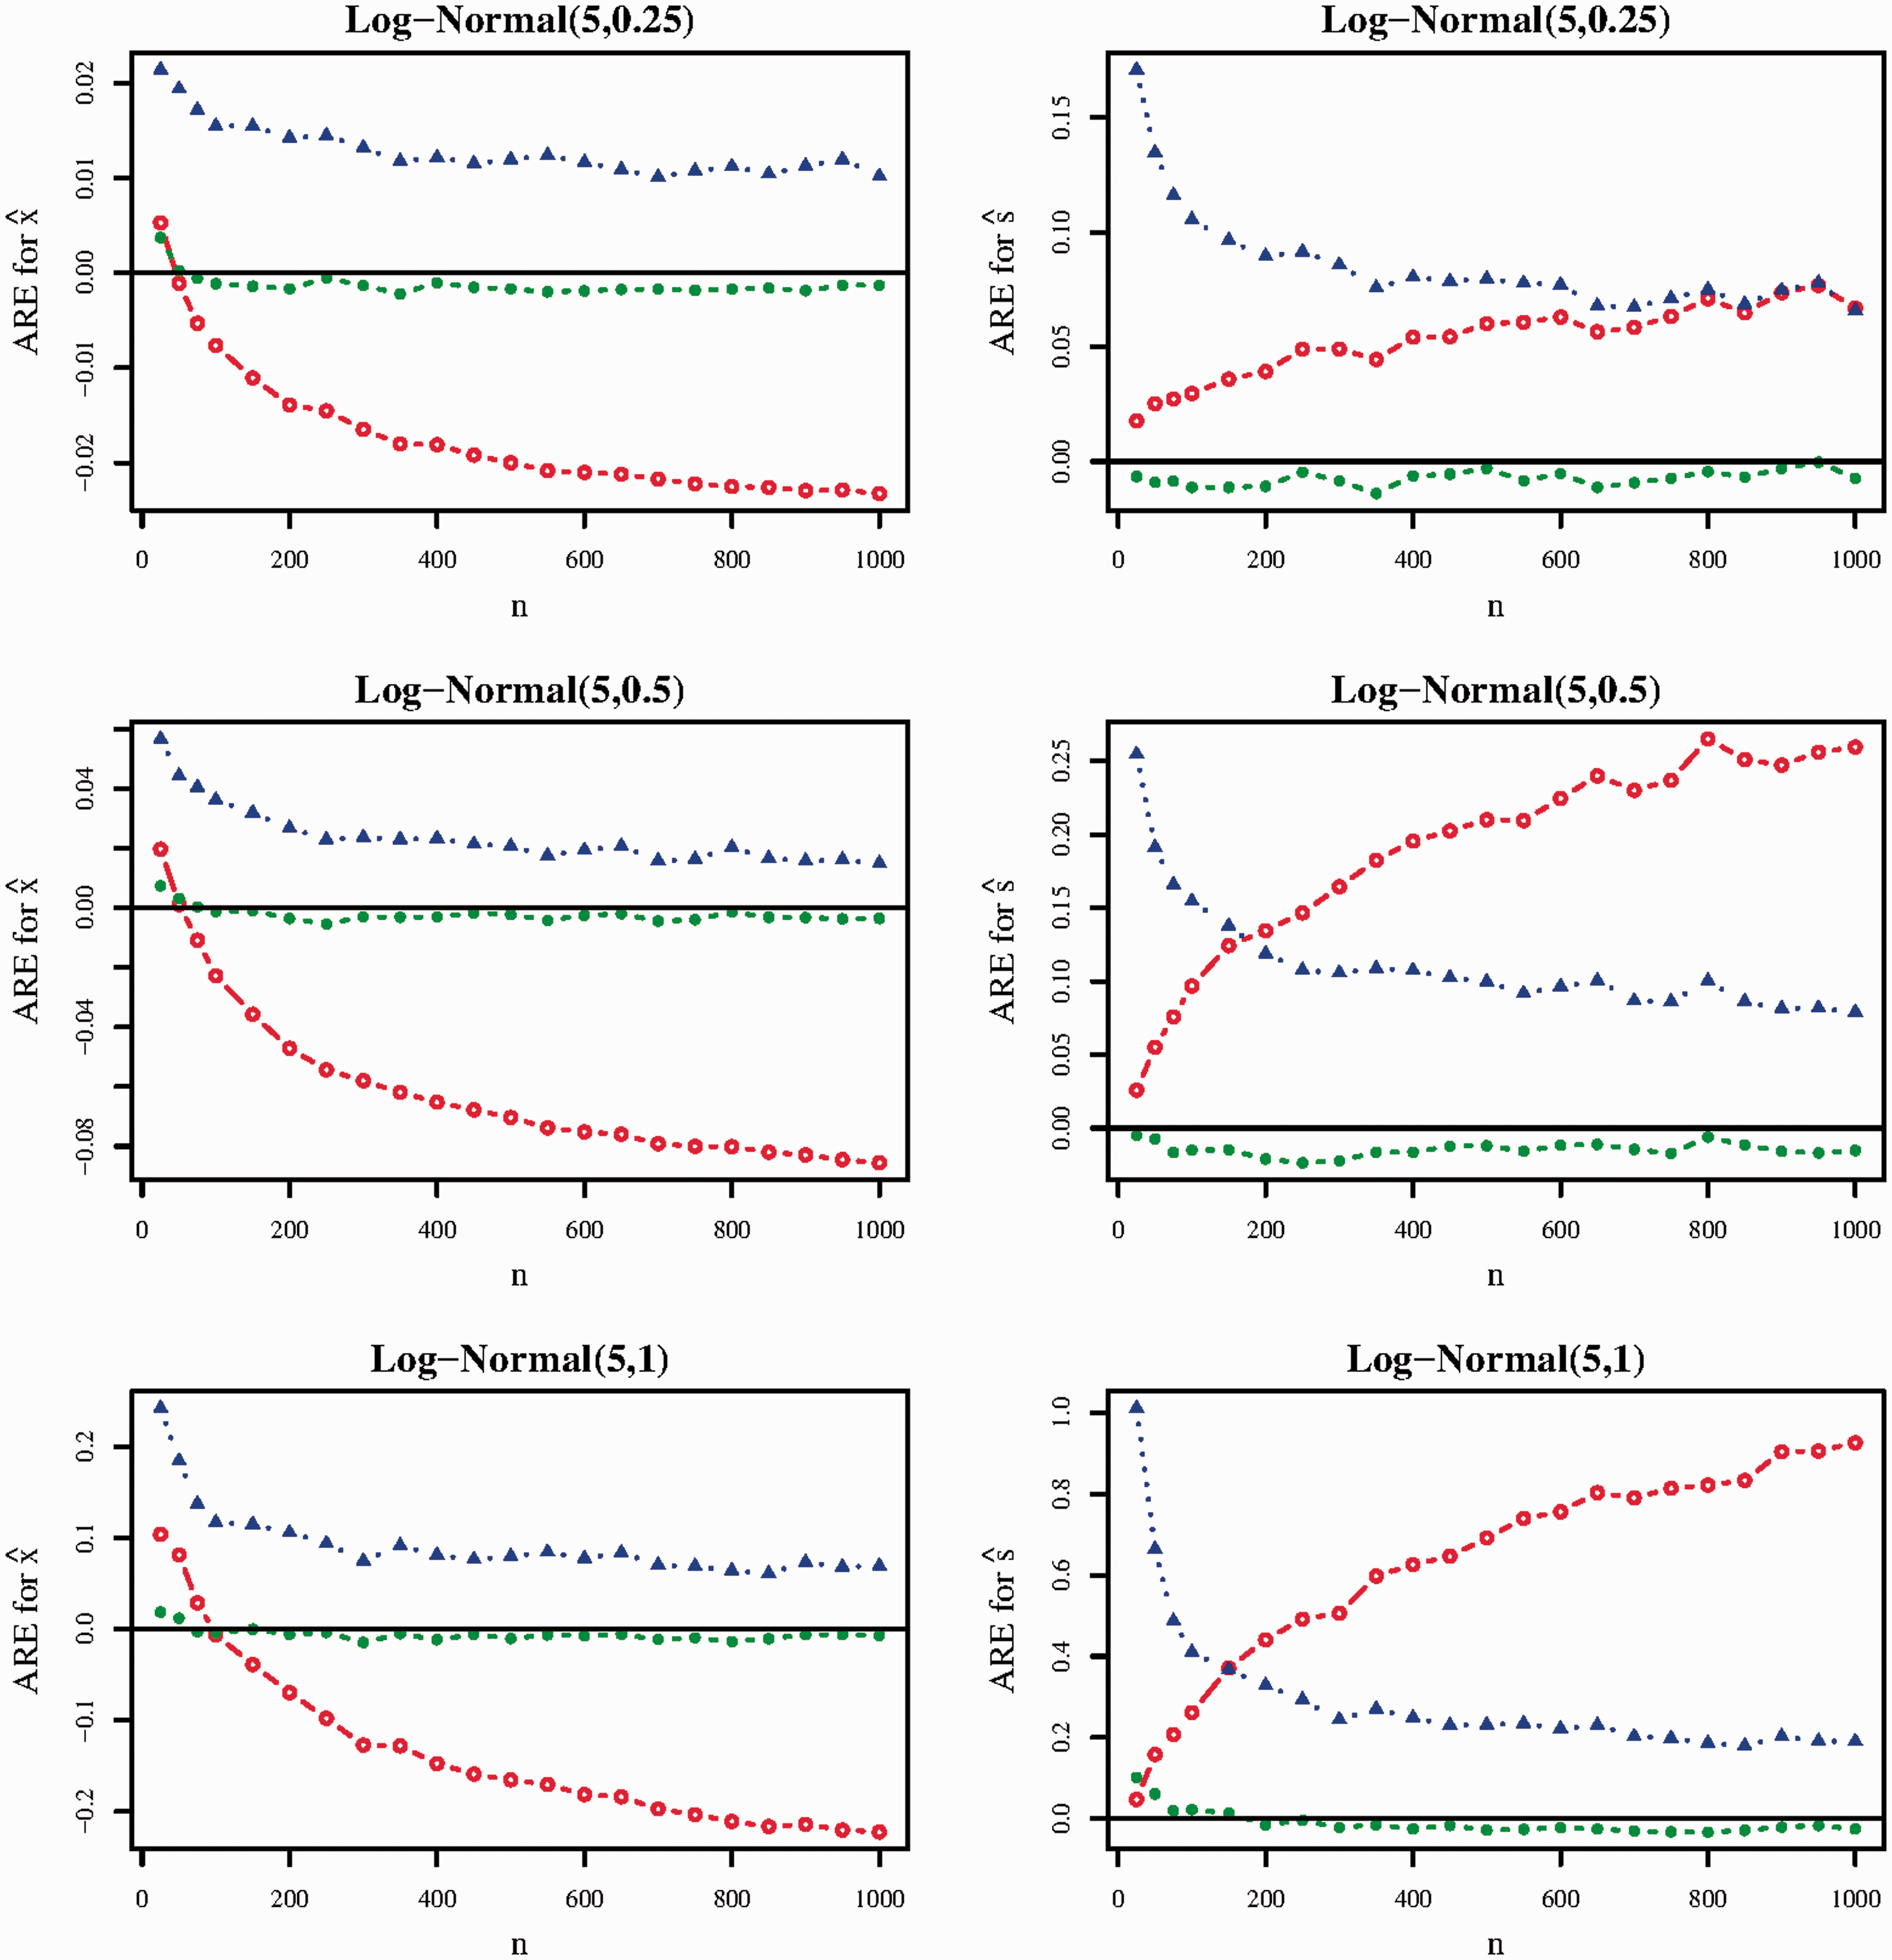
ARE of the Luo/Wan (red line, hollow circle), QE (blue line, solid triangle), and BC (green line, solid circle) methods in scenario
For estimating the sample mean, the BC method performed best under each distribution and nearly all sample sizes (
The BC method performed best for estimating the sample standard deviation, achieving AREs of magnitude less than 0.03 in nearly all scenarios investigated in Figure 1. Although the QE standard deviation estimator performed better as
Model selection for the QE method generally performed well. When the outcome distribution was Log-Normal(5,0.25), the QE method selected the log-normal distribution between 58.1% (when
3.2.2 Comparison of methods under scenario
Figure 2 gives the ARE of all methods under scenario
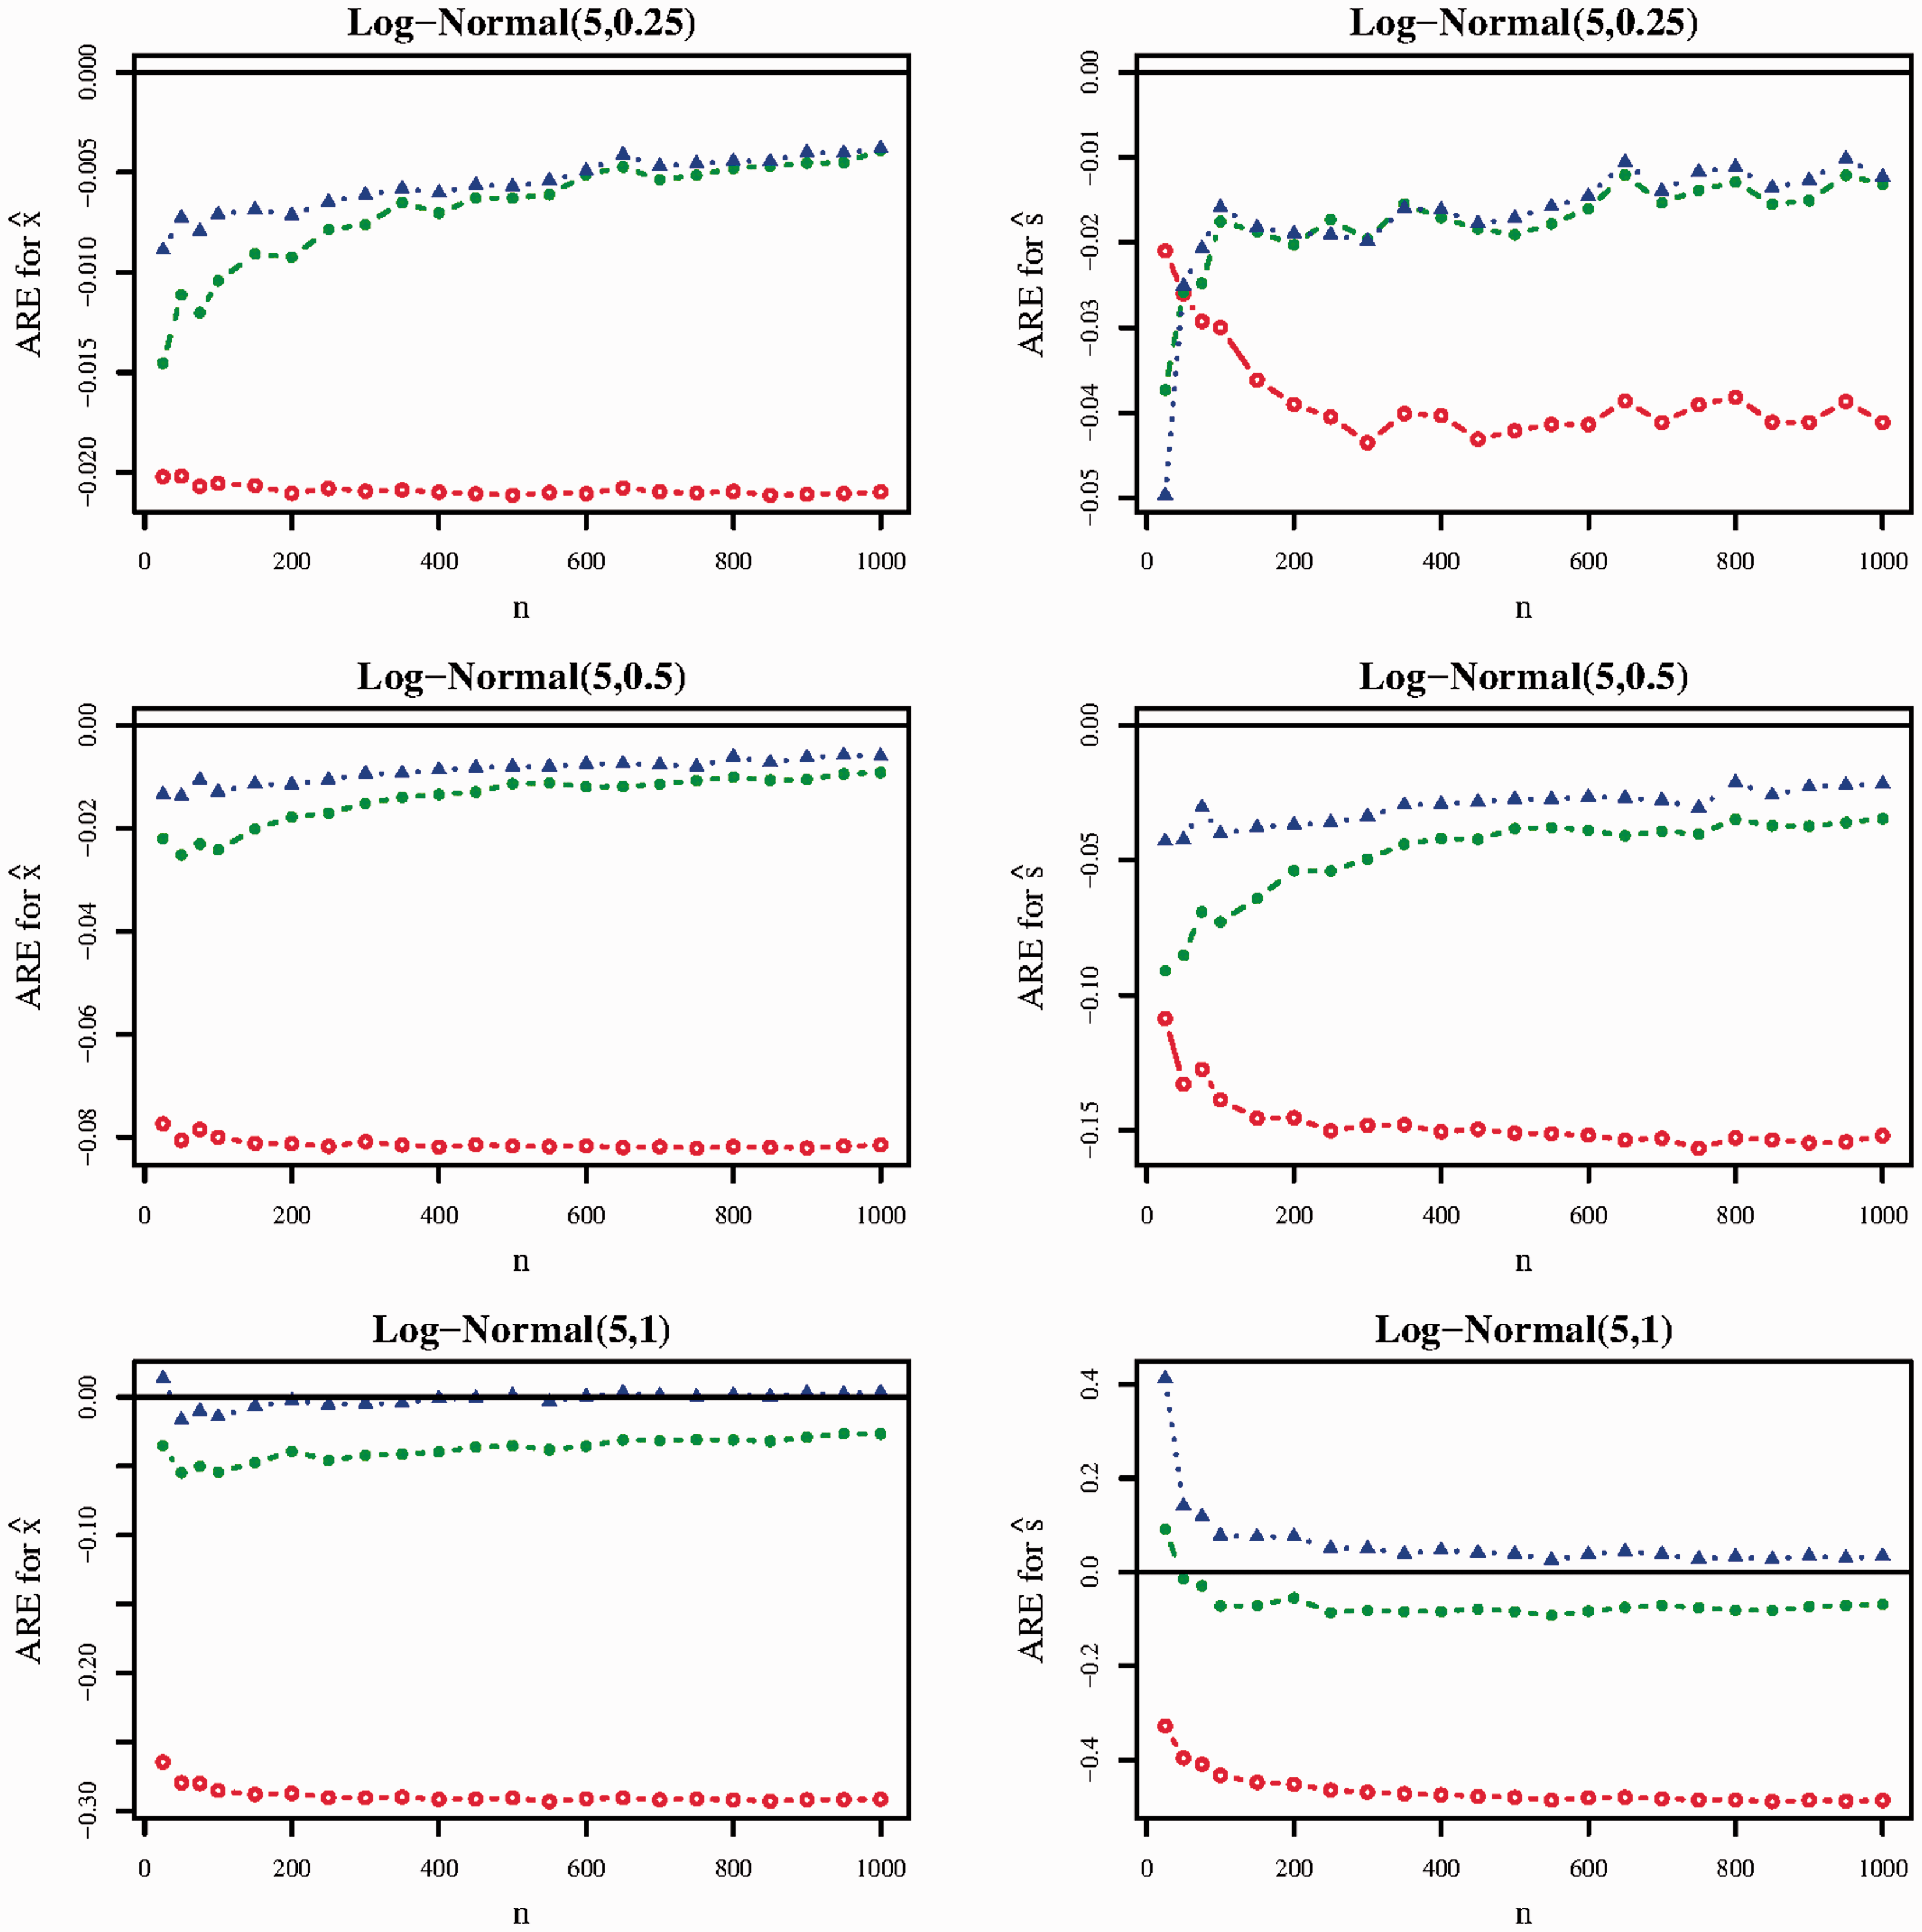
ARE of the Luo/Wan (red line, hollow circle), QE (blue line, solid triangle), and BC (green line, solid circle) methods in scenario
The BC and QE sample mean estimators performed substantially better than the Luo et al.
17
sample mean estimator in all scenarios investigated in Figure 2. As the skewness of the Log-Normal distribution increased, the gap in performance between the Luo et al.
17
sample mean estimator and the BC and QE sample mean estimators increased. For instance, when the outcome distribution was log-normal(5,1), the ARE of the Luo et al.
17
sample mean estimator was approximately −0.29 for most values of
Similar trends held for the corresponding sample standard deviation estimators. The QE and BC methods performed considerably better than the Wan et al. 15 sample standard deviation estimator in nearly all scenarios in Figure 2. There were no clear trends concerning the relative performance between the QE and BC standard deviation estimators.
Lastly, model selection performance was similar to that observed in
4 Example
In this section, we illustrate the use of the existing and proposed methods when applied to a real-life meta-analysis of a continuous, skewed outcome. Specifically, we used data collected for an individual participant data (IPD) meta-analysis of the diagnostic accuracy of the Patient Health Questionnaire-9 (PHQ-9) depression screening tool.24,25 We chose to use data from an IPD meta-analysis because (1)
Our analysis focused on the patient scores of the PHQ-9, which is a self-administered screening tool for depression. PHQ-9 scores are measured on a scale from 0 to 27, where higher scores are indicative of higher depressive symptoms. Previous studies have found that the distribution of PHQ-9 scores in the general population is right-skewed.26–28
For each of the 58 primary studies, we calculated the sample median, minimum and maximum values, and first and third quartiles of the PHQ-9 scores of all patients in order to mimic the scenarios where an aggregate data meta-analysis extracts
Some primary studies used weighted sampling. When extracting
As PHQ-9 scores are integer-valued, PHQ-9 scores of 0 were observed in most of the primary studies. However, a minimum value and/or first quartile value of 0 result in complications for the QE method when estimating the parameters of the log-normal distribution, as the parameter constraints for the QE method implicitly assume that the extracted summary data are strictly positive. Therefore, when applying all methods, a value of 0.5 was added to the extracted summary data. After estimating the sample mean and standard deviation from the shifted summary data, 0.5 was subtracted from the estimated sample mean.
We compared the derived estimated sample means and standard deviations to the true sample means and standard deviations (Table 1). The QE and BC methods were considerably less biased than the Luo et al.
17
method for estimating the sample mean under
ARE of the methods when applied to estimate the sample means and standard deviations of the 58 primary studies. In each column, the ARE value closest to zero is in bold.
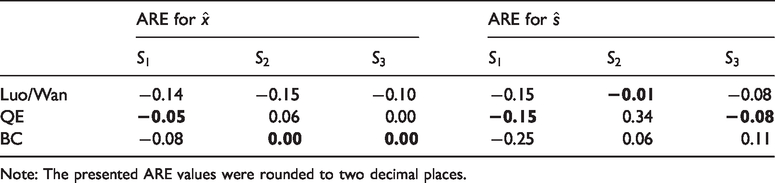
Note: The presented ARE values were rounded to two decimal places.
We meta-analyzed the PHQ-9 scores using the true study-specific sample means and standard deviations (Figure 3) and compared this to a meta-analysis using the derived estimated study-specific sample means and standard deviations (Table 2). The restricted maximum likelihood method was used to estimate heterogeneity in all meta-analyses.
30
The QE and BC methods were less biased for estimating the pooled mean compared to the existing methods in
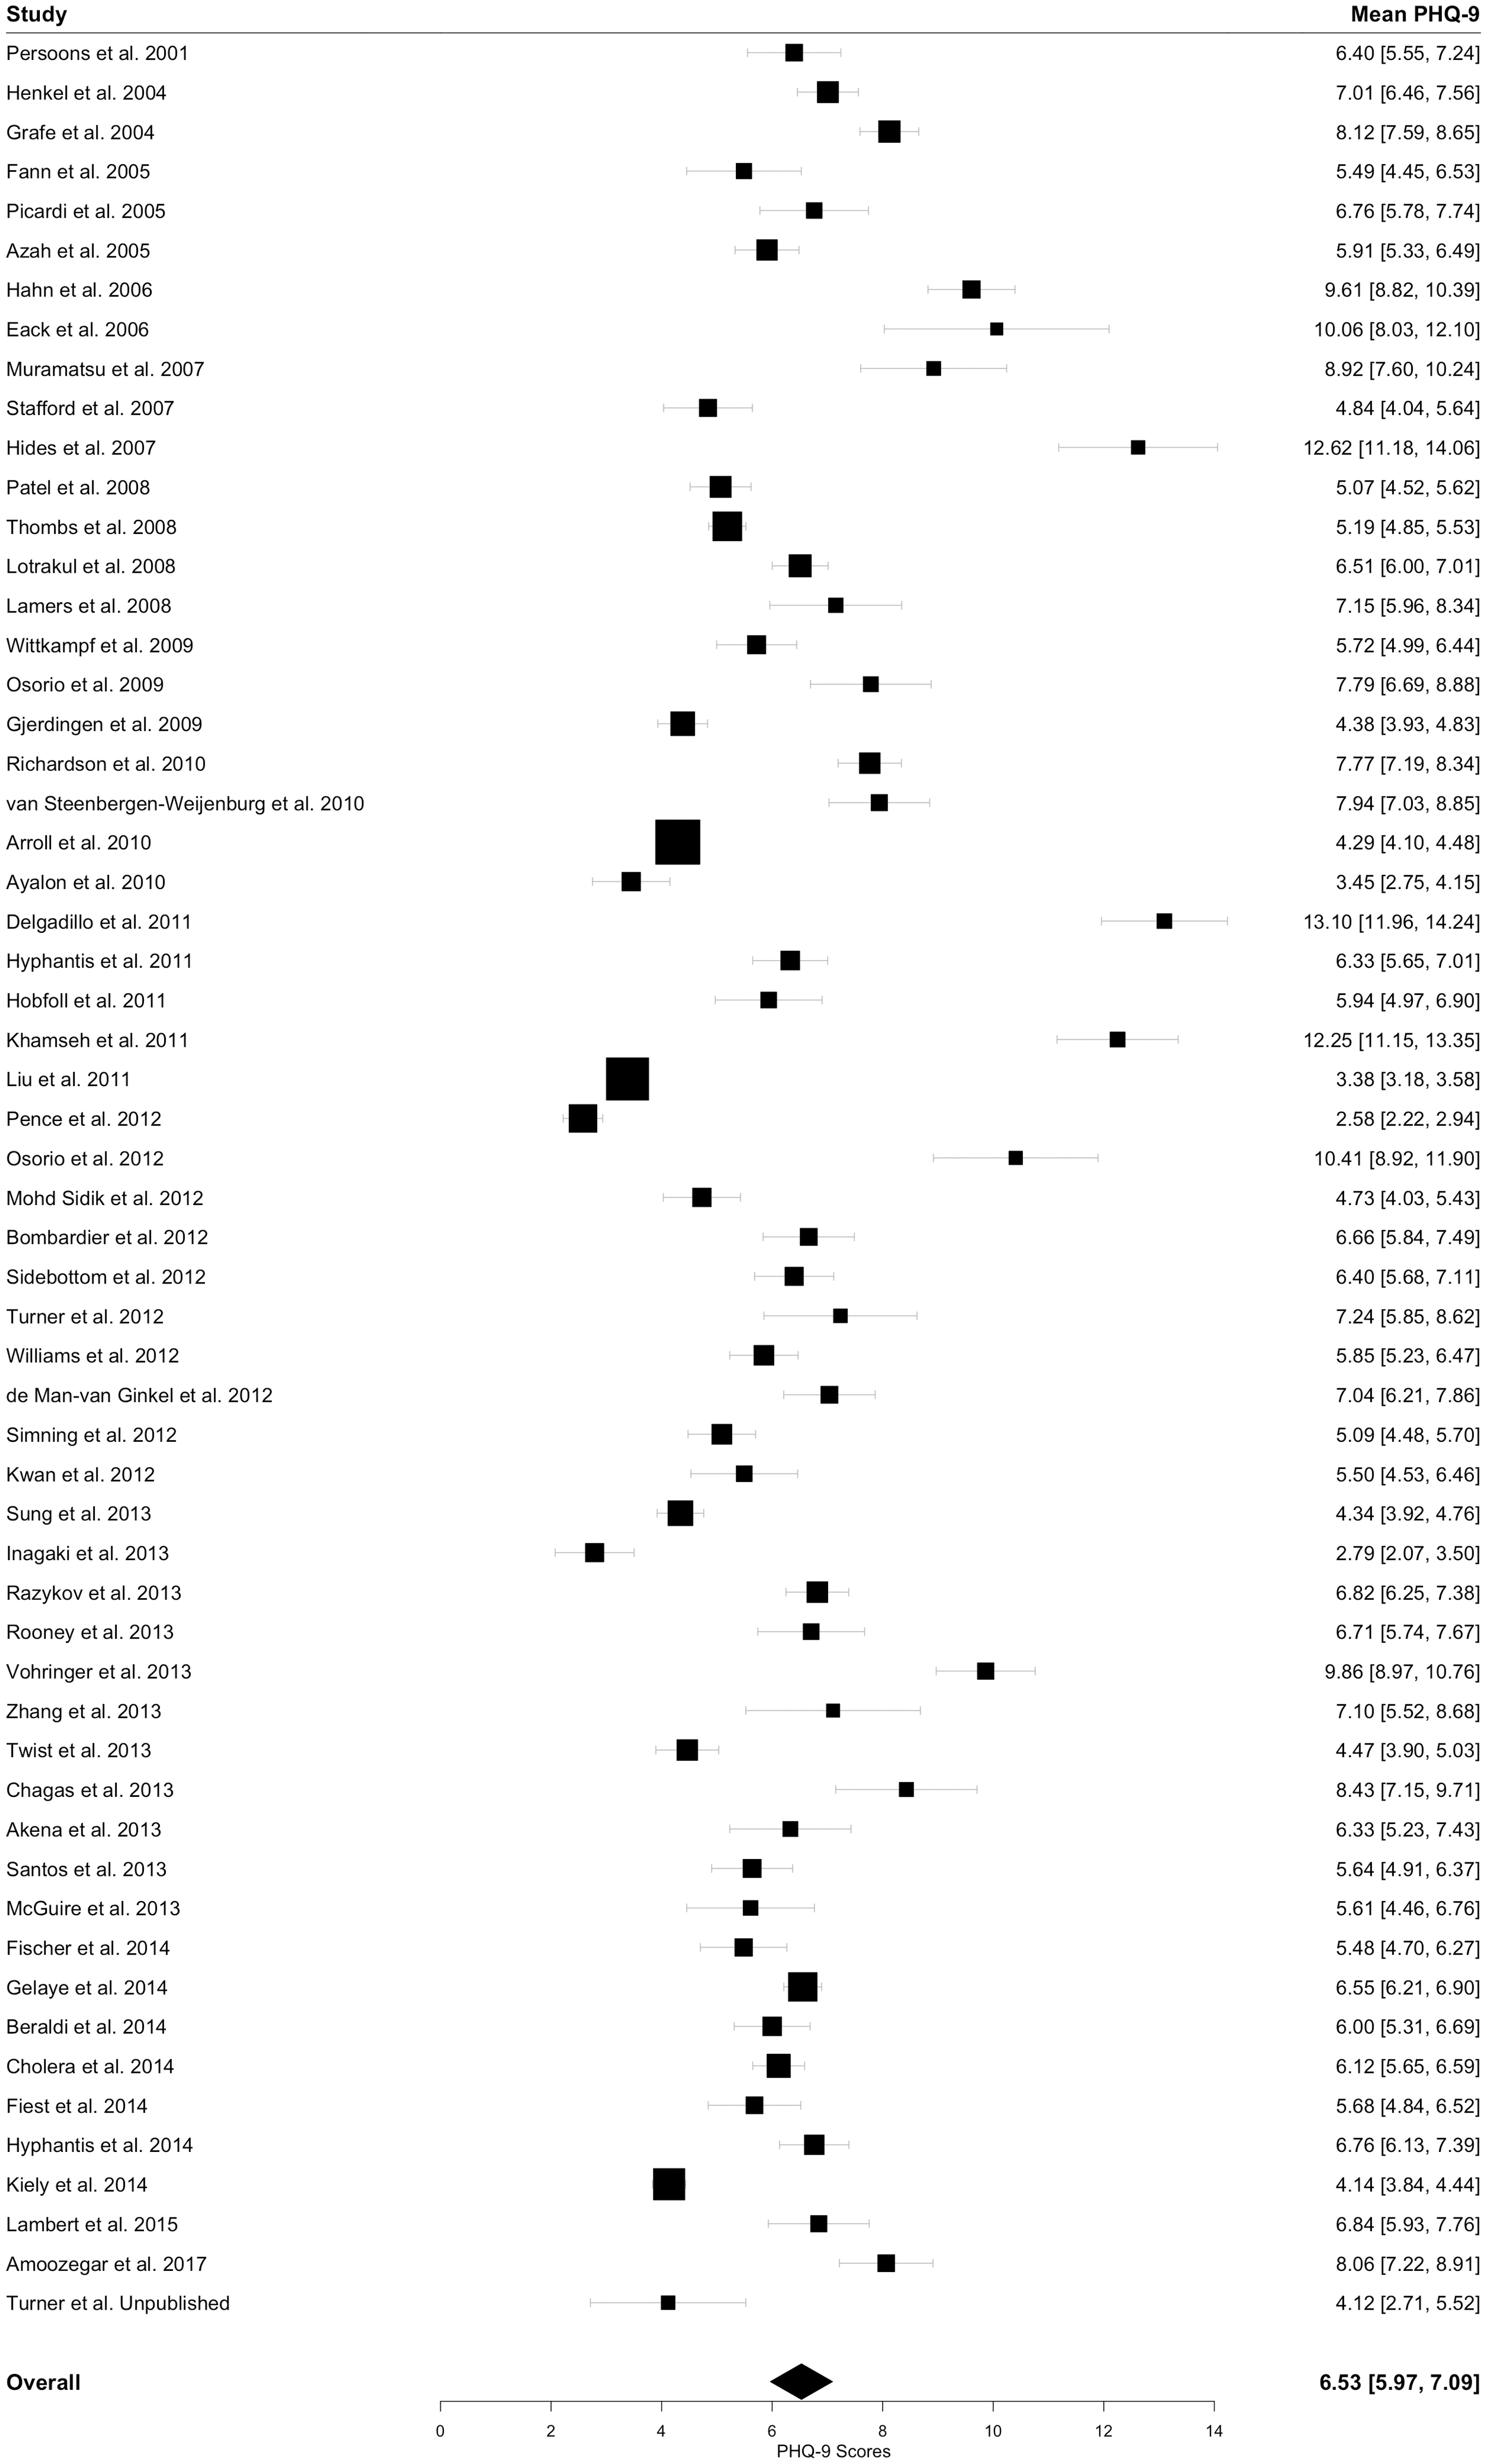
Forest plot from the meta-analysis of mean PHQ-9 scores. The study-specific estimates represent the true sample means and their 95% CIs. The pooled estimate shown was obtained using the true-study-specific sample means and standard deviations. In the “Mean PHQ-9” column, the true study-specific sample means and their 95% CIs as well as the pooled mean and its 95% CI are given.
Estimates of the pooled mean PHQ-9 score and their 95% CIs when using the study-specific derived estimated sample means and standard deviations.
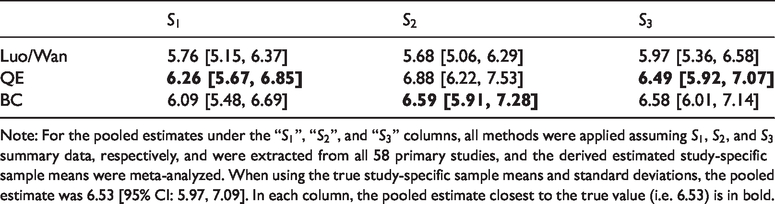
Note: For the pooled estimates under the “
The primary studies were highly heterogeneous. When using the true study-specific sample means and standard deviations,
Lastly, we investigated the skewness of the PHQ-9 scores. To mimic how data analysts may evaluate skewness based on available summary data, we used Bowley’s coefficient to quantify skewness, as it only depends on
We performed additional analyses to explore the sensitivity of the addition of 0.5 to all summary data. When adding 0.1 or 0.01 to all summary data, all methods obtained similar results.
5 Discussion
We proposed two methods to estimate the sample mean and standard deviation from commonly reported quantiles in meta-analysis. Because studies typically report the sample median and other sample quantiles when data are skewed, our analyses focused on the application of the proposed QE and BC methods to skewed data. We compared the QE and BC methods to the widely used methods of Wan et al. 15 and Luo et al. 17 in a simulation study and in a real-life meta-analysis.
We found that the QE and BC sample mean estimators performed well, typically yielding average relative error values approaching zero as the sample size increased. In the simulation study and the empirical evaluation, the QE and BC sample mean estimators performed better than the methods of Luo et al. 17 in nearly all scenarios.
Although the BC sample standard deviation estimator performed best or comparably to the best performing method in the primary analyses of the simulation study, the sensitivity analyses and empirical evaluations did not clearly indicate a best performing approach for estimating the sample standard deviation. For all methods, the magnitude of the relative errors for estimating the sample standard deviation was typically higher than for estimating the sample mean.
In practice, the existing and proposed methods enable data analysts to incorporate studies that report medians in meta-analysis. Therefore, we compared the performance of the methods at the meta-analysis level using data from a real-life individual patient data meta-analysis. In this analysis, the methods that performed best for estimating the sample mean often resulted in the most accurate pooled mean estimates as well. As the QE and BC methods performed best for estimating the sample mean, these methods also performed best at the meta-analysis level.
In our empirical assessments, we assumed that all primary studies reported
Repeated applications of the BC method to the same summary data will result in slightly different estimates of the sample mean and standard deviation. This is because the BC method uses Monte Carlo simulation to perform the inverse transformation (i.e. to solve equations (1) and (2)). We considered using deterministic numerical integration methods to perform the inverse transformation. However, we found that they often failed to converge when the transformation parameter
Our analyses focused on skewed data. As expected, when data were generated from a normal distribution, the Luo et al. 17 sample mean estimators and the Wan et al. 15 sample standard deviation estimators performed best (see Section 3 of Supplementary Material). However, most methods performed reasonably well in the normal case and the differences in performance amongst the methods were often inconsequential (e.g. AREs of magnitude less than 0.01 for the Luo et al. 17 QE, and BC sample mean estimators in the Normal(5,1) case). When making the same assumption of normality when applying the QE method (i.e. by only fitting the normal distribution), the performance of the method improved but were still not superior to the Luo et al. 17 and Wan et al. 15 methods (data not shown).
Kwon and Reis16,33 proposed methods for estimating the sample mean and standard deviation from the same sets of summary data considered in this work that are based on applying approximate Bayesian computation (ABC). Unlike the methods of Luo et al. 17 and Wan et al. 15 which assume that the outcome variable is normally distributed, the ABC methods can be applied under different parametric assumptions of the underlying distribution (i.e. normal and skewed distributions). We considered including the ABC methods in this paper. However, we found that several implementation decisions strongly affected the performance of the method in the simulation study and empirical assessments. As investigating how to best implement the ABC methods would be beyond the scope of this paper, we decided not to include these methods in this paper and intend to study this in greater detail in future work.
This work has several limitations. Although the settings in our simulation study were based on those used in previous studies13–17 to make a fair comparison between methods, these settings are not exhaustive and results may vary in other settings. Additionally, our simulation study focused solely on the performance of the methods for estimating the sample mean and standard deviation. In future work, we intend to conduct a simulation study investigating the performance of the methods at the meta-analysis level (e.g. for estimating the pooled effect measure and heterogeneity).
Strengths of this work include (i) including a greater number of outcome distributions and performance measures compared to the simulation studies conducted by previous authors,13–15,17 and (ii) empirically evaluating the accuracy of the methods using real-life data.
In summary, we recommend the QE and BC methods for estimating the sample mean and standard deviation when data are suspected to be non-normal, as they often outperformed the existing methods in the analyses presented herein. To make these methods widely accessible, we developed the R package ‘estmeansd’ (available on CRAN) 19 which implements these methods and launched a webpage (available at https://smcgrath.shinyapps.io/estmeansd/) that provides a graphical user interface for using these methods. We also encourage researchers performing meta-analysis to explore the sensitivity of their conclusions to the choice of method for estimating sample means and standard deviations.
Supplemental Material
SMM889080 Supplemental Material - Supplemental material for Estimating the sample mean and standard deviation from commonly reported quantiles in meta-analysis
Supplemental material, SMM889080 Supplemental Material for Estimating the sample mean and standard deviation from commonly reported quantiles in meta-analysis by Sean McGrath, XiaoFei Zhao, Russell Steele, Brett D. Thombs, Andrea Benedetti Kira E. Riehm Nazanin Saadat Alexander W.Levis Marleine Azar Danielle B. Rice Ying Sun Ankur KrishnanChen He Yin Wu Parash Mani Bhandari Dipika Neupane Mahrukh Imran Jill Boruff Pim Cuijpers Simon Gilbody John P.A. Ioannidis Lorie A. Kloda Dean McMillan Scott B.Patten Ian Shrier Roy C. Ziegelstein Dickens H.Akena Bruce Arroll Liat Ayalon Hamid R. Baradaran Murray Baron Anna Beraldi Charles H. Bombardier Peter ButterworthGregory Carter Marcos H.Chagas Juliana C. N.Chan Rushina Cholera Neerja Chowdhary Kerrie Clover Yeates Conwell Janneke M. de Man-van Ginkel Jaime Delgadillo Jesse R. Fann Felix H. Fischer Benjamin Fischler Daniel Fung Bizu Gelaye Felicity Goodyear-Smith Catherine G. Greeno Brian J. Hall Patricia A. Harrison Harter Martin Ulrich Hegerl Leanne Hides Stevan E. Hobfoll Marie Hudson Thomas Hyphantis Masatoshi Inagaki Khalida Ismail Nathalie JettéMohammad E.Khamseh Kim M.Kiely Yunxin KwanFemke Lamers Shen-Ing Liu Manote Lotrakul Sonia R.Loureiro Bernd Löwe Laura Marsh Anthony McGuireSherina Mohd Sidik Tiago N. Munhoz Kumiko Flávia L. Muramatsu Vikram Patel Brian W.Pence Philippe Persoons Angelo Picardi Katrin Reuter Alasdair G. Rooney Iná S. Santos Juwita Shaaban Abbey Sidebottom Adam Simning Lesley Stafford Sharon C. Sung Pei Lin Lynnette Tan Alyna Turner Christina M.van der Feltz-Cornelis Henk C. van Weert Paul A. Vöhringer White Jennifer Mary A. Whooley Kirsty Winkley Mitsuhiko Yamada Yuying Zhang in Statistical Methods in Medical Research
Footnotes
DEPRESSD Collaboration
Brooke Levis, McGill University, Montréal, Québec, Canada; Kira E. Riehm, Lady Davis Institute for Medical Research, Montréal, Québec, Canada; Nazanin Saadat, Lady Davis Institute for Medical Research, Montréal, Québec, Canada; Alexander W. Levis, McGill University, Montréal, Québec, Canada; Marleine Azar, McGill University, Montréal, Québec, Canada; Danielle B. Rice, McGill University, Montréal, Québec, Canada; Ying Sun, Lady Davis Institute for Medical Research, Montréal, Québec, Canada; Ankur Krishnan, Lady Davis Institute for Medical Research, Montréal, Québec, Canada; Chen He, McGill University, Montréal, Québec, Canada; Yin Wu, McGill University, Montréal, Québec, Canada; Parash Mani Bhandari, McGill University, Montréal, Québec, Canada; Dipika Neupane, McGill University, Montréal, Québec, Canada; Mahrukh Imran, Lady Davis Institute for Medical Research, Montréal, Québec, Canada; Jill Boruff, McGill University, Montréal, Québec, Canada; Pim Cuijpers, Vrije Universiteit, Amsterdam, the Netherlands; Simon Gilbody, University of York, Heslington, York, UK; John P.A. Ioannidis, Stanford University, Stanford, California, USA; Lorie A. Kloda, Concordia University, Montréal, Québec, Canada; Dean McMillan, University of York, Heslington, York, UK; Scott B. Patten, University of Calgary, Calgary, Alberta, Canada; Ian Shrier, McGill University, Montréal, Québec, Canada; Roy C. Ziegelstein, Johns Hopkins University School of Medicine, Baltimore, Maryland, USA; Dickens H. Akena, Makerere University College of Health Sciences, Kampala, Uganda; Bruce Arroll, University of Auckland, Auckland, New Zealand; Liat Ayalon, Bar Ilan University, Ramat Gan, Israel; Hamid R. Baradaran, Iran University of Medical Sciences, Tehran, Iran; Murray Baron, McGill University, Montréal, Québec, Canada; Anna Beraldi, Lehrkrankenhaus der Technischen Universität München, Munich, Germany; Charles H. Bombardier, University of Washington, Seattle, Washington, USA; Peter Butterworth, The University of Melbourne, Melbourne, Australia; Gregory Carter, University of Newcastle, New South Wales, Australia; Marcos H. Chagas, University of São Paulo, Ribeirão Preto, Brazil; Juliana C. N. Chan, The Chinese University of Hong Kong, Hong Kong Special Administrative Region, China; Rushina Cholera, University of North Carolina at Chapel Hill School of Medicine, Chapel Hill, North Carolina, USA; Neerja Chowdhary, Clinical practice, Mumbai, India; Kerrie Clover, University of Newcastle, New South Wales, Australia; Yeates Conwell, University of Rochester Medical Center, Rochester, New York, USA; Janneke M. de Man-van Ginkel, University Medical Center Utrecht, Utrecht, The Netherlands; Jaime Delgadillo, University of Sheffield, Sheffield, UK; Jesse R. Fann, University of Washington, Seattle, Washington, USA; Felix H. Fischer, Charité - Universitätsmedizin Berlin, Berlin, Germany; Benjamin Fischler, Private Practice, Brussels, Belgium; Daniel Fung, Duke-NUS Medical School, Singapore; Bizu Gelaye, Harvard T. H. Chan School of Public Health, Boston, Massachusetts, USA; Felicity Goodyear-Smith, University of Auckland, Auckland, New Zealand; Catherine G. Greeno, University of Pittsburgh, Pittsburgh, Pennsylvania, USA; Brian J. Hall, University of Macau, Macau Special Administrative Region, China; Patricia A. Harrison, City of Minneapolis Health Department, Minneapolis, Minnesota, USA; Martin Harter, University Medical Center Hamburg-Eppendorf, Hamburg, Germany; Ulrich Hegerl, German Depression Foundation, Leipzig, Germany; Leanne Hides, University of Queensland, Brisbane, Queensland, Australia; Stevan E. Hobfoll, STAR-Stress, Anxiety & Resilience Consultants, Chicago, Illinois, USA; Marie Hudson, McGill University, Montréal, Québec, Canada; Thomas Hyphantis, University of Ioannina, Ioannina, Greece; Masatoshi Inagaki, Shimane University, Shimane, Japan; Khalida Ismail, King's College London Weston Education Centre, London, UK; Nathalie Jetté, Icahn School of Medicine at Mount Sinai, New York, New York, USA; Mohammad E. Khamseh, Iran University of Medical Sciences, Tehran, Iran; Kim M. Kiely, University of New South Wales, Sydney, Australia; Yunxin Kwan, Tan Tock Seng Hospital, Singapore; Femke Lamers, Amsterdam UMC, Amsterdam, The Netherlands; Shen-Ing Liu, Mackay Memorial Hospital, Taipei; Manote Lotrakul, Mahidol University, Bangkok, Thailand; Sonia R. Loureiro, University of São Paulo, Ribeirão Preto, Brazil; Bernd Löwe, University Medical Center Hamburg-Eppendorf, Hamburg, Germany; Laura Marsh, Baylor College of Medicine, Houston and Michael E. DeBakey Veterans Affairs Medical Center, Houston, Texas, USA; Anthony McGuire, St. Joseph's College, Standish, Maine, USA; Sherina Mohd Sidik, Universiti Putra Malaysia, Serdang, Selangor, Malaysia; Tiago N. Munhoz, Federal University of Pelotas, Pelotas, Brazil; Kumiko Muramatsu, Graduate School of Niigata Seiryo University, Niigata, Japan; Flávia L. Osório, University of São Paulo, Ribeirão Preto, Brazil; Vikram Patel, Harvard Medical School, Boston, Massachusetts, USA; Brian W. Pence, The University of North Carolina at Chapel Hill, Chapel Hill, North Carolina, USA; Philippe Persoons, Katholieke Universiteit Leuven, Leuven, Belgium; Angelo Picardi, Italian National Institute of Health, Rome, Italy; Katrin Reuter, Group Practice for Psychotherapy and Psycho-oncology, Freiburg, Germany; Alasdair G. Rooney, University of Edinburgh, Edinburgh, Scotland, UK; Iná S. Santos, Federal University of Pelotas, Pelotas, Brazil; Juwita Shaaban, Universiti Sains Malaysia, Kelantan, Malaysia; Abbey Sidebottom, Allina Health, Minneapolis, Minnesota, USA; Adam Simning, University of Rochester Medical Center, Rochester, New York; Lesley Stafford, Royal Women's Hospital, Parkville, Australia; Sharon C. Sung, Duke-NUS Medical School, Singapore; Pei Lin Lynnette Tan, Tan Tock Seng Hospital, Singapore; Alyna Turner, University of Newcastle, New South Wales, Newcastle, Australia; Christina M. van der Feltz-Cornelis, University of York, York, UK; Henk C. van Weert, Amsterdam University Medical Centers, Location AMC, Amsterdam, the Netherlands; Paul A. Vöhringer, Universidad de Chile, Santiago, Chile; Jennifer White, Monash University, Melbourne, Australia; Mary A. Whooley, Veterans Affairs Medical Center, San Francisco, California, USA; Kirsty Winkley, King's College London, Waterloo Road, London, UK; Mitsuhiko Yamada, National Center of Neurology and Psychiatry, Tokyo, Japan; Yuying Zhang, The Chinese University of Hong Kong, Hong Kong Special Administrative Region, China.
Declaration of conflicting interests
The author(s) declared the following potential conflicts of interest with respect to the research, authorship, and/or publication of this article: All authors have completed the ICJME uniform disclosure form at ![]() (available on request from the corresponding author) and declare no support from any organisation for the submitted work other than that described above; no financial relationships with any organizations that might have an interest in the submitted work in the previous three years with the following exceptions: JCNC is a steering committee member and/or consultant of Astra Zeneca, Bayer, Lilly, MSD and Pfizer. She has received sponsorships and honorarium for giving lectures and providing consultancy and her affiliated institution has received research grants from these companies; UH declares that within the last three years, he was an advisory board member for Lundbeck and Servier; a consultant for Bayer Pharma; a speaker for Pharma and Servier; and received personal fees from Janssen and a research grant from Medice, all outside the submitted work; MI declares that he has received a grant from Novartis Pharma, and personal fees from Meiji, Mochida, Takeda, Novartis, Yoshitomi, Pfizer, Eisai, Otsuka, MSD, Technomics, and Sumitomo Dainippon, all outside of the submitted work; KI declares that she has received honorarium for speaker fees for educational lectures for Sanofi, Sunovion, Janssen and Novo Nordisk. No other relationships activities that could appear to have influenced the submitted work.
(available on request from the corresponding author) and declare no support from any organisation for the submitted work other than that described above; no financial relationships with any organizations that might have an interest in the submitted work in the previous three years with the following exceptions: JCNC is a steering committee member and/or consultant of Astra Zeneca, Bayer, Lilly, MSD and Pfizer. She has received sponsorships and honorarium for giving lectures and providing consultancy and her affiliated institution has received research grants from these companies; UH declares that within the last three years, he was an advisory board member for Lundbeck and Servier; a consultant for Bayer Pharma; a speaker for Pharma and Servier; and received personal fees from Janssen and a research grant from Medice, all outside the submitted work; MI declares that he has received a grant from Novartis Pharma, and personal fees from Meiji, Mochida, Takeda, Novartis, Yoshitomi, Pfizer, Eisai, Otsuka, MSD, Technomics, and Sumitomo Dainippon, all outside of the submitted work; KI declares that she has received honorarium for speaker fees for educational lectures for Sanofi, Sunovion, Janssen and Novo Nordisk. No other relationships activities that could appear to have influenced the submitted work.
Funding
The author(s) disclosed receipt of the following financial support for the research, authorship, and/or publication of this article: This study was funded by the Canadian Institutes of Health Research (CIHR; KRS-134297). BDT and AB were supported by Fonds de recherche du Québec -- Santé (FRQS) researcher salary awards. BLevis was supported by a CIHR Frederick Banting and Charles Best Canada Graduate Scholarship doctoral award. KER and NS were supported by CIHR Frederick Banting and Charles Best Canada Graduate Scholarship master's awards. AWL and MA were supported by FRQS Masters Training Awards. DBR was supported by a Vanier Canada Graduate Scholarship. YW was supported by a FRQS Postdoctoral Training Fellowship. PMB was supported by a studentship from the Research Institute of the McGill University Health Centre. DN was supported by G.R. Caverhill Fellowship from the Faculty of Medicine, McGill University. The primary studies by Amoozegar and by Fiest et al. were funded by the Cumming School of Medicine, University of Calgary, and Alberta Health Services through the Calgary Health Trust, as well as the Hotchkiss Brain Institute. SBP was supported by a Senior Health Scholar award from Alberta Innovates Health Solutions. Collection of data for the study by Arroll et al. was supported by a project grant from the Health Research Council of New Zealand. Data collection for the study by Ayalon et al. was supported from a grant from Lundbeck International. The primary study by Khamseh et al. was supported by a grant (M-288) from Tehran University of Medical Sciences. The primary study by Bombardier et al. was supported by the Department of Education, National Institute on Disability and Rehabilitation Research, Spinal Cord Injury Model Systems: University of Washington (grant No H133N060033), Baylor College of Medicine (grant No H133N060003), and University of Michigan (grant No H133N060032). Collection of data for the primary study by Kiely et al. was supported by National Health and Medical Research Council (grant No 1002160) and Safe Work Australia. PB was supported by Australian Research Council Future Fellowship FT130101444. Collection of data for the primary study by Zhang et al. was supported by the European Foundation for Study of Diabetes, the Chinese Diabetes Society, Lilly Foundation, Asia Diabetes Foundation, and Liao Wun Yuk Diabetes Memorial Fund. RC was supported by a United States National Institute of Mental Health (NIMH) grant (5F30MH096664), and the United States National Institutes of Health (NIH) Office of the Director, Fogarty International Center, Office of AIDS Research, National Cancer Center, National Heart, Blood, and Lung Institute, and the NIH Office of Research for Women's Health through the Fogarty Global Health Fellows Program Consortium (1R25TW00934001) and the American Recovery and Reinvestment Act. YC received support from NIMH (R24MH071604) and the Centers for Disease Control and Prevention (R49 CE002093). Collection of data for the primary study by Delgadillo et al. was supported by grant from St Anne's Community Services, Leeds, UK. Collection of data for the primary study by Fann et al. was supported by grant RO1 HD39415 from the US National Center for Medical Rehabilitation Research. The primary study by Fischer et al. was funded by the German Federal Ministry of Education and Research (01GY1150). Data for the primary study by Gelaye et al. was supported by grant from the NIH (T37 MD001449). Collection of data for the primary study by Gjerdingen et al. was supported by grants from the NIMH (R34 MH072925, K02 MH65919, P30 DK50456). The primary study by Eack et al. was funded by the NIMH (R24 MH56858). Collection of data for the primary study by Hobfoll et al. was made possible in part by grants from NIMH (RO1 MH073687) and the Ohio Board of Regents. BJH received support from a grant awarded by the Research and Development Administration Office, University of Macau (MYRG2015-00109-FSS). Collection of data provided by MHärter and KR was supported by the Federal Ministry of Education and Research (grants No 01 GD 9802/4 and 01 GD 0101) and by the Federation of German Pension Insurance Institute. The primary study by Henkel et al. was funded by the German Ministry of Research and Education. The primary study by Hides et al. was funded by the Perpetual Trustees, Flora and Frank Leith Charitable Trust, Jack Brockhoff Foundation, Grosvenor Settlement, Sunshine Foundation, and Danks Trust. Data for the study by Razykov et al. was collected by the Canadian Scleroderma Research Group, which was funded by the CIHR (FRN 83518), the Scleroderma Society of Canada, the Scleroderma Society of Ontario, the Scleroderma Society of Saskatchewan, Sclérodermie Québec, the Cure Scleroderma Foundation, Inova Diagnostics Inc, Euroimmun, FRQS, the Canadian Arthritis Network, and the Lady Davis Institute of Medical Research of the Jewish General Hospital, Montreal, QC. MHudson was supported by a FRQS Senior Investigator Award. Collection of data for the primary study by Hyphantis et al. was supported by grant from the National Strategic Reference Framework, European Union, and the Greek Ministry of Education, Lifelong Learning and Religious Affairs (ARISTEIA-ABREVIATE, 1259). The primary study by Inagaki et al. was supported by the Ministry of Health, Labour and Welfare, Japan. The primary study by Twist et al. was funded by the UK National Institute for Health Research under its Programme Grants for Applied Research Programme (grant reference No RP-PG-0606-1142). NJ was supported by a Canada Research Chair in Neurological Health Services Research and an AIHS Population Health Investigator Award. KMK was supported by funding from a Australian National Health and Medical Research Council fellowship (grant No 1088313). The primary study by Lamers et al. was funded by the Netherlands Organisation for Health Research and Development (grant No 945-03-047). The primary study by Liu et al. was funded by a grant from the National Health Research Institute, Republic of China (NHRI-EX97-9706PI). The primary study by Lotrakul et al. was supported by the Faculty of Medicine, Ramathibodi Hospital, Mahidol University, Bangkok, Thailand (grant No 49086). The primary studies by Osório et al. were funded by Reitoria de Pesquisa da Universidade de São Paulo (grant No 09.1.01689.17.7) and Banco Santander (grant No 10.1.01232.17.9). BLöwe received research grants from Pfizer, Germany, and from the medical faculty of the University of Heidelberg, Germany (project 121/2000) for the study by Gräfe et al.. Collection of data for the primary study by Williams et al. was supported by an NIMH grant to LM (RO1-MH069666). The primary study by Mohd Sidik et al. was funded under the Research University Grant Scheme from Universiti Putra Malaysia, Malaysia, and the Postgraduate Research Student Support Accounts of the University of Auckland, New Zealand. The primary study by Santos et al. was funded by the National Program for Centers of Excellence (PRONEX/FAPERGS/CNPq, Brazil). The primary study by Muramatsu et al. was supported by an educational grant from Pfizer US Pharmaceutical Inc. FLO was supported by Productivity Grants (PQ-CNPq-2 number 301321/2016-7). Collection of primary data for the study by Pence et al. was provided by NIMH (R34MH084673). The primary study by Persoons et al. was supported by a grant from the Belgian Ministry of Public Health and Social Affairs and a restricted grant from Pfizer Belgium. The primary study by Picardi et al. was supported by funds for current research from the Italian Ministry of Health. The primary study by Rooney et al. was funded by the UK National Health Service Lothian Neuro-Oncology Endowment Fund. JS was supported by funding from Universiti Sains Malaysia. The primary study by Sidebottom et al. was funded by a grant from the United States Department of Health and Human Services, Health Resources and Services Administration (grant No R40MC07840). Simning et al.'s research was supported in part by grants from the NIH (T32 GM07356), Agency for Healthcare Research and Quality (R36 HS018246), NIMH (R24 MH071604), and the National Center for Research Resources (TL1 RR024135). LS received PhD scholarship funding from the University of Melbourne. Collection of data for the studies by Turner et al. were funded by a bequest from Jennie Thomas through the Hunter Medical Research Institute. The study by van Steenbergen-Weijenburg et al. was funded by Innovatiefonds Zorgverzekeraars. The study by Wittkampf et al. was funded by the Netherlands Organization for Health Research and Development (ZonMw) Mental Health Program (No 100.003.005 and 100.002.021) and the Academic Medical Center/University of Amsterdam. PAV was supported by the Fund for Innovation and Competitiveness of the Chilean Ministry of Economy, Development and Tourism, through the Millennium Scientific Initiative (grant No IS130005). The primary study by Thombs et al. was done with data from the Heart and Soul Study. The Heart and Soul Study was funded by the Department of Veterans Epidemiology Merit Review Program, the Department of Veterans Affairs Health Services Research and Development service, the National Heart Lung and Blood Institute (R01 HL079235), the American Federation for Ageing Research, the Robert Wood Johnson Foundation, and the Ischemia Research and Education Foundation. No other authors reported funding for primary studies or for their work on this study. No funder had any role in the design and conduct of the study; collection, management, analysis, and interpretation of the data; preparation, review, or approval of the manuscript; and decision to submit the manuscript for publication.
Supplemental material
Supplemental material for this article is available online.
References
Supplementary Material
Please find the following supplemental material available below.
For Open Access articles published under a Creative Commons License, all supplemental material carries the same license as the article it is associated with.
For non-Open Access articles published, all supplemental material carries a non-exclusive license, and permission requests for re-use of supplemental material or any part of supplemental material shall be sent directly to the copyright owner as specified in the copyright notice associated with the article.