In the case of two independent samples from Poisson distributions, the natural target parameter for hypothesis testing is the ratio of the two population means. The conditional tests which have been derived for this class of problems already in the 1940s are well known to be optimal in terms of power only when randomized decisions between hypotheses are admitted at the boundary of the respective rejection regions. The major objective of this contribution is to show how the approach used by Boschloo in 1970 for constructing a powerful nonrandomized version of Fisher’s exact test for hypotheses about the odds ratio between two binomial parameters can successfully be adapted for the Poisson case. The resulting procedure, which we propose to term Poisson-Boschloo test, depends on some cutoff for the observed total number of events, the variable upon which conditioning has to be done. We show that for any fixed specific alternative, this cutoff can be chosen in such a way that the resulting nonrandomized test falls short in power of the randomized UMPU test only by a negligible amount. Thus, sample size calculation for the Poisson-Boschloo test can be carried out nearly exactly by means of the same computational procedure as has to be used for the randomized UMPU test. Since the power of the latter is accessible to elementary computational tools, this result makes approximate methods of sample size calculation for the Poisson-Boschloo test dispensable. It is furthermore shown how the construction of a Poisson-Boschloo type test extends to the case that interest is in establishing equivalence in the strict, two-sided sense rather than noninferiority. Although proceeding to two-sided equivalence considerably complicates the construction, comparing the resulting test procedure in terms of power with the exact randomized UMPU test leads essentially to the same conclusions as in the noninferiority case.
Comparative studies generating data whose distributions can reasonably assumed to be of Poisson’s form, are frequently performed in medical research. Regarding the hypothesis testing problems to be addressed in the confirmatory statistical analysis of such data, there are far-reaching analogies but also basic differences as compared with studies requiring the application of testing procedures for independent samples from two binomial distributions: In both settings, standard sufficiency arguments rooted in the theory of exponential families of distributions (cf. Lehmann and Romano,1 Ch.4) apply allowing one to reduce the individual observations to sample totals. Furthermore, there exists a natural parameter which measures the degree of dissimilarity of the distributions under comparison and indexes the conditional distribution of one of the sample totals given the sum of both.
An obvious difference between the Poisson and the binomial setting is that in the former the sample space of the statistic to be used for eliminating the nuisance parameter via conditioning is unbounded to the right. As will me made explicit in the sequel, in consequence of this fact the technique used by Boschloo2 for removing the conservativeness of the nonrandomized version of the exact Fisher-type test for differences between two binomial proportions cannot be adopted in a straightforward manner for the two-sample setting with Poisson-distributed data. The basic idea behind Boschloo’s approach is strikingly simple: The standard nonrandomized version of the conditional test obtained by including all boundary points of the rejection region in the acceptance region, can be carried out at an increased nominal level , say, without increasing the unconditional rejection probability under the null hypothesis beyond the target significance level α. In order to obtain the maximum gain in power, has to be determined iteratively as the largest nominal level being admissible in the sense that the resulting nonrandomized testing procedure maintains the target level.
For the problem of testing the traditional null hypothesis of coincidence of the distributions underlying the data, the solution via conditioning on the sum of both sample totals has been derived for the Poisson model quite early in the history of frequentist statistical inference (Przyborowski and Wilenski,3 Hoel4). Lehmann5 considered the one-sided conditional test in its generalized form as required in applications to clinical trials for purposes of testing for noninferiority. Meanwhile, the existing literature on inferential methods for the analysis of two-arm trials generating Poisson data is fairly rich, though not comparable in size with that on binomial two-sample problems. The better part of this work deals with methods which do not involve conditioning on the statistic being sufficient for the nuisance parameter. Maximum likelihood-based solutions to noninferiority testing problems were investigated by Stucke and Kieser6 and Bright and Soulakova.7 Chiu8 compared approximate tests for differences between two Poisson means with a bootstrap procedure. Seven exact nonconditional tests for differences between two Poisson rates were comparatively evaluated by Shan.9 Recent articles presenting results of systematic comparisons between different methods of confidence interval estimation for the ratio of two Poisson means are Krishnamoorthy and Lee,10 Li, Tang and Wong,11 Shan,12 and Xiao et al.13 Approaches to sample size planning of studies aiming to detect differences between the parameters of two Poisson distributions were considered by Menon et al.14 and Shan.12
Regarding the Poisson two-sample setting, the number of more recently published papers dealing with inferential methods derived from the respective conditional distribution is comparatively small. The exact conditional test was studied by Lui15 with respect to power and minimally required expected number of events, both for the case of noninferiority and equivalence as defined in terms of the ratio of means. Krishnamoorthy and Thomson16 compared the exact conditional test with an approximately exact procedure using a p-value computed from the joint distribution of two Poisson distributions with parameters estimated through maximizing the likelihood restricted by assuming that the true parameter values are the coordinates of a point on the boundary of the null hypothesis.
Perhaps, the major reason behind the fact that conditional tests for discrete data are generally considered with a good deal of reservation in the practice of medical statistics, is that these procedures are optimal in terms of power only if an investigator is willing to take a randomized decision between the two hypotheses under consideration whenever the observed value of the test statistic falls on the boundary of the critical region. Actually, involving an external chance mechanism of that kind in confirmatory statistical analysis is rarely, if ever, an option for real applications. In the binomial case, the loss in power entailed by discarding randomized decision making has been studied numerically both for testing for differences (Boschloo,2 McDonald et al.,17 Wellek18), noninferiority (Wellek,19 Wellek,20, section 6.6.5), and two-sided equivalence (Wellek,20 section 6.6.5). In all these settings, Boschloo’s technique of increasing the conditional nominal level as far as possible without exceeding in the nonrandomized test the target significance level of, say, 2.5 or 5.0%, proved remarkably effective. Our objective here is to show how and with what gain in power this technique can be exploited for constructing improved nonrandomized tests for noninferiority and two-sided equivalence for two-arm trials yielding Poisson-distributed data.
In Section 2, we start with introducing basic notational conventions and elaborate the steps to be taken in constructing a Boschloo-type version of the conditional test of the null hypothesis that the ratio of event rates between the experimental and the reference arm of a trial with Poisson distributed outcome exceeds some prespecified margin . Assuming that large event rates are undesirable, for and , this null hypothesis corresponds to a problem of superiority and noninferiority, respectively. Subsequently, some useful theoretical properties of the one-sided Poisson-Boschloo test and numerical results on its finite-sample behavior are presented. In Section 3, the one-sided Poisson-Boschloo test will be compared in terms of power to the traditional nonrandomized version of the conditional test and the exact UMPU test allowing for randomized decisions. Section 4 gives full details of the construction of a Poisson-Boschloo test for two-sided equivalence, together with basic properties of the resulting equivalence testing procedure. Some examples illustrating the use of the new testing procedures in the planning and analysis of comparative clinical trials with Poisson-distributed outcome are presented in section 5. In section 6, we argue why the ratio of event rates is better suited as a measure of dissimilarity of two Poisson distributions than the difference of the rates.
2 One-sided Boschloo-type test for two-arm trials with Poisson-distributed outcome
We assume throughout that the data under analysis are given by two independent random samples and such that the Xi and Yj are i.i.d. and , respectively, with denoting the Poisson distribution with parameter . The one-sided version of the testing problem we are interested in reads
where denotes some pre-specified constant . Provided the sample values are counts of an undesirable event (like death or tumor recurrence in an oncological context), the alternative hypothesis to be established according to equation (1) states that the experimental treatment under which the Xi are observed, yields results which are not substantially worse or even better than those obtained under some reference treatment administered in the second arm of the trial. For , equation (1) has to be classified as a noninferiority problem with the excess of over 1 as the noninferiority margin. In the special case , the testing problem (1) arises in an ordinary two-arm trial designed to establish the superiority of the experimental treatment.
It is a well-known fact from the theory of exponential families of distributions (see, e.g., Lehmann and Romano,1 Chapter 2.7 and 4) that an optimum test for equation (1) depends on the individual observations only through the sufficient statistics given by . The joint distribution of is the same as that of two independent Poisson variables with parameters and , respectively. The latter admits a representation as an element of a 2-parameter exponential family of distributions with sufficient statistics and parameters . Setting for brevity , the conditional distribution of given S = s, is for each binomial with parameters s and , where and . Thus, a conditional p-value for testing equation (1) can be written as
where stands for the probability mass function of , the binomial distribution with parameters s and π, and . The critical region of the test based on this p-value is given by , where denotes the smallest integer such that the value of the cumulative distribution function (cdf) of at exceeds the target significance level α. According to the theory of optimum tests for hypotheses about parameters of exponential families of distributions, the test based on equation (2) is UMPU (uniformly most powerful among all unbiased level-α tests for the same problem) only if in each conditional distribution of the test statistic , the rejection probability under is exactly equal to α. Due to the discreteness of the binomial distribution, this typically requires that on the boundary of the critical region , i.e. for a randomized decision in favor of the alternative hypothesis H1 has to be taken with probability , say, where .
There is a broad consensus among applied statisticians that involving external randomization in hypothesis testing procedures is not an option for real, in particular, medical applications. Therefore, whenever the construction of an optimum test leads to using p-values calculated from a distribution of the discrete type, the procedure is carried out in routine practice in its nonrandomized version obtained by setting the probability of a randomized rejection of the null hypothesis for each boundary point of the critical region equal to zero. On the one hand, the UMPU test modified in that way still merits being called exact since its rejection probability maximized over H0, called the size of the corresponding critical region , satisfies the inequality for all, however, small sample sizes rather than only asymptotically. On the other hand, abstaining from randomization necessarily entails some loss in efficiency.
The natural way of assessing numerically the amount of this loss is through comparing the nonconditional power of both versions of the test against the same alternative with . In order to perform such comparisons, one needs an expression for the power of both the exact UMPU test and its conservative nonrandomized version. One of the building blocks of the corresponding formulas is the distribution of the statistic S with respect to which the conditional power has to be averaged. As follows from the elementary properties of the Poisson family of distributions, independence of and implies that we have with . Making use of this result, one obtains for the rejection probability of the UMPU test the formula
where denotes the cdf corresponding to the binomial probability mass function , and to be defined as before. In order to adapt formula (3) to the nonrandomized version of the test, one just has to omit the second term from each individual summand. For computational purposes, the formula will be used with truncating the range of summation at some point , say, to be chosen in such a way that the error is bounded above by some given, sufficiently small . Since the conditional rejection probabilities averaged in equation (3) with respect to the distribution of S are bounded above by 1, an upper bound to the truncation error is given by . Hence, a conservative choice is to set equal to the -quantile of . Exploiting this relationship, the truncation error was kept below in all power calculations subsequently reported.
At first sight, the answer to the question of how to construct a power-improved Boschloo-type nonrandomized test for the two-sample setting with Poisson-distributed data seems straightforward: The direct analogue of Boschloo’s2 improved nonrandomized Fisher type test would be obtained by replacing α for each possible value of the conditioning statistic S with the same maximally increased nominal level , say, to be determined from
The reason why applying equation (4) would fail to serve our purpose has its roots in the asymptotic behavior of the power function of the nonrandomized conditional test at the boundary of the hypotheses under consideration. Actually, denoting the rejection probability of the nonrandomized test at nominal level α under any with as computed from equation (3) with all γ’s set equal to zero, by , it can be shown (for a rigorous proof see supplemental Web Material, Part 1, Appendix A (I)), that there holds
for any α and fixed sample sizes m, n. Since this clearly implies that replacing α with any nominal level would yield an anti-conservative test, it follows that direct implementation of Boschloo’s proposal is not an option in the Poisson setting.
A promising way around the difficulty arising from the limit relationship (5) consists in restricting the process of increasing the nominal significance level for the binomial tests making up the conditional testing procedure, to a suitably chosen upper limit to the conditioning statistic S. Precisely speaking, the proposed construction of a Boschloo-type test for the problem (1) with Poisson-distributed data proceeds in the following steps.
Choose some fixed positive integer and carry out the ordinary nonrandomized binomial test conditional on S = s at an increased nominal level for all and at the target level α itself for .
Choose some other small positive real number (in addition to the upper bound ε to the truncation error for evaluating expressions of the form appearing in equation (3)) and find some approaching from above the smallest value of λ2 for which the -percentage point of the distribution of S under exceeds .
Determine the nominal level to be used according to (i) for , as the largest real number such that there holds
Denoting the rejection probability of the resulting nonrandomized testing procedure at an arbitrary point falling on the boundary of the hypotheses of equation (1), i.e. with , by , it is not difficult to verify (for details of the proof, see supplemental Web Material, Part 1, Appendix A (II)) that there holds
The upper bound given by equation (6) to the size of the Poisson-Boschloo test is rarely sharp, due to the fact that for , the conditional rejection probability under H0 typically falls below the nominal level obtained in Step (iii), whereas equation (6) would hold true even when could take on value for each . Moreover, it is worth noticing that even when the upper bound given by equation (6) is actually attained, the degree of anticonservatism can be kept below any limit of practical relevance through choosing sufficiently small. Another property of interest of the Poisson-Boschloo test introduced above is that its rejection probability at the boundary of H0 converges to α as , again for arbitrarily fixed sample sizes m, n. (For a formal proof of this fact, see supplemental Web Material, Part 1, Appendix A (II).)
Given the sample sizes, the target significance level and also the constant to be chosen in Step (ii) of the construction, the result obviously depends on the choice of the endpoint of the subintervall in the sample space of S within which increasing the conditional nominal level shall be done. In the subsequent section, we will, among other things, find out through numerical comparisons what choice of provides the highest power against selected specific alternatives.
The effort entailed in a thorough study of the level and power properties of any version of the conditional test (including the Poisson-Boschloo procedure) can be reduced considerably through taking in account the fact that the rejection probability under an arbitrary parameter constellation depends for fixed values of α, and , on only through and . This becomes obvious from the expressions for the parameter π and of the conditional distribution of and the marginal distribution of S, respectively. Hence, calculating the rejection probability for different combinations of n and λ2 with the same value of produces the same result. Accordingly, the full information about the behavior of the test in terms of its rejection probability at parameter points moving along the line for fixed ϱ and varying size n of the reference sample is carried by a suitably defined function of . For the Poisson-Boschloo test, this function is given by
where and are computed from with and π stands for . Setting , equation (7) can be used for assessing the ordinary nonrandomized version of the UMPU test at nominal level α. In studying the rejection probability of the randomized UMPU test itself under parameter constellations with fixed event-rate ratio
replaces of equation (7) as the function of interest. Throughout, the value of μ2 corresponding to as determined in Step (ii) of the construction of the Poisson-Boschloo test, will be denoted .
3 Numerical results on power and sample sizes for one-sided testing procedures
3.1 The one-sided Poisson-Boschloo test
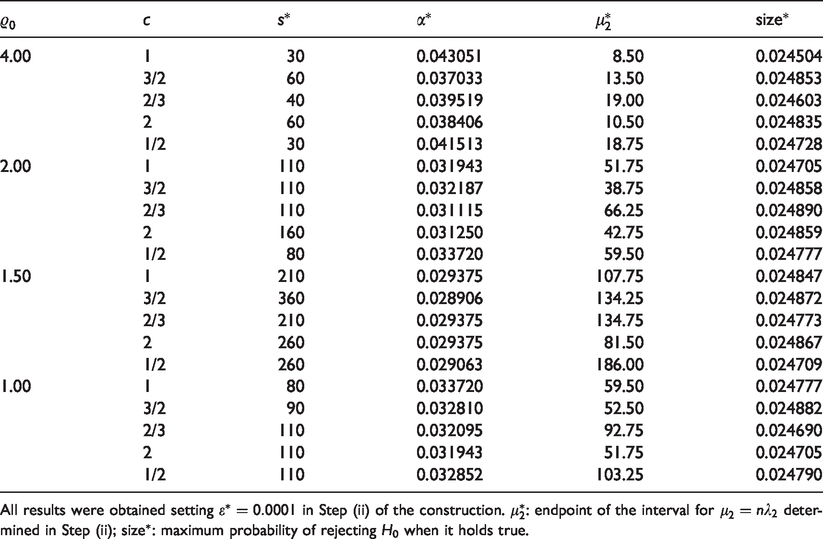
Table 1 shows for a selection of choices of the boundary of the hypotheses to be tested and the sample size ratio c the results obtained in Steps (i)–(iii) of the construction described in the previous section. The tabulated values of are those required to guarantee that the power function of the Poisson-Boschloo test at target significance level against null alternatives, i.e. under parameter constellations satisfying reaches, except for a practically negligible difference, a target value of 80% at the same point in the parameter space of μ2 as the randomized UMPU test.
Increased nominal significance levels to be used for in the modified Boschloo test for the problem (1) at target level .
c
4.00
1
30
0.043051
8.50
0.024504
3/2
60
0.037033
13.50
0.024853
2/3
40
0.039519
19.00
0.024603
2
60
0.038406
10.50
0.024835
1/2
30
0.041513
18.75
0.024728
2.00
1
110
0.031943
51.75
0.024705
3/2
110
0.032187
38.75
0.024858
2/3
110
0.031115
66.25
0.024890
2
160
0.031250
42.75
0.024859
1/2
80
0.033720
59.50
0.024777
1.50
1
210
0.029375
107.75
0.024847
3/2
360
0.028906
134.25
0.024872
2/3
210
0.029375
134.75
0.024773
2
260
0.029375
81.50
0.024867
1/2
260
0.029063
186.00
0.024709
1.00
1
80
0.033720
59.50
0.024777
3/2
90
0.032810
52.50
0.024882
2/3
110
0.032095
92.75
0.024690
2
110
0.031943
51.75
0.024705
1/2
110
0.032852
103.25
0.024790
All results were obtained setting in Step (ii) of the construction. : endpoint of the interval for determined in Step (ii); : maximum probability of rejecting H0 when it holds true.
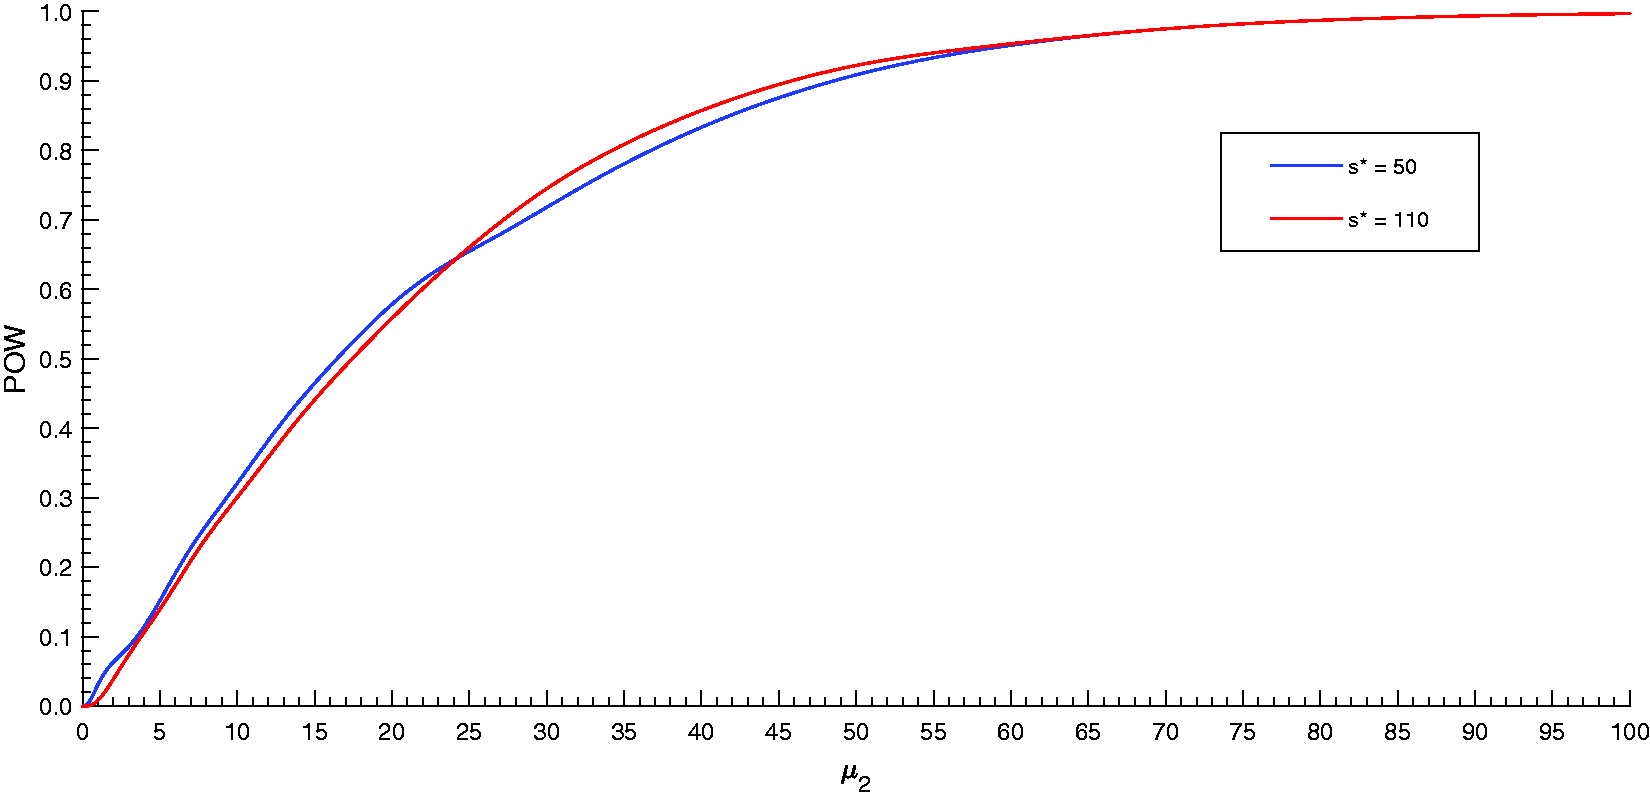
The impact on the shape of the power curves of different choices of the length of the interval in the sample space of S over which the process of increasing the nominal level is allowed to extend, can be seen from Figure 1 for , c =1, and . When interest is in detecting an alternative under which there holds and the expected number of events in the reference group falls in the interval , the choice yields the more powerful of both versions of the test. For , using for the construction of the Poisson-Boschloo test is preferable in terms of power, whereas for both power curves become indistinguishable up to 10 decimals. At , the power of the Poisson-Boschloo test corresponding to falls below that of the randomized UMPU test by less than . All values of to be read from Table 1 were determined to satisfy the condition that the power curve crosses the 80% line at (approximately) the same point as the power function of the randomized UMPU test.
Power of the Poisson-Boschloo test at target level for vs. against alternatives with for two different choices of the level-correction interval for the conditioning statistic S.
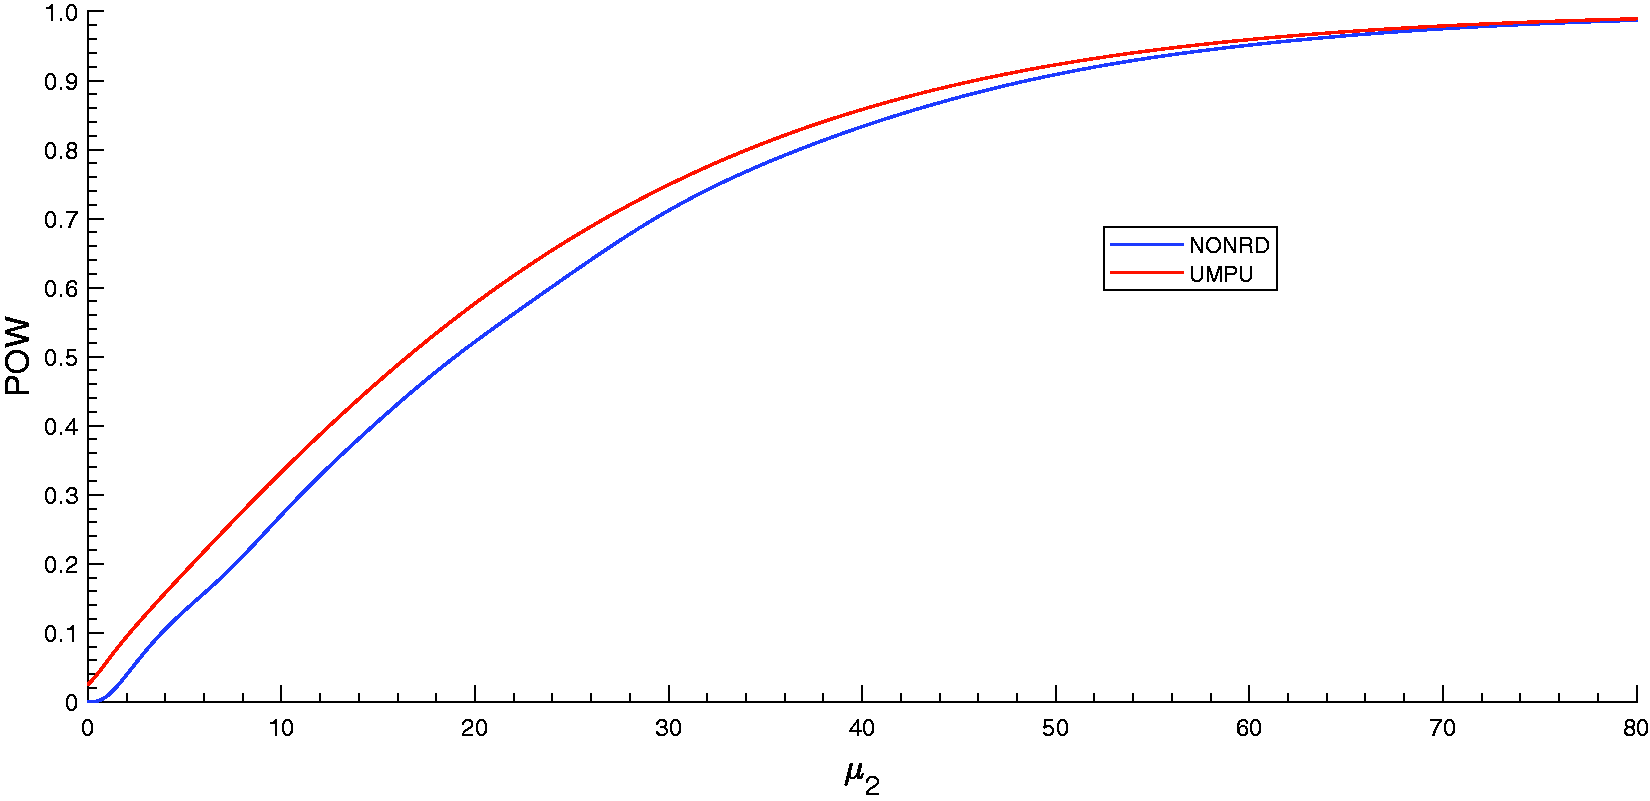
The fact that the power of the Poisson-Boschloo test against an arbitrarily selected alternative can be aligned with that of the randomized UMPU test considerably facilitates basic tasks to be dealt with in applying the procedure. Actually, the computational effort entailed in power analyses is distinctly lower for both the randomized UMPU test and its conservative nonrandomized version as compared with the Boschloo-type test since determining the critical region of the latter requires iteration on the nominal level to be used on . (In SAS/IML, computing the correct value of for the settings covered by Table 1 took between 7 and 45.5 s of execution time, on a Windows 10 64-bit PC with an Intel Xeon CPU.) Inspecting, for example, the pair of power curves shown in Figure 2, the following quantitative statements can be made.
Power of the randomized UMPU test at level for vs. and its conservative nonrandomized version against alternatives with . [Sample size ratio c =1.]
The largest margin for compensating the lack of power entailed by discarding randomized decisions between the hypotheses is available for alternatives with .
In order to maintain a target power of 80%, the expected number μ2 of events per group must be 9.7% larger when the conservative test is used instead of the Poisson-Boschloo test.
The possibility of making the Poisson-Boschloo procedure against a specific alternative of interest almost as powerful (in rare cases even a bit more powerful) as the UMPU test can in particular be exploited for nearly exact sample size planning of two-arm trials with Poisson-distributed endpoint. Given the boundary of the hypotheses to be tested, the target significance level α, the desired minimum level of power and the sample size ratio c for the random allocation procedure, the steps to be taken for that purpose are as follows.
Specification of the assumed true expected value λ1 and λ2 of an individual observation Xi and Yj from the experimental and reference arm of the study, respectively, with = .
Computation of the power function of the UMPU test (recall equation (8)) and solving numerically the equation for μ2.
Computation of the required sample sizes as and , with denoting the value obtained in Step 2.
Determination of that value of which yields the Poisson-Boschloo test whose power function approaches at as closely as possible.
As an example, let us take a noninferiority trial with margin and a power of 80% to be attained against the alternative in the test at target level with sample size ratio c =3/2. Starting from these specifications, one obtains as the result of Step (2) . Accordingly, the required sample sizes are . From the entries in line 12 of Table 1 it is seen that in order to reject with these sample sizes the null hypothesis with probability being almost equal to 80% in a Poisson-Boschloo testing procedure, one has to perform the conditional binomial test of versus at nominal level for all , and at unmodified nominal level for all larger values of s.
Part 2 of the supplemental Web Material contains a SAS/IML script named pobo_sast which computes for fixed α, m and n and known the values of and . The program accepts also noninteger values of m or n, and when running it with instead of (m, n), the value output as lambda2_ast is that of . The program named find_sast computes likewise for given α, m, n and under an alternative against which the randomized UMPU test attains power as that multiple of 5 for which the power of the Poisson-Boschloo test exhibits the smallest difference from . For both programs, R versions are provided as well. All numerical results presented in the paper were obtained using the SAS/IML scripts.
3.2 Comparisons with alternative approaches
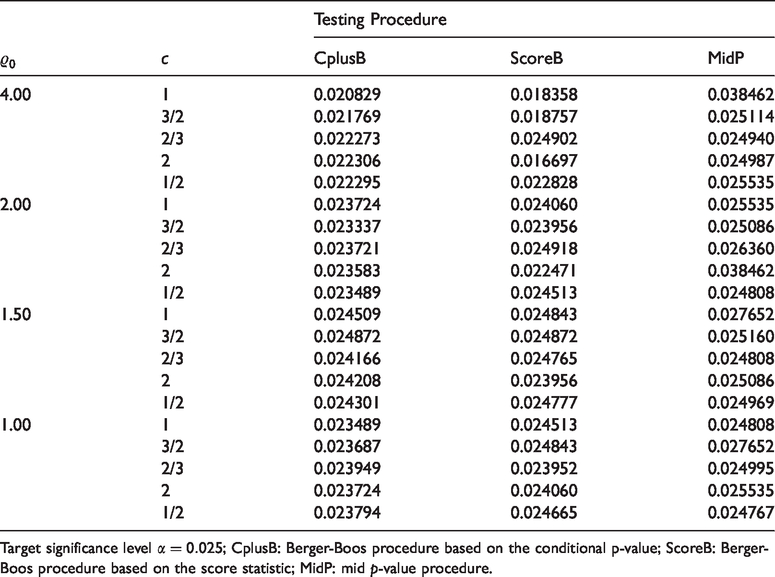
The results found by Shan9 in a comparative study of different procedures of testing for superiority in the Poisson two-sample setting suggest that the most promising alternative solutions to the one-sided testing problem (1) are those obtained by applying the construction proposed by Berger and Boos21 with either the conditional p-value (2) or the log-transformed score statistic as basic building blocks. Table 2 shows the sizes (rejection probabilities under H0 maximized over a sufficiently long interval in the space of the nuisance parameter μ2) of these two tests and the mid p-value method, a very popular pragmatic approach to removing the over-conservatism of nonrandomized conditional tests for discrete families of distributions (see, e.g., Agresti22). The scenarios covered by Table 2 are the same as those to which Table 1 relates. The results obtained for the two variants of the Berger-Boos approach confirm what is known from theory, namely that any test constructed by means of this device is strictly valid in terms of the significance level. In contrast, the mid-p procedure, for which the discrepancy between size and target level is distinctly smaller as compared with the nonrandomized conditional test, sometimes entails marked exceedances of the level.
Rejection probability under H0 maximized over () of three competitors to the one-sided Poisson-Boschloo test for the same choices of , c and as considered in Table 1.
Testing Procedure
c
CplusB
ScoreB
MidP
4.00
1
0.020829
0.018358
0.038462
3/2
0.021769
0.018757
0.025114
2/3
0.022273
0.024902
0.024940
2
0.022306
0.016697
0.024987
1/2
0.022295
0.022828
0.025535
2.00
1
0.023724
0.024060
0.025535
3/2
0.023337
0.023956
0.025086
2/3
0.023721
0.024918
0.026360
2
0.023583
0.022471
0.038462
1/2
0.023489
0.024513
0.024808
1.50
1
0.024509
0.024843
0.027652
3/2
0.024872
0.024872
0.025160
2/3
0.024166
0.024765
0.024808
2
0.024208
0.023956
0.025086
1/2
0.024301
0.024777
0.024969
1.00
1
0.023489
0.024513
0.024808
3/2
0.023687
0.024843
0.027652
2/3
0.023949
0.023952
0.024995
2
0.023724
0.024060
0.025535
1/2
0.023794
0.024665
0.024767
Target significance level ; CplusB: Berger-Boos procedure based on the conditional p-value; ScoreB: Berger-Boos procedure based on the score statistic; MidP: mid p-value procedure.
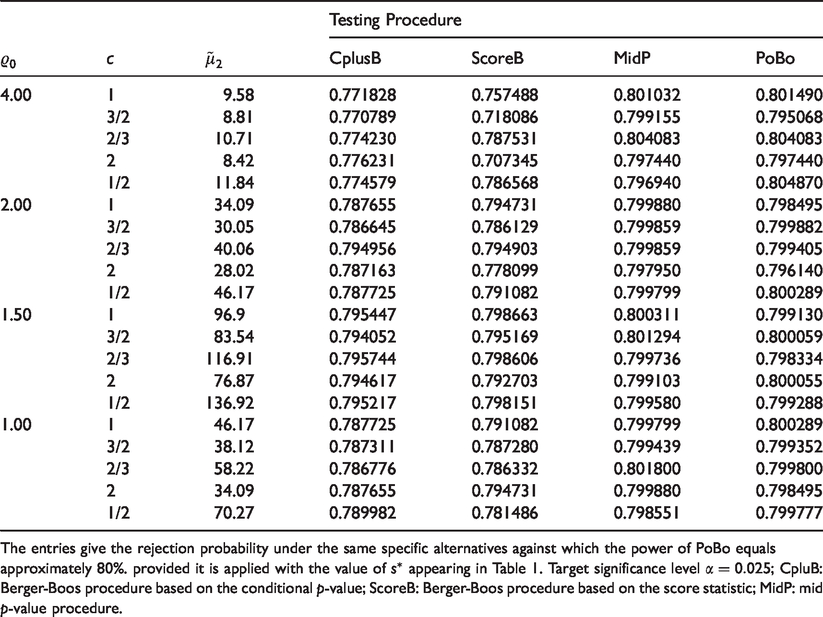
Table 3 shows the power of both variants of the Berger-Boos procedure and the mid-p test against the same null alternatives detected by the one-sided Poisson-Boschloo procedure (with specified as in Table 1) with probability , together with the exact power attained by the latter. Whereas the differences in power between the mid-p approach and the Poisson-Boschloo test are negligible throughout, the results for the Berger-Boos procedures are not as uniform: Substantial losses in power as compared with the new test are seen for the settings with the largest value of the common boundary of the hypotheses, and the differences between CplusB (Berger-Boos test based on the conditional p-value) and ScoreB (score-statistic based Berger-Boos test) depend both on and the sample-size ratio c. In no case, substantial inferiority in terms of power of CplusB as compared with ScoreB was found, whereas there are settings (e.g. , c =1.5) in which CplusB produces a rejection region being a proper superset of that of ScoreB.
Power comparisons between the one-sided Poisson-Boschloo test (PoBo) and the tests evaluated in Table 2 in terms of their level properties.
Testing Procedure
c
CplusB
ScoreB
MidP
PoBo
4.00
1
9.58
0.771828
0.757488
0.801032
0.801490
3/2
8.81
0.770789
0.718086
0.799155
0.795068
2/3
10.71
0.774230
0.787531
0.804083
0.804083
2
8.42
0.776231
0.707345
0.797440
0.797440
1/2
11.84
0.774579
0.786568
0.796940
0.804870
2.00
1
34.09
0.787655
0.794731
0.799880
0.798495
3/2
30.05
0.786645
0.786129
0.799859
0.799882
2/3
40.06
0.794956
0.794903
0.799859
0.799405
2
28.02
0.787163
0.778099
0.797950
0.796140
1/2
46.17
0.787725
0.791082
0.799799
0.800289
1.50
1
96.9
0.795447
0.798663
0.800311
0.799130
3/2
83.54
0.794052
0.795169
0.801294
0.800059
2/3
116.91
0.795744
0.798606
0.799736
0.798334
2
76.87
0.794617
0.792703
0.799103
0.800055
1/2
136.92
0.795217
0.798151
0.799580
0.799288
1.00
1
46.17
0.787725
0.791082
0.799799
0.800289
3/2
38.12
0.787311
0.787280
0.799439
0.799352
2/3
58.22
0.786776
0.786332
0.801800
0.799800
2
34.09
0.787655
0.794731
0.799880
0.798495
1/2
70.27
0.789982
0.781486
0.798551
0.799777
The entries give the rejection probability under the same specific alternatives against which the power of PoBo equals approximately 80%. provided it is applied with the value of appearing in Table 1. Target significance level ; CpluB: Berger-Boos procedure based on the conditional p-value; ScoreB: Berger-Boos procedure based on the score statistic; MidP: mid p-value procedure.
4 Construction of a Boschloo-type test for establishing equivalence in the Poisson two-sample setting
When interest is in establishing equivalence in the strict, i.e. two-sided sense, the testing problem for which a solution is needed reads
where the equivalence margins are positive real numbers such that . In close analogy with the one-sided problem, the basic building block to be used for constructing a conditional test for equation (9) is obtained by solving the testing problem
concerning the parameter π of a binomial distribution from which a single sample of size is available, with equivalence limits to be set equal to
As holds true for its one-sided counterpart, the conditional equivalence problem (10) admits an exact optimal (precisely: uniformly most powerful) solution which involves randomized decisions between the hypotheses to be taken at the boundary of the rejection region. This time, the boundary consists of two rather than a single point in the sample space of X. . Referring to Wellek,20 section 4.3, we know that for any fixed s, the UMP test for equation (10) is defined by four critical constants and which can be determined by solving the following system of equations
As before [recall equation (2)], denotes the probability mass function of a binomial distribution with parameters s and π.
The (randomized) UMP test for equation (10) rejects if falls in the open interval . For or , the null hypothesis of equation (10) has to be accepted, whereas for and , one has to decide in favor of equivalence with probability and , respectively. Applying this decision rule for any realized value s of the total count S of events yields an exact UMPU test for the problem (9) of testing for equivalence of two Poisson distributions from which independent samples of sizes m and n were taken.
The equivalence analogue of formula (3) for the rejection probability of the randomized UMPU test under any parameter constellation reads
with and . Exact values of the rejection probability of the conservative nonrandomized version of the UMPU test are obtained by omitting from equation (13) both terms containing and , respectively. As in the one-sided case, using these formulas for numerical computations requires to truncate the range of summation on the right at a point chosen sufficiently large in order to keep the error below the prespecified limit . The most time-consuming step in evaluating the corresponding finite sums is the determination of the critical constants and (of which the latter two are only needed when external randomization is admitted). Fortunately, a fairly efficient iteration algorithm has been designed for this purpose by Wellek,20 p. 43 and implemented both in SAS/IML and R (with the R-version being contained in the package EQUIVNONINF ready for download from the CRAN server).
The computational procedure which yields in the equivalence case the values of and is fully analogous to that described in section 2 for the one-sided problem. Applying Boschloo’s technique without restriction on S would lead to replace equation (4) with
Denoting by and the rejection probability of the nonrandomized conditional test at nominal level α under any with and , respectively, we can state in direct analogy with equation (5) that for any α and fixed sample sizes m, n, there holds
Similarly, the proposed Boschloo-type construction ensures that in the equivalence case, the limiting inequality (6) holds at both boundaries of the hypotheses. Precisely speaking, denoting the rejection probability of the Poisson-Boschloo test for equivalence at any with by , we have
both for ν = 1 and ν = 2.
For purposes of investigating level and power properties of the testing procedures under comparison, it is convenient to take advantage also in the equivalence case of the fact that the rejection probability of each test depends on the selected parameter constellation and the sample sizes m, n only through and μ2, where and μ2 denotes the expected number of events in the reference arm of the study. So, formula (13) can be rewritten
The analogous formula for the Poisson-Boschloo test for equivalence reads
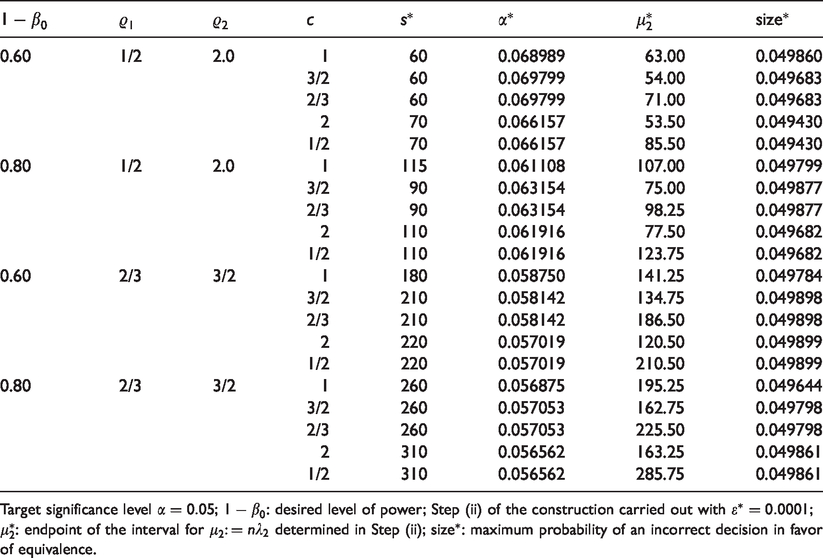
Table 4 shows the values of the constants characterizing the Poisson-Boschloo test for equivalence at target significance level for two different choices of the margins and the desired level of power. The tabulated values of were determined in the same way as in the noninferiority case, namely through aligning the power functions of the Poisson-Boschloo and the randomized UMPU test against that specific null alternative (parameter configuration with ) under which the latter maintains a power of 60% and 80%, respectively. In investigating numerous other parameter configurations and different choices of the desired power , we found that, except for practically negligible differences between the power of the Poisson-Boschloo test and , such an alignment could always be effected. This result suggests to consider sample sizes calculated for the exact UMPU test as almost exact values for the number of observations required in order to attain some pre-specified level of power in the Poisson-Boschloo test for equivalence. The adaptation of the algorithm proposed in the previous section for that purpose to the equivalence case is largely self-explanatory.
Increased nominal significance levels to be used for in the Poisson-Boschloo test for equivalence.
c
0.60
1/2
2.0
1
60
0.068989
63.00
0.049860
3/2
60
0.069799
54.00
0.049683
2/3
60
0.069799
71.00
0.049683
2
70
0.066157
53.50
0.049430
1/2
70
0.066157
85.50
0.049430
0.80
1/2
2.0
1
115
0.061108
107.00
0.049799
3/2
90
0.063154
75.00
0.049877
2/3
90
0.063154
98.25
0.049877
2
110
0.061916
77.50
0.049682
1/2
110
0.061916
123.75
0.049682
0.60
2/3
3/2
1
180
0.058750
141.25
0.049784
3/2
210
0.058142
134.75
0.049898
2/3
210
0.058142
186.50
0.049898
2
220
0.057019
120.50
0.049899
1/2
220
0.057019
210.50
0.049899
0.80
2/3
3/2
1
260
0.056875
195.25
0.049644
3/2
260
0.057053
162.75
0.049798
2/3
260
0.057053
225.50
0.049798
2
310
0.056562
163.25
0.049861
1/2
310
0.056562
285.75
0.049861
Target significance level ; : desired level of power; Step (ii) of the construction carried out with ; : endpoint of the interval for determined in Step (ii); : maximum probability of an incorrect decision in favor of equivalence.
5 Illustrating examples
5.1 Establishing superiority of azathioprine over beta interferon in the treatment of relapsing-remitting multiple sclerosis
Counting relapses is a standard option for assessing the efficacy of treatments of the relapsing-remitting multiple sclerosis (RRMS), and the Poisson distribution is the classical model for inference on counting data of any provenance. The trial reported by Massacesi et al.,23 which compared azathioprine (AZA) to beta interferon (INF) in the treatment of RRMS, is one out of a large number of studies using the number of relapses counted during the follow-up period as primary outcome criterion. Expressed in the notation used in the preceding sections, Massacesi et al.23 obtained the following findings
Drug
# Relapses
# Patient Years
EstimatedRelapse Rate
AZA
33
126(m)
IFN
52
132(n)
Testing with these data for superiority of AZA over IFN (where “superiority” means that the relapse rate in the underlying population is small as compared with RRMS patients treated with IFN) yields the conditional p-value
where 0.4884 is the value of and hence of π0. Setting, as is common practice for one-sided testing problems, , this p-value clearly fails to be significant.
In view of this negative result, it is tempting to address the question of how a replication trial would have to be designed in order to attain a power of 80% in the Poisson-Boschloo test of equation (1) with against the alternative [← observed alternative from the existing trial]. Assuming that the trial under planning has to be balanced in terms of the number of patient years and adopting the algorithm established in section 3, we have to solve the equation , yielding, by means of the SAS/IML script powtarg_of_mu2_1s.sas listed in Part 2 of the supplemental Web Material, . Assuming that the true relapse rate for the INF arm coincides with the estimate obtained by Massacesi et al.,23 this implies that the numbers of patient years needed for the future trial are given by . In the final step of the planning procedure, we have to determine the cut-off value for the conditioning statistic S to be used in the Boschloo-type construction for ensuring that the resulting nonrandomized test differs in power against the alternative from that of the exact UMPU test as little as possible. By means of the SAS/IML script find_sast, we find , with as nominal level to be used on .
5.2 Testing for equivalence of different doses of mifepristone as emergency contraceptives
Another area of medical research where event counts are often considered as the outcome data of primary interest are studies of the effectiveness of contraceptive methods. Results of a trial of that kind were published in 1999 by an anonymous “Task Force on Post-ovulatory Methods of Fertility Regulation”.24 The treatments compared by this research group consisted of administering different doses of mifepristone, a chemical emergency contraceptive whose standard mode of application is in a dose of 600 mg within 72 h post an unprotected coitus. One of the primary hypotheses the members of the task force aimed to establish was that the dose of mifepristone could be reduced even to 10 mg without changing the efficacy of the drug to a relevant extent. The primary criterion of efficacy of the treatment was defined to be the number of conceptions occurring despite administration of the drug. The following values were obtained in the 10 mg group and the reference group (600 mg) of the study.
Dose
# Pregnant
# Enrolled
EstimatedFailure rate
10 mg
7
572
600 mg
7
570
Choosing and as equivalence margins to the risk ratio , the conditional test at level for the problem (9) cannot reject nonequivalence with these data. Actually, with , according to equation (11), the equivalence margins to ϱ translate to the equivalence interval for the parameter π of the conditional distribution of . With these values of π1, π2, the critical constants of the optimal test at the 5% level for the problem (10) with a sample of size from a binomial distribution are computed by means of the program bi1st of the R package EQUIVNONINF to be , which implies that the rejection region of the nonrandomized version of the test is empty. Running the SAS/IML program pobo_sast_eq provided in supplemental Web Material, Part 2, we find that the Poisson-Boschloo test of the same hypothesis can be carried out at nominal level for all . With the observed total s =14 of failures, the critical constants of the optimal test at level 6% for equation (10) are obtained, again by means of bi1st of EQUIVNONINF, to be , and . Hence, the observed value of is an inner point of the critical interval implying that the Poisson-Boschloo test leads to a decision in favor of equivalence in efficacy of both doses of mifepristone.
The fact that the interior of the critical interval to be checked for inclusion of the observed value of X. in the Poisson-Boschloo test consists just of a single point in the sample space, is in accordance with the low power of the test against the alternative , which, except for rounding up the value of to the nearest multiple of 0.01, conincides with what was observed. The latter can likewise be computed by means of the SAS/IML script pobo_sast_eq, which yields, evaluating the right-hand side of equation (18) with the appropriate specifications, POW = 0.08426 so that the chance of rejecting nonequivalence under the parameter configuration corresponding to the observed alternative was only slightly larger than the target significance level. In view of this result, there arises the question of what sample sizes would be needed to raise the level of power to 80% in a replication trial using 1:1 randomization and the same choice of the equivalence margins to ϱ as in the current trial. Assuming that the true failure rate coincides for both dose groups with the rate observed in the current trial after administration of the high dose so that there holds , the expected number of events in the reference arm required for the randomized UMPU test is computed (by means of the SAS/IML script powtarg_of_mu2_eq) to be yielding as the required sample sizes. Finally, the constants defining a Boschloo-type test maintaining almost exactly the target power of 80% under the selected scenario are obtained (by means of powtarg_of_mu2_eq) to be , and .
6 Discussion
Boschloo’s2 technique of constructing powerful nonrandomized tests, which has been proved useful both for the unpaired (see Wellek,19 Wellek,20 section 6.6, Wellek18) and the paired data setting (cf. Wellek,20 section 5.1, Wellek18) with binary observations, cannot be adopted in a straightforward manner for the two-sample setting with Poisson-distributed data. The reason behind this statement is the fact that for whatever fixed sample sizes, the rejection probability of the conservative nonrandomized version of the conditional test at the common boundary of the hypotheses converges to the nominal significance level as the event rate for the reference arm of the study increases to infinity. Hence, using an increased nominal level for every value of the conditioning statistic S would yield a test which fails to be valid in terms of the significance level. The crucial step in carrying out a Boschloo-type construction anyway is to truncate the range of values of S for which the nominal level is increased above the target level, on the right by a suitably chosen cut-off denoted in the preceding sections. For values of S exceeding , the nominal level is left unchanged.
The algorithms and programs we used for computing the size of the critical regions derived from the conditional distribution of given S and the maximally admissible nominal levels for the Boschloo-type tests rely on the assumption that the rejection probability of those tests under the null hypothesis takes on its maximum on the boundary of H0. In other words, it is assumed that in order to determine the greatest value of the rejection probability, it suffices to search through the set and in the one-sided case and the case of two-sided equivalence, respectively. In the one-sided case, the correctness of this assumption is guaranteed by the fact rigorously proven in the supplemental Web Material, Part 1, Appendix B that the rejection probability of any test of that form is a decreasing function of λ1 for any fixed λ2. In the equivalence case, plotting the analogous function of λ1 yields, again for arbitrarily fixed λ2, an upward-convex curve with a unique maximum being reached at an inner point of the interval (for a graph showing a typical example see Appendix B in Part 1 of the supplemental Web Material). Clearly, upward convexity of each such curve implies that the rejection probability over the sub-parameter space corresponding to the null hypothesis or is indeed largest at its boundary. In contrast to the monotonicity result in the one-sided case, no analytical proof of the convexity property is available. However, in a large number of special cases investigated numerically, no exception was found.
Among the numerous tests which have been proposed in the existing literature for the one-sided problem (1), in particularly widespread practical use are asymptotic techniques based on the maximum likelihood estimator (MLE) for the log-transform of the target parameter . The small-sample properties of both versions of the MLE-based test for equation (1), which differ with respect to the way of estimating the variance of the MLE (full versus restricted likelihood), were extensively studied by Stucke and Kieser,6 likewise by means of exact numerical methods. Both of these asymptotic tests are not tailored for providing exact control of the type-I error risk and might become grossly anticonservative. For instance, for and , the exact rejection probability under H0 of the score test at nominal level reaches at the value 0.04347 although, according to the results of Stucke and Kieser,6 the score test is the less anti-conservative of the two versions of the asymptotic test. Another procedure being fairly popular among statistical practitioners is the p-value method which, although based on the exact conditional distribution of the sufficient statistic for the target parameter, likewise fails to guarantee that the size of the corresponding test of the hypotheses (1) does not exceed the significance level. However, as can be seen from the numerical results obtained in section 3.2, marked deviations of the size of the mid-p test in the undesirable direction are rare. In the majority of settings, the test does not exhaust the level.
An alternative approach which combines exact maintenance of the level with reducing the conservatism due to nonadmission of randomized decision making between the hypotheses, is the technique established by Berger and Boos21 relying on maximization of p-values over confidence intervals for the nuisance parameter. Validity in terms of the level is an inherent property of the corresponding tests, and their power often yet not always comes close to that of the Poisson-Boschloo procedure. Among the settings covered by Table 4, there are cases in which the Berger-Boos approach entails a substantial loss in power as compared with Poisson-Boschloo, and such constellations typically occur when the noninferiority margin is chosen large. Even when the differences in power are negligible, there remains one major practical advantage of the Boschloo over the Berger-Boos device: Given the level, the boundary of the hypotheses and the sample-size ratio, carrying out the Boschloo-type test requires only a single step of maximization leading to the largest admissible nominal level , which can be done in planning a study, i.e. prior to the availability of data. In contrast, a Berger-Boos type p-value has to be computed for the realized values of both total event counts and thus at a point in an infinite sample size which is not known before the end of the study.
A feature of the Boschloo-type construction which might be viewed as a disadvantage is that the resulting testing procedures have no analogues for problems arising from measuring the dissimilarity of two Poisson distributions in terms of δ, i.e. the difference rather than the ratio of the event rates under assessment. However, it should be kept in mind that formulating in the noninferiority case the alternative hypothesis to be established as entails some logical flaw which can be avoided by replacing δ with ϱ as the parameter of interest. Actually, boundedness of the parameter space in which the λ’s take their values to the left by zero, implies that a noninferiority hypothesis of the form is not a statement about δ per se, simply because for sufficiently small values of λ1, the inequality making up δ-noninferiority is automatically satisfied, irrespective of the value of the reference rate λ2. Assume, for example, that the noninferiority margin is set equal to 0.15. Then, in terms of δ, every experimental treatment with will be noninferior to any reference treatment.
A natural question to raise is whether Boschloo’s approach can also be used as a basis for computing confidence limits for the ratio of two Poisson means improving the accuracy of interval estimates obtained by means of the nonrandomized conditional test. In principle, the answer is yes, due to the well-known duality theorem ensuring the existence of a 1:1 correspondence between interval estimation procedures and families of hypotheses tests. However, exploiting this general result for inverting the Poisson-Boschloo test derived in Section 3 for varying values of into upper confidence bounds for requires a strategy for determining the cutoff for the conditioning statistic S in a data-independent way as a function of . Developing a computationally efficient algorithm for finding the largest for which the realized value of falls in the acceptance region of the Poisson-Boschloo test is a topic for future research.
Supplemental Material
SMM900901 Supplemental material - Supplemental material for On powerful exact nonrandomized tests for the Poisson two-sample setting
Supplemental material, SMM900901 Supplemental material for On powerful exact nonrandomized tests for the Poisson two-sample setting by Stefan Wellek in Statistical Methods in Medical Research
Footnotes
Declaration of conflicting interests
The author(s) declared no potential conflicts of interest with respect to the research, authorship, and/or publication of this article.
Funding
The author(s) received no financial support for the research, authorship, and/or publication of this article.
ORCID iD
Stefan Wellek
Supplemental material
Supplemental material is available for this article online.
References
1.
LehmannELRomanoJP.Testing statistical hypotheses. 3rd ed.New York, NY:
Springer, 2005.
2.
BoschlooRD.Raised conditional level of significance for the 2 x 2-table when testing the equality of two probabilities.Statistica Neerlandica1970;
24: 1–35.
3.
PrzyborowskiJWilenskiH.Homogeneity of results in testing samples from Poisson series. Biometrika1939;
31: 313–323.
4.
HoelPG.Testing the homogeneity of Poisson frequencies. Ann Math Statistics1945;
16: 362–368.
5.
LehmannEL.Testing statistical hypotheses.
New York, NY:
John Wiley & Sons Inc, 1959.
6.
StuckeKKieserM.Sample size calculations for noninferiority trials with Poisson distributed count data.Biometrical J2013;
55: 203–216.
7.
BrightBCSoulakovaJN.Wald-type testing and estimation methods for asymmetric comparisons of Poisson rates. Stat Biopharmaceut Res2015;
7: 1–11.
8.
ChiuSN.Parametric bootstrap and approximate tests for two Poisson variates. J Stat Computat Simulat2010;
80: 263–271.
9.
ShanG.Exact unconditional testing procedures for comparing two independent Poisson rates. J Stat Computat Simulat2015;
85: 947–955.
10.
KrishnamoorthyKLeeM.New approximate confidence intervals for the difference between two Poisson means and comparison. J Stat Computat Simulat2013;
83: 2232–2243.
11.
LiHQTangMLWongWK.Confidence Intervals for ratio of two Poisson rates using the method of variance estimates recovery.J Computat Stat2014;
29: 869–889.
12.
ShanG.Exact sample size determination for the ratio of two incidence rates under the Poisson distribution. Computat Stat2016;
31: 1633–1644.
13.
XiaoMJiangTZhangH, et al.
Exact one-sided confidence limit for the ratio of two Poisson rate. Stat Biopharmaceut Res2017;
9: 180–185.
14.
MenonSMassaroJLewisJ, et al.
Sample size calculation for Poisson endpoint using the exact distribution of difference between two Poisson random variables. Stat Biopharmaceut Res2011;
3: 497–5045.
15.
LuiK-J.Sample size calculation for testing non-inferiority and equivalence under Poisson distribution. Stat Methodol2005;
2: 37–48.
16.
KrishnavamoorthyKThomsonJ.A more powerful test for comparing two Poisson means. J Stat Plan Inference2004;
119: 23–35.
17.
McDonaldLLDavisBMMillikenGA.A nonrandomized unconditional test for comparing two proportions in a 2 × 2 contingency table. Technometrics1977;
19: 145–150.
18.
WellekS.Nearly exact sample size calculation for powerful nonrandomized tests for differences between binomial proportions. Statistica Neerlandica2015;
69: 358–373.
19.
WellekS.Statistical methods for the analysis of two-arm non-inferiority trials with binary outcomes.Biometric J2005;
47: 48–61.
20.
WellekS.Testing statistical hypotheses of equivalence and noninferiority. 2nd ed.
Boca Raton, FL:
Chapman & Hall/CRC, 2010.
21.
BergerRLBoosDD.P values maximized over a confidence set for the nuisance parameter. J Am Stat Assoc1994;
89: 1012–1016.
22.
AgrestiA.A survey of exact inference for contingency tables (with discussion). Stat Sci1992;
77: 131–177.
23.
MassacesiLTramacereIAmorosoS, et al.
Azathioprine versus beta interferons for relapsing-remitting multiple sclerosis: a multicentre randomized non-inferiority trial.PLoS ONE2014;
9: e113371.
24.
Task Force on Post-ovulatory Methods of Fertility Regulation. Comparison of three single doses of mifepristone as emergency contraception: a randomised trial. Lancet1999;
353: 697–702.
Supplementary Material
Please find the following supplemental material available below.
For Open Access articles published under a Creative Commons License, all supplemental material carries the same license as the article it is associated with.
For non-Open Access articles published, all supplemental material carries a non-exclusive license, and permission requests for re-use of supplemental material or any part of supplemental material shall be sent directly to the copyright owner as specified in the copyright notice associated with the article.