We thank Adimari et al.1 for providing an alternative way to show that our proposed non-monotone transformation in Yang et al.2 is optimal for binary classification with normally distributed data. However, the argument based on Neyman-Pearson lemma may not be easily generalizable to three-category classification data yet. The proposed non-monotone transformation in Yang et al.2 for three classes is derived without considering the likelihood ratio and can still improve the receiver operating characteristic analysis for biomarkers directly.
The following discussions are entirely confined to binary classification and we adopt the same notations as Adimari et al.1 We consider two practical issues concerning the likelihood ratio method. We note that in addition to producing the optimal area under ROC curve (AUC) for a single marker, the likelihood ratio transformation may also yield the best risk score for a general diagnostic setting with more than one marker. See chapters 4 and 9 of Pepe3 for more detailed discussions.
Transform or not? Check the monotonicity
Adimari et al.1 extended the likelihood ratio transformation to distributions beyond normal. There are some exceptions on this method that we must be mindful of. Specifically, we may need to decide whether such a transformation is indeed necessary. As mentioned earlier in Yang et al.,2 any monotone increasing transformation on the original marker values does not improve the AUC value. Sometimes the likelihood ratio transformation may result in a monotone function and therefore is unnecessary.
For example, for the exponential family, when there is only one parameter differing for the two classes, no transformation can improve the AUC of the original biomarker. In particular, when the two distributions are both normal with a common variance , then likelihood ratio transformation reduces to an increasing linear function. Another special case is gamma distribution with common α value (leading to an increasing linear transformation) or common β value (leading to a monotone increasing logarithm transformation).
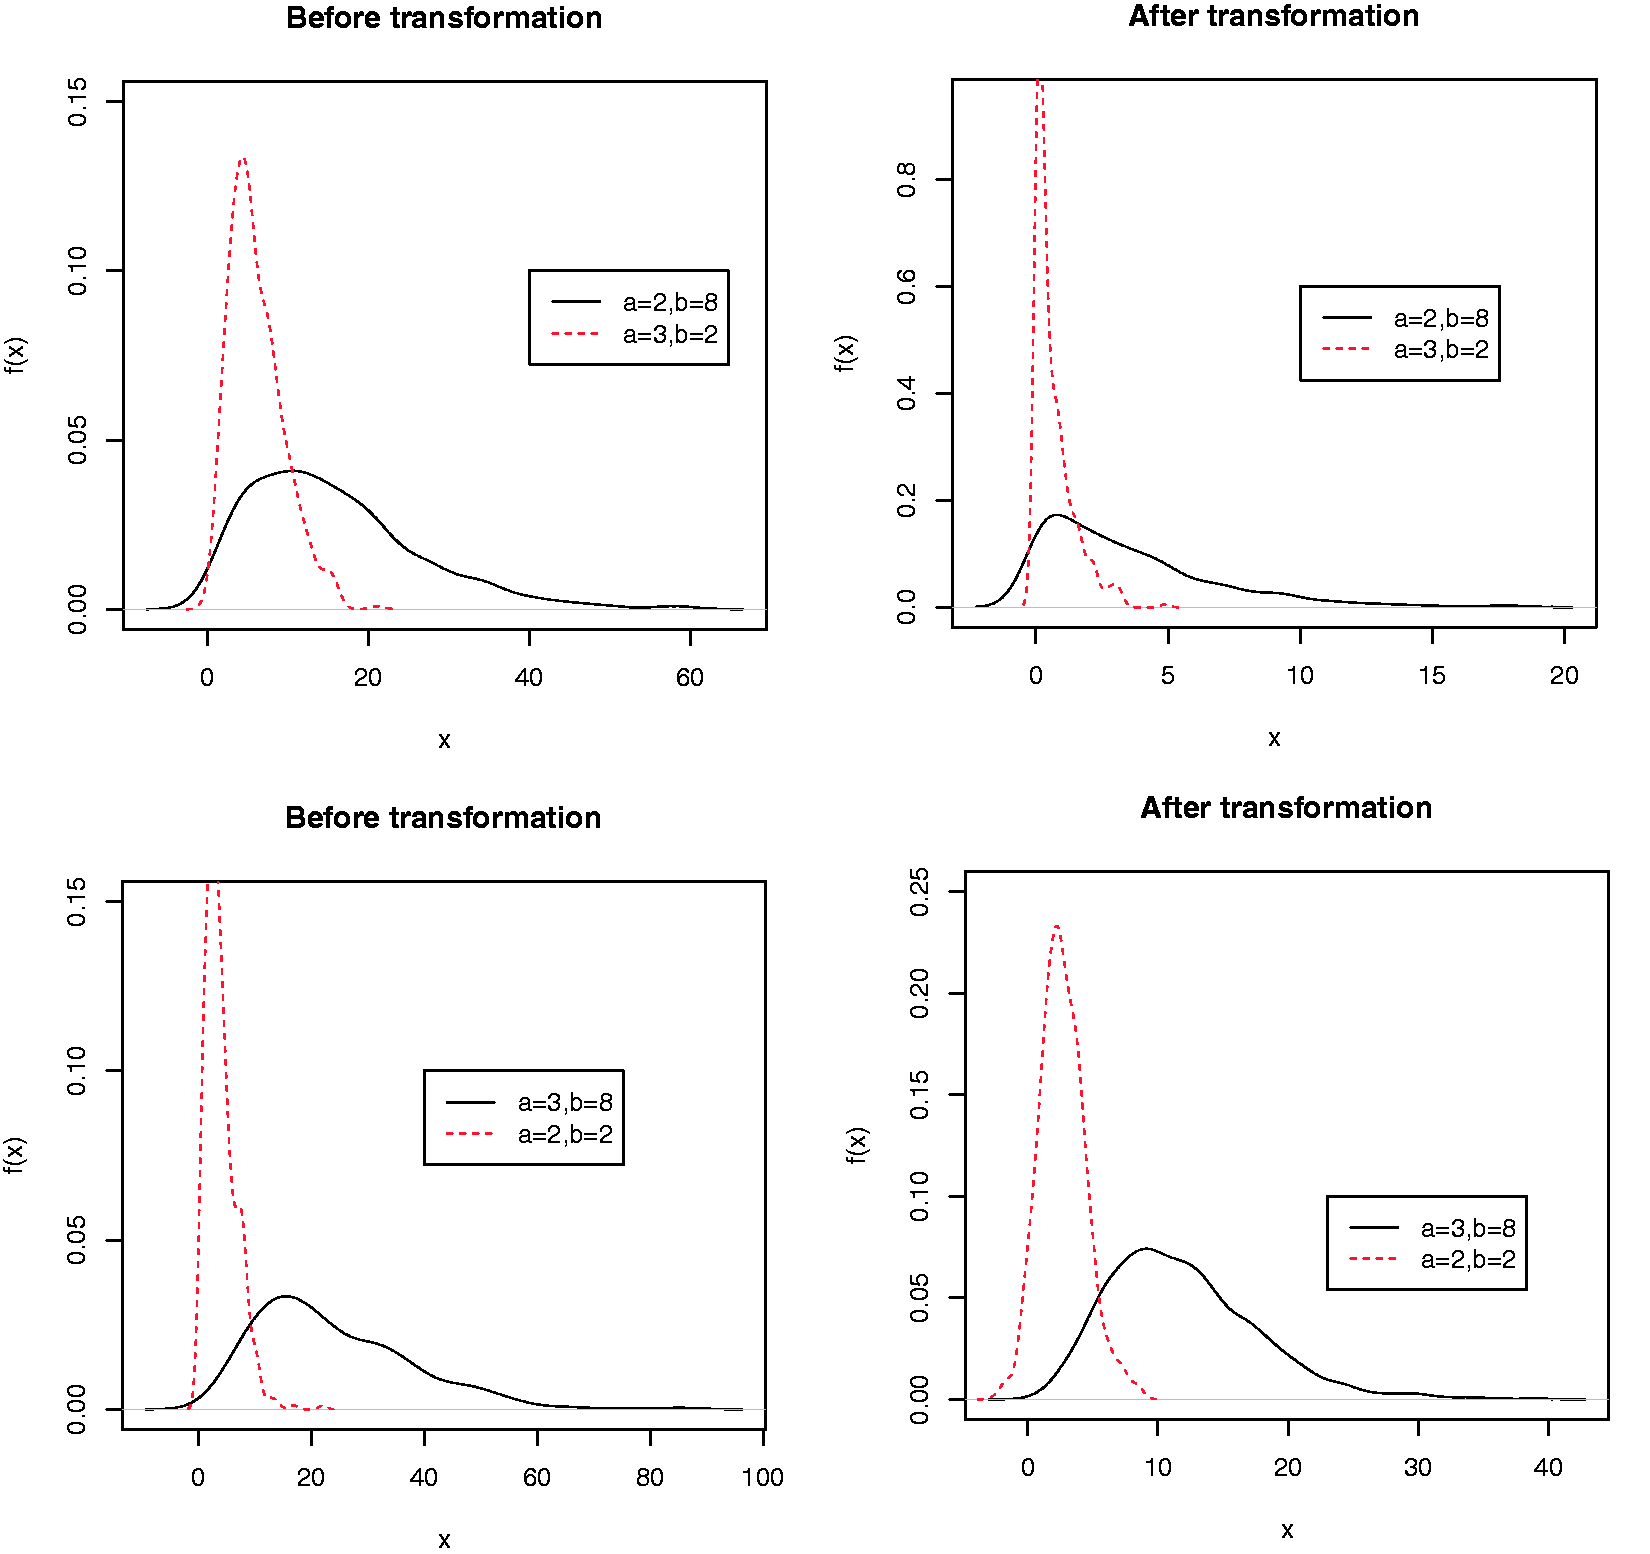
Furthermore, for gamma distribution, if is still reduced to a monotone increasing function of X and thus taking such a transformation does not affect the AUC. Only when , we can apply the non-monotone transformation in Adimari et al.1 to improve the AUC. See Figure 1 for an illustration.
The distribution for the original biomarkers (left panel) and transformed biomarkers (right panel) with gamma distributions. In the first row, and so the transformation g does not improve the separation of the two classes; in the second row, and the likelihood ratio transformation g significantly improves the discrimination of the two classes. Kernel density estimation is implemented with a simulated sample of size n =500.
Similarly, for Weibull distribution, if , the transformation reduces to a monotone polynomial function and thus is unnecessary. In particular, if , then the two Weibull variables become the exponential variables and do not require any transformation. We may carry out similar discussion for other parametric distributions. We leave those mathematical details out of this note.
Nonparametric transformation
One cannot directly apply the likelihood ratio transformation in Adimari et al.1 without checking the distributions and their parameter values for the two classes. To this end, one may apply quantile-quantile (QQ) plots or some hypothesis testing tools. Even though the normal distribution or the related log-normal distribution has been widely favored in diagnostic medicine, there are growing empirical evidence of distribution skewness for a large number of tests based on gene expressions from genomic studies.4,5 Heavy-tailed distributions such as gamma distribution, t distribution, or F distribution are thus employed for this purpose. In statistical literature, these distributions may find abundant applications in lifetime data or reliability analysis as well.6,7 Adimari et al.1 also pointed out that the two classes may come from two entirely different distributions instead of the same family of distributions with location and/or scale shifts. From our experiences with analyzing genetic biomarkers, we fully agree that it is plausible that the distributions for a diagnostic test may differ between two classes. For example, the distributions of BMI, a common marker for metabolic profiling, were found to be different between patients exposed to metformin monotherapy with type 2 diabetes (skewed to the right) and healthy normal subjects with no known metformin exposure (almost bell-shaped) in Orlenko et al.8 In addition, modern platforms for genomics data profiling including single cell RNQ-Seq have demonstrated differential (and complicated) gene expression distributions between two comparative groups such as mouse embryonic stem cell versus fibroblasts.9 In all these clinical and biological research studies, if it is difficult to determine the exact parametric distribution of the data, we may adopt a nonparametric estimation method to attain the best transformation.
Jin and Lu10 proposed a nonparametric approach to estimate the optimal transformation without knowing the true parametric distributions for the data. The density functions f1 and f2 for the two classes are directly estimated by the familiar kernel smoothing methods. Such computation can be effectively implemented using standard packages such as R and Stata. The resulting density estimators and can thus lead to the empirical transformation . Jin and Lu10 demonstrated via numerical examples that this transformation works well even when sample size for either group is only 50.
Another nonparametric estimation for likelihood ratio transformed biomarkers was developed in Lu et al.11 Their work was motivated from genome-wide association studies where researchers intended to develop predictive genetic tests for common complex diseases. In their study, the markers (single-nucleotide polymorphism or SNP) are discretely distributed and so estimation of f1 and f2 can be obtained by evaluating the sample proportions for cases and controls, respectively. The so-constructed transformation was then applied to yield optimal diagnostic performance to predict the type 1 diabetes.11
We believe that these model-free methods may provide more flexible and robust solution to improve the AUC for diagnostic tests or biomarkers.
Footnotes
Declaration of conflicting interests
The author(s) declared no potential conflicts of interest with respect to the research, authorship, and/or publication of this article.
Funding
The author(s) disclosed receipt of the following financial support for the research, authorship, and/or publication of this article: J. Yang was supported by the NNSF of China (No. 11701518) and Zhejiang Provincial Natural Science Foundation (No. LQ17A010011) and Zhejiang SCI-TECH University Foundation (No. 16062097-Y).
ORCID iDs
Jianping Yang
Jialiang Li
References
1.
AdimariDToDChiognaM. Letter to the editor: non-monotone transformation of biomarkers. Stat Methods Med Resin press.
2.
YangJKuanPLiJ. Non-monotone transformation of biomarkers to improve diagnostic and screening accuracy in a DNA methylation study with trichotomous phenotypes. Stat Methods Med Resin press.
3.
PepeMS.The statistical evaluation of medical tests for classification and prediction.
Cambridge:
Cambridge Press, 2003.
4.
NewtonMKendziorskiCRichmondC, et al.
On differential variability of expression ratios: improving statistical inference about gene expression changes from microarray data.J Comput Biol2001;
8: 37–52.
5.
ChurchBVWilliamsHTMarJC.Investigating skewness to understand gene expression heterogeneity in large patient cohorts.BMC Bioinformatics2019;
20: 668.
6.
KalbfleishJDPrenticeRL.The statistical analysis of failure time data.
New York:
John Wiley & Sons, Inc., 1980.
7.
LiJMaS.Survival analysis in medicine and genetics.
Boca Raton:
CRC Press, 2013.
8.
OrlenkoAMooreJOrzechowskiP, et al.
Considerations for automated machine learning in clinical metabolic profiling: altered homocysteine plasma concentration associated with metformin exposure. Pac Symp Biocomput2018;
23: 460–471.
9.
WangTLiBNelsonCE, et al.
Comparative analysis of differential gene expression analysis tools for single-cell RNA sequencing data.BMC Bioinformatics2019;
20: 40.
10.
JinHLuY.A procedure for determining whether a simple combination of diagnostic tests may be noninferior to the theoretical optimum combination.Med Decis Making2008;
28: 909–916.
11.
LuQObuchowskiNWonS, et al.
Using the optimal robust receiver operating characteristic (ROC) curve for predictive genetic tests.Biometrics2010;
66: 586–593.