
Abstract
Due to the inevitable inter-study correlation between test sensitivity (Se) and test specificity (Sp), mostly because of threshold variability, hierarchical or bivariate random-effects models are widely used to perform a meta-analysis of diagnostic test accuracy studies. Conventionally, these models assume that the random-effects follow the bivariate normal distribution. However, the inference made using the well-established bivariate random-effects models, when outlying and influential studies are present, may lead to misleading conclusions, since outlying or influential studies can extremely influence parameter estimates due to their disproportional weight. Therefore, we developed a new robust bivariate random-effects model that accommodates outlying and influential observations and gives robust statistical inference by down-weighting the effect of outlying and influential studies. The marginal model and the Monte Carlo expectation-maximization algorithm for our proposed model have been derived. A simulation study has been carried out to validate the proposed method and compare it against the standard methods. Regardless of the parameters varied in our simulations, the proposed model produced robust point estimates of Se and Sp compared to the standard models. Moreover, our proposed model resulted in precise estimates as it yielded the narrowest confidence intervals. The proposed model also generated a similar point and interval estimates of Se and Sp as the standard models when there are no outlying and influential studies. Two published meta-analyses have also been used to illustrate the methods.
Keywords
1 Introduction
A meta-analysis of diagnostic test accuracy (DTA) allows for the synthesis of diagnostic test characteristics, such as test Se and Sp, across several independent studies. Due to the inevitable correlation between Se and Sp, hierarchical random-effects model 1 or bivariate random-effects models2,3 are widely used to perform meta-analysis of DTA studies. Conventionally, these models assume that the random-effects, which describe the variation among the true study-specific sensitivities and specificities, follow the bivariate normal distribution. However, in the presence of a few outlying and/or influential studies, this assumption may not adequately describe the variation in true Se and Sp across studies. Moreover, due to their weights, outlying and/or influential studies have the potential to extremely influence the estimated overall Se and Sp. Therefore, simply fitting the current standard bivariate random-effects models when outlying and/or influential studies are present may lead to misleading inferences. 4
In the conventional meta-analysis of intervention studies, a substantial number of research articles5–10 which advocate for the use of robust statistical methods in the presence of outlying or influential studies have been published. Methods of identifying outlying and/or influential studies had been proposed independently by Viechtbauer and Cheung 7 and Gumedze and Jackson. 8 Lee and Thompson 6 proposed several heavy-tailed distributions including the t, skew-normal and skew-t for the random-effects in the presence of outlying studies. On the other hand, long-tailed distributions like the t and the Beta have been proposed to accommodate outlying studies by Baker and Jackson. 5 A model that uses a mixture of normal distributions for the random-effects, identifies and down-weights the effect of outlying studies, was developed by Beath. 9 As an improvement on their previous work, Baker and Jackson 10 proposed new and mathematically tractable skewed marginal distributions which are also simpler to fit than the models proposed by Baker and Jackson. 5 In their recent review article, Jackson and White 11 recommended the use of robust meta-analytic models that relaxes the assumption of normally distributed random-effects. Most recently, Negeri and Beyene 12 proposed and evaluated a skew-normal random-effects meta-analytic model that accounts for possible skewness in DTA data.
Despite the attention it has gained in the conventional meta-analysis of interventions, tackling the effect of outlying and/or influential studies was not studied in the context of a meta-analysis of DTA studies. To the best of our knowledge, the proposal of advanced statistical methods for detecting the presence of outlying or influential studies in a meta-analysis of DTA studies was only recently studied by Negeri and Beyene. 4 In their article, it has been demonstrated that the well-established bivariate random-effects models are significantly affected by outlying or influential studies and may lead to misleading inferences. Although having a sound statistical method for identifying outlying and/or influential studies is a promising and necessary start, there is no clear methodology that guides how to deal with outlying and influential studies in a meta-analysis of DTA studies. There has been a general understanding among researchers that outlying or influential observations should not be discarded from the analyses due to their nature. However, a more robust statistical method that can accommodate those outlying and/or influential studies by keeping the effect of such studies to a minimal is desired.
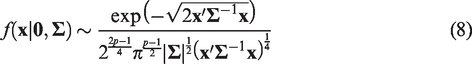
Since the current hierarchical and bivariate random-effects models for meta-analysis of DTA studies do not account for outlying and/or influential studies and may lead to unreliable conclusions as pointed out by, 4 we aim to fill this gap by developing a new alternative bivariate random-effects model which can accommodate outlying and/or influential studies by down-weighting their effect and gives a robust statistical inference. More specifically, we propose the bivariate Laplace distribution 13 for the random-effects to model the variation in Se and Sp across studies with the aim of accounting for potentially outlying and/or influential studies. For two reasons we chose the bivariate Laplace distribution over the frequently used distributions like the t. First, the Laplace distribution has not been implemented in the conventional meta-analysis of treatments or in a meta-analysis of DTA studies, although there have been other proposed robust models that accommodate outlying studies in the former literature as discussed above. Second, since the bivariate Laplace distribution has exactly the same number of parameters as the bivariate normal, it leads to a meaningful model comparison using information criteria approaches. By assuming the bivariate normal distribution to model the within-study variation in Se and Sp, we derived our marginal model to be the bivariate normal-Laplace (NL) distribution. That led us to implement the Monte Carlo expectation-maximization (MCEM) algorithm to obtain the maximum likelihood estimates of our model parameters. The standard errors of the parameter estimators and information criteria for model selection are obtained at the last iteration of the MCEM algorithm once the algorithm has converged.
The rest of this article is organized as follows. Section 2 motivates the proposed model using two published datasets. Section 3 gives a comprehensive description of the standard as well as the proposed methods. Section 4 presents the simulation study results. In Section 5, we illustrate the methods using two real DTA meta-analyses, and, we close the article by a discussion and conclusion in Section 6.
2 Motivating examples
This section discusses two published meta-analyses of DTA studies to motivate the proposed model. These data are selected because they contain one or more outlying and/or influential studies according to, among others, the methods proposed by Negeri and Beyene. 4 The performance of the different methods when fitted to these datasets will be discussed in Section 5.
2.1 Naked eye examination data
The first example, which is based on the naked eye examination (NEE) test for the diagnosis of primary melanoma compared to the dermoscopy test, is obtained from Vestergaard et al. 14 The forest plot for the NEE data is given in Figure 1. The authors 14 have identified and discussed the impact of two outlying studies on the diagnostic odds ratio of dermoscopy relative to the NEE test. Both studies 2 and 6 were detected as outlying and influential in specificity, and study 3 is identified to be outlying and influential in sensitivity.
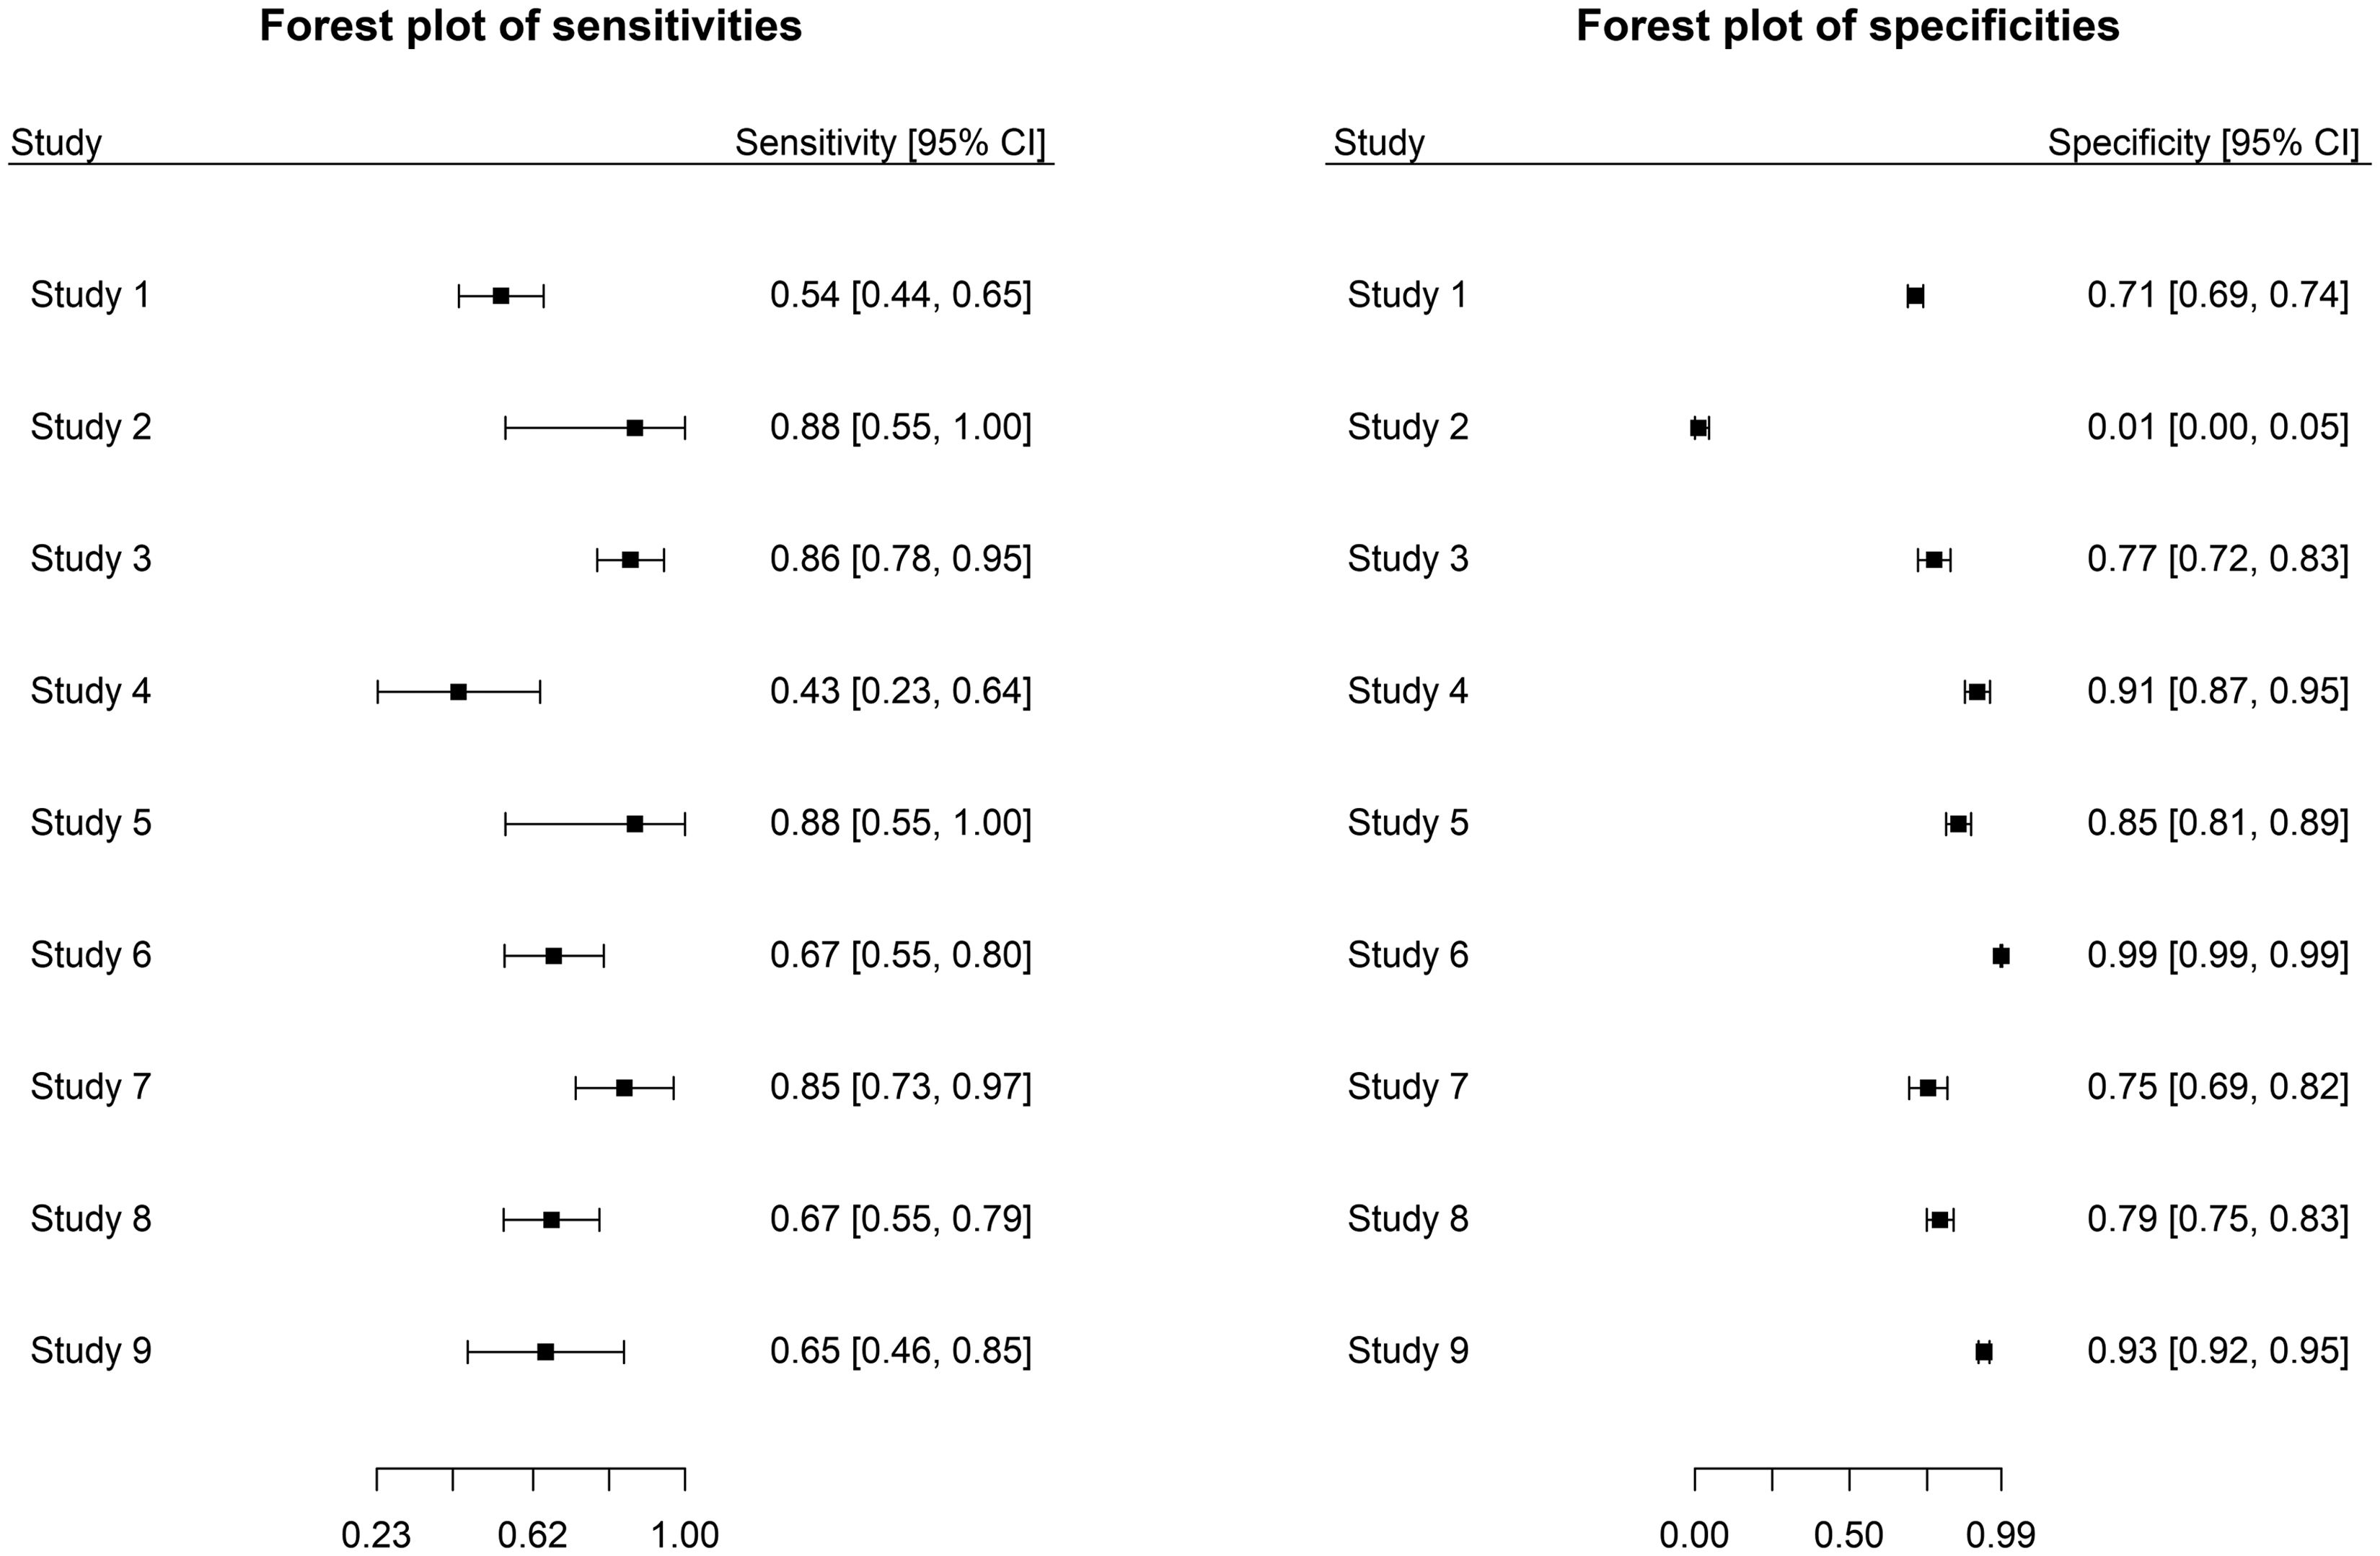
Forest plot for sensitivity (left) and specificity (right) of the NEE data.
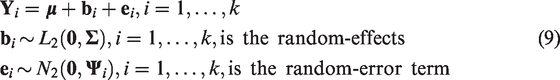
2.2 Mini-mental state examination data
The second meta-analysis is from the review of Arevalo et al. 15 about the mini-mental state examination (MMSE) test for detecting Alzheimer’s disease and dementia in people with mild cognitive impairment. Figure 2 displays the forest plot of the MMSE data. Studies 1 and 2 are detected as outlying and influential in specificity.
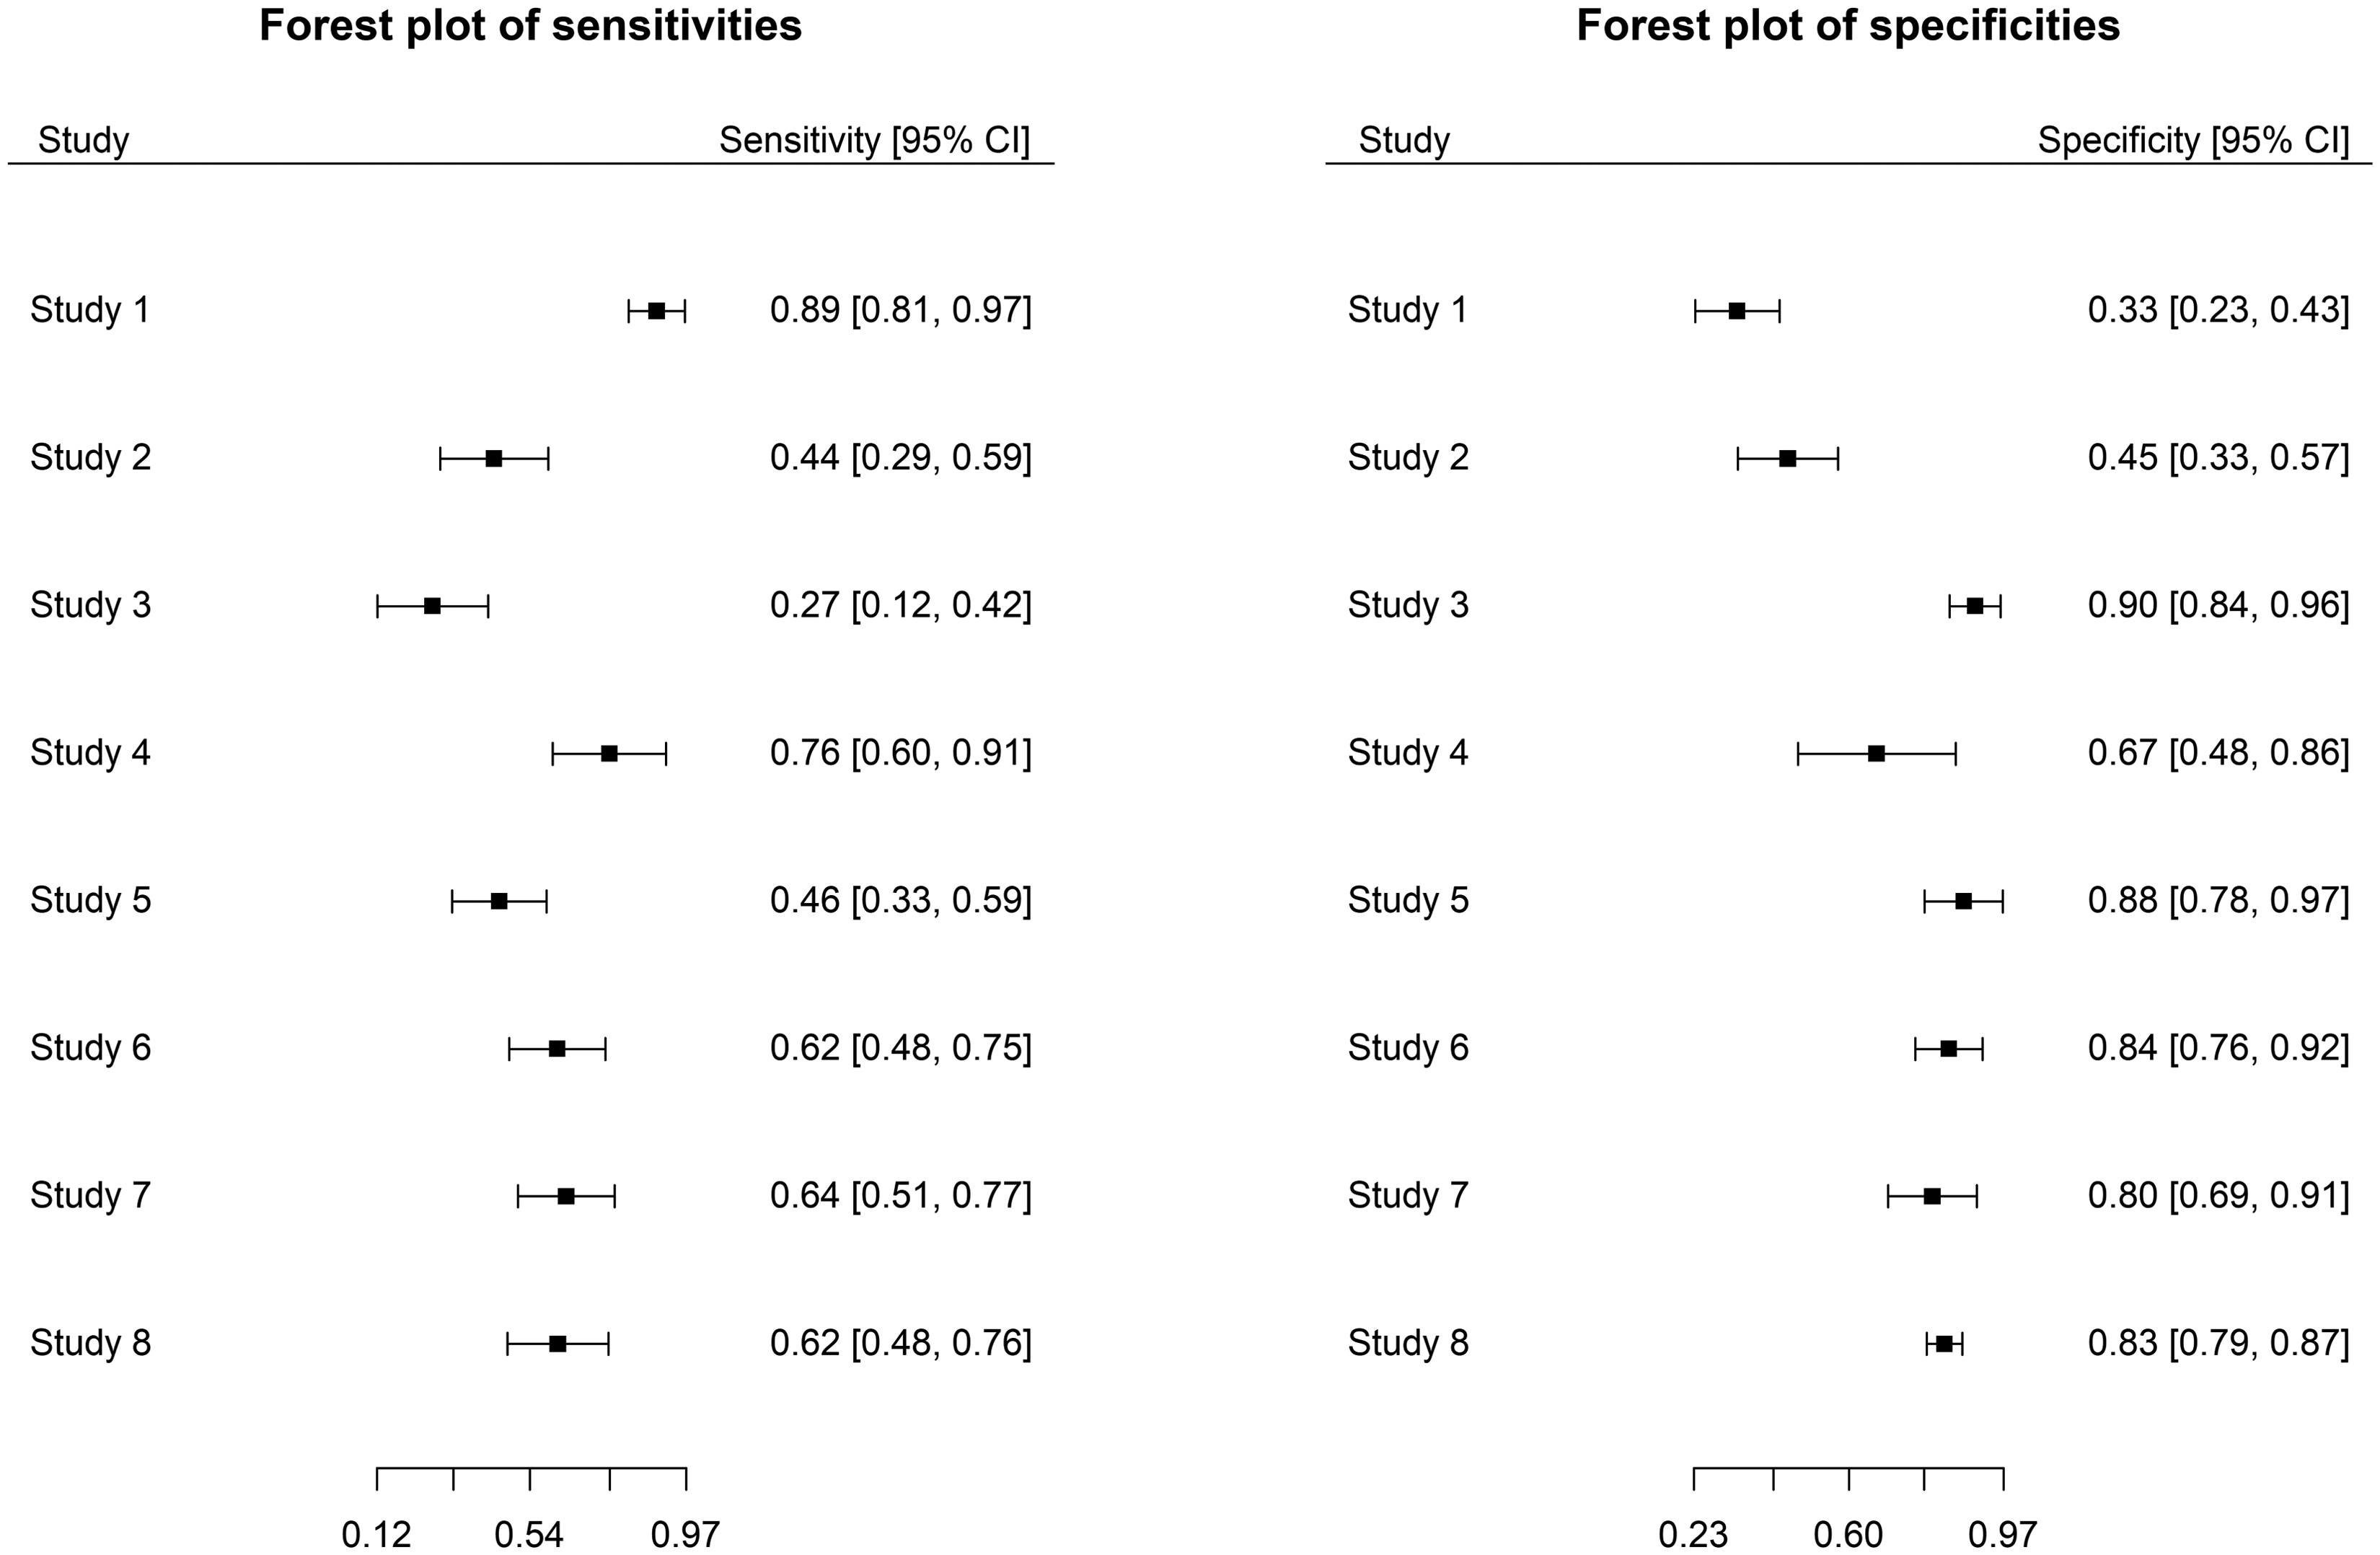
Forest plot for sensitivity (left) and specificity (right) of the MMSE data.
3 Methods
In this section, we present the three bivariate random-effects models used to synthesize a pair of Se and Sp obtained from a set of k independent DTA studies. Before discussing the models, we define the following notations. Let
3.1 The bivariate normal–normal model
The standard bivariate random-effects model of Reitsma et al.
2
assumes that the within-study variation in sensitivity and specificity is modelled according to

On the second level, the bivariate normal–normal (BNN) model assumes that the true effect,

As in any hierarchical model, maximum likelihood estimation of parameters of the BNN model is also based on the marginal model. The marginal model obtained from equations (1) and (2) by integrating out the random-effects is given as

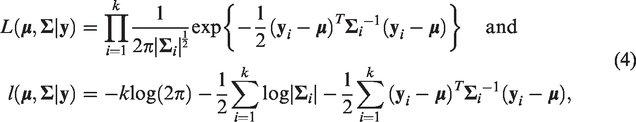
The likelihood and log-likelihood function of the BNN model which follows from equation (3) is given as
respectively.
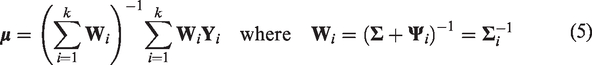
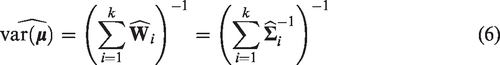
From equation (4), it follows that the maximum likelihood estimates (MLE) of
Once the parameters are estimated, inference regarding the parameter of interest,
Therefore, the estimated variance-covariance matrix of the pooled logit(Se) and logit(Sp) estimator,
3.2 The bivariate binomial-normal model
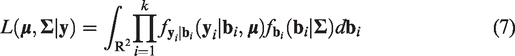
The bivariate generalized random-effects model of Chu and Cole and Chu et al.3,18 is defined by assuming the binomial distribution for modelling the within-study variability and the bivariate normal distribution for modelling the between-study variability in sensitivity and specificity. That is, the bivariate binomial-normal (BBN) assumes

The marginal likelihood function of the BBN model has no closed-form expression since the integral in equation (7) does not have a closed form solution. However, the R package Metatron
19
has recently implemented the BBN model by using the adaptive Gaussian quadrature algorithm3,20 to approximate the likelihood numerically.
3.3 The proposed model
This section is devoted to our proposed bivariate random-effects model. Before that, we review the symmetric multivariate Laplace (or double-exponential) distribution.
3.3.1 Review of the symmetric multivariate Laplace distribution
Kotz et al.
13
defined a p-variate random vector
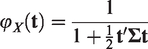
As discussed in Eltoft et al.
21
and Wang et al.,
22
the multivariate Laplace distribution can be approximated by
The mean and covariance matrix of

3.3.2 The bivariate normal-Laplace model
Our proposed bivariate normal-Laplace (BNL) model generalizes the BNN model by proposing a heavy-tailed distribution instead of the commonly used normal distribution for the random-effects. More specifically, we model the within-study variability by the bivariate normal distribution and the between-study variability by the symmetric bivariate Laplace distribution. Assuming that
Deriving the marginal distribution of the response variable in equation (9) would let one to estimate parameters of the BNL model by the maximum likelihood method. To do so, we define a new random vector

Then using the assumption that
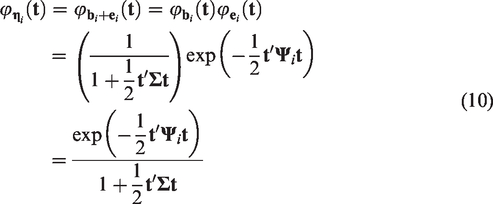
Using the uniqueness of characteristic functions, equation (10) is recognized as the characteristic function of the symmetric bivariate normal-Laplace distribution,
As shown in Appendix A (available on-line as a supplementary material), the mean vector and covariance matrix of the marginal model of our BNL random-effects model can easily be obtained from equation (11) to be

We want to note that our marginal model has no explicit density function since there is no closed-form density function for the multivariate NL distribution in general. Therefore, we cannot directly maximize the likelihood function to get estimates of our model parameters. That leads us to the next section—methods of estimating the parameters of our BNL model.
3.3.3 Maximum likelihood estimation of the parameters of the BNL model
Our BNL model can also be defined in a hierarchical way as
leading to the following likelihood function for the marginal model
Due to the above-mentioned reasons, the likelihood in equation (13) does not have a closed-form expression. Therefore, by treating the random-effects (
3.3.4 The MCEM algorithm
Suppose that
The EM algorithm of Dempster et al.
24
is an iterative process that involves computing the Q-function—the expected value of the complete-data log-likelihood given the observed data and the current estimate of
Thus, the expected complete-data log-likelihood function given the observed data and the current estimate of
However, as shown in equation (14), we cannot directly compute the Q-function since the expectation (or integral) requires the knowledge of the marginal likelihood function of the response variable
Specifically, for a given Monte Carlo sample size R, we generate samples
Once the MC samples

By the law of large numbers, the estimator in equation (15) converges to the theoretical expectation given in equation (14).
In the maximization step of the algorithm, we maximize
3.3.5 Monte Carlo sample size and convergence criteria
When implementing the MCEM algorithm, the MC sample size, R, has been given special consideration in the literature. Tanner
25
recommends to start the MCEM algorithm with a small R, say R = 10, when the approximations
Though increasing the MC sample size, R, at each iteration of the MCEM algorithm is needed as pointed out by Neath et al.,
30
it would be practical to come up with an inexpensive approach, both in terms of programming and computational time. Robert and Casella,
31
Section 5.4.4, demonstrated the MCEM algorithm by increasing the current MC sample size linearly by doubling the value of R in the previous iteration (i.e.
In this paper, we suggest increasing the MC sample size at every iteration of the algorithm in a linear way, say
Another point that needs to be discussed is when to stop the algorithm and declare the current parameter estimates as the MLEs. Although several methods have been suggested in the literature, the criteria based on relative error suggested by Booth and Hobert
27
and Neath et al.
30
is appealing to be used in this sequel. For some user specified positive constants δ and ϵ, the ordinary EM algorithm will report convergence at the j-th iteration if the following relative error criterion is satisfied

For the MCEM algorithm, due to the introduction of MC error in the E-step of the algorithm, both Booth and Hobert
27
and Neath et al.
30
recommend to declare convergence only if criteria (17) is met for three successive iterations. In this paper, we used criteria (17) with
3.3.6 Estimation of standard errors and model selection criteria
Since the EM algorithm does not provide standard errors as a byproduct, several researchers have developed alternative methods that approximate standard errors of parameters estimated by the EM algorithm. Among these methods, the Oakes’ approach
32
is relatively simple to apply. It is well understood that, asymptotically, the inverse of the observed Fisher’s information matrix (FIM), denoted by I(
Oakes
32
provided an approximation to the matrix of second-order derivatives by approximating the Q-function using the following MC sum
We may compare goodness-of-fit of the proposed model against the well-established ones via AIC and BIC by approximating the marginal log-likelihood
Using the value of R and the MC samples
4 Simulation study
4.1 Simulation design
A simulation study is performed to demonstrate the performance of the methods discussed in this sequel. A total of 56 settings has been considered by varying the random-effects distribution: bivariate normal or bivariate Laplace, model parameters: The overall Se and Sp for simulating DTA data with small mean vectors: (Se=0.5, Sp=0.6). The overall Se and Sp for generating DTA data with large mean vectors: (Se=0.90, Sp=0.95). The between-study variances and covariance parameter for simulating DTA data with no outlying studies: ( The between-study variances and covariance parameter for generating DTA data with outlying studies: ( The number of subjects in the diseased (n1) and non-diseased (n2) category: (n1= 100, n2= 200). The number of studies in the meta-analysis: (k=10, 20, 30, and 40).
Seven different scenarios have been considered to systematically introduce outlying and influential studies by varying
4.2 Simulation results
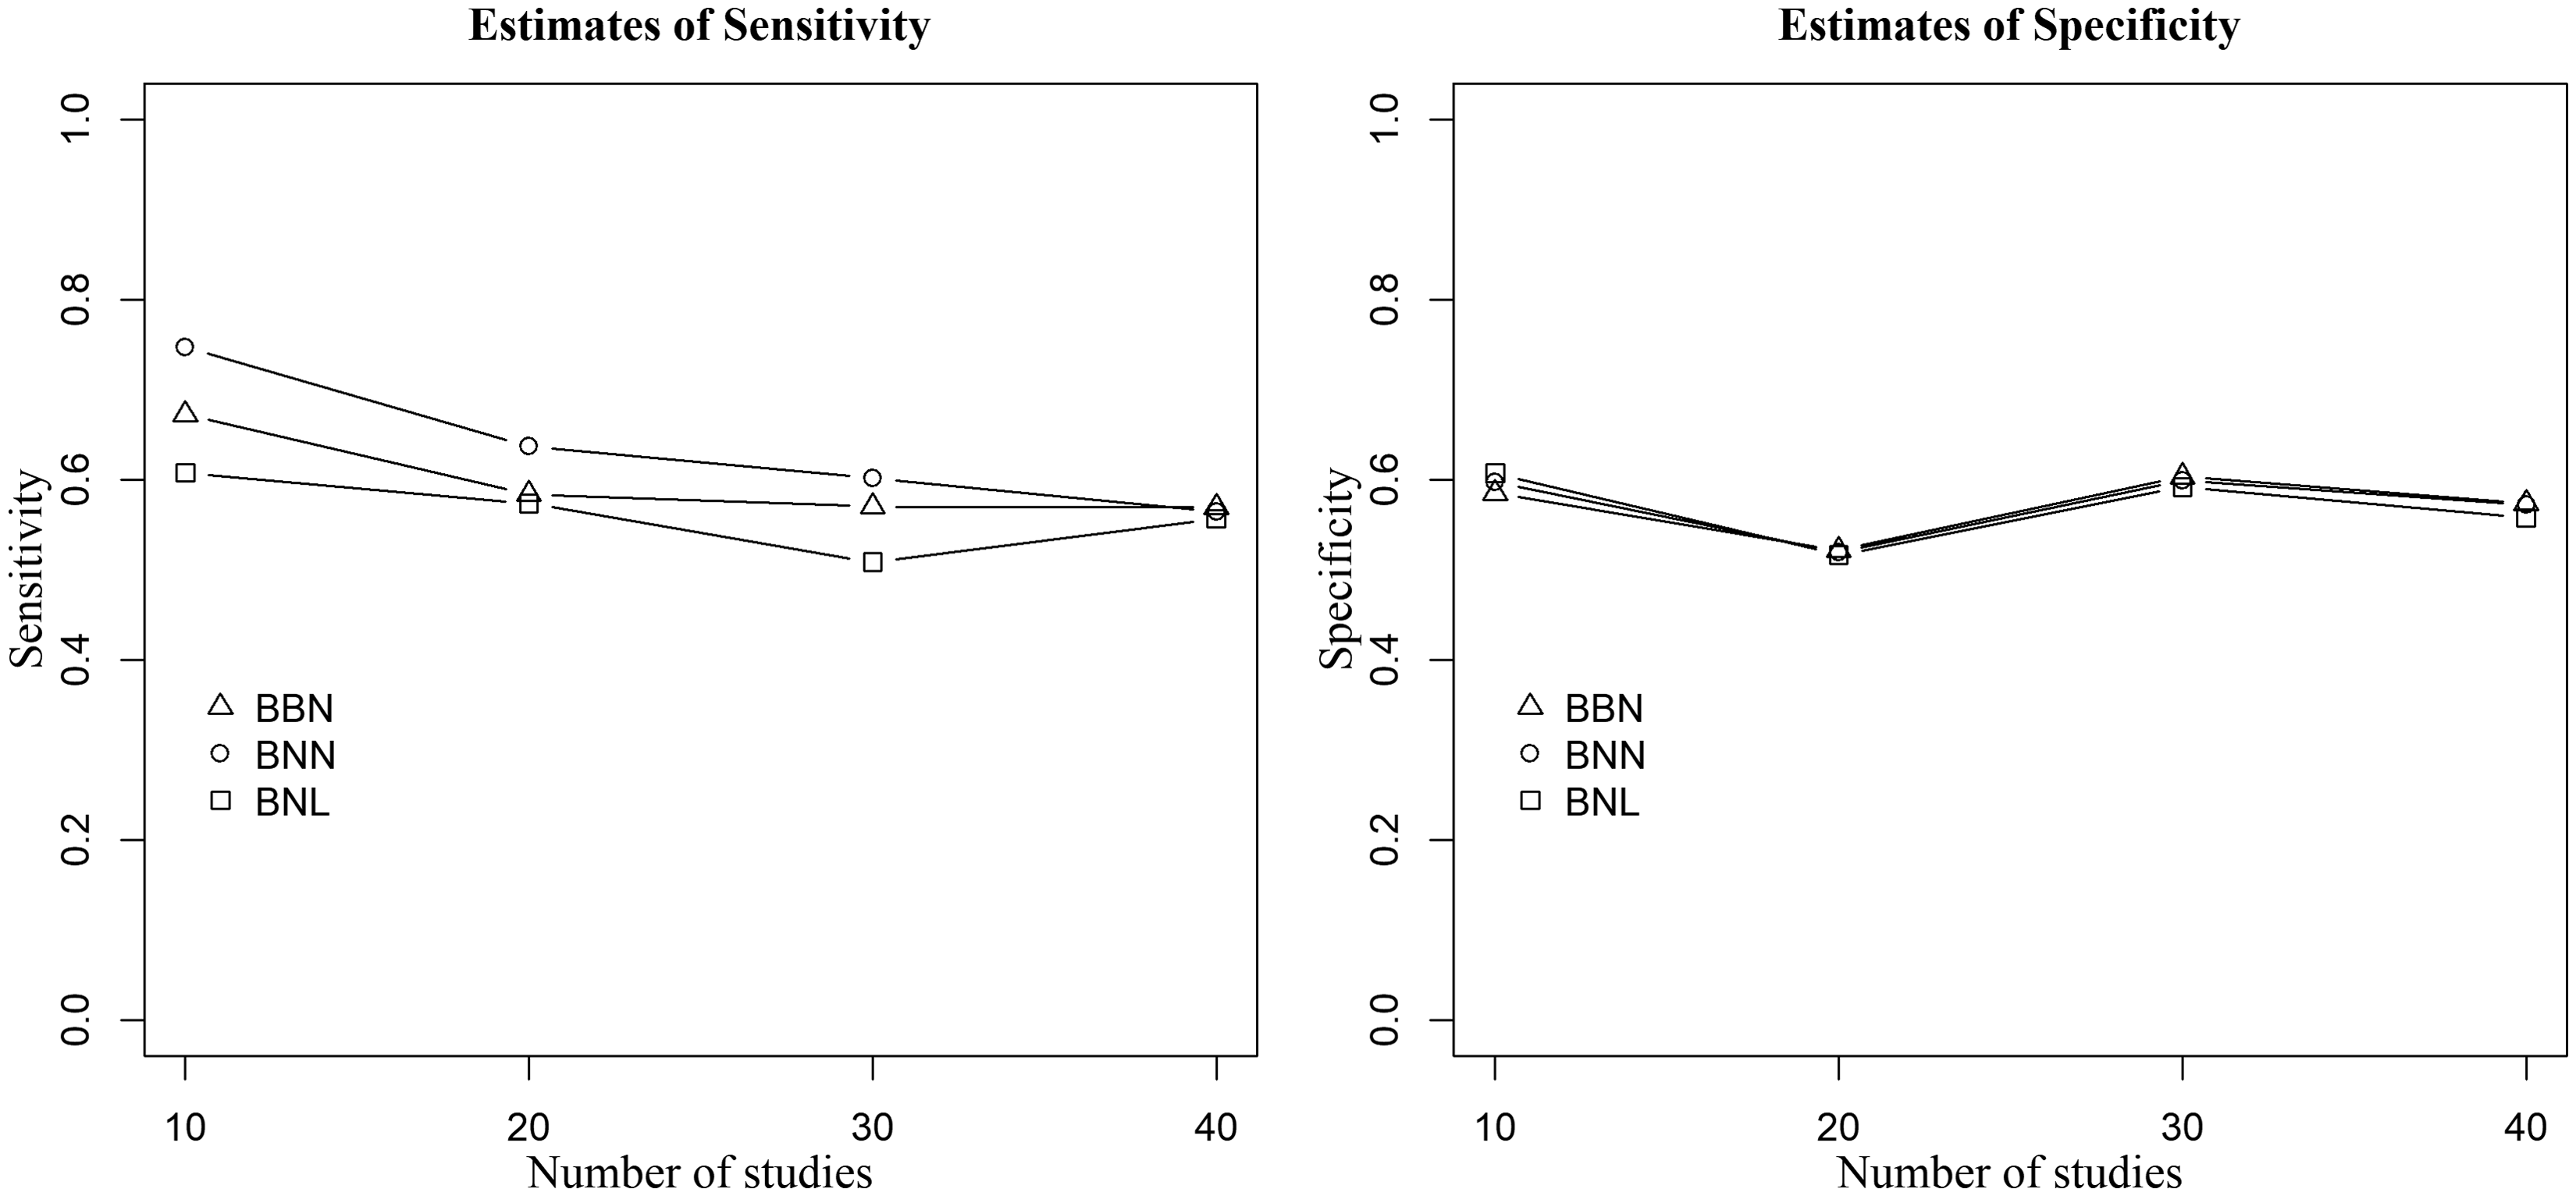
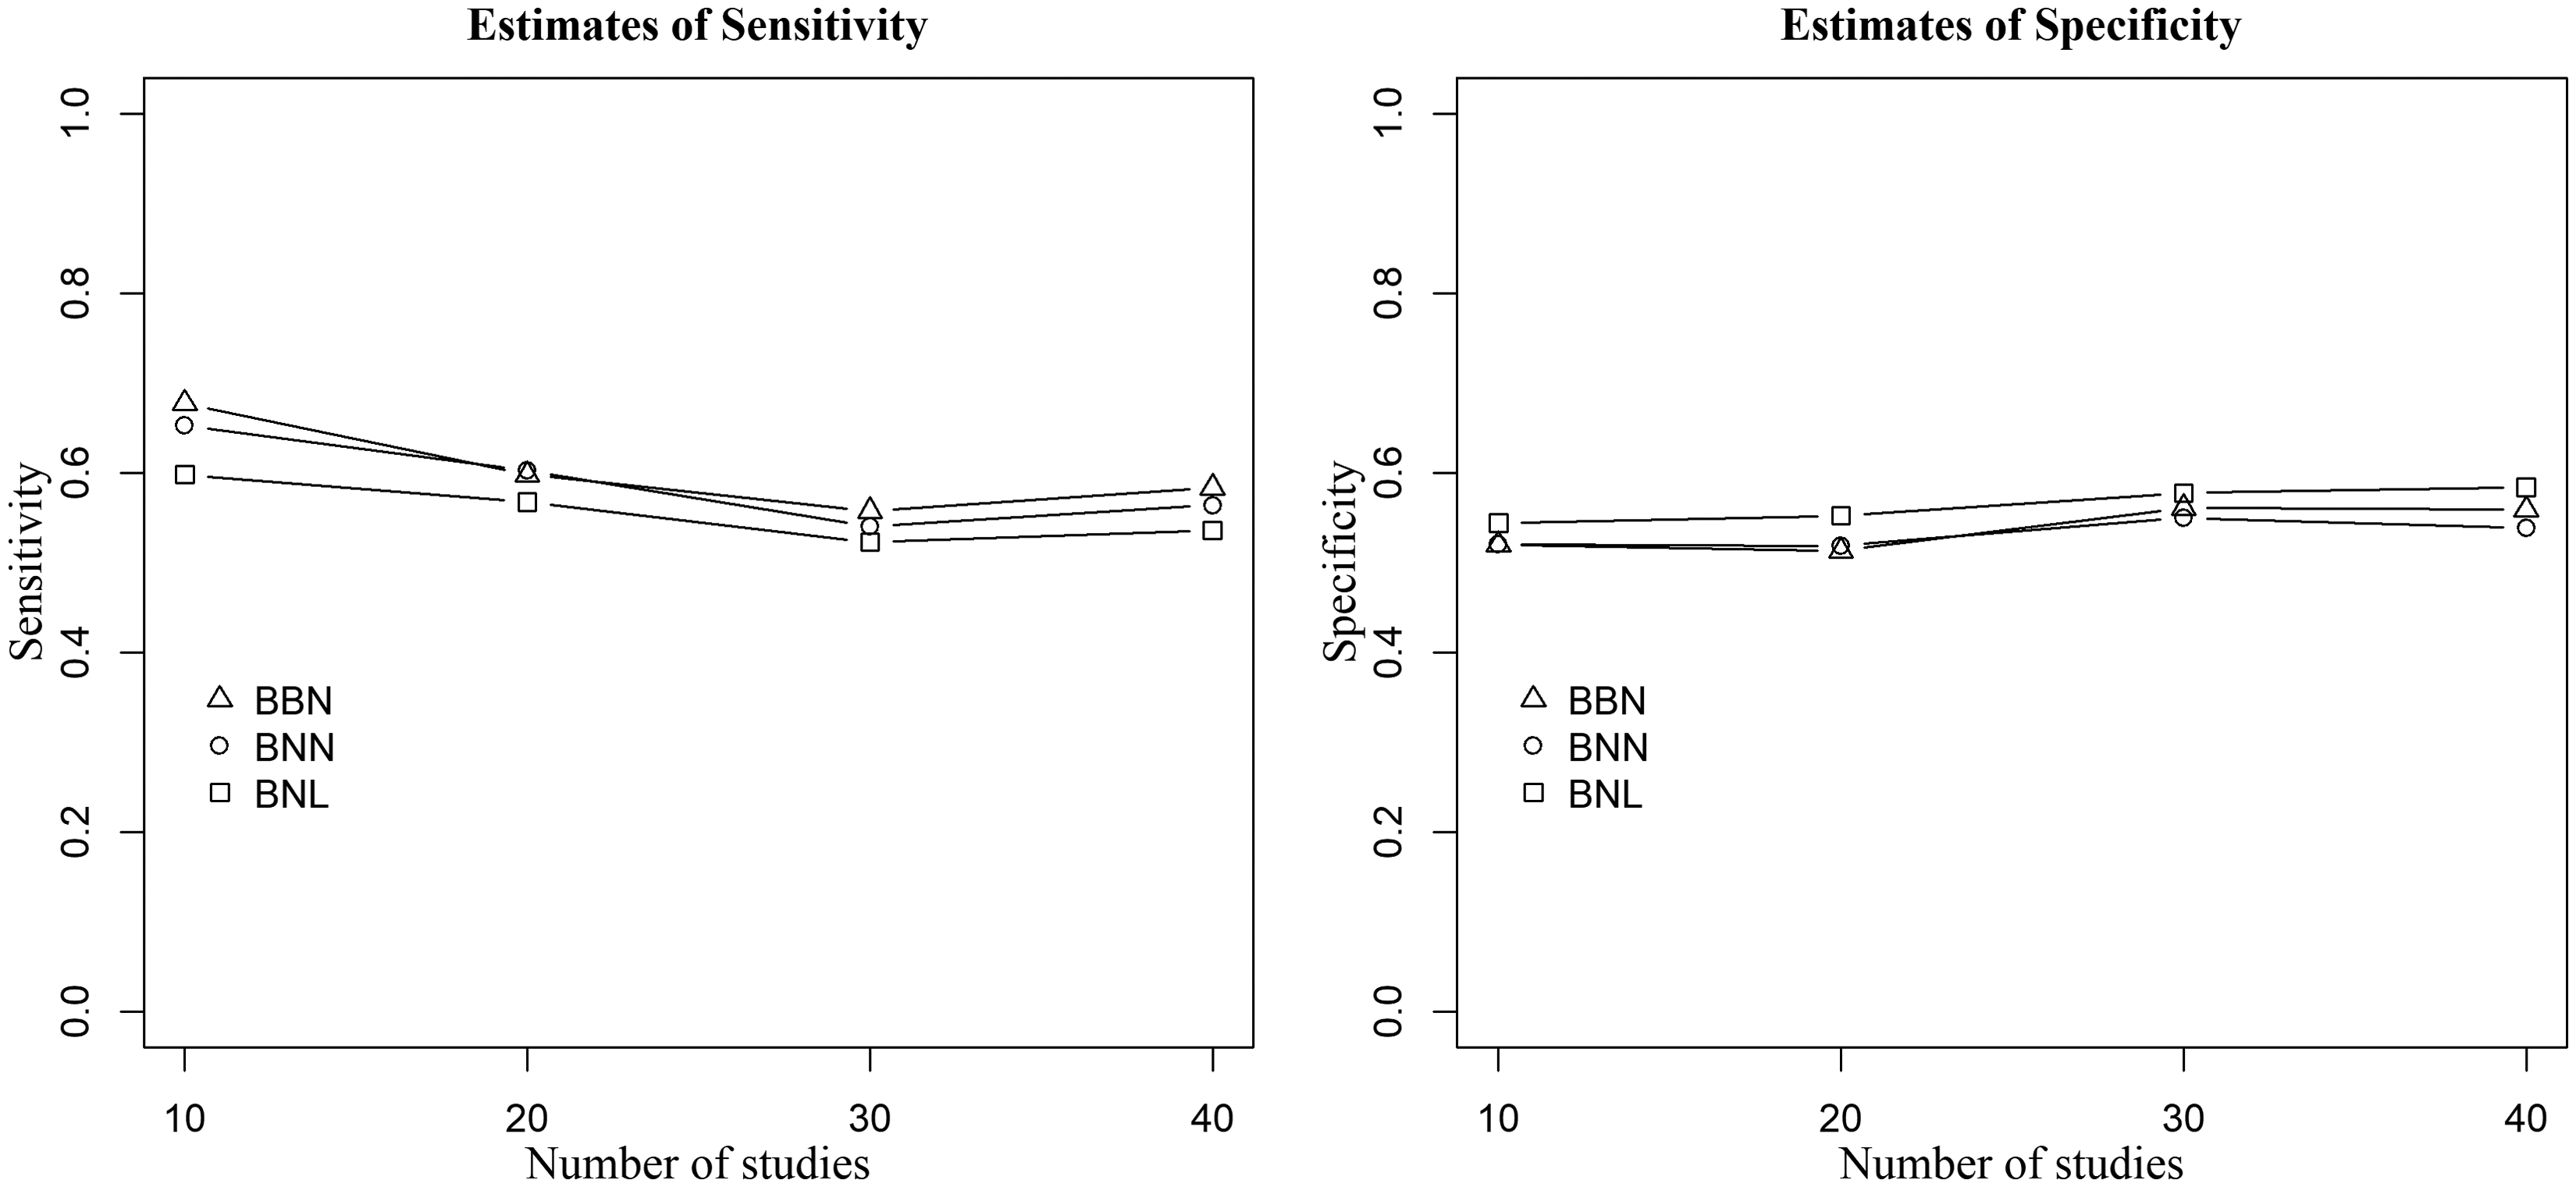
When outlying and influential studies are introduced both in Se and Sp, the between-studies variances are large, and random-effects are generated from the bivariate normal distribution (Figure 3), the proposed BNL model produced the most robust estimates, whereas the standard models yielded an inflated overall sensitivity and specificity estimates. For these scenarios, the absolute (relative) change in sensitivity between the proposed model and the BNN model ranges between 7% (13%) and 10% (21%), and the absolute (relative) difference in sensitivity between the proposed model and the BBN varies from 0% (0%) to 8% (16%). The absolute (relative) difference in specificity varies from 3% (4%) to 10% (16%), between the proposed BNL model and BNN, and from 1% (2%) to 5% (8%) between the BNL model and BBN model. For the same scenario but when the random-effects are generated from the bivariate Laplace distribution, the absolute (relative) change in Se between the proposed BNL and BNN model, and between the BNL and BBN model varies from 6% (12%) to 19% (38%), and from 2% (3%) to 12% (26%), respectively. On the other hand, the absolute (relative) change in Sp between the BNL and BNN model, and between the BNL and BBN model, respectively, ranges between 4% (5%) and 10% (16%), and between 1% (1%) and 6% (9%). Similar results have been observed when the small between-study variances have been employed.
Point estimates of sensitivity (left) and specificity (right) of the three methods when data are generated from the bivariate normal distribution,
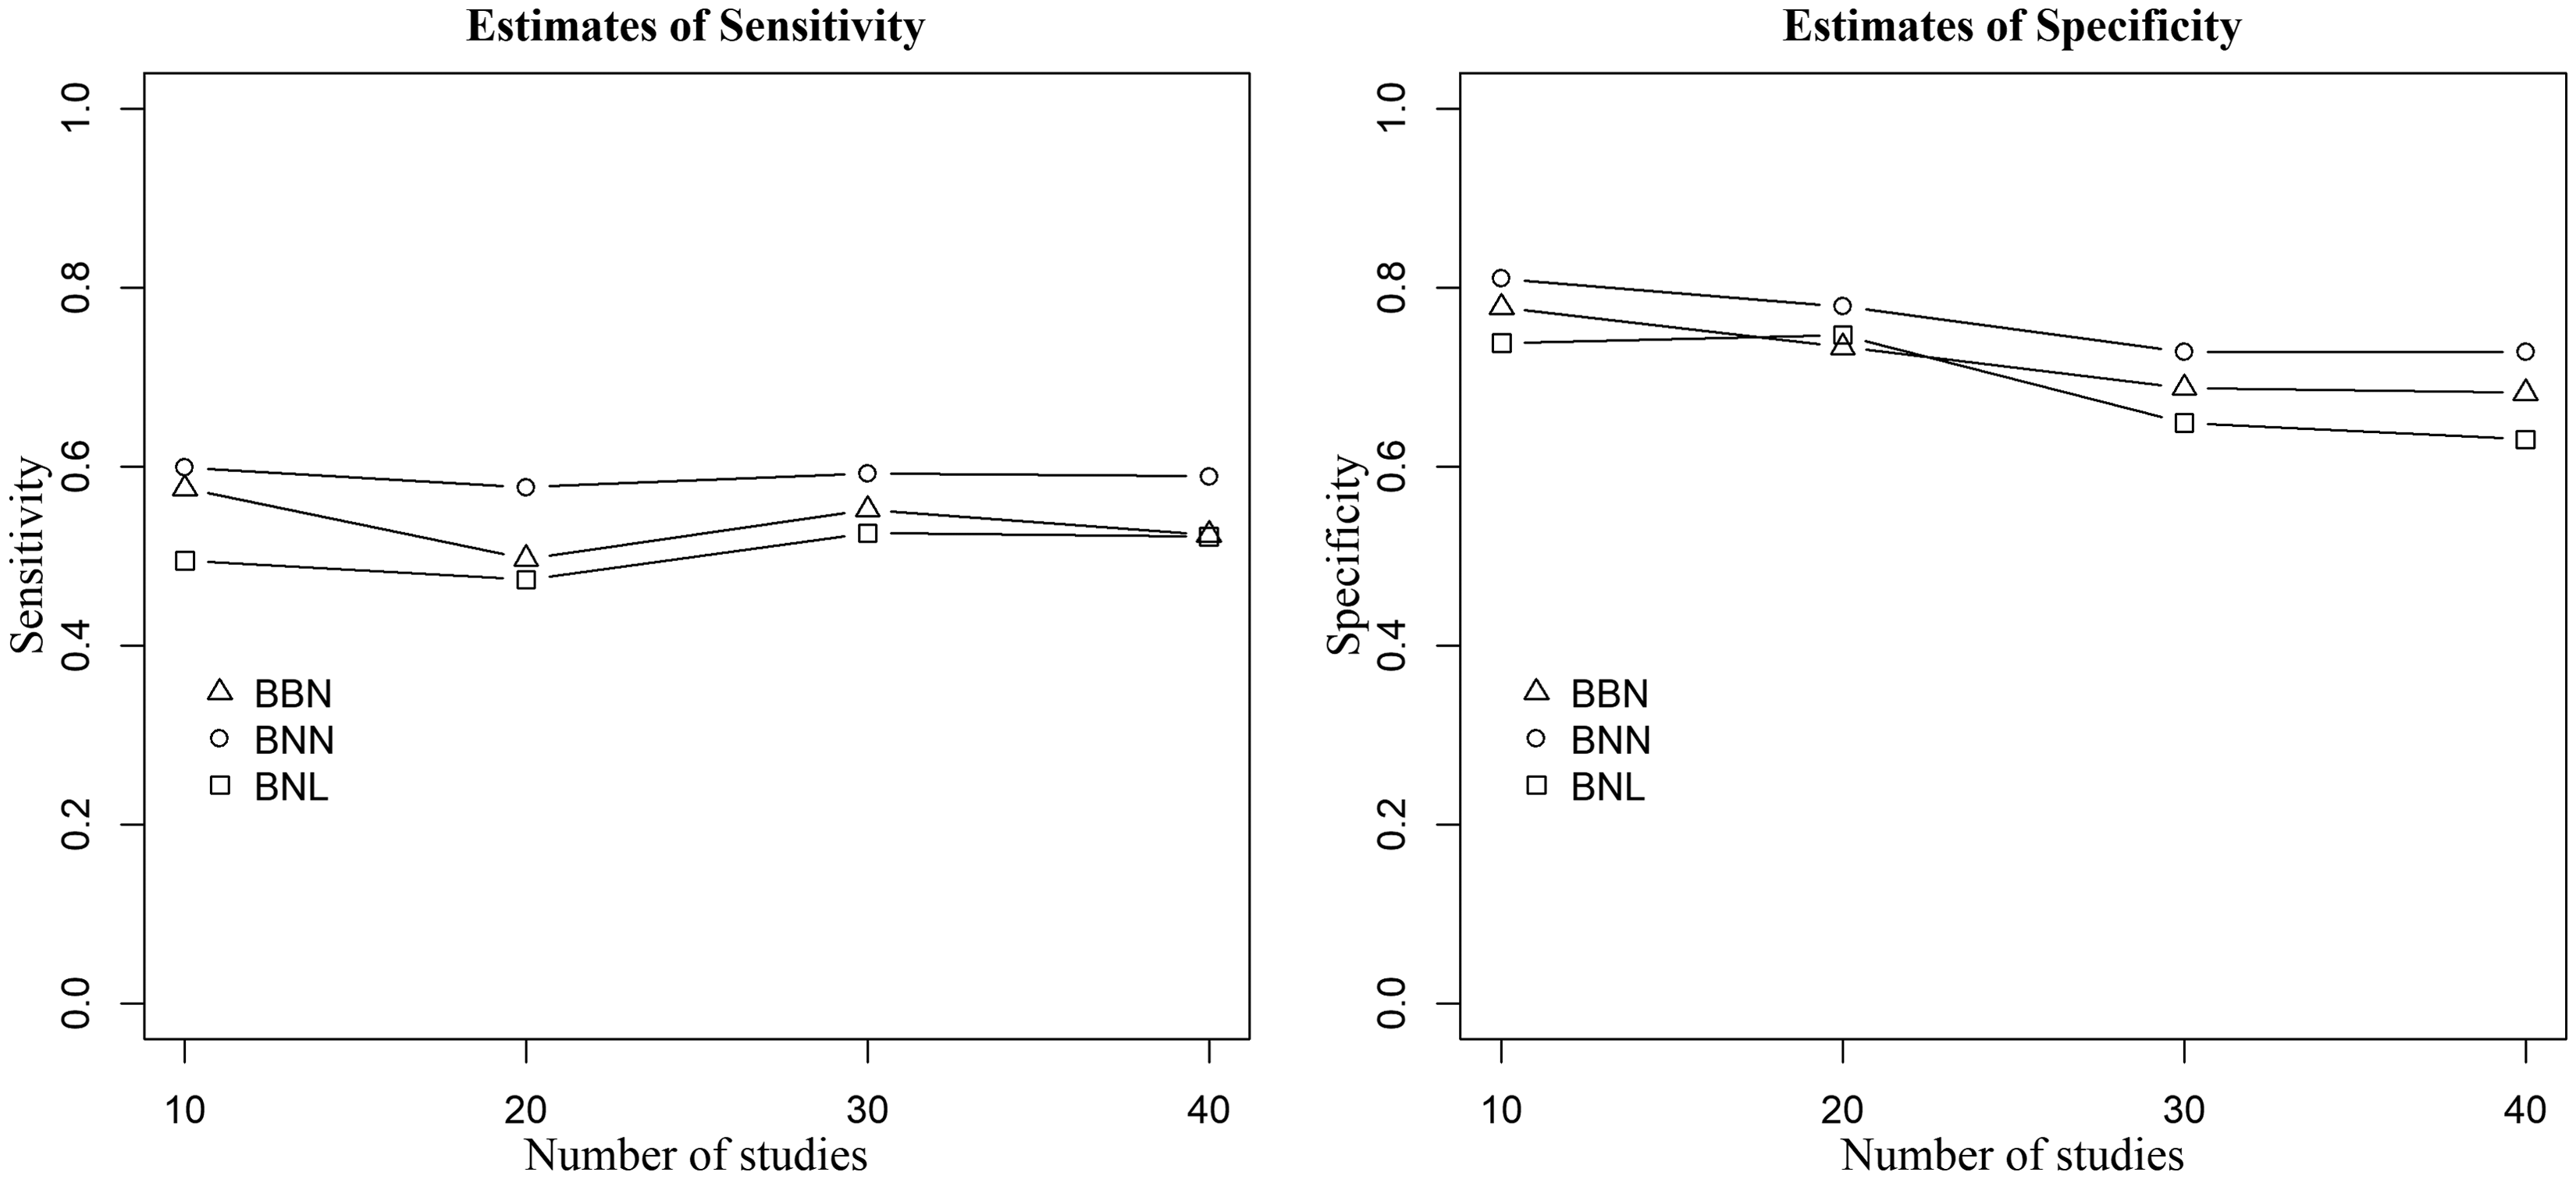
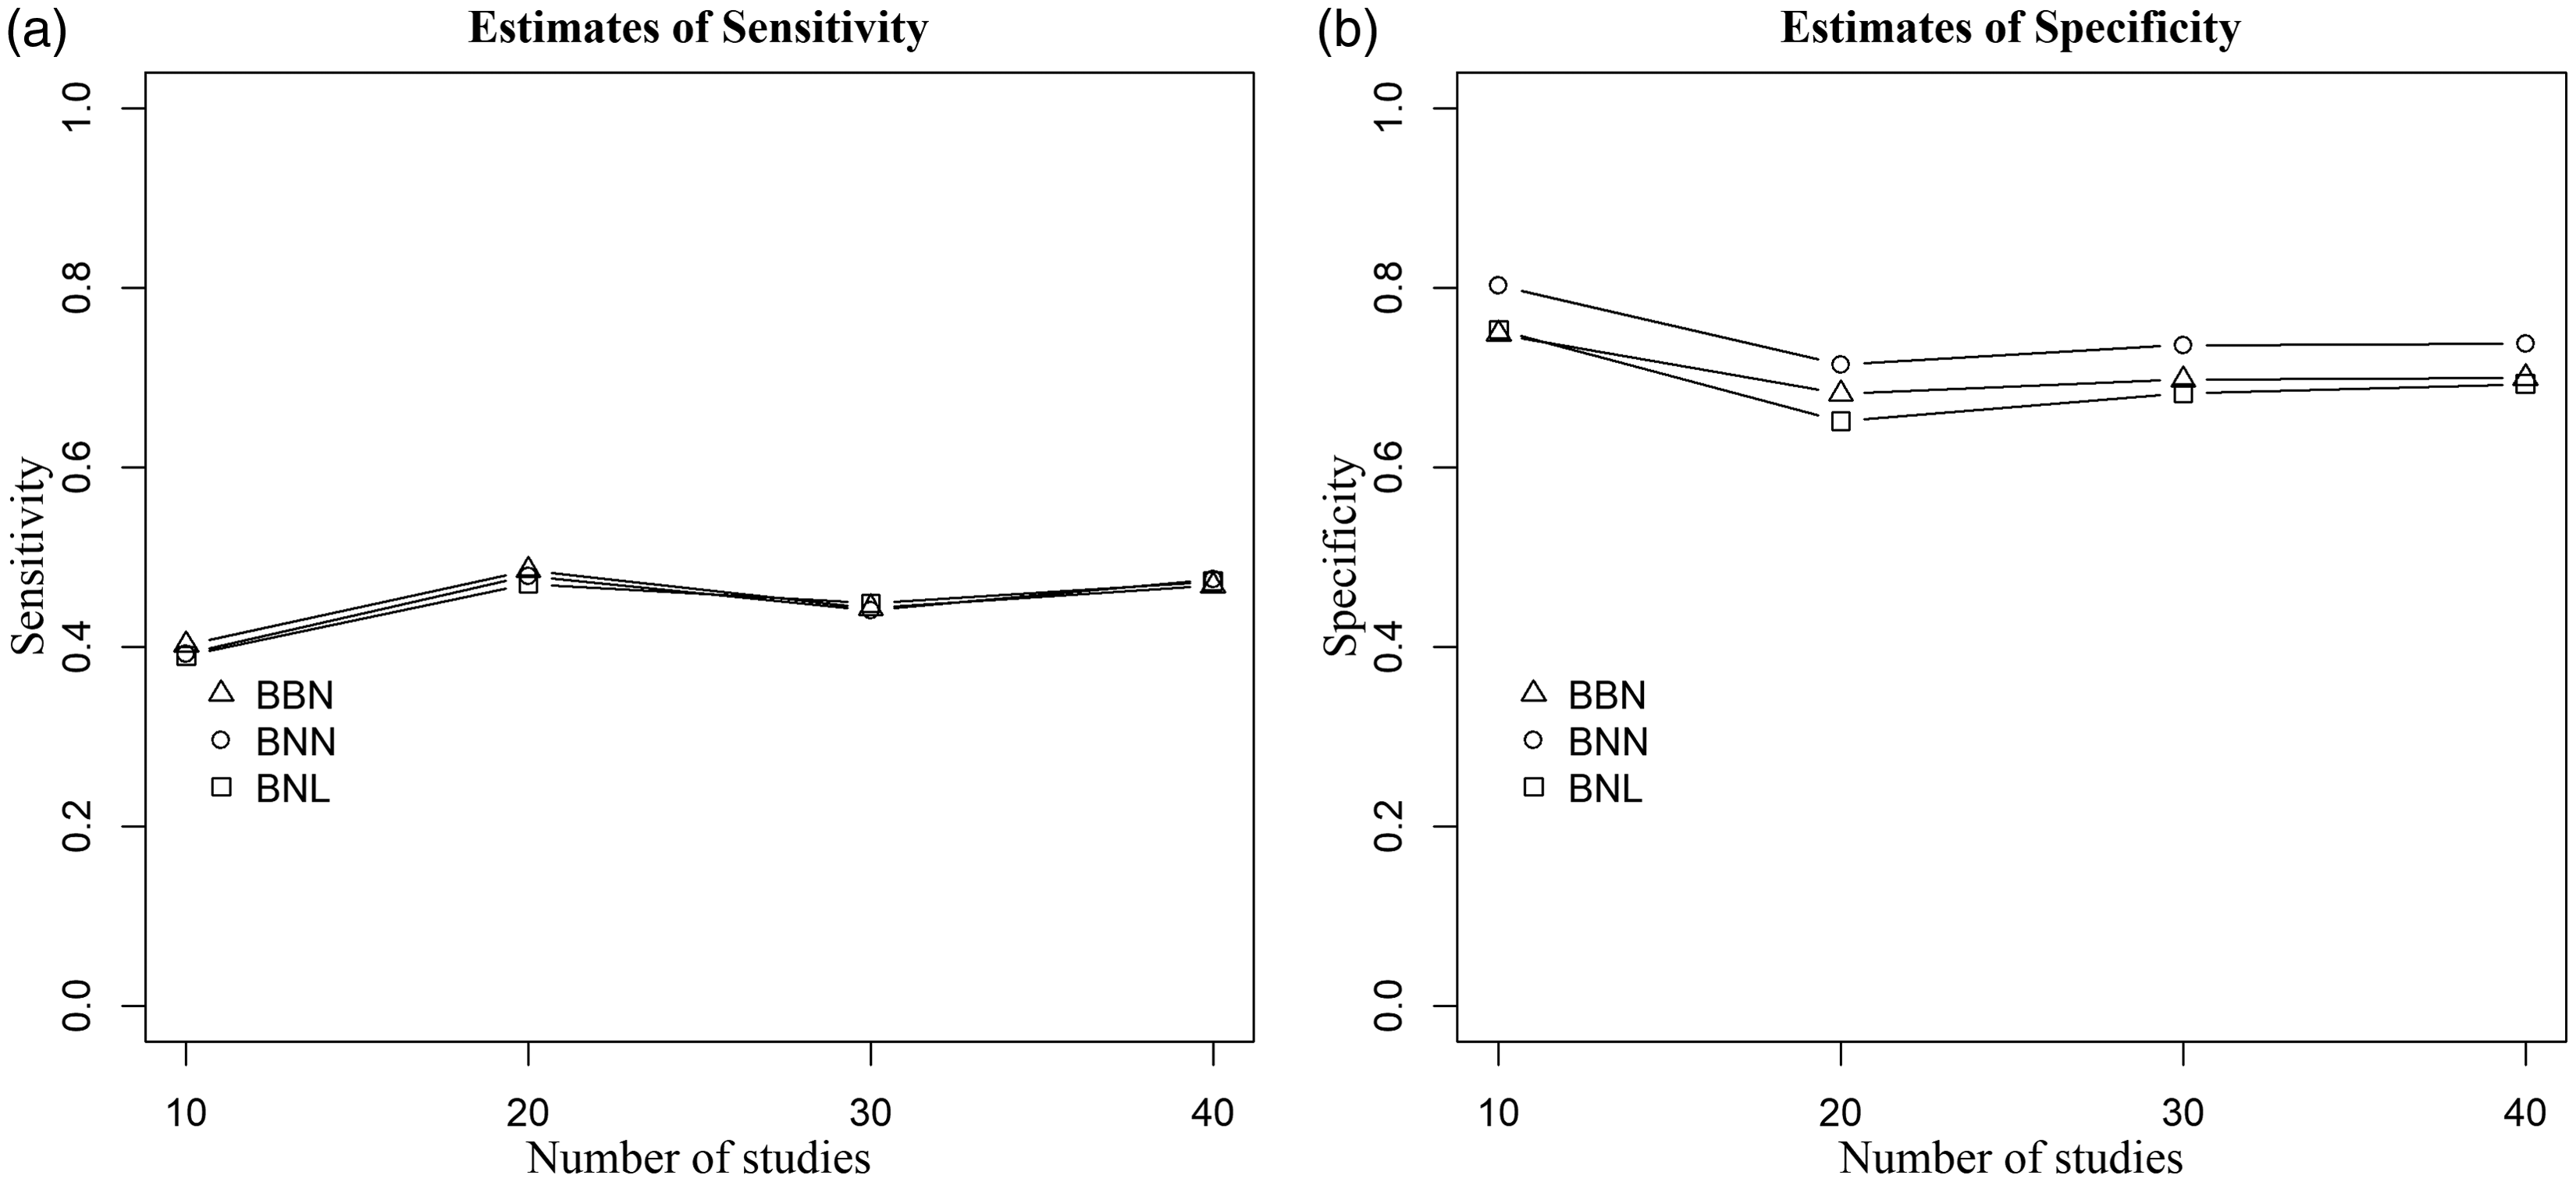
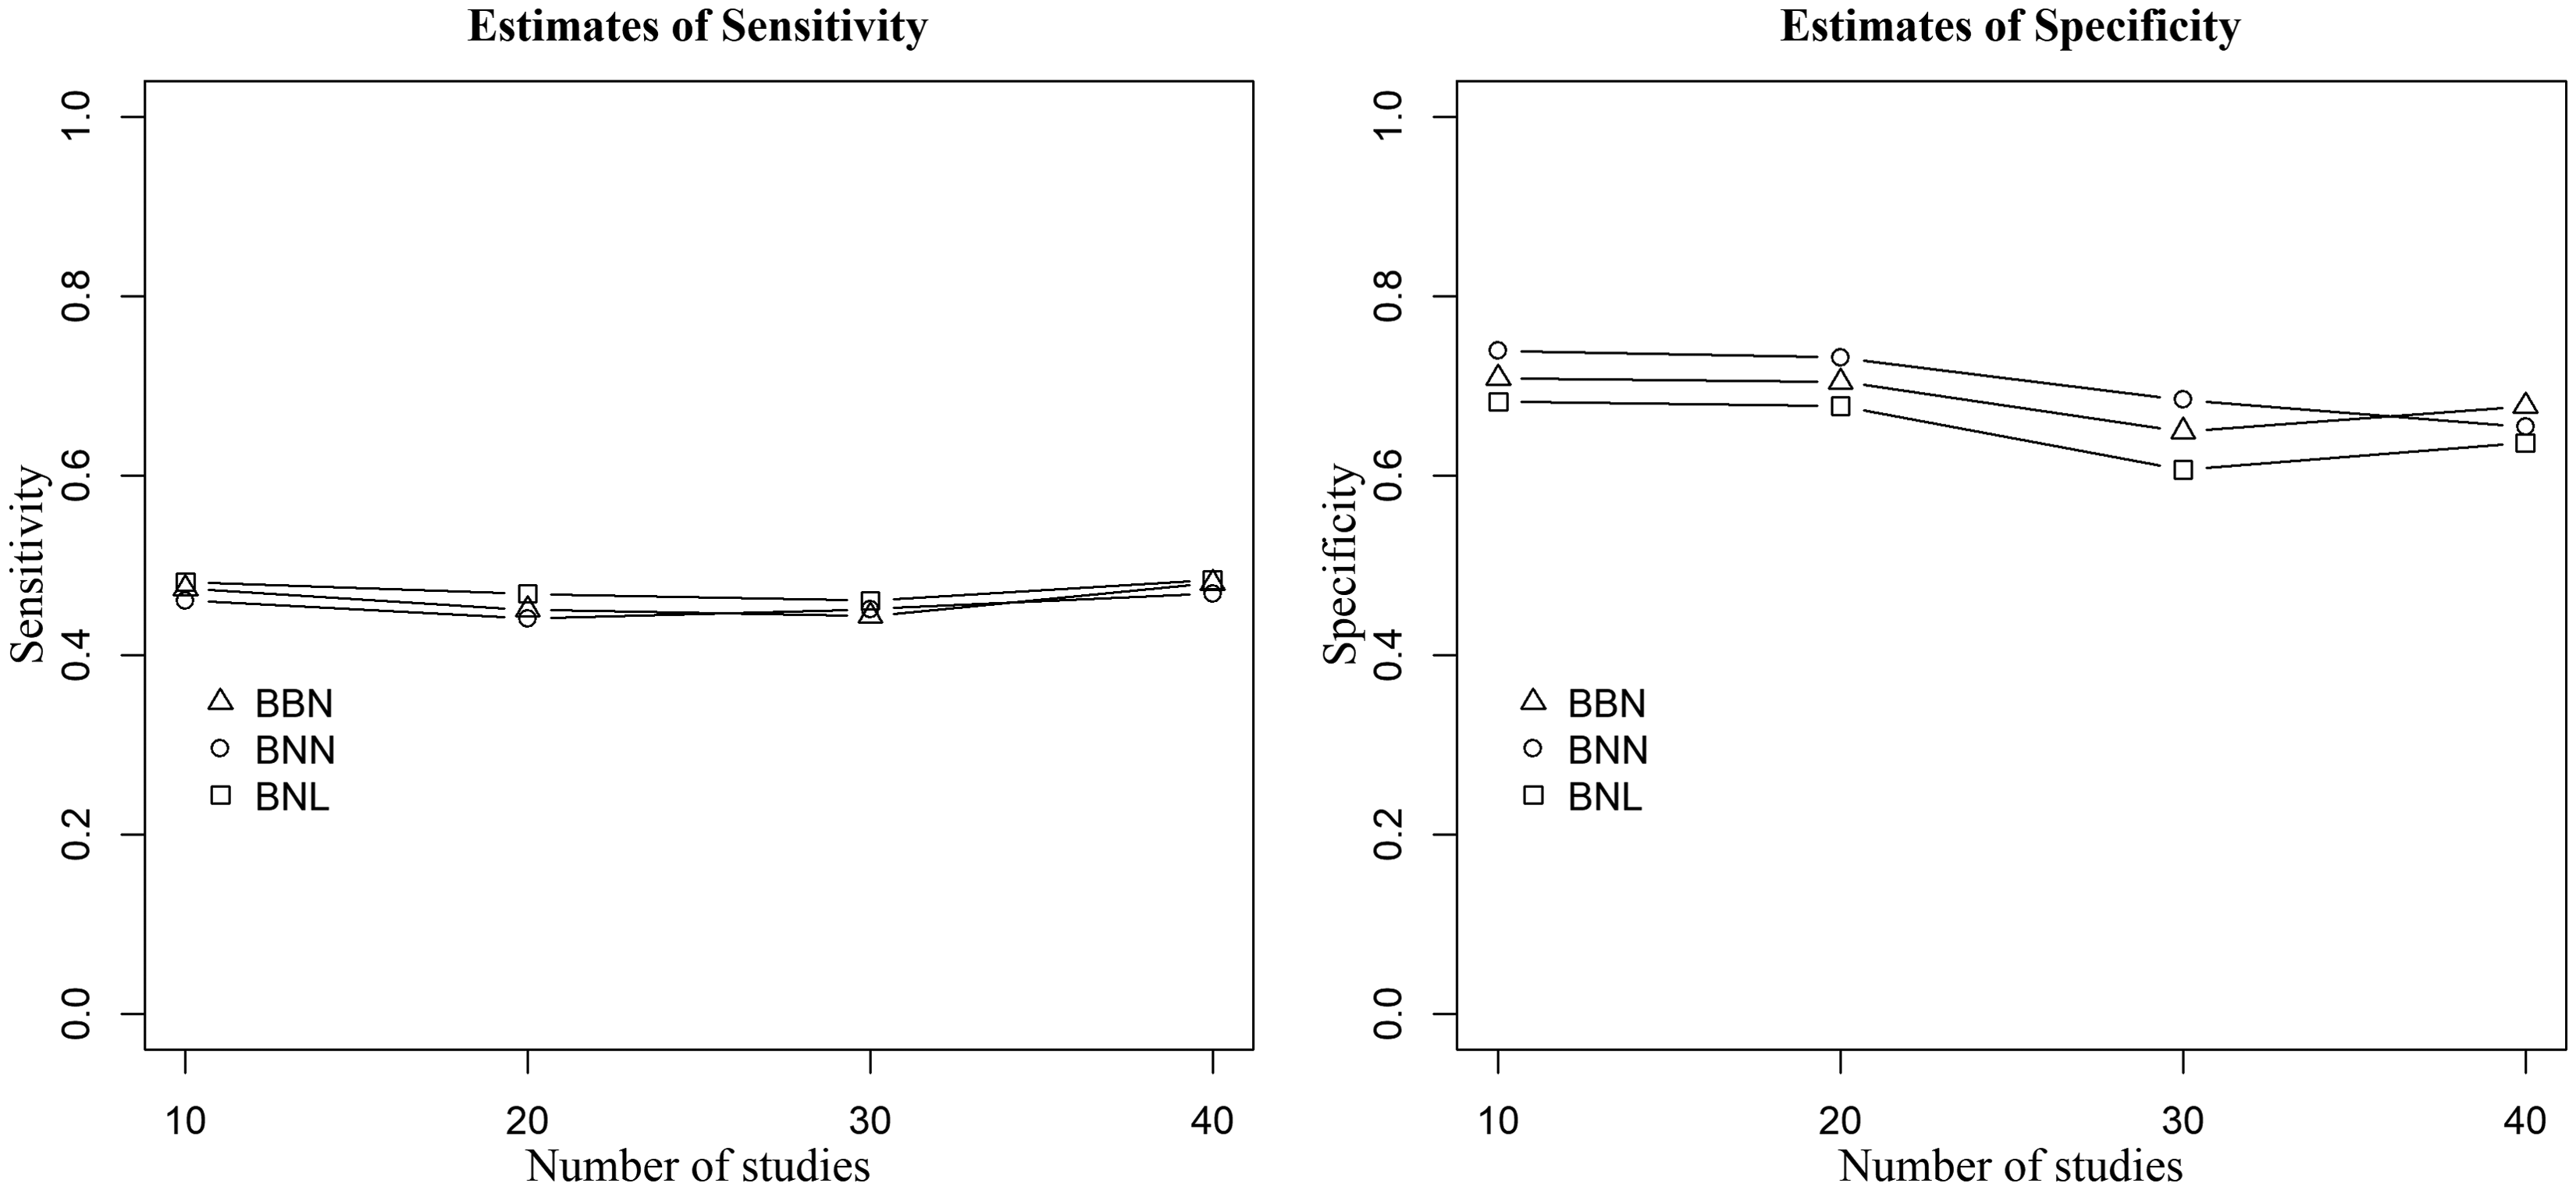
Figure 4 presents the results when outlying and influential studies are introduced only in Se, the between-study variances are large, and random-effects are generated from the bivariate normal distribution. The proposed BNL model yielded robust estimates of sensitivity and specificity compared to the standard models’ estimates. The absolute (relative) change in sensitivity of the BNL model and the BNN model varies from 1% (1%) to 14% (23%), and that of the BNL model and the BBN model ranges between 1% (2%) and 6% (12%). When the bivariate Laplace distribution is used to generate the random-effects, the absolute (relative) change in Se between the BNL and BNN model, and the BNL and BBN model, respectively, ranges from 1% (1%) to 8% (16%), and from 1% (2%) to 6% (13%). Moreover, the robustness of our proposed BNL model is justified as it yielded similar estimates of specificity to the standard models. We observed similar results when the small between-study variances are used.
Figure 4. Point estimates of sensitivity (left) and specificity (right) of the three methods when data are generated from the bivariate normal distribution,
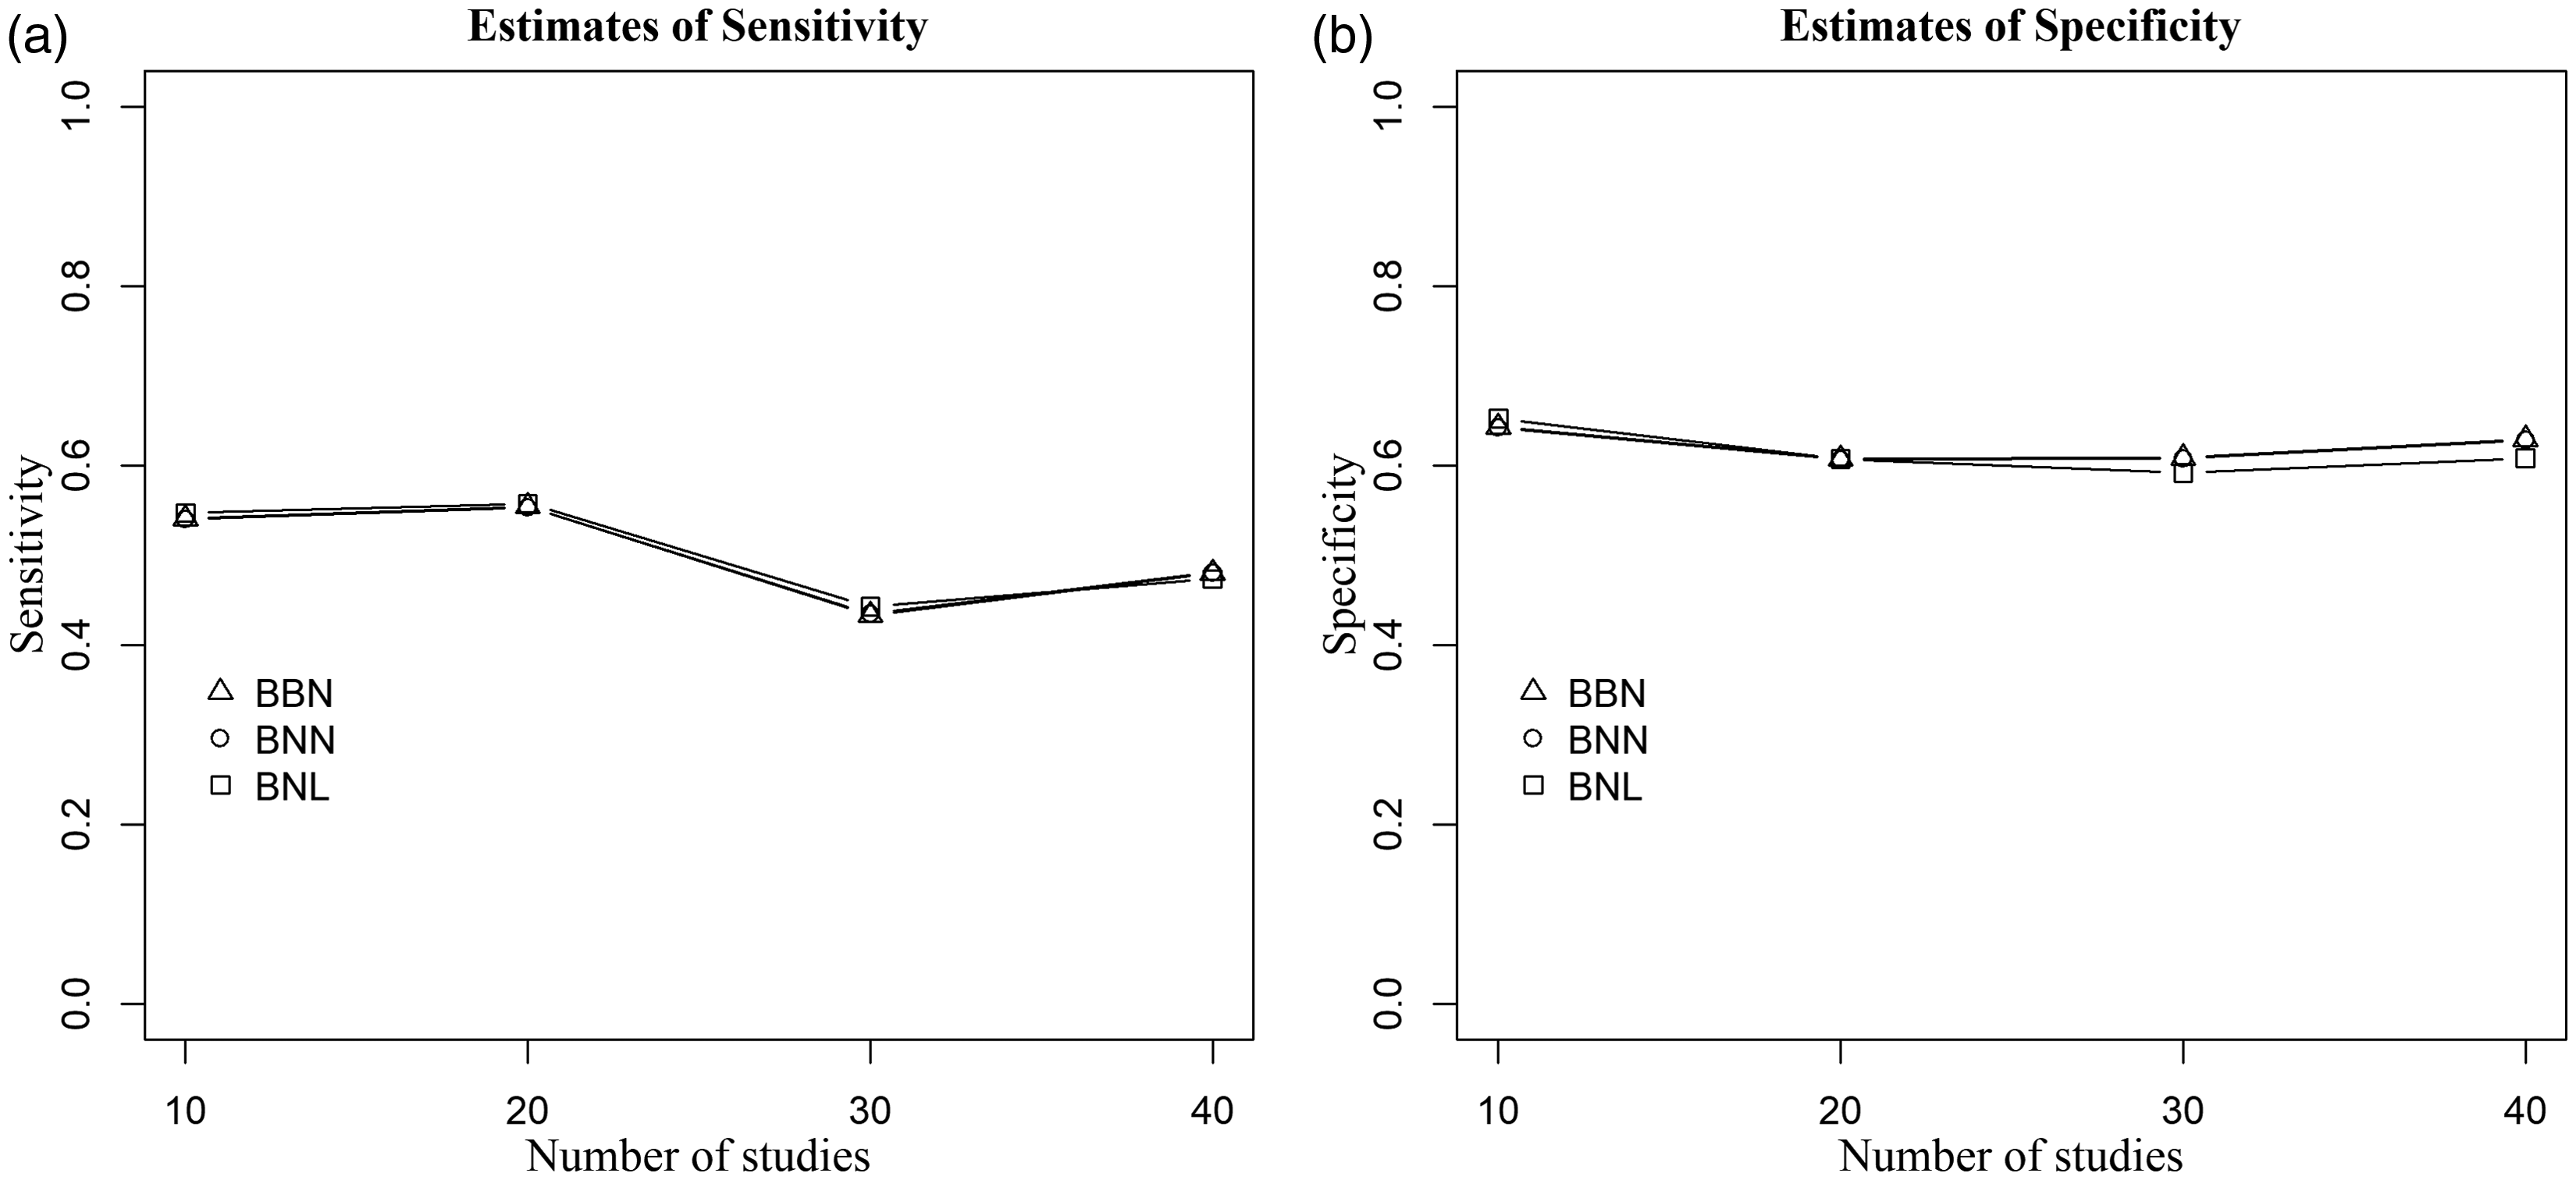
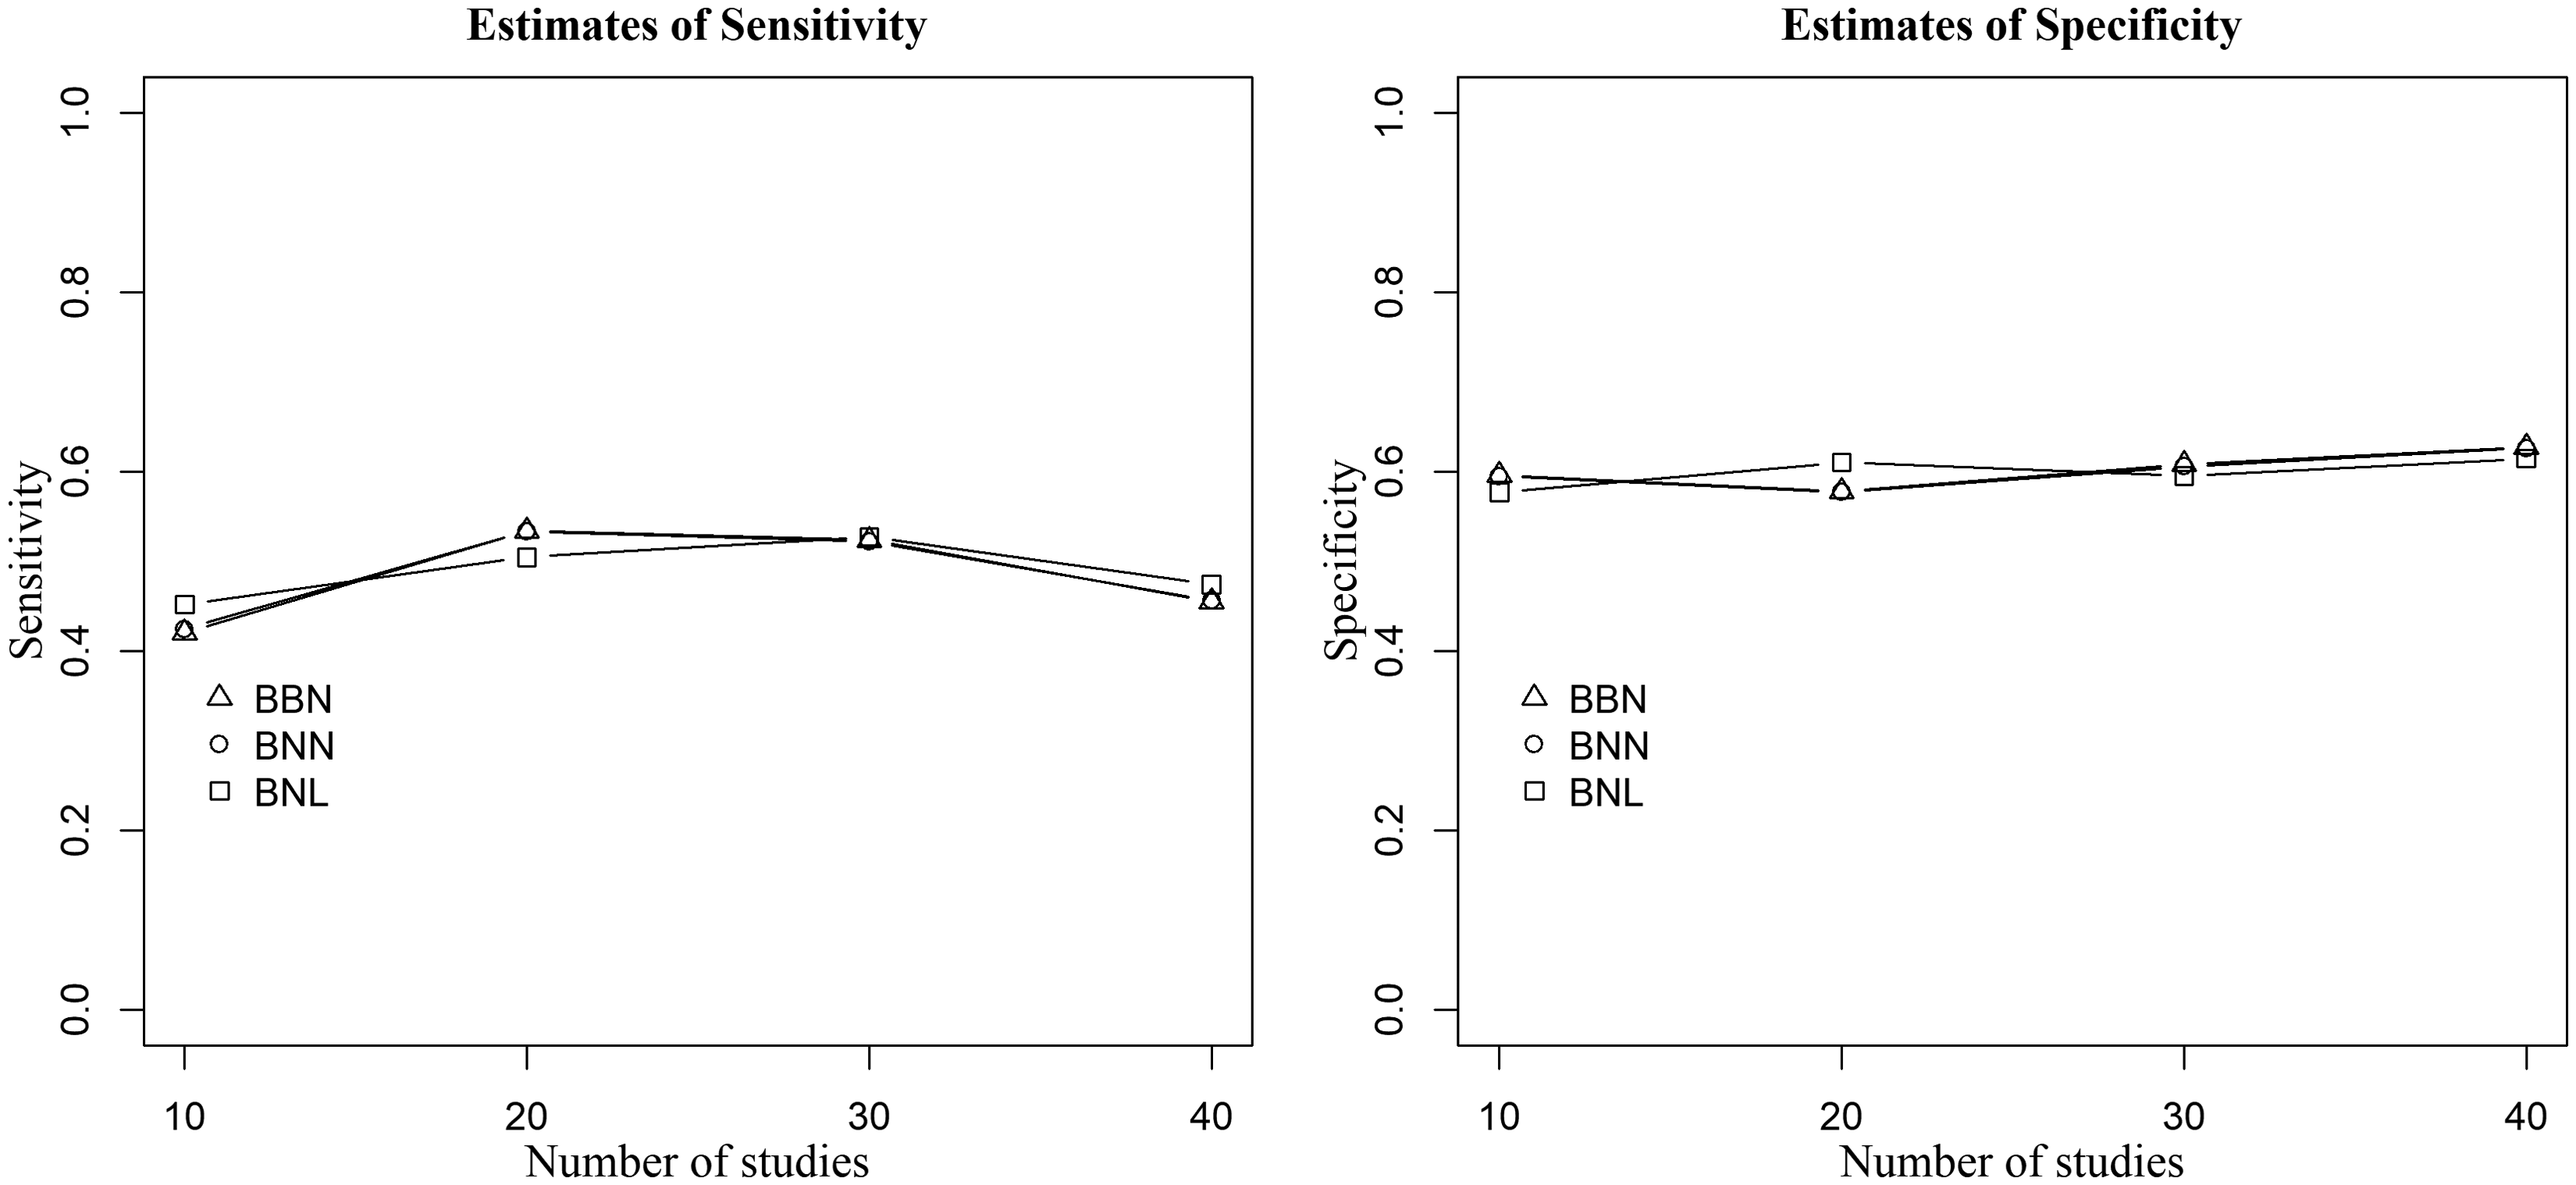
The results when outlying and influential studies are incorporated only in Sp, the between-study variances are large, and random-effects are simulated from the bivariate normal distribution are displayed in Figure 5. The absolute (relative) change in specificity of the BNL model and the BNN model varies from 4% (6%) to 6% (10%), and that of between the BNL model and the BBN model ranges between 1% (1%) and 3% (4%). On the other hand, the absolute (relative) change in Sp between the BNL and BNN model, and the BNL and BBN model was between 2% (2%) and 9% (15%), and between 0% (0%) and 10% (13%), respectively, when the random-effects are simulated from the bivariate Laplace distribution. Once again our proposed model produced similar estimates in sensitivity to the standard models suggesting that the BNL model is robust to outlying and influential studies. Analogous results had been noticed when the small between-study variances are assumed.
Figure 5. Point estimates of sensitivity (left) and specificity (right) of the three methods when data are generated from the bivariate normal distribution,
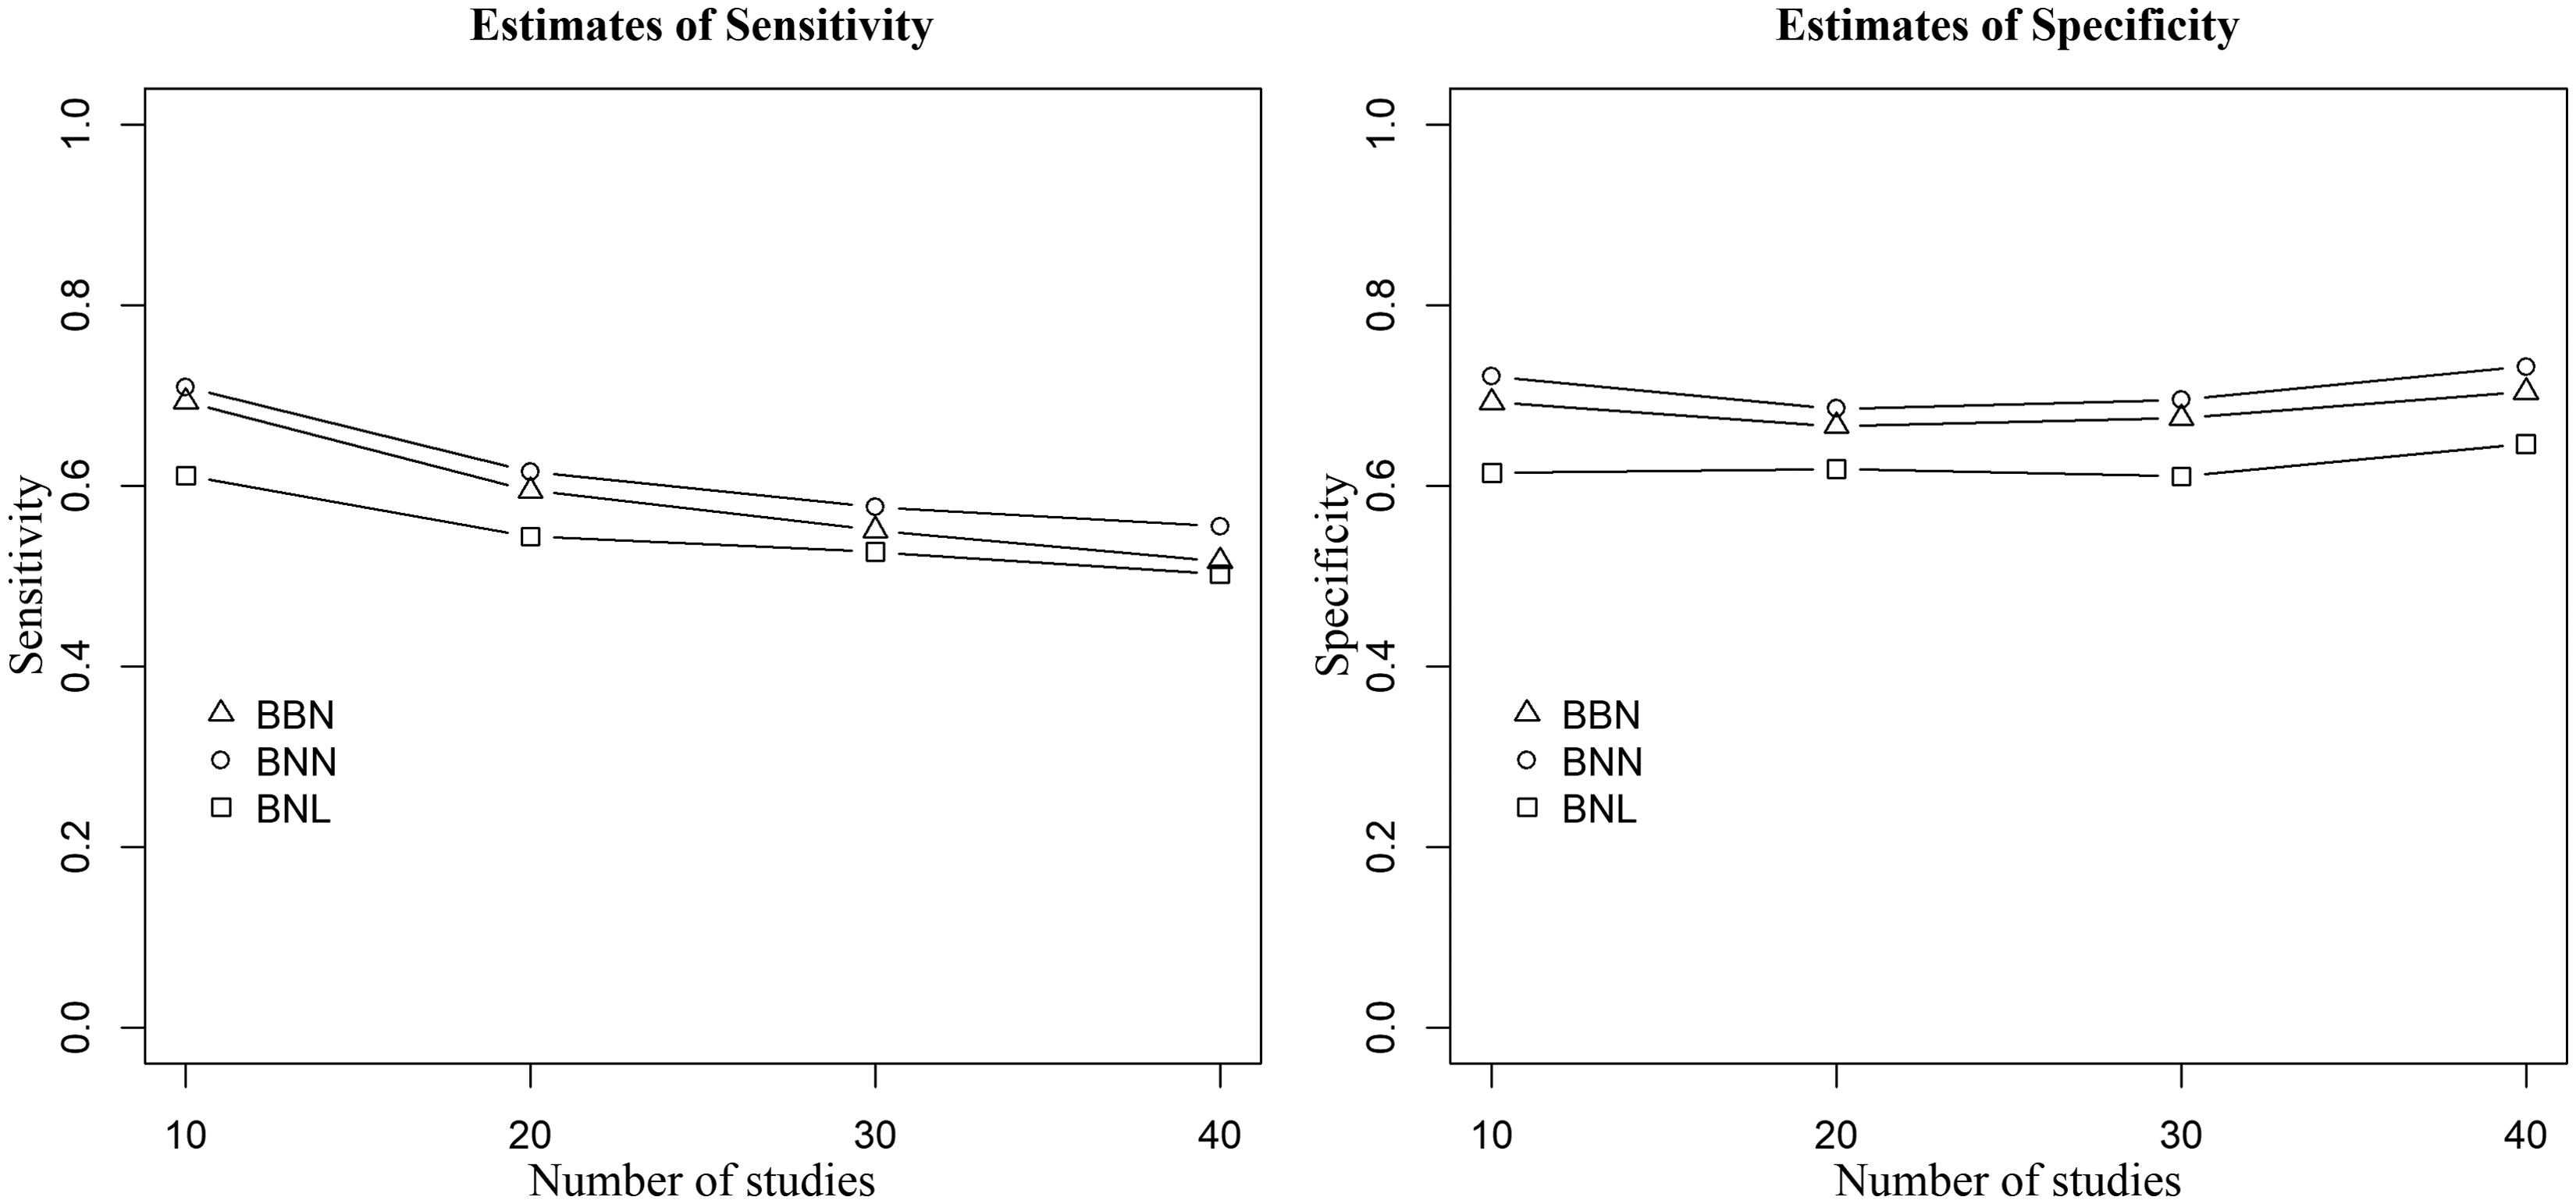
Finally, Figure 6 presents the results of the three models when there are no outlying and influential studies neither in Se nor in Sp, and the random-effects are generated from the bivariate normal distribution. Figure 6 depicts that the three models yielded similar estimates of sensitivity and specificity when there are no outlying and influential studies. This result further illustrates that our proposed BNL model is robust to outlying and influential studies. Similar results have been observed when the random-effects are generated from the bivariate Laplace distribution.
Figure 6. Point estimates of sensitivity (left) and specificity (right) of the three methods when data are generated from the bivariate normal distribution,
To understand the effect of smaller within-study sample sizes and varying the between-study covariance between test-sensitivity and test-specificity, we performed additional simulation study by considering “small” (n1=30, n2=50) and “medium” (n1=50, n2=100) within-study sample sizes, and zero (σ12=0) and non-zero (σ12=−0.5) between-study covariance in addition to the parameters considered in Section 4.1. We summarize our findings below and provide the detailed results with additional figures in Appendix E of the on-line supplementary material.
Figures 7 to 10 present our additional simulation study results when there is non-zero covariance between test-sensitivity and specificity, the within-study sample sizes are medium (n1 = 50, n2 = 100), outlying and influential studies are generated using large between-study variances (
Point estimates of sensitivity (left) and specificity (right) of the three methods when data are generated from the bivariate Laplace distribution,
Figure 8. Point estimates of sensitivity (left) and specificity (right) of the three methods when data are generated from the bivariate Laplace distribution,
Point estimates of sensitivity (left) and specificity (right) of the three methods when data are generated from the bivariate Laplace distribution,
Point estimates of sensitivity (left) and specificity (right) of the three methods when data are generated from the bivariate Laplace distribution,
In summary, the proposed BNL model produced less biased point estimates of the pooled sensitivity and specificity, precise corresponding confidence intervals, and is robust to model misspecification. Moreover, it was observed that the influence of outlying and influential studies on both the point and interval estimates of Se and Sp upsurges as both the within-study sample sizes and between-study covariance increase.
5 Illustrative examples
This section will discuss the results of the standard and proposed methods when applied to the two datasets introduced in section 2.
5.1 NEE data
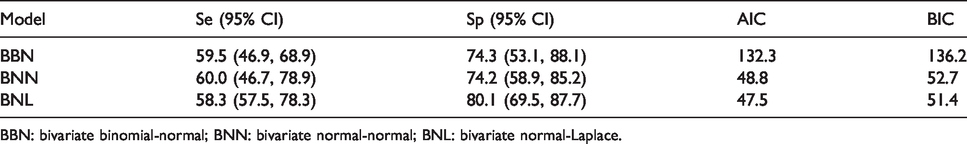
Table 1 displays results of the three methods when fitted to the NEE dataset. The results indicate that the presence of three outlying and influential studies made a significant difference in the point and interval estimates of the pooled sensitivity and specificity among the models. A particularly significant difference is observed between the results of the standard BBN model and the proposed BNL model. Study 3, which was detected as influential in sensitivity, caused the BBN model to yield an overall Se which is larger than that of the proposed model by 4.4% (6.4%) in absolute (relative) value. On the other hand, the two influential studies in specificity resulted in a 5.6% and 6.6% drop, respectively, in the absolute and relative Sp of the BBN model compared to the BNL model. The impact of these influential studies in absolute (relative) value corresponded to a 1.6% (2.3%) increase in pooled Se and a 2.2% (2.6%) decrease in pooled Sp of the BNN model compared to the BNL model. Moreover, the proposed model produced precise estimates as it yielded narrower confidence intervals. Finally, both the AIC and BIC selected the proposed model as the best model to explain the NEE dataset.
Sensitivity (95% CI), specificity (95% CI) in percent and model comparison statistics for the NEE data.
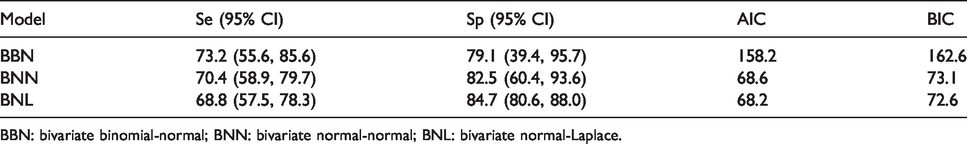
BBN: bivariate binomial-normal; BNN: bivariate normal-normal; BNL: bivariate normal-Laplace.
5.2 MMSE data
We present the meta-analysis results of the methods when applied to the MMSE data in Table 2. As expected, the three models yielded similar point estimates in the overall sensitivity. However, the two influential studies in specificity caused both the BNN and BBN models to result in a respective 6.0% (7.4%) and 5.8% (7.3%) reduction in absolute (relative) Sp compared to the proposed BNL model. Additionally, our proposed model yielded precise estimates as observed from the CIs, and also chosen by the AIC and BIC to be the best model to describe the MMSE data.
Sensitivity (95% CI), specificity (95% CI) in percent and model comparison statistics for the MMSE data.
BBN: bivariate binomial-normal; BNN: bivariate normal-normal; BNL: bivariate normal-Laplace.
6 Discussion
This article aimed at addressing the need for a robust statistical method for meta-analysis of DTA data when there are outlying and/or influential studies. With the aim of making a robust inference, a new bivariate random-effects meta-analysis model that automatically downweights the impact of outlying and influential studies on the point and interval estimates of the overall sensitivity and specificity is proposed and compared against the well-established meta-analysis methods for DTA studies.
The proposed method is motivated by using two real-life meta-analyses and had also been demonstrated and validated using simulated data. The simulation study was designed to demonstrate the performance of our proposed BNL model when outlying and influential studies are present only in Se, only in Sp, both in Se and Sp, and neither in Se nor in Sp. Under each of the four settings, regardless of the other parameters varied, our proposed model produced robust point estimates in Se and Sp compared to the standard models. Of the standard models, the BBN model yielded relatively robust estimates compared to the BNN model.
In terms of confidence intervals for sensitivity and specificity, our proposed BNL model produced precise confidence intervals relative to the standard models regardless of the parameters varied in our simulation including the distributional assumption for the random-effects. Comparing the standard models, the BBN model yielded narrower confidence intervals than the BNN model. Results of the two published meta-analyses were also in line with our simulation study as the proposed BNL model produced robust and precise point and interval estimates of the overall sensitivity and specificity. Moreover, the proposed model was shown to have demonstrated a better fit according to the information criteria (AIC and BIC).
Although we have chosen to use parameter estimates of the BNN model as starting values to start the MCEM algorithm of our proposed BNL model, we observed that the algorithm converged to similar values when employing different starting values, showing that the proposed method is robust to the choice of starting values. Additionally, the proposed method converged for all the scenarios considered in our simulation study and real-data examples. Obviously, as for every EM algorithm, fitting our proposed BNL model takes longer time than the standard methods. However, due to its demonstrated superior performance to the standard models and the need for making an accurate inference to inform evidence-based decision-making, it is worth waiting the extra time to use the robust method we proposed here. In fact, the computational time can significantly be reduced by using parallel computing as we did for our study in this paper. We implemented our methodology using the R open-source statistical software, and the R code is available online as a supplementary material on the publisher’s website.
Our proposed BNL model has potential limitations. Although the EM algorithm is in general slower than other methods of finding MLE, the MCEM algorithm is even slower due to the required MC samples at each iteration of the algorithm. As a result, the BNL model takes longer computational time compared to the standard methods. Additionally, the BNL model does not discuss the impact of outlying and/or influential studies on the summary receiver operating characteristics (SROC) curve.
In summary, we proposed a flexible bivariate random-effects model for meta-analysis of DTA studies with the aim of accommodating outlying and influential studies, as a direct response to the study of Negeri and Beyene 4 which called for such methods to be developed. Our methodology is based on the assumption that the within-and between-study variation in sensitivity and specificity can approximately be described by the bivariate normal and Laplace distribution, respectively. That led to a new bivariate random-effects model which has the same number of parameters as the standard models but which possesses flexibility (as it avoids removing potential outlying and influential studies) and robustness to the distributional assumption for the random-effects and presence of outlying and influential studies. Due to its flexibility and robustness properties, we believe that our proposed BNL method is a good addition to the meta-analytic literature and an alternative to the standard models for practitioners and researchers in general.
Supplemental Material
sj-zip-1-smm-10.1177_0962280220925840 - Supplemental material for Robust bivariate random-effects model for accommodating outlying and influential studies in meta-analysis of diagnostic test accuracy studies
Supplemental material, sj-zip-1-smm-10.1177_0962280220925840 for Robust bivariate random-effects model for accommodating outlying and influential studies in meta-analysis of diagnostic test accuracy studies by Zelalem F Negeri and Joseph Beyene in Statistical Methods in Medical Research
Supplemental Material
sj-pdf-2-smm-10.1177_0962280220925840 - Supplemental material for Robust bivariate random-effects model for accommodating outlying and influential studies in meta-analysis of diagnostic test accuracy studies
Supplemental material, sj-pdf-2-smm-10.1177_0962280220925840 for Robust bivariate random-effects model for accommodating outlying and influential studies in meta-analysis of diagnostic test accuracy studies by Zelalem F Negeri and Joseph Beyene in Statistical Methods in Medical Research
Footnotes
Acknowledgements
JB holds the John D. Cameron Endowed Chair in the Genetic Determinants of Chronic Diseases, McMaster University.
Declaration of conflicting interests
The author(s) declared no potential conflicts of interest with respect to the research, authorship, and/or publication of this article.
Funding
The author(s) disclosed receipt of the following financial support for the research, authorship, and/or publication of this article: JB would like to acknowledge funding from the Natural Sciences and Engineering Research Council of Canada (NSERC) and the Canadian Institutes of Health Research (CIHR).
Supplemental material
Supplementary material for this article is found on-line on the publisher’s website.
References
Supplementary Material
Please find the following supplemental material available below.
For Open Access articles published under a Creative Commons License, all supplemental material carries the same license as the article it is associated with.
For non-Open Access articles published, all supplemental material carries a non-exclusive license, and permission requests for re-use of supplemental material or any part of supplemental material shall be sent directly to the copyright owner as specified in the copyright notice associated with the article.