
Abstract
Haplotype-based association methods have been developed to understand the genetic architecture of complex diseases. Compared to single-variant-based methods, haplotype methods are thought to be more biologically relevant, since there are typically multiple non-independent genetic variants involved in complex diseases, and the use of haplotypes implicitly accounts for non-independence caused by linkage disequilibrium. In recent years, with the focus moving from common to rare variants, haplotype-based methods have also evolved accordingly to uncover the roles of rare haplotypes. One particular approach is regularization-based, with the use of Bayesian least absolute shrinkage and selection operator (Lasso) as an example. This type of methods has been developed for either case-control population data (the logistic Bayesian Lasso (LBL)) or family data (family-triad-based logistic Bayesian Lasso (famLBL)). In some situations, both family data and case-control data are available; therefore, it would be a waste of resources if only one of them could be analyzed. To make full usage of available data to increase power, we propose a unified approach that can combine both case-control and family data (combined logistic Bayesian Lasso (cLBL)). Through simulations, we characterized the performance of cLBL and showed the advantage of cLBL over existing methods. We further applied cLBL to the Framingham Heart Study data to demonstrate its utility in real data applications.
Keywords
1 Introduction
Genome-wide association studies (GWAS) have brought considerable successes, as many genetic variants have been identified to be associated with various common diseases. However, most single nucleotide polymorphisms (SNPs) detected by GWAS have small effect sizes, and for most traits, a large portion of the expected heritability is left unexplained. 1 With the advent of next-generation sequencing technology, more and more researchers have utilized the new technology and proposed many methods focusing on rare single nucleotide variants (rSNVs). For example, burden tests2–4 reduce all the rSNVs in a gene or a region of the genome to a single super variant, while sequence kernel association test (SKAT)-based methods5–8 rely on testing the variance components rather than the means. These methods have increased power for detecting region-based associations compared to traditional GWAS methods, but there are drawbacks. First, these methods are not designed for pinpointing the contribution of specific variants. Second, there is no single method that is uniformly most powerful. SKAT is more powerful when a few rSNVs have large effects, but its power diminishes when there are also effective common variants. 9
In contrast, a haplotype is composed of alleles at multiple SNPs (typically located within a haplotype block) inherited from a single parent. It can be advantageous to investigate haplotype-based rather than SNP-based associations. Haplotypes usually have a larger effect size than SNPs because of the cis effect,10,11 where the impact on the phenotype depends on whether the variant alleles are on the same chromosome or not. Haplotype-based methods can also enjoy higher power because they take the linkage disequilibrium structure into account implicitly. Traditionally, methods for haplotype associations heavily focus on common haplotypes. In the last decade, however, as the focus shifts to understanding the role of rare variants in the recovery of missing heritability, a number of methods have been developed for uncovering associations of rare haplotypes with common diseases. Guo and Lin 12 offered a regularized generalized linear model (rGLM) method to better estimate rare haplotype effects based on the least absolute shrinkage and selection operator (Lasso), 13 where the effect sizes of non-associated haplotypes are shrunken to 0. This represents a solution for detecting rare haplotype association based on variable selection. By doing so, the associated haplotype effects can be estimated more precisely. Tzeng and Bondell 14 proposed an L1 penalized regression for both quantitative and qualitative traits, and the L1 penalty is imposed on the coefficients of pairwise rather than individual haplotypes so that group structure can be evaluated, although this method does not particularly focus on rare haplotypes. On the other hand, methods that focus on using haplotype-based approaches to tag rare variants have also been proposed. For example, Lin et al. 15 proposed an approach that uses the inverse weights of haplotype similarities to detect uncommon causal variants, while Lin et al. 16 developed the haplotype kernel association test that detects rare casual variants by evaluating the variance of random haplotype effects. Biswas and Lin 17 developed logistic Bayesian Lasso (LBL), a regularization method under the Bayesian framework, 18 which provides variability measures for the effect sizes, a feature lacking in optimization-based approaches such as rGLM. Wang and Lin 19 extended LBL to family-triad-based logistic Bayesian Lasso (famLBL) for a case-parents triad family design. Although haplotype-based methods enjoy some advantageous properties as described above, they have their own limitations. Since haplotypes are still, by and large, unobservable due to limited (expensive) technology, modeling the relationship between SNPs and a phenotype via haplotypes is much more complicated compared to studying effects of individual SNPs or a set of SNPs through collapsing approaches. Further, mainly due to the modeling complexity, the computation cost is also much higher than SNP-based methods.
While methods using case-control data generally enjoy higher power than family-based approaches under ideal situations and are easier to implement, population structures, either explicit or cryptic, can lead to elevated Type I error rates if not properly accounted for. In addition, family-based designs are innately more genetically homogeneous, robust to population substructures, and hence more likely to harbor the same risk variants. 20 However, families are more difficult to recruit, generally have more non-participation, and may suffer from false parentage, in addition to being less powerful.
Since both family-based and population-based methods have their own drawbacks, data collected from both designs are frequently available, and researchers have long been developing and studying methods for combining multiple designs to boost statistical power. Recent efforts rely on finding the best weight to optimally combine the p values of different analyses to achieve the best power.21,22 Since a Bayesian analytical framework does not lead to p values, this approach is not directly applicable. Another commonly used approach is to introduce a kinship coefficient between individuals, using either observed or estimated kinships based on genetic data to correct for relatedness.23–25 Although this general framework could be adopted for haplotype-based approaches, this may not be the most efficient way of handling the types of data we are using.
In this paper, we propose a novel and unified method, combined logistic Bayesian Lasso (cLBL), that combines data from both case-control and case-parents triad designs by devising a likelihood that can accommodate both designs, with LBL and famLBL as two special cases. Compared to comparable-sized data from a pure case-parents triad design, our proposed method has higher power. On the other hand, compared to using purely case-control data from a population-based design, this method provides more protection against population stratification. Furthermore, our method is in the Bayesian framework, which allows us to incorporate uncertainties in haplotyping. In addition, cLBL enjoys other nice properties of LBL and famLBL, such as its retrospective likelihood formulation to account for data sampling scheme as well as its ability to shrink the coefficients of the unassociated haplotypes toward zero, a property that may be viewed as the counterpart of variable selection in rGLM. We assess the performance of cLBL and its comparison with famLBL and LBL using both simulated data and data from the Framingham Heart Study (FHS).
2 Methodology
2.1. Model specification
Suppose we have

Suppose we also have m case-parents trios, and the individuals in the trios are independent from the previous n individuals in the case-control study. Similarly, for the jth trio, let Yjc = 1 represent the fact that the child is affected. Let
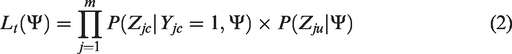

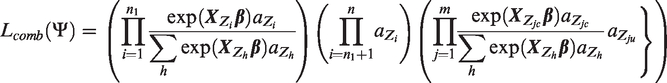
To elaborate on the likelihood and the associated parameter vector
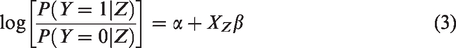
These specifications lead to the following detailed expression
We cast the problem into a Bayesian framework and adopt the prior specifications similar to those of LBL and famLBL. Specifically, each βl is assumed to follow independent and identically distributed Laplace distribution with mean 0 and standard deviation
2.2. Posterior distribution and statistical inference
With the likelihood and priors completely specified above, we can write down the posterior distribution

Once the Markov chain is judged to have converged based on standard diagnostic tools,31–34 inference of the
3 Simulation
Extensive simulations were conducted to compare the performance of cLBL with those of LBL and famLBL. We considered two broad scenarios: under the first scenario, the data were generated from a single homogeneous population; under the second scenario, the data were generated from stratified populations, where the families, cases, and controls were assumed to be from various mixtures of two populations. Type I error, power, and other performance measurements were assessed. The convergence of the Markov chains was evaluated with several standard diagnostic tests.31–34
3.1. Simulation settings and procedures
3.1.1. Simulation Scenario I
These simulations considered data from a homogeneous population. We consider three haplotype distributions, HS1, HS2, and HS3, composed of 6, 9, and 12 haplotypes, respectively (Table 1). For this scenario, only the frequencies under Pop1 (Table 1) were used. For each distribution, we simulated three situations: two rare haplotypes (frequency < 0.05) as causal (RR); one rare and one common haplotype as causal (RC); and only one common haplotype as causal (C). Additionally, we have also considered the situation where all the haplotypes are null (i.e. do not have an effect on the phenotype) to show that the Type I errors are well under control (Supplementary Table S3).
Haplotype distributions and disease models.
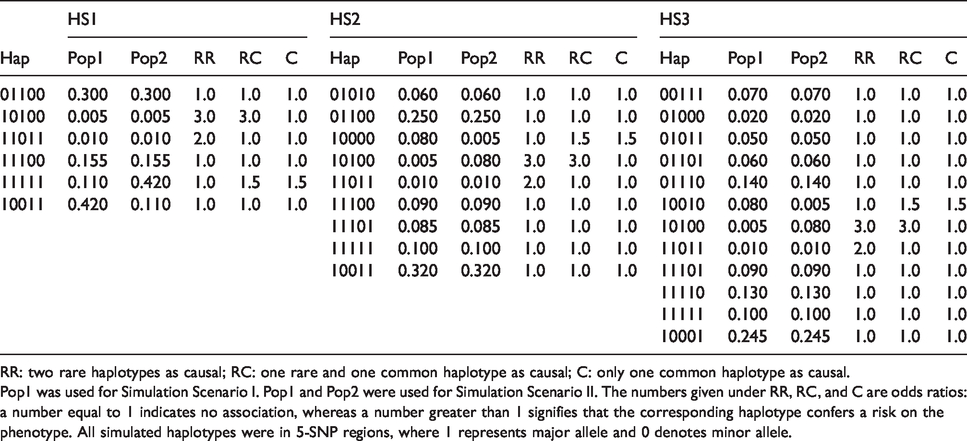
RR: two rare haplotypes as causal; RC: one rare and one common haplotype as causal; C: only one common haplotype as causal.
Pop1 was used for Simulation Scenario I. Pop1 and Pop2 were used for Simulation Scenario II. The numbers given under RR, RC, and C are odds ratios: a number equal to 1 indicates no association, whereas a number greater than 1 signifies that the corresponding haplotype confers a risk on the phenotype. All simulated haplotypes were in 5-SNP regions, where 1 represents major allele and 0 denotes minor allele.
3.1.2. Simulation Scenario II
These simulations were designed to mimic data coming from stratified populations. As discussed earlier, LBL is more sensitive (resulting in elevated Type I error) than famLBL in the presence of stratified populations. Since the cLBL analysis also includes data that are case-control in nature, cLBL is also expected to have elevated Type I error in that setting, although to a lesser extent. Therefore, under this scenario, we are most interested in evaluating Type I error of cLBL under different “case-control to trio family” (CC/Fam) ratios. The CC/Fam ratio is defined as the ratio of the number of case-control units to that of family trio units, and it will be explained more in the Data generation subsection. For all the simulations, we assumed that the data came from various mixtures of two populations (Pop1 and Pop2 in Table 1): the cases and parents of trios were assumed to be from a 50-50 mixture of Pop1 and Pop2, whereas the controls were generated from a 20-80 mixture of Pop1 and Pop2. Thus, the controls are clearly different from the cases.
3.1.3. Data generation
We considered an additive model in which two copies of a risk haplotype doubles the log odds of being affected when there is only one copy. For cases and controls, an individual’s haplotype pair was generated using the haplotype distribution (or mixture of distributions) for each setting. The disease status was then sampled based on the binomial probability of a specific disease model, as specified in Table 1. For a trio family, the father and mother’s haplotype pairs were generated using the haplotype distribution, and one haplotype from each parent was then randomly selected and passed to the child assuming no recombinations. The affection status of the child was determined based on the same binomial distribution as the one for generating case-control data, whereas the affection status of the parents was left unspecified. A trio would be kept only if the child was affected. A total of 1000 replicates were run in each setting.
Under Simulation Scenario I, 500 trios, 500 cases, and 500 controls were generated in each replicate for each of the three disease models and each of the haplotype settings (HS1, HS2, and HS3). The famLBL analysis used the 500 trios as it only caters to case-parents trio data. The LBL used the data in two ways. In the first way, LBL only used the 500 cases and 500 controls so that its data size is comparable to that of famLBL, as each trio may be thought of as a matched pair and thus contributed one “case” and one “control”. 19 In the second way, in addition to the 500 cases and 500 controls, LBL also included the 500 affected children from the 500 trios as cases, which simulates the situation where only LBL is available but the users would like to make full use of the available data. Finally, cLBL used all data as it can handle correlated trio data and independent case/control data at the same time.
Under Simulation Scenario II, depending on the CC/Fam ratio, the number of case/control units and trios were generated accordingly, keeping the total number of case/control units and trios to 1000. For example, if the CC/Fam ratio is 0.5, then we have 500 case/control units (i.e. 500 controls and 500 trios) and 500 trios. The reason for matching each case/control unit (one case and one control) to a trio is because a trio can be viewed as a matched pair. As such, our simulated datasets have the same number of cases and controls. Similarly, if the CC/Fam ratio is 0.3, then there are 300 case/control units (i.e. 300 cases and 300 controls) and 700 trios.
3.2. Results
Figure 1 shows the result for Scenario I where haplotypes were generated from a single (homogeneous) population, Pop1. The solid horizontal lines were drawn at the 0.05 level in all subfigures for Type I error evaluation. The dashed vertical lines were set in the subfigures to separate the neutral and associated haplotypes such that those to the left of the lines denote Type I errors while those to the right represent powers. We analyzed the data in three ways: original famLBL with only trio data, original LBL with two levels of data (LBLnc: 500 cases and 500 controls; LBLc: also including the 500 children of the trios leading to a total of 1000 cases and 500 controls), and our proposed cLBL that takes all available data. From the figure, one can see that cLBL, famLBL, and LBL with the two levels of data all control Type I error. On the other hand, cLBL always provides the highest power, whereas famLBL always returns the lowest power, with the power for LBLnc in between the two, as expected. Furthermore, not surprisingly, LBLnc returns lower power than LBLc, because LBLc includes 500 additional cases (children in the trios) in the analysis. Focusing on the RR scenarios (left column of Figure 1), we see that the haplotype with a smaller frequency (0.005) was in fact detected with a greater power than the one with a higher frequency (0.01), since the larger effect size (odds ratio of 3 versus 2) was able to outweigh the rarity of the variant. On the other hand, when there is a much greater discrepancy in the frequencies in the RC scenario (second column of Figure 1), even a relatively larger effect size (3 versus 1.5) was not able to overcome the rarity of the haplotype, resulting in the common haplotype having a larger power. Note that since one of the haplotypes (11100 in HS1, 10011 in HS2, and 10001 in HS3) was chosen as the reference haplotype, the number of haplotypes shown in the plots is one fewer than that shown in Table 1.
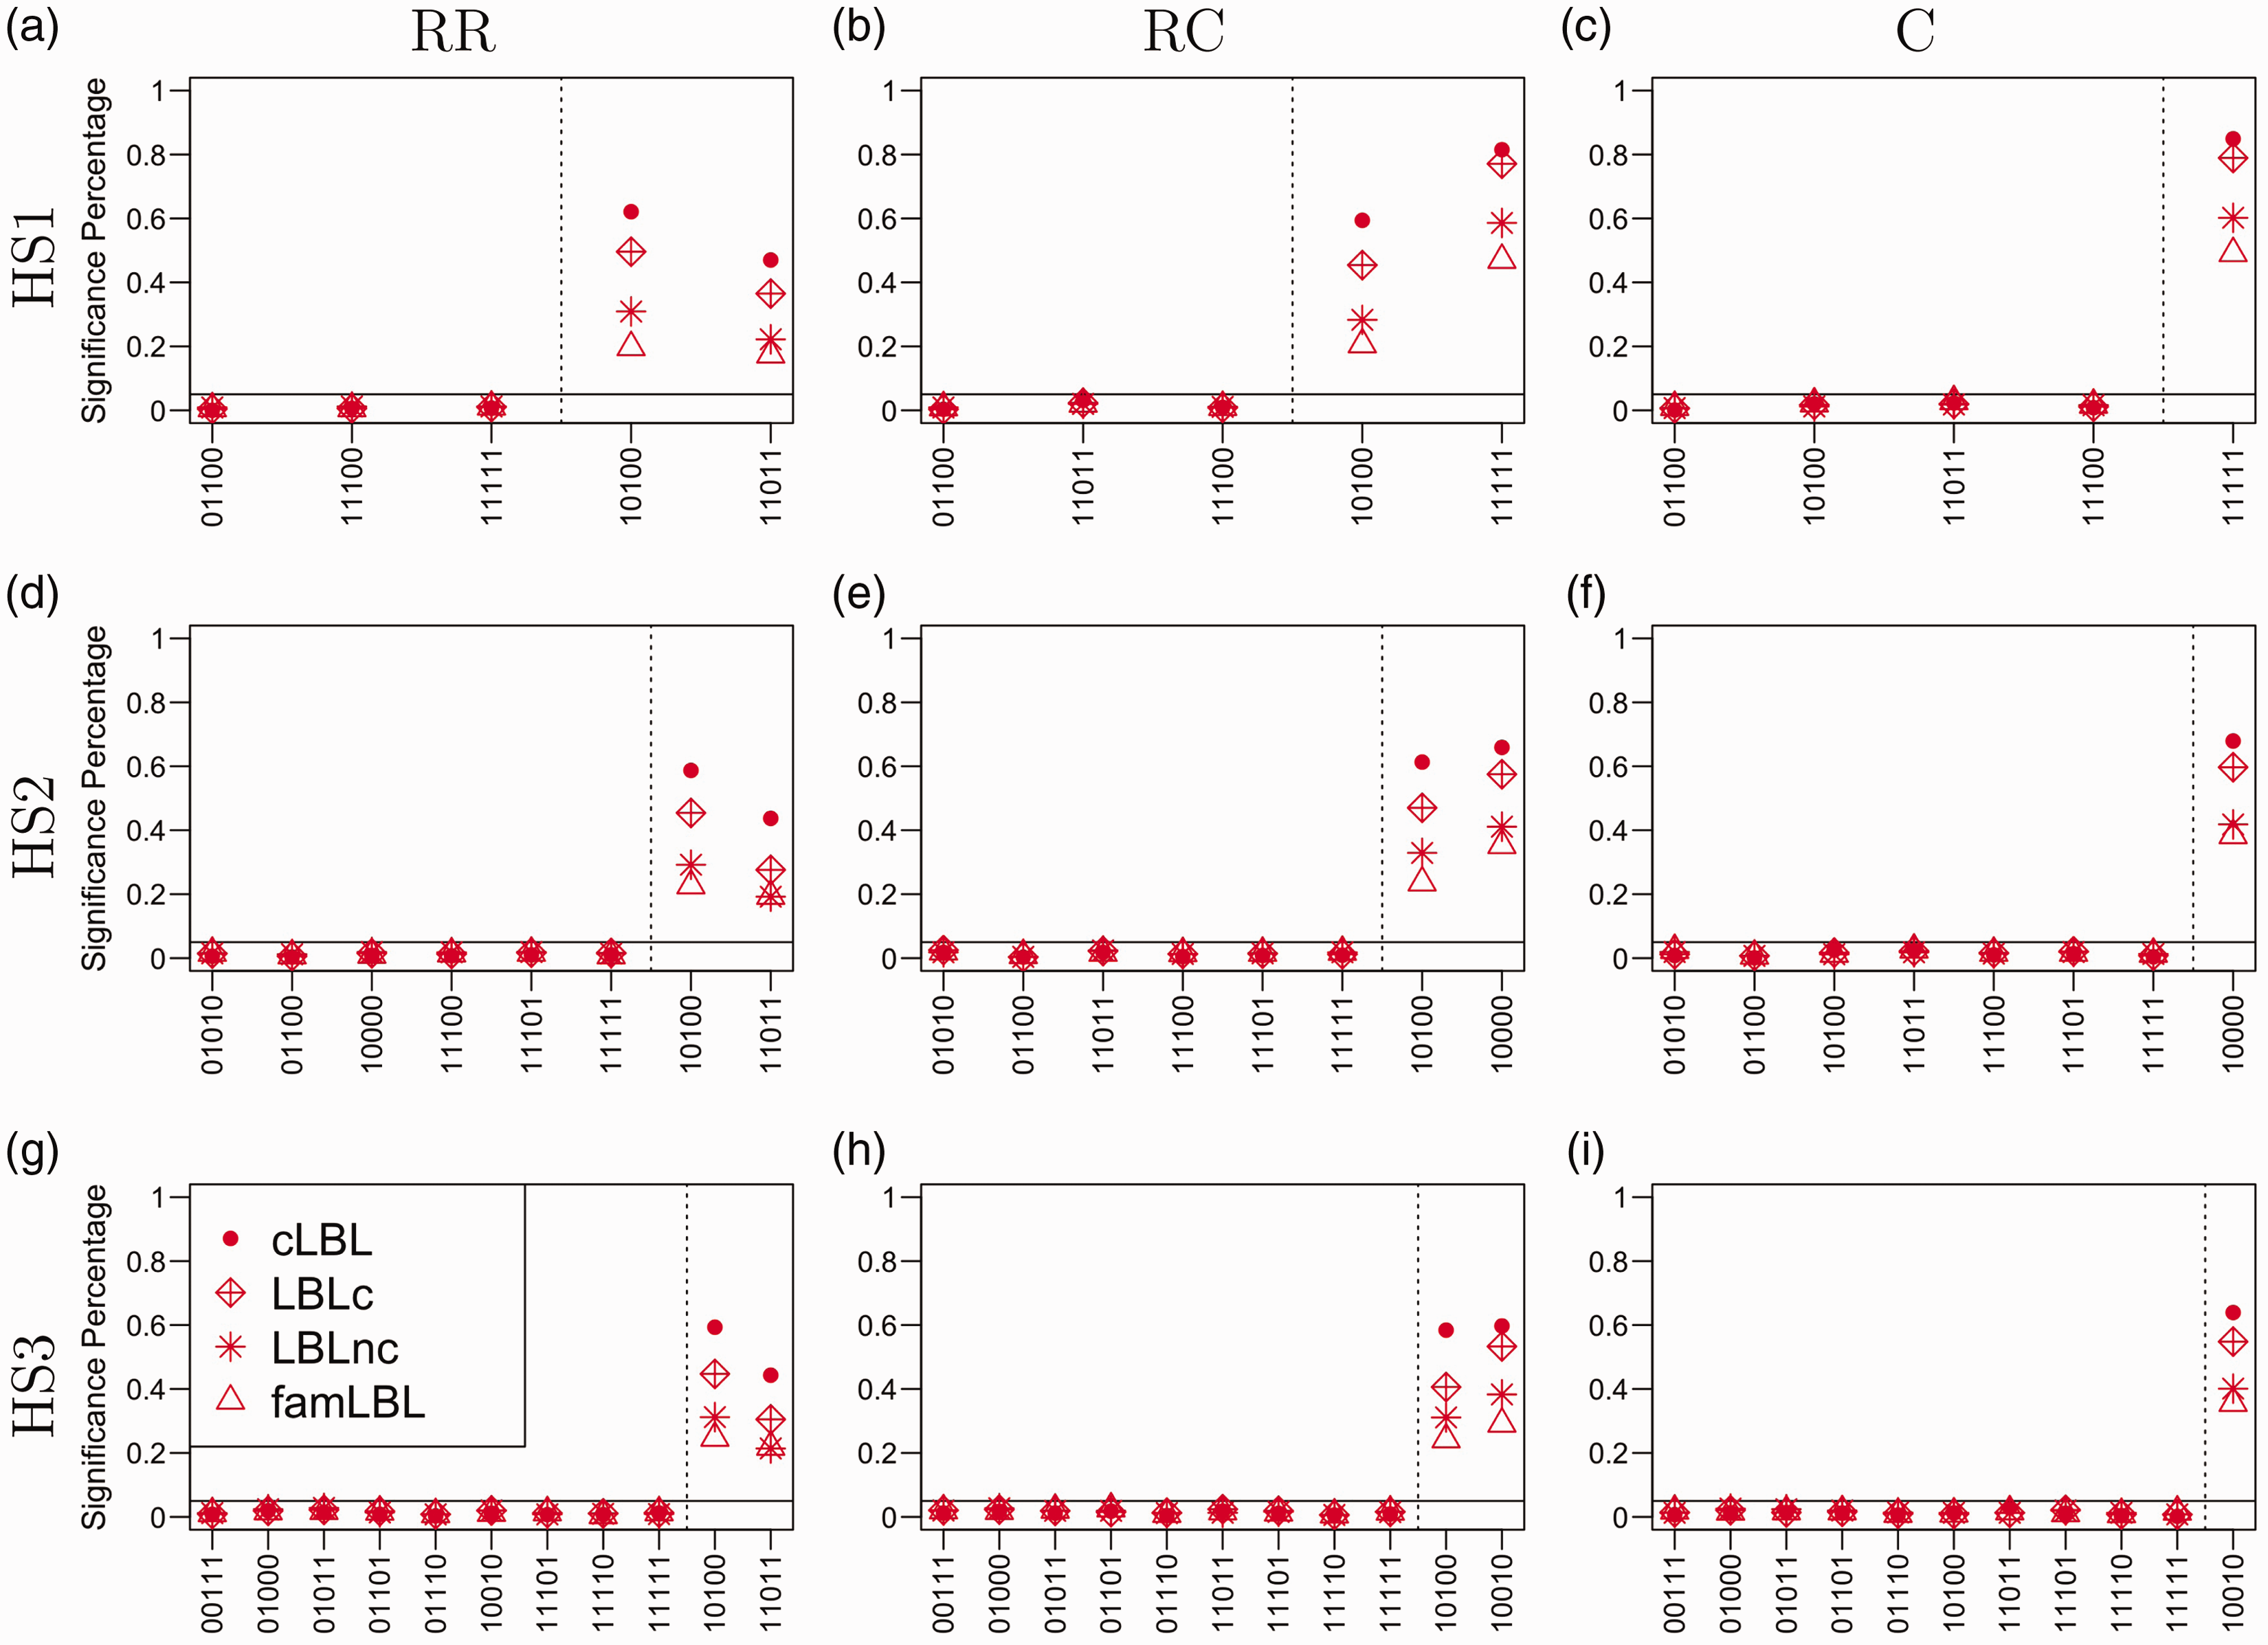
Performance comparison under the homogeneous population setting for four analyses: cLBL, famLBL, and LBL with two levels of data (LBLnc if it only used the 500 cases in the case-control design, or LBLc if children of the trios were also added as cases for the LBL analysis). The three plots in the first column represent the situations where there were two rare associated haplotypes; the three plots in the middle column represent the situations where there were one rare associated haplotype and one common associated haplotype; the three plots in the last column represent the situations where there was one common associated haplotype. On the other hand, the three rows of the plots are for the three haplotype settings. Type I error rate and power are separated by the dashed vertical line in each plot. cLBL, LBLc, LBLnc, and famLBL are denoted by dots, diamonds, stars, and triangles, respectively.
Under Simulation Scenario II, the trios, cases, and controls were sampled from different stratified populations. Wang and Lin 19 showed that famLBL is immune from stratification, whereas LBL suffers from elevated Type I error. Since cLBL contains case/control data, it is expected to be affected by population stratification as well, but to a lesser extent, since it also includes family trio data that offer internal control. If the case/control portion is small relative to the trio data portion, we would expect cLBL to be relatively robust to population stratification. Figure 2 shows the cLBL results under Scenario II. As in Figure 1, the solid horizontal lines mark the nominal level of 0.05, whereas the dashed vertical lines separate the null haplotypes from the associated ones. One can see that when the CC/Fam ratio is 50/50, some of the haplotypes have elevated Type I error. This observation is consistent with the results in famLBL. 19 When the ratio decreases to 30/70 or 10/90, the Type I errors for the problematic haplotypes drop down to the nominal level. Regarding power, in general, cLBL returned the highest power under the 50/50 ratio and the lowest power under the 10/90 ratio, but exceptions did occur. For the haplotype setting under the RC and C models (Figure 2(b) and (c)), cLBL in fact had higher power for data with lower case/control ratio for haplotype h11111. This phenomenon could be due to a larger number of copies of the haplotype among the affected for a smaller case/control population.
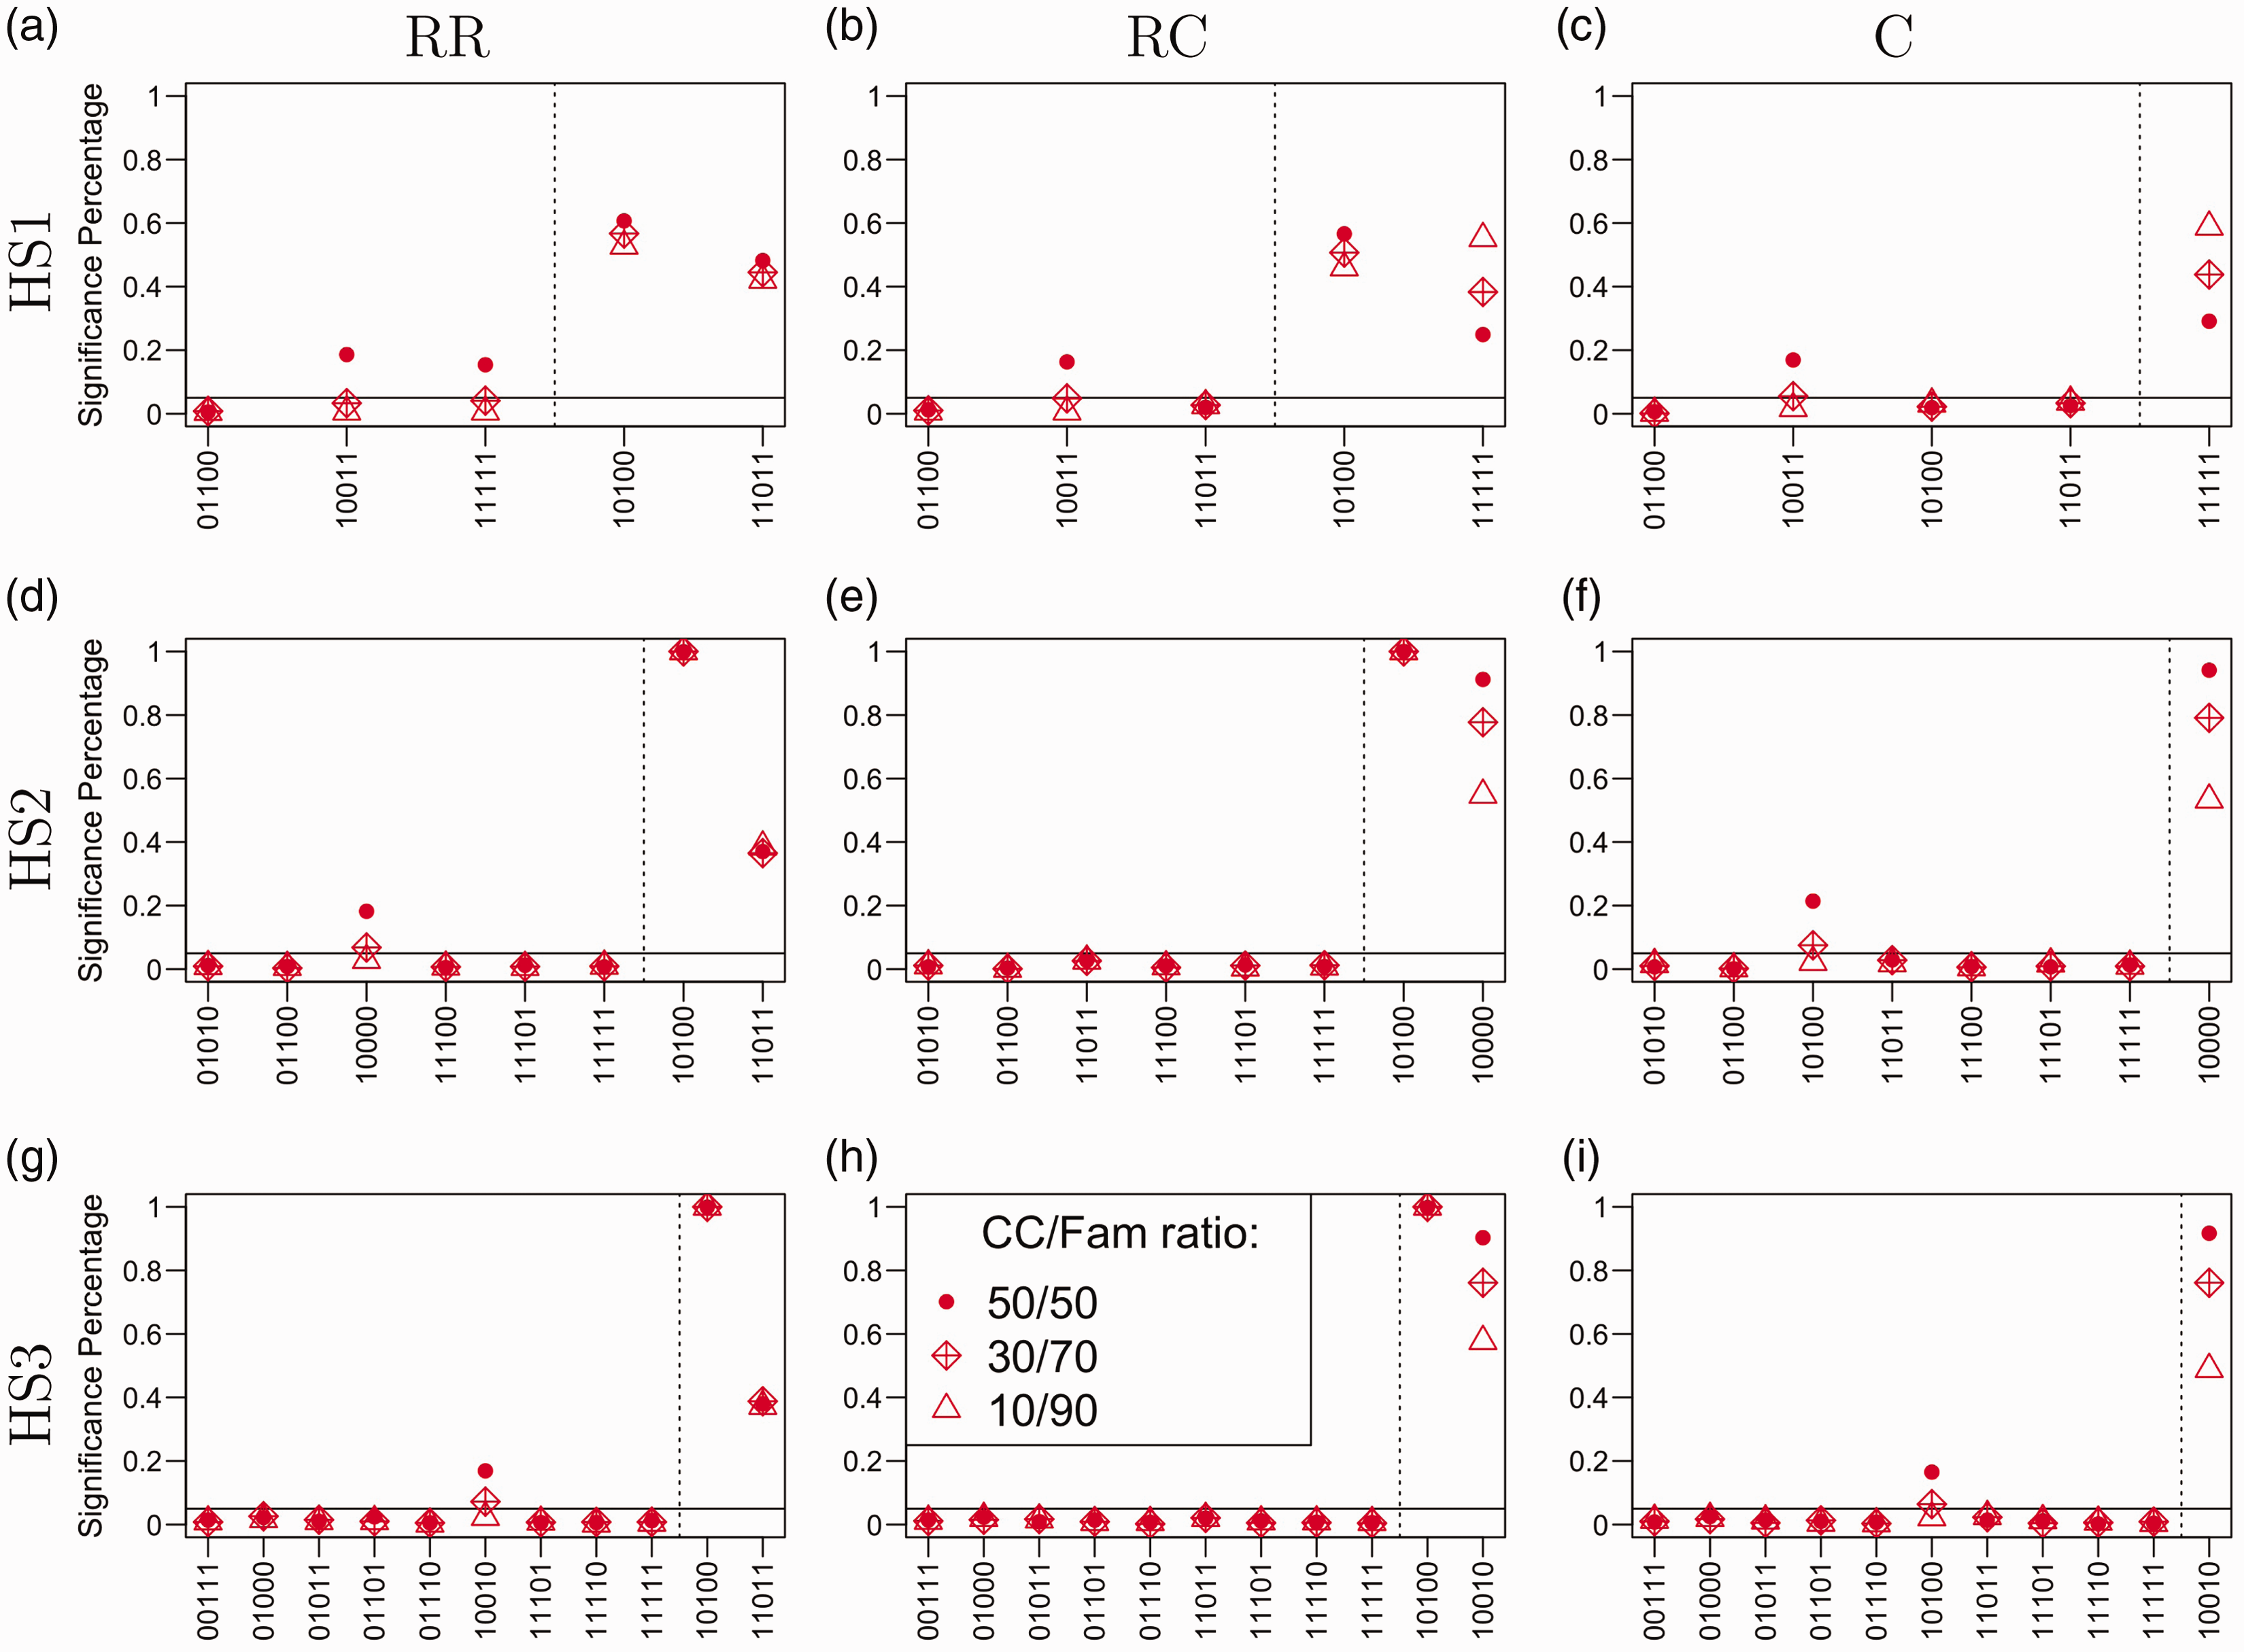
Performance of cLBL with different CC/Fam ratios under heterogeneous settings for three analyses: the ratio between case-control unit and family trio unit being 50/50 (denoted by dots), 30/70 (denoted by diamonds), and 10/90 (denoted by triangles). The three plots in the first column represent the situations where there were two rare associated haplotypes; the three plots in the middle column represent the situations where there were one rare associated haplotype and one common associated haplotype; the three plots in the last column represent the situations where there was one common associated haplotype. On the other hand, the three rows of plots are for the three haplotype settings. Type I error rate and power are separated by the dashed vertical line in each plot.
4 Application
FHS is a longitudinal cohort study aimed to identify risk factors for cardiovascular diseases. It has recruited residents from Framingham, MA, for three generations since its beginning in 1948. Genotype data for the FHS participants were collected in 2007.39,40 Based on the SNPs detected to be highly associated with hypertension in an earlier study, 41 we selected the top eight significant SNPs; ch12:rs684596, ch3:rs1112438, ch2:rs7559838, ch4:rs2736483, ch5:rs16881524, ch4:rs7657817, ch16:rs11149562, and ch7:rs17717907. For each SNP, we considered a total of seven 7-SNP regions to form haplotypes: we positioned the SNP to be the first of a 7-SNP region, the second of a 7-SNP region, all the way to the last of a 7-SNP region. The SNPs for forming the 7-SNP regions are available consecutive SNPs surrounding the SNP of interest. This strategy led to a total of 56 regions (i.e. 8 SNPs each being considered in 7 regions). We performed haplotype analysis using cLBL, famLBL, and LBL for each of these 56 regions.
In this longitudinal study, each individual’s blood pressure was measured up to four times (https://dbgap.ncbi.nlm.nih.gov/aa/wga.cgi?page=login; dbGaP accession #: phs000128.v3.p3). Following Han et al.,
41
we used the blood pressure measurements to define a binary trait: an individual was labeled as hypertensive if his/her systolic blood pressure was
A summary of the results is presented in Table 2, where a three-way classification of at least one significant haplotypes from LBL, famLBL, or cLBL is given. From the table, we can see that LBL, famLBL, and cLBL identified 19, 2, and 20 significantly associated haplotypes, respectively. In particular, 13 of the haplotypes were identified by both cLBL and LBL, with consistent sign (either risk or protective). The consistency between cLBL and LBL is not surprising, since the data being analyzed are quite similar given the small size of the trio data. The shared risk haplotypes between LBL and cLBL cover three of the SNPs detected earlier: rs2736483, rs7559838, or rs11149562, and the shared protective haplotype covers rs11149562 or rs17717907. It is noted that rs11149562 lies in gene CDH13, which has been identified to be associated with hypertension in two European populations. 43 Further, rs7559838 resides in gene HPCAL1, a gene that has been reported to be associated with hypertension in the Japanese population. 44 However, none of those 13 haplotypes were detected by famLBL due to insufficient number of trios. Nevertheless, famLBL identified two significantly associated haplotypes (one risk involving SNP rs11149562 and one protective involving rs16881524), but neither were detected by cLBL nor LBL. The fact that cLBL and LBL did not identify them is likely due to large noise present in the case-control data as we observed very wide CIs with LBL and cLBL. For the rest of the six haplotypes detected by LBL but not famLBL nor cLBL, the results could be false positives due to population stratification.
Results from the analysis of the FHS data.
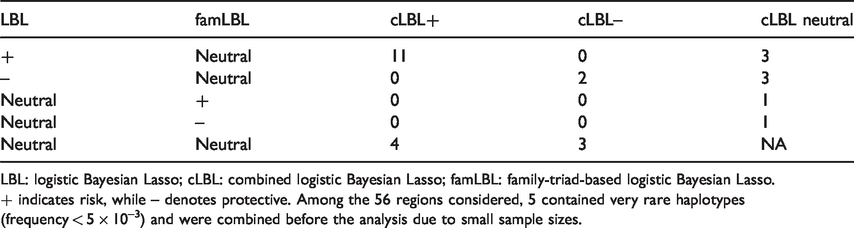
LBL: logistic Bayesian Lasso; cLBL: combined logistic Bayesian Lasso; famLBL: family-triad-based logistic Bayesian Lasso.
+ indicates risk, while – denotes protective. Among the 56 regions considered, 5 contained very rare haplotypes (frequency < 5 × 10⁻³) and were combined before the analysis due to small sample sizes.
The most salient feature of Table 2 is the last line, which shows the increase in statistical power with cLBL. Specifically, cLBL identified four risk and three protective haplotypes that were missed by both LBL and famLBL. These haplotypes come from regions containing SNPs rs684596, rs2736483, or rs16881524. We note that rs684596 is in the gene TCTN1, and rs16881524 is in NDUFS4. Both TCTN1 and NDUFS4 are protein-coding genes that have been linked to several phenotypes including the heart,45,46 and TCTN1 is related to vascular activities in general. 47 The complete results with information on genomic regions, estimated effect size, and evidence of significantly associated haplotypes are given in Supplementary Tables S4 and S5.
5 Discussion
In this paper, we develop a cLBL method for identifying both common and rare haplotype variants associated with common diseases. This methodology is an extension of both LBL and famLBL as it is designed to jointly analyze population-based case-control data as well as family-based trio data. As such, the sample size for a cLBL analysis is larger than applying either LBL or famLBL alone, leading to greater power for detecting associated haplotypes. This is a rather significant advantage for detecting rare associated haplotypes: it is commonly understood that power tends to be smaller for rare haplotypes, which is what we have seen in our simulation study of the RC scenario. Therefore, it is essential that we utilize as much data as possible to maximize the study power in order to increase our chance of detecting rare haplotype associations.
Our simulation study based on data from a single homogeneous population shows that cLBL indeed provides better statistical power than LBL or famLBL. Since cLBL includes case-control data in the analysis, its performance under population stratification is also evaluated as well in terms of Type I error and power. Under the stratification scenario investigated, a mixed sample of case-control and trio data may lead to inflated Type I error for some of the haplotypes if there is a large proportion of population data. When the case/control portion of the data is not of an overwhelming proportion of the joint dataset, cLBL will suffer less elevated Type I error because of the robust feature of the family trio data. In our simulation, we see that when the case/control proportion drops down to 30%, there was no longer any evidence of Type I error inflation. Nevertheless, caution should be exercised in interpreting these results, as our simulation only represents one population stratification scenario. Under a different scenario, the proportion of family trios in the mixed sample required to control Type I error will likely change. In general, the larger the differences between the cases and control populations, the greater the proportion of trios needed in order to control Type I error.
To demonstrate the feasibility of our method for real data applications, we applied cLBL, together with LBL and famLBL, to data from the FHS. As expected, we see that cLBL indeed has more power than either LBL or famLBL, especially the latter given the small trio sample size. In particular, cLBL identified additional associated haplotypes that were shown in the literature to be related to heart diseases but were not detected by either LBL or famLBL. It is also reassuring to see that cLBL was able to weed out several haplotypes detected by LBL but not famLBL, indicating the greater ability of cLBL to control Type I error.
Despite the improved performance of cLBL over LBL or famLBL, it has a number of limitations. First, each of data units (trio/case/control) is assumed to be independent from the others, which may lead to a loss of information, as in the FHS example. Second, due to missing data in a family-based design, the number of trios that can be utilized by cLBL may be limited. How to deal with this dependency and missing data are two topics that warrant further investigation.
6 Software
The codes for LBL, 17 famLBL, 19 and cLBL were implemented in an R package LBL, which can be downloaded from GitHub (https://github.com/mxw010/LBL) or from our software page (https://www.asc.ohio-state.edu/statistics/statgen/SOFTWARE/LBL/).
Supplemental Material
sj-pdf-1-smm-10.1177_0962280220927728 - Supplemental material for Detecting rare haplotypes associated with complex diseases using both population and family data: Combined logistic Bayesian Lasso
Supplemental material, sj-pdf-1-smm-10.1177_0962280220927728 for Detecting rare haplotypes associated with complex diseases using both population and family data: Combined logistic Bayesian Lasso by Xiaofei Zhou, Meng Wang and Shili Lin in Statistical Methods in Medical Research
Footnotes
Acknowledgements
We thank two anonymous reviewers for their constructive comments and suggestions. The FHS dataset was obtained from the database of the Genotypes and Phenotypes (dbGap).
Declaration of conflicting interests
The author(s) declared no potential conflicts of interest with respect to the research, authorship, and/or publication of this article.
Funding
The author(s) disclosed receipt of the following financial support for the research, authorship, and/or publication of this article: This work was supported in part by NSF grant DMS-1208968.
Supplemental material
Supplemental material for this article is available online.
References
Supplementary Material
Please find the following supplemental material available below.
For Open Access articles published under a Creative Commons License, all supplemental material carries the same license as the article it is associated with.
For non-Open Access articles published, all supplemental material carries a non-exclusive license, and permission requests for re-use of supplemental material or any part of supplemental material shall be sent directly to the copyright owner as specified in the copyright notice associated with the article.