
Abstract
The estimation of hidden sub-populations is a hard task that appears in many fields. For example, public health planning in Brazil depends crucially of the number of people who holds a private health insurance plan and hence rarely uses the public services. Different sources of information about these sub-populations may be available at different geographical levels. The available information can be transferred between these different geographic levels to improve the estimation of the hidden population size. In this study, we propose a model that use individual level information to learn about the dependence between the response variable and explanatory variables by proposing a family of link functions with asymptotes that are flexible enough to represent the real aspects of the data and robust to departures from the model. We use the fitted model to estimate the size of the sub-population at any desired level. We illustrate our methodology estimating the sub-population that uses the public health system in each neighborhood of large cities in Brazil.
1 Introduction
How to sample from hidden and elusive population has been investigated in the statistical literature for some time.1–5 Special sampling techniques for such kind of problem are needed to collect information about the population of interest. Similar sampling techniques are being used by computer scientists to sample social networks where the size and population structure are not easy to pre-determine.6–8
Estimating the size of sub-populations is an important and non-trivial task in many areas. In ecology, many studies try to estimate rare or endangered species population sizes.9–11 he precise estimation of these species populations can help ecologists to better understand their behavior and characteristics. From a health-care perspective, it is also important to identify and determine hidden population size. Studies about rare populations can provide better understanding, insights in the improvement, or creation of specific public policies.12–19
Although direct information on elusive population can be hard to obtain, other sources of information may be available and used to infer about the hidden population size. The existence of data from misaligned geographical units can be used to transfer knowledge from an available data source to obtain more precise estimates of the population size of interest.
The aim of this study is to develop a statistical methodology to estimate an unknown, hard-to-reach, sub-population in small areas. The motivation for our work comes from our involvement in the InfoSAS, a large statistical project aimed at automatically detecting anomalies in the Brazilian public payment system to services providers. The detected cases should be audited subsequently. The InfoSAS procedure applies a set of statistical data analysis algorithms to monthly collected data covering about 5000 groups of medical procedures in 5570 municipalities and more than 6000 health-care providers. Each combination of medical procedure, municipality, and health-care provider produces a different time series of the monthly number of procedures performed. The total number of time series exceeds 30 million, a huge number that requires automatic and efficient time series procedures. 20 This large set of time series is screened for anomalies in the number of provided services by taking into account the estimated user population in the coverage area of the service provider.
InfoSAS requires an estimate of the sub-population that does not have access to private health insurance for different geographical levels. To understand the relevance of this number, one needs to know the size of both, the Brazilian private and public health systems. Brazil manages the largest public health system in the world, the Unified Health System (SUS) with more than 3.5 billion outpatient procedures and more than 12 million hospitalizations per year, spending nearly 26 billion reais (around 5.83 billion dollars) on these services. More than 220,000 establishments provide services to the SUS, including hospitals, clinics, and laboratories. The need for an effective regulation and control system to take care of such a system is obvious. This system exists and works in the various administrative spheres in which SUS is organized.
The private health insurance market in Brazil is also very large due to the inefficiencies of the public health sector, covering more than 50 million people and ranking the second biggest in the world after the United States, according to the Economist Intelligence Unit. 21 The correct number of people with no private insurance plan is crucial to create health-care policies and resources management in different political scales, for example, municipalities, neighborhoods, census track, and so on.
In this study, we present a methodology that, although developed with this particular application in mind, is general enough to be applied to other situations. Features from a source of information in one geographic level are borrowed and projected to a different one. Thus, by using similar features available on different geographical levels, one can estimate the sub-population of interest over these levels.
For example, confidentiality requirements may impose the geographical limitation of public data release on HIV cases or political voting statistics. Data are usually available only at a minimum spatial aggregation level due to privacy protection concerns. Covariates at the same geographical level, as well as at smaller levels, can be used to explain the HIV or voting numbers at the coarser spatial level and then be transferred to the smaller level. One might be interested in knowing HIV numbers at a neighborhood level to guide the establishment of a new treatment center. Likewise, the election results in a more desegregated level could help political scientists to understand the areas in a city more likely to vote in a specific candidate.
Thus, we propose a method under the generalized linear regression framework22,23 combined with a new family of link functions. In this link function, we introduce two new parameters, c and d, that reflects relevant aspects of our problem. The first one can be interpreted in terms of the proportion of individuals who will experience the event, independently of the covariates. Regarding the second one, the value of
This paper is organized as follows: In Section 2, the methodology is proposed. In Section 3, Bayesian inference is discussed and the FLAMES package introduced. A simulation study is presented in Section 4. In Section 5, an application is presented to estimate the SUS population size for all neighborhoods of Belo Horizonte, Brazil. Finally, Section 6 ends with a discussion of the model and the obtained results.
2 Methodology
2.1 Geographically misaligned information
Demographic information is an essential ingredient in epidemiological studies since it provides estimates of the risk population. However, many times population data for small geographical regions are scarce or only occasionally available as when demographic census are carried out. Hence, research studies using such small geographical areas as the unit of analysis may not be feasible.
From a public policy perspective, to know the characteristics of small geographical regions is necessary, since it allows the decision making to be specific and precise for the region of interest. One may use data from a larger region where the small unit is located, but the quality of the approximation depends on the within region variability. This quality was anticipated to be very low in our specific application.
To work around this problem, it is possible to perform a knowledge transfer between the information available at different geographical levels. Figure 1
Knowledge transfer for the misaligned geographical level scheme. (a) Individual level, (b) outcome in the areal level, (c) covariate at the misaligned level, and (d) estimation at the misaligned level.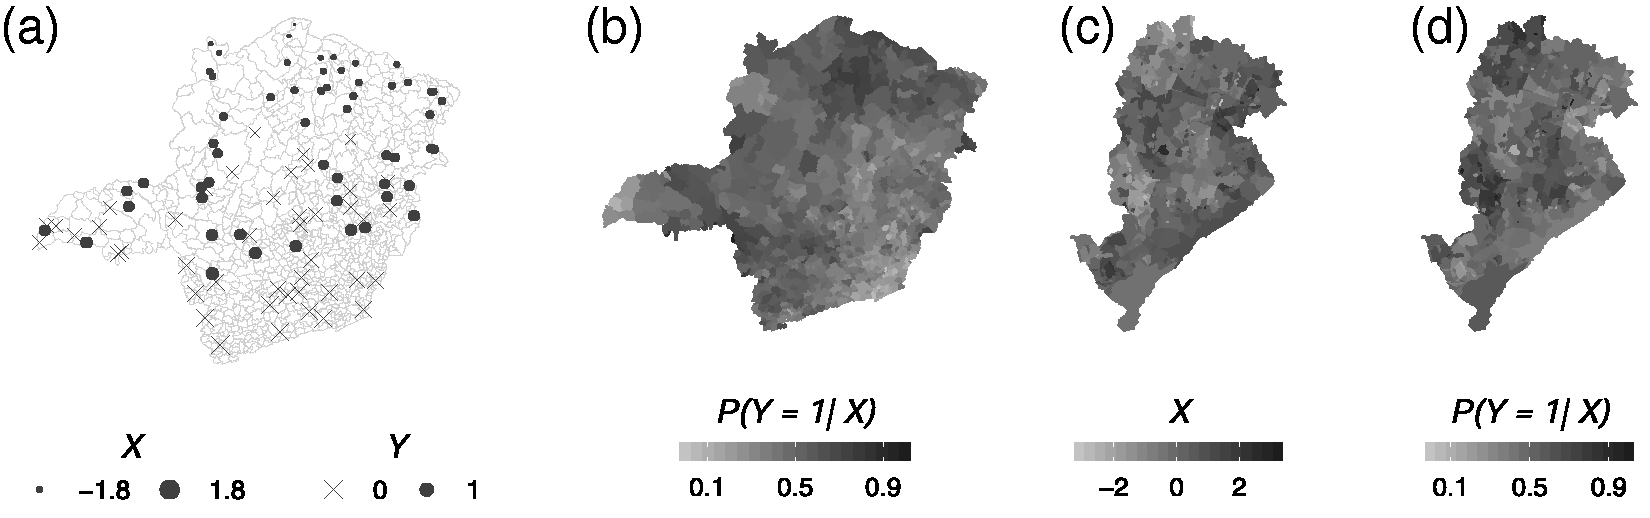
We use the knowledge about the relationship between covariates and outcome to estimate the smoothed outcome in all space levels. In Figure 1(b), we apply the acquired knowledge to fit our outcome given the same or similar covariates used in the first step. In this step, it is important to verify whether the fit is satisfactory by comparing the smoothed outcome with real values by means of a validation set, for example. With an accurate fit, we can proceed with the use of the model to transfer knowledge for different geographical levels.
First, it is necessary to find similar covariates at the desired smaller geographical level. This is shown in Figure 1(c), the map of Belo Horizonte, a large city with more than 2 million inhabitants but covering a tiny region, less than 0.06% of MG state territory. We apply the model again to estimate the hard-to-reach population at the misaligned small geographical level (Figure 1(d)). This process can be repeated many times to different geographical levels as long as they share similar covariates and there is at least one level where the data of interest are available and one where the model goodness of fit can be verified (with a validation set).
The choice of the inference model can vary according to the application. For this work, we propose a flexible and robust link model for binomial data that can easily be generalized for any hierarchical modeling structure.
2.2 Flexible link function with asymptotes
Generalized linear model (GLM)22,23 is a broad modeling class. The idea is to explain the average response of a variable of interest using some features. First, an adequate probability distribution is defined for the variable of interest (response variable), after, a link function is defined to map the features to the conditional mean of the selected distribution.
To model the size of the sub-populations, we focus in a robust GLM approach for binomial data with a link function that is capable of modeling an asymptote behavior as well as accommodate the presence of outliers or asymmetry. For each region i in the study, there is a total population ni and we need to determine how many of them belong to the population of interest. A special case of the binomial regression is the binary regression where ni = 1. In general, the model can be represented as

The most common link functions are the logistic and probit, and they are obtained by selecting the c.d.f to be the standard logistic and standard normal, respectively. These link functions are symmetric around its center value due to the nature of its distribution function and are not adequate when the data present different rates to approach the extreme values 0 or ni of the response variable. Other c.d.f. can be used as link functions, for example, the Cauchy, student-t, Gumbel, and so on. These distributions have other characteristics that make them more robust and attractive to model data. The Cauchy (cauchit link) and student-t (robit link) are also symmetric but have heavier tails, and thus are more robust to the presence of outliers. The Gumbel generates an asymmetric link function called cloglog. Since it is asymmetric, it can approach the extremes with different rates what is commonly observed in real data. Another important change is borrowed from the literature of IRT models. Barton and Lord
31
include the use of asymptotes in the link function. In our case, we define the new link function, for binomial regression, as

In this model, c represents the lower asymptote value and d is the upper asymptote value, with
In Figure 2
Link functions and types of asymptotes. (a) Examples of link functions and (b) examples of link functions with asymptotes.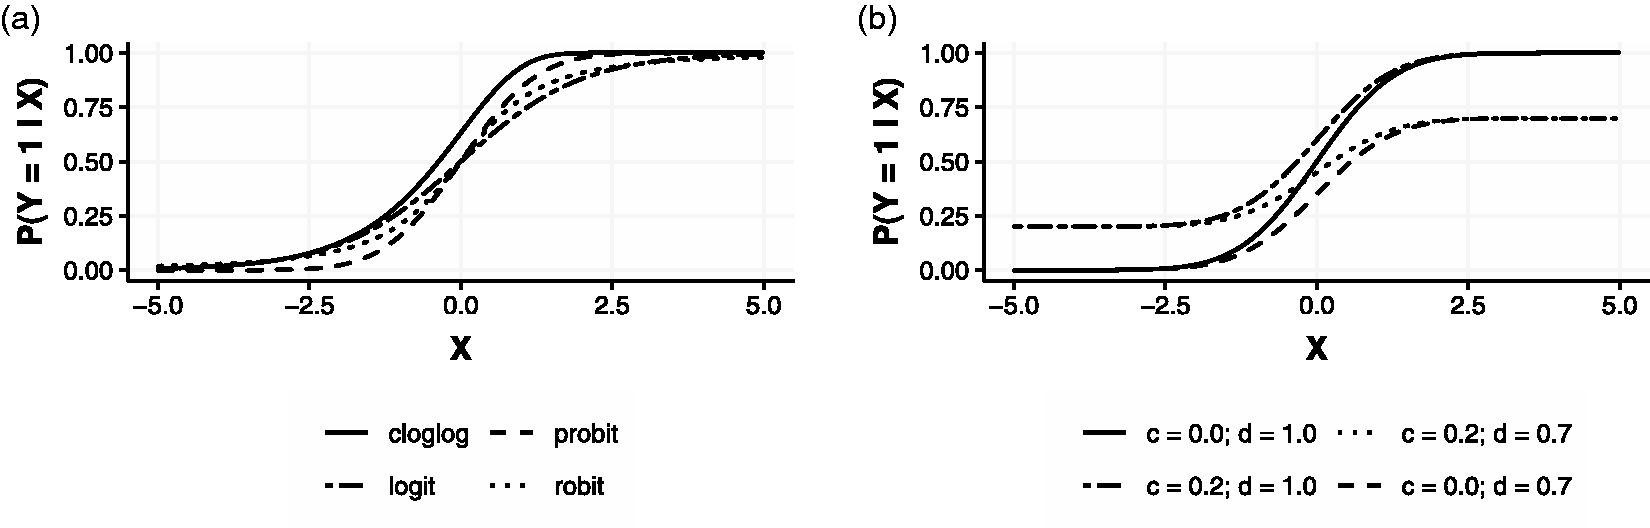
3 Bayesian inference
To fit the model proposed in Section 2.2, a hierarchical Bayesian structure is introduced. To allow reproducibility and provide access for a wide range of practitioners, an R package has been created that can be installed following the instructions in the FLAMES: Flexible Link function with AsyMptotES repository https://github.com/douglasmesquita/FLAMES.
In a Bayesian setting, the posterior distribution is proportional to the product of the likelihood and the prior distribution of the parameters, as presented in equation (2)

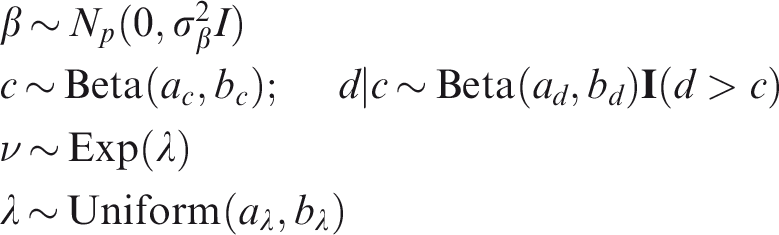
The hierarchical Bayesian representation of the model is given by
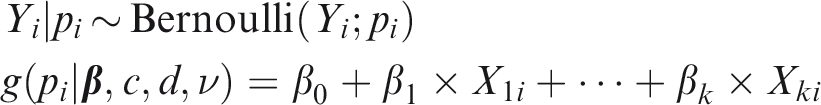
The implementation of FLAMES uses the following prior and hyperprior distributions
Link functions and its characteristics.
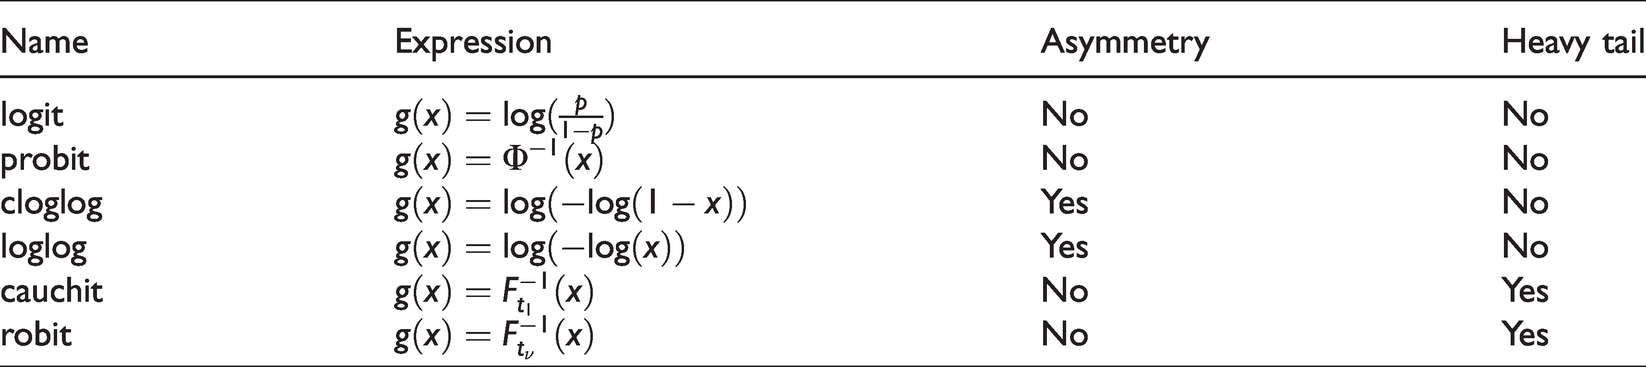
The link function selection is tricky and the best way to select one of them is by testing. However, we can guess what is the best link function looking at the problem and associated data set. If there is no evidence of asymmetry, we would prefer a symmetric link function such as the logit or probit. If logit and probit do not work well in this symmetric case, a link function that deals with heavy tail, such as the robit, is recommended. In the asymmetric case, the cloglog link function should be considered.
In Table 1
Since the posterior distribution has no closed-form expression, a Gibbs sampler cannot be directly used and another Bayesian sample method is needed to get the posterior estimates. Several approaches are available in the literature and in the FLAMES package two of them are available: (1) adaptive rejection metropolis sampling—ARMS 36 and (2) Metropolis–Hastings algorithm.37,38 The ARMS method is slower but simpler to tune. Also, in general, a smaller chain is needed to achieve convergence. The Metropolis–Hastings algorithm is faster although correct tuning of the proposal distribution is necessary to achieve convergence.
4 Simulation study
This study aims at showing the flexibility and robustness of the proposed methodology. We make the data-generating model more complex at each step, and we show that our proposal model is capable of modeling simpler scenarios as well as the simpler link functions. When moving to the more complex ones, similar to what is usually observed in real data sets, our model has clear advantages over the alternatives.
We use the cloglog link function since it is asymmetric and is the one selected in our application. To perform the study, we considered four scenarios: (1) the conventional model, with c = 0 and d = 1; (2) a model with a fixed minimum proportion of cases, implying on c = 0.20 and d = 1; (3) a model with a maximum proportion of non-cases, implying on c = 0 and d = 0.95; and (4) a model with a minimum and maximum proportion of cases and non-cases, respectively, implying on c = 0.20 and d = 0.95. In all scenarios, we are taking
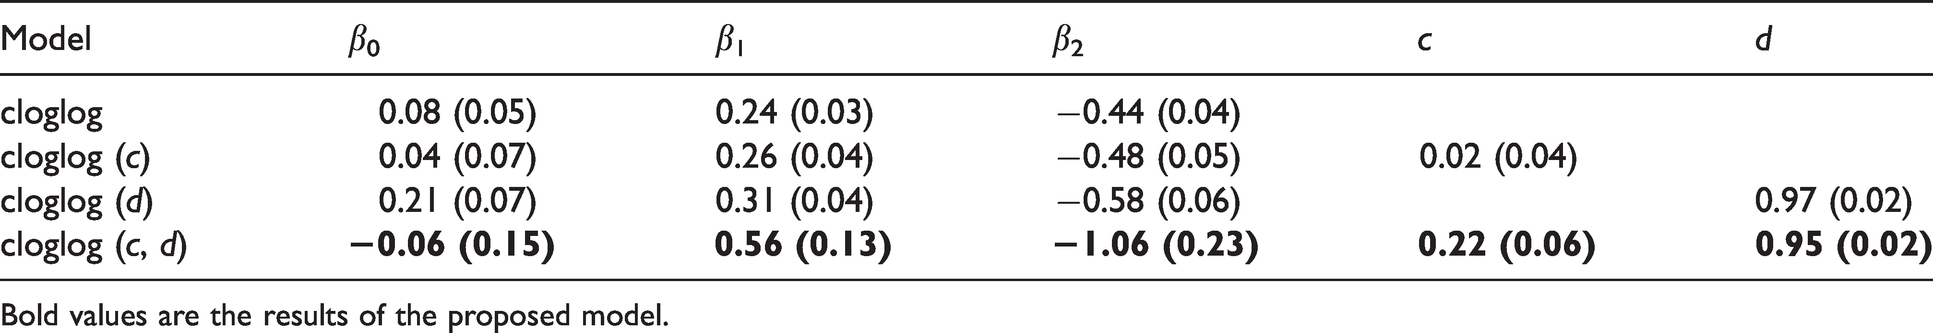
For each model, we generated 1000 data sets and for each data set, the four data-generating models were considered. Our goal is to show that our proposed model, the one with
Posterior means (standard deviations) based on 100 data sets considering c = 0.00 and d = 1.00 as generating model.
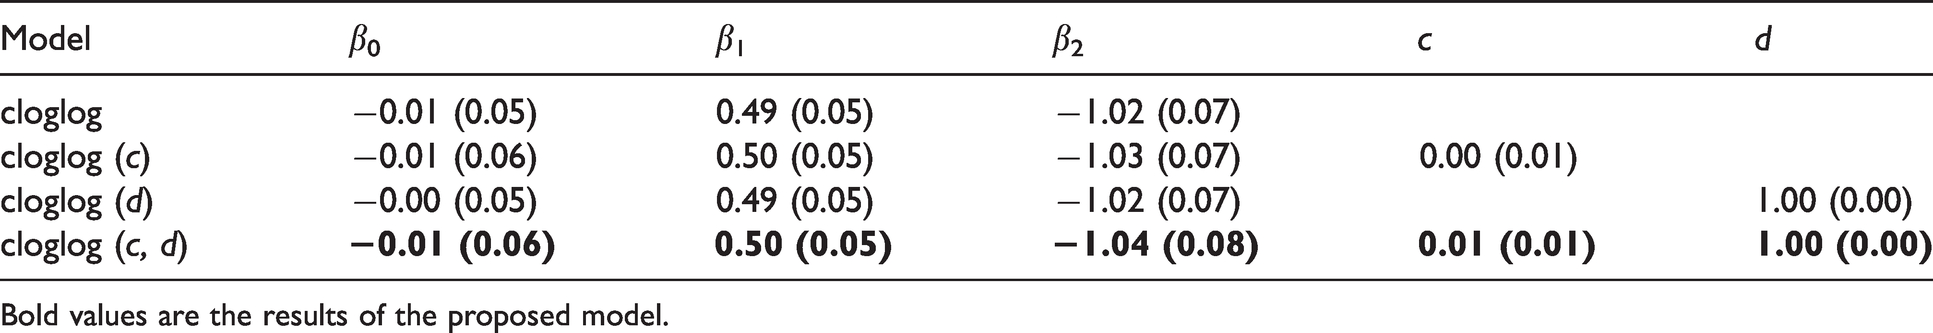
Bold values are the results of the proposed model.
Posterior means (standard deviations) based on 100 data sets considering c = 0.20 and d = 1.00 as generating model.
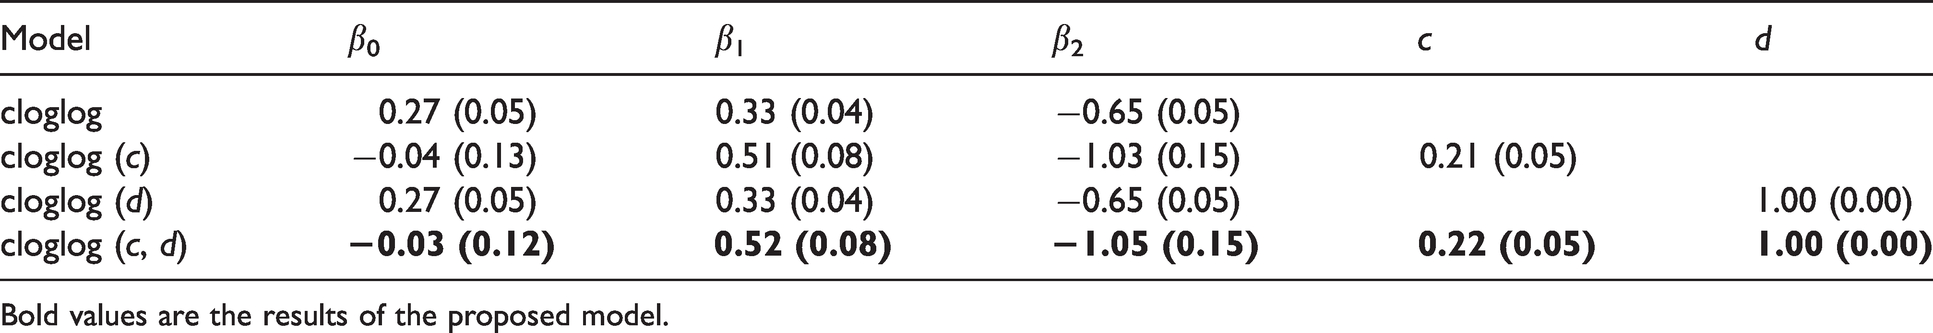
Bold values are the results of the proposed model.
Posterior means (standard deviations) based on 100 data sets considering c = 0.00 and d = 0.95 as generating model.
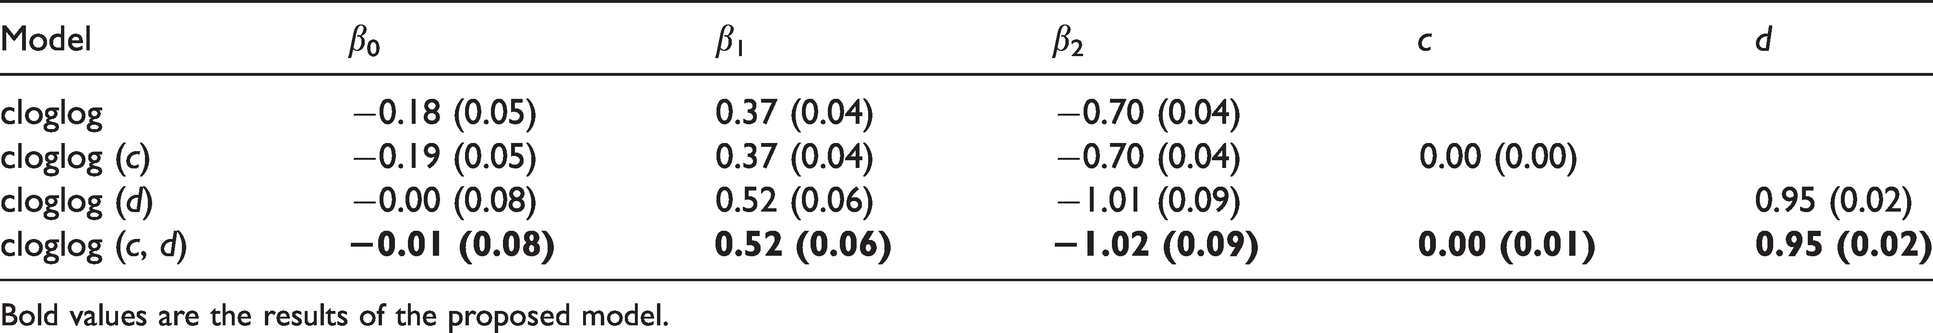
Bold values are the results of the proposed model.
Posterior means (standard deviations) based on 100 data sets considering c = 0.20 and d = 0.95 as generating model.
Bold values are the results of the proposed model.
As a general remark, we can see that, in all scenarios, the proposed model with two asymptotes provides good estimates for both regression coefficients and the asymptotes, showing robustness to adapt to the characteristics of the true generating model without any inferential loss. Recovering the fixed effects values correctly is important when interpreting the model and understanding the relationship between the response and features. Therefore, because of this flexibility without inferential loss, we can conclude that the use of the model with two asymptotes is preferable when compared with any simpler version. We proceed now in our analysis using only the flexible link
5 Estimating the SUS population
The SUS has the objective to offer all Brazilians a free health-care system. Due to the inefficiencies of the SUS system and other reasons, many Brazilians prefer to use private health insurance. Because of that, not all the Brazilian population is a SUS user. Because of the high cost of the system, around 5.83 billion dollars annually, it is of great interest to have a good estimate of the SUS population. We want to estimate the proportion of people in a given small area that relies on the SUS system for their health needs. It is speculated that around 90% of the Brazilian population takes advantage of the system, but this is extremely variable, reaching 100% in poor areas and less than 50% in the more affluent areas.
Given the social economics characteristics of the health-care system, it is natural to believe that individuals with higher income are capable of paying private health insurance and therefore use less the government health system. Also, men and women may present different behavior when dealing with health, therefore having a different usage of the SUS system. Based on these premises, we can think that the average income and percentage of males are important features to predict the probability of a person to have health insurance.
Yearly, the National Agency for Supplementary Health Services (ANS), agency that regulates health insurance in Brazil, provides the number of users of health plans in each Brazilian municipality. The main objective of this application is to estimate the SUS population in smaller geographical levels than municipalities for the main cities in Brazil. In our analysis, we focus in the estimation of the SUS population for the neighborhood level. This information is essential to regulate and create local public policies for the SUS system.
5.1 Available data
As the ANS provides the number of individuals with health insurance for all Brazilian municipalities, it is possible to estimate the SUS population as the difference between the total population and the health insurance users for each municipality. However, for smaller geographical levels, the number of individuals with health insurance is unknown.
To learn how income and sex are related with health plan insurance, the 2008 PNAD survey was used. In this study, a sample of around 40,000 Brazilian households was taken, and information about income and health insurance status were recorded. To estimate the SUS population for each neighborhood, we use the average neighborhood income and the percentage of males obtained by the Brazilian Census, 39 and the GLM accuracy was verified using the ANS information at the municipality level.
5.2 SUS population modeling
As described in Section 2, we present a model to estimate the SUS population. First, we model the relationship between the individuals without health insurance and their respective income and gender. With this information, the proposed binomial model with flexible link function is used to estimate the SUS population at each municipality. The flexibility and robustness of the proposed link function allow a good fit and prediction even using a very small number of covariates, as will be seen in the application. Since the SUS population is available at the municipality level by the ANS agency, it will be used to validate if the estimation of the proposed methodology is adequate. Because of the very large demographic, economic and cultural differences in Brazil, a model was fitted for each one of the 27 states, indexed by 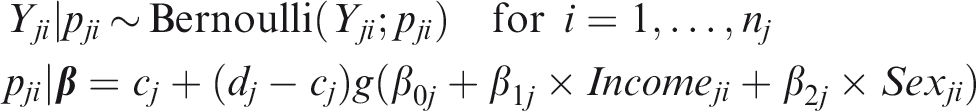
With the estimates of 
Figure 3
Model fiting for Minas Gerais and São Paulo. Dashed lines represent the estimate of c for the two best models. SUS: Unified Health System. Estimates of the model parameters for the 10 most populous states in Brazil. CE: Ceará; PE: Pernambuco; RJ: Rio de Janeiro; PR: Paraná; PA: Pará; RS: Rio Grande do Sul; BA: Bahia; UF: Unidade da Federação; WAIC: Widely Applicable Information Criterion; SP: São Paulo; MG: Minas Gerais; SC: Santa Catarina.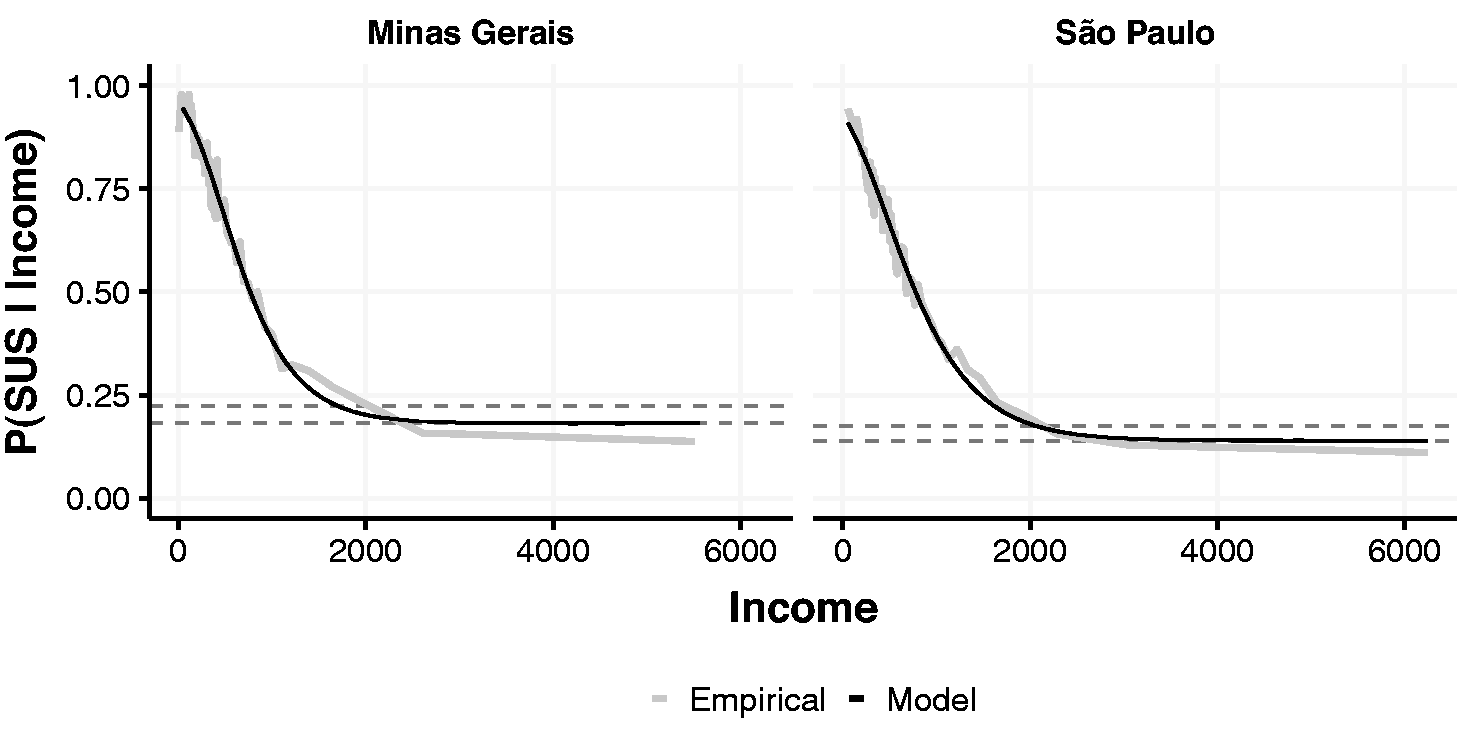
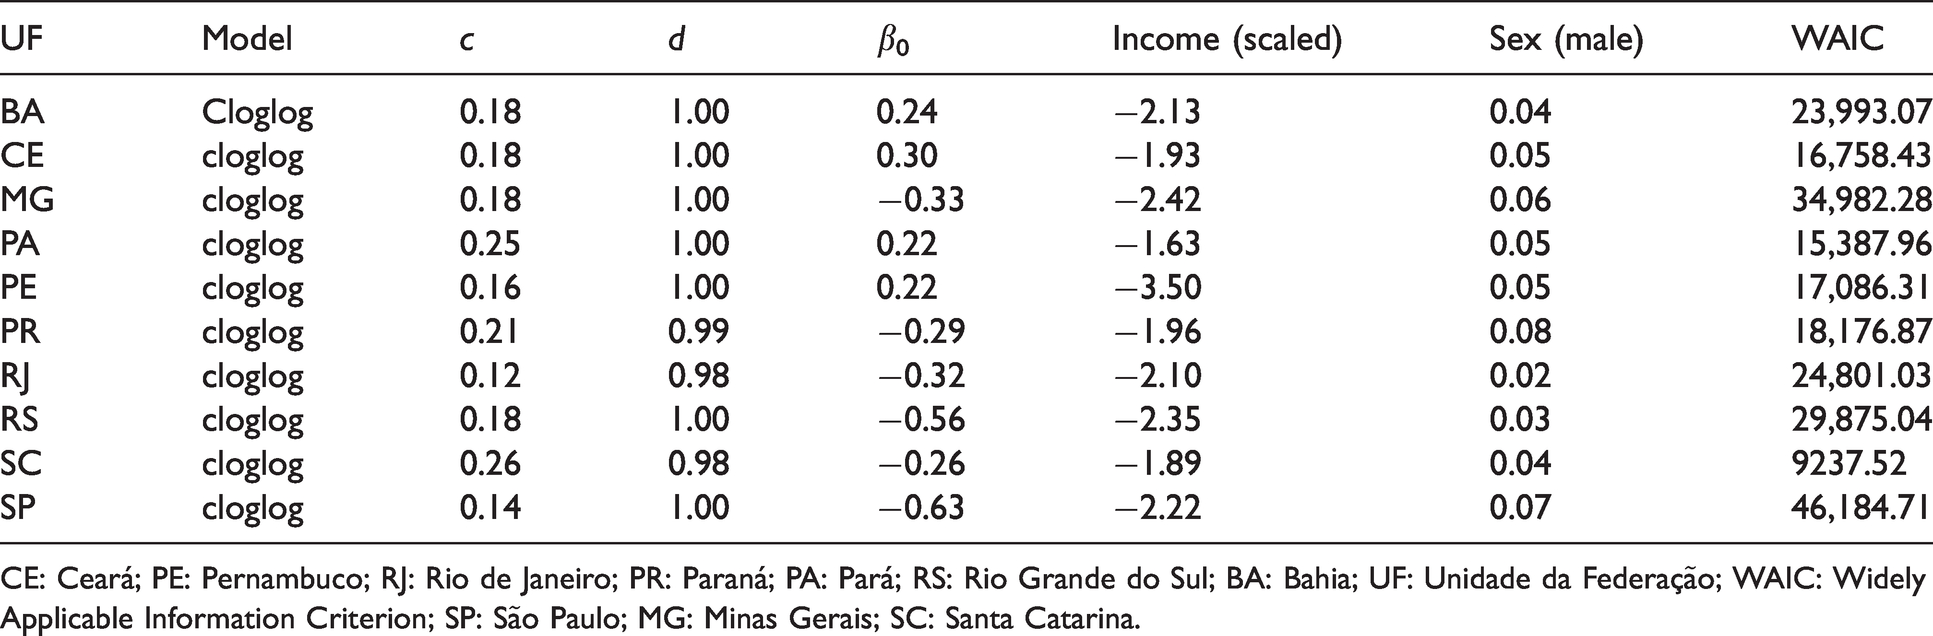
Table 6 provides the parameter estimation for the 10 most populated states in Brazil. For all states, the cloglog link provided the best fit in comparison with the logit, probit, cauchit, and robit links. This is a clear indication that the data are asymmetric. Also in all scenarios, parameter c is significantly different from 0 while d is smaller than 1 for Rio de Janeiro and Santa Catarina. This is another evidence in addition to the one presented in Section 4 showing that the proposal is flexible and able to accommodate the different characteristics of the data. The regression parameter
The c and d parameters have direct and interesting interpretation: c represents the percentage of the richer population that uses the SUS system, while
Fit measures for MG under several models.
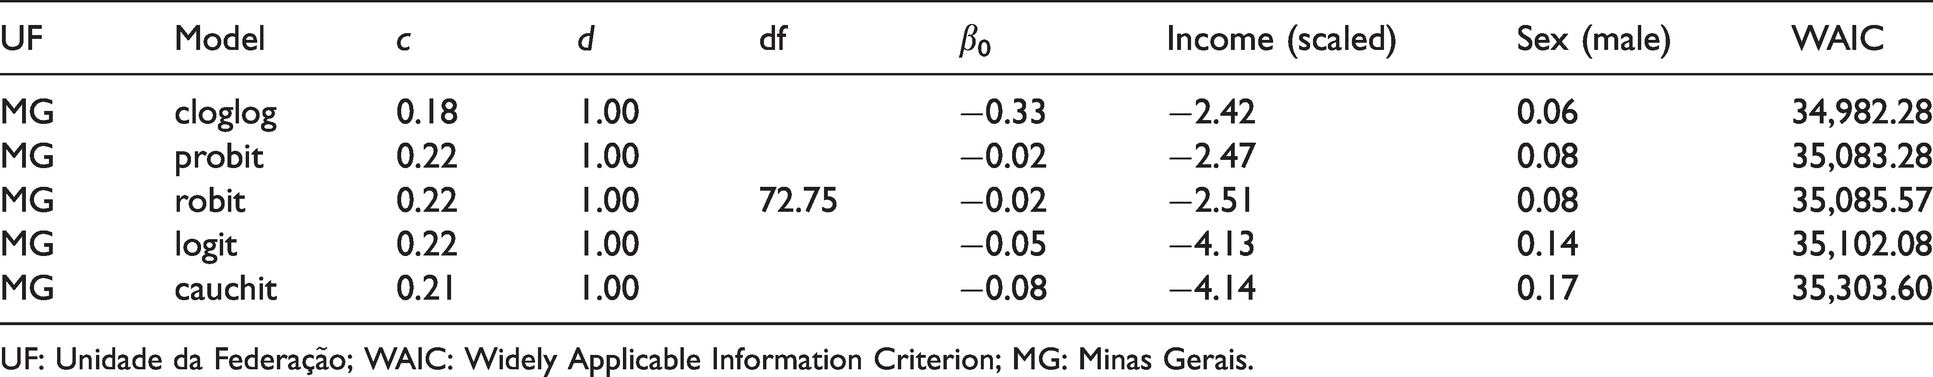
UF: Unidade da Federação; WAIC: Widely Applicable Information Criterion; MG: Minas Gerais.
Figure 4
Estimated SUS population estimation and ANS information (log scale). ANS: National Agency for Supplementary Health Services; GLM: generalized linear model; SUS: Unified Health System.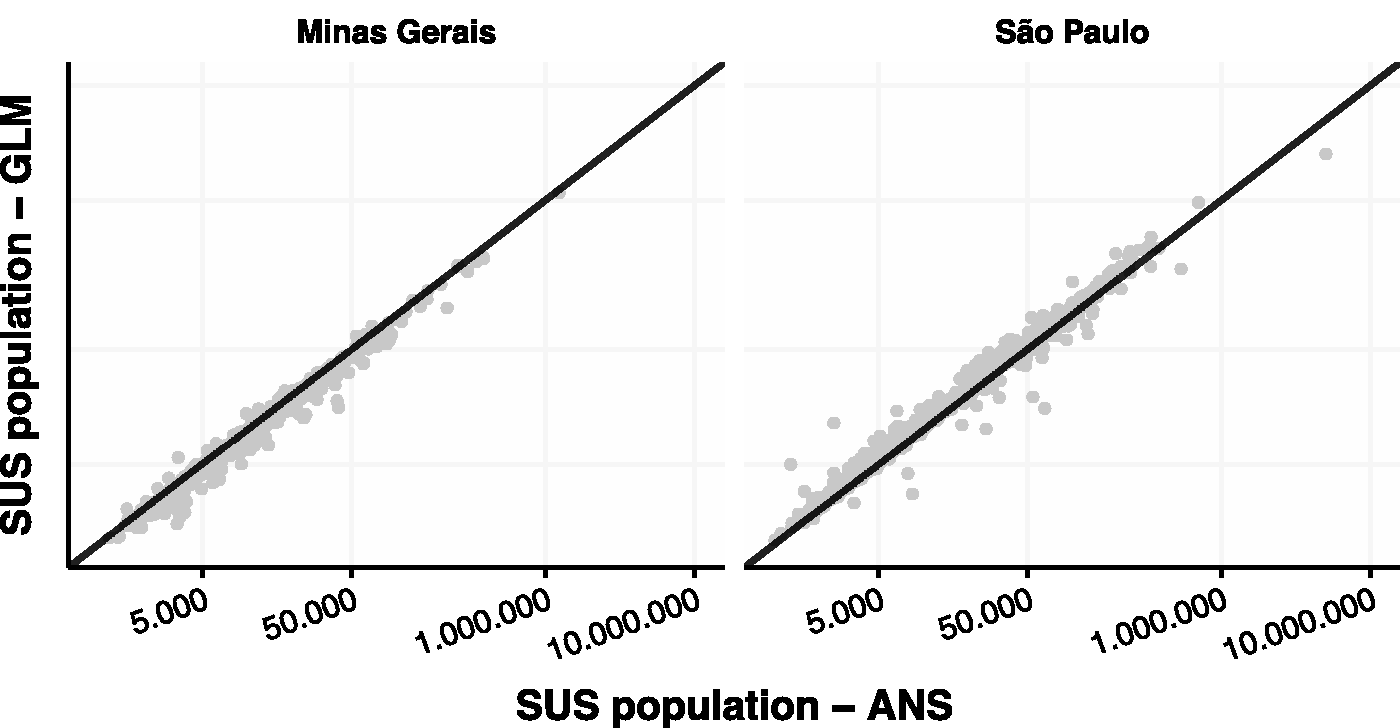
With the parameters of the model estimated and the verification obtained in Figure 4, it is possible to transfer knowledge to estimate the SUS population to any smaller geographical level of interest. Specifically, the knowledge transfer between levels, like from a municipality level to a neighborhood one, is of extreme importance for health-care policies makers. This step corresponds to Figure 1(c) and (d).
Neighborhoods in Belo Horizonte and its respective income average, population estimated SUS population, and estimated proportion of SUS users.
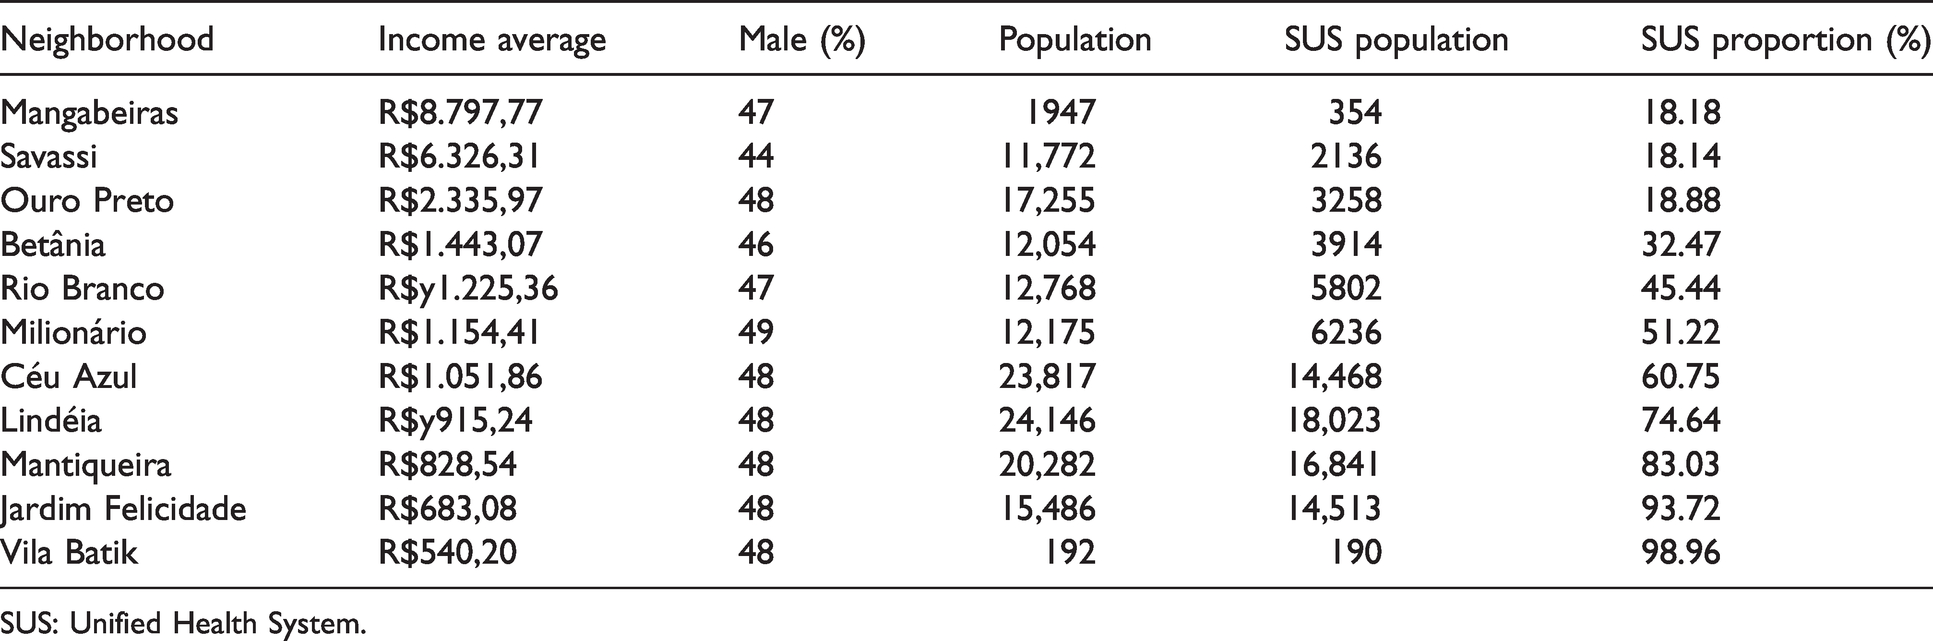
SUS: Unified Health System.
6 Conclusion
Demographic information is useful to guide public health decision making. Many times, the demographic information is available only at some geographical levels making it hard to carry out analysis in other geographical levels of interest. However, the information available at one geographic level can be used to construct a prediction model that uses common features to all levels to transfer information between the available data and the geographical level of interest.
The prediction model can be constructed using the methodology that combines features with the response variable. In this work, we propose a flexible GLM that combines flexible link functions with the use of asymptotes correction. The FLAMES R package is available at https://github.com/douglasmesquita/FLAMES to fit the proposed class of flexible link functions using Bayesian inference. This family of link functions is very flexible and capable of accommodating asymmetry, heavy tail, and asymptotes, characteristics commonly observed in real data sets.
In this study, the proposed methodology is used to determine the Brazilian SUS population for the neighborhoods of the main cities in Brazil. This local information is vital for the InfoSAS project, and it is important for public agencies because it allows for local policies aimed to the population that actually takes advantage of the system. For example, where to create a new hospital to improve life quality and reduce costs. Another important characteristics of the proposed methodology is its interpretability where c is the proportion of higher income people that does use the SUS system and
To estimate the SUS population at the neighborhood level, the PNAD survey was used to link the average income and percentage of males with the health insurance status by individuals. The found relationship confirms the belief that individuals with higher income tend to have private health insurance and that males use the public system more often than females. Given the cultural and social economic diversity of Brazil, the model was fitted separately for each Brazilian state. The ANS annually releases the number of people with health insurance in Brazil for the municipality level. With this information available, it was possible to verify the capability of the model of unbiased and precisely estimate the underlying SUS population.
Finally, the link function with asymptotes was capable of adapting to the asymmetry and characteristics observed in the data. With this flexible model, we were able to transfer the acquired knowledge from the individual and municipality levels to estimate the SUS population of each Brazilian neighborhood in the main cities. This result can assist public agencies in making optimum decisions about public health policies.
Although the proposed family of link function is very flexible, generalized linear mixed models can be used to improve fit and prediction under different scenarios, for example, spatial modeling, multilevel models. However, we believe that such improvements are out of the scope of this study, and we let the inclusion of other features as future work.
Footnotes
Acknowledgments
The authors would like to thank the InfoSAS project members for the discussion that helped creating the proposed methodology. Also, the authors would like to thank Coordenação de Aperfeiçoamento de Pessoal de Nível Superior, Conselho Nacional de Desenvolvimento Científico e Tecnológico, and Fundação de Amparo à Pesquisa do Estado de Minas Gerais for partial financial support.
Declaration of conflicting interests
The author(s) declared no potential conflicts of interest with respect to the research, authorship, and/or publication of this article.
Funding
The author(s) received no financial support for the research, authorship, and/or publication of this article.