
Abstract
Thirty-five years since the discovery of the human immunodeficiency virus (HIV), the epidemic is still ongoing in France. To guide HIV prevention strategies and monitor their impact, it is essential to understand the dynamics of the HIV epidemic. The indicator for reporting the progress of new infections is the HIV incidence. Given that HIV is mainly transmitted by undiagnosed individuals and that earlier treatment leads to less HIV transmission, it is essential to know the number of infected people unaware of their HIV-positive status as well as the time between infection and diagnosis. Our approach is based on a non-homogeneous multi-state Markov model describing the progression of the HIV disease. We propose a penalized likelihood approach to estimate the HIV incidence curve as well as the diagnosis rates. The HIV incidence curve was approximated using cubic M-splines, while an approximation of the cross-validation criterion was used to estimate the smoothing parameter. In a simulation study, we evaluate the performance of the model for reconstructing the HIV incidence curve and diagnosis rates. The method is illustrated in the population of men who have sex with men using HIV surveillance data collected by the French Institute for Public Health Surveillance since 2004.
1 Introduction
In epidemiology, incidence is a major epidemiological indicator to assess the dynamics of a disease. For the past few years, several methods have been used to estimate human immunodeficiency virus (HIV) incidence in both developed and developing countries based on different data sources and different approaches. 1 The preferred way to estimate incidence is to conduct a prospective cohort study where individuals are followed over time and tested for seroconversion. However, such a cohort would need to follow a large number of individuals over a long period of time, which is difficult, expensive, and time-consuming. Alternative approaches exist such as repeated cross-sectional surveys using mathematical models fed by measures of prevalence2,3 or a unique cross-sectional survey using a biomarker assay to identify recent infections. 4 Finally, HIV or AIDS case-based surveillance is a last alternative to estimate HIV incidence. 1 If the surveillance system does not collect biological data, numerous methods can be developed such as back-calculation5–7 and its derivatives (extended, Bayesian hierarchical based, CD4-based) or multi-state models.8,9 If biological data (CD4 counts, biomarkers from assays for recent infection, etc.) are collected for each case, then several methods that incorporate such biological information are available.10,11
In France, routine incidence testing with an enzyme immunoassay for recent HIV infections has been implemented.10,11 Four models are used to estimate HIV incidence based on the French surveillance data.6,9–11 The first two methods are based on a biological marker but include drawbacks such as uncertainties regarding the marker measurement, the time evolution of this marker since infection and the determination of a window period. The third method based on a back-calculation model also has some limitations, as it does not use the primary infection stage. For the last method, the model does not take into account changes in testing behavior over time.
To avoid these issues, we propose a multi-state model that mimics the natural history of HIV infection and distinguishes undiagnosed from newly diagnosed individuals. We adapted the approach proposed by Sommen et al. 9 to the current French data by taking into account the primary infection stage. A penalized likelihood approach was used to obtain a smooth curve for HIV incidence. In this article, we use the term incidence to denote the number of incident cases, that is, the number of newly infected individuals. The penalized likelihood was calculated in a non-homogeneous Markov chain framework, based on a Poisson process. In other words, the diagnostic probabilities of individuals may change over time to take into account any changes in screening policies. The HIV infection curve was approximated using cubic M-splines, while an approximated cross-validation was used to estimate the penalty factor. This new model does take into account all the information about the clinical stage provided by a medical doctor at the time of the first positive HIV diagnosis. For the remainder of the manuscript, when we speak of diagnosis, we mean the first positive HIV diagnosis. Once individuals were diagnosed with HIV, they were considered to be captured by the surveillance system, and their subsequent states were not useful for estimating the incidence. This allows for potential changes in HIV testing behavior over time. Second, this model estimates the time between infection and diagnosis as well as the number of people not aware of their HIV-positive status. We decided not to include biomarkers, even though they are collected in France, in order to provide a model that can be used by other countries that do not routinely collect virological data in their surveillance systems.
Finally, the method is illustrated on the population of the men who have sex with men (MSM) based on data from the French HIV surveillance system. Furthermore, a simulated data set as close as possible to the HIV mandatory notification data set was created to evaluate the performance of the model for reconstructing the HIV incidence rate. Section 2 outlines the materials taken from the HIV mandatory notification system and the simulated data set. The Markov model is presented in Section 3, and the results are described in Section 4. Finally, we discuss the improvements to be made to this model and the potential perspectives, especially for the inclusion of virological data.
2 Materials
2.1 French HIV mandatory notification system
In addition to AIDS surveillance data, the collection of data on new HIV diagnoses (new positive HIV tests) allows better follow-up of the dynamics of the epidemic. The French HIV mandatory notification system was implemented in March 2003 by the French Institute for Public Health Surveillance in collaboration with health professionals, Health Ministry, and patient associations, while the French data protection authority was called on to design a comprehensive surveillance system respectful of patient rights. 12
HIV mandatory notifications were initiated by microbiologists until 2016 and are initiated by medical doctors since 2017. They create a unique anonymous code for each individual. Some epidemiological and clinical information such as occupation, nationality, reason for testing, previous negatives for positive serology, clinical stage or mode of exposure are then supplied by the medical doctor who prescribe the test. At the time of diagnosis, a clinical stage for HIV is determined by a medical doctor: primary-infection, asymptomatic, symptomatic, or AIDS. Different terms are used in the literature to describe the primary-infection that defines the early stage of infection, although no universal definition is recognized. In the HIV mandatory notification system, primary-infection stage is defined as the period of intense viral replication, during which a person may have clinical manifestations (flu symptoms, pharyngitis, rash, superficial lymphadenopathy, etc.) that begin two to six weeks after infection. The asymptomatic stage is defined as the absence of clinical symptoms or signs related to HIV infection or the presence of generalized lymphadenopathy. The symptomatic non-AIDS stage is defined as the presence of severe clinical symptoms other than those defining AIDS. The AIDS stage is the last stage of HIV infection when severe immunosuppression is associated with opportunistic diseases.
Since 2003, virological surveillance is conducted to determine the virus type among the different HIV infection diagnoses and whether the infection is recent (less than six months). A test is used for recent infection, involving the quantification of the antibodies of two markers known as TM and V3. 13
Weekly data on new HIV case reports were extracted, along with information on whether the case had an HIV diagnosis, the week and the year of the new HIV diagnosis, and the clinical stage at diagnosis. The data cover the period from the first week of 2004 to the last week of 2018. For the years before 2015, only the month and year of diagnosis were documented. In the HIV mandatory notification data, we did not observe weekly seasonality within each month. Thus, to assign a week in the month to these diagnoses, a uniform distribution of weeks was chosen for the period before 2015. The week was then made equal to a random number from 1 to 5 or 1 to 4 according to the month. In this article, we consider all cases included in the HIV mandatory notification up to the last week of 2018. Figure 2 at the end of Section 3.3 presents a summary of the dates and time units mentioned in the model and data. The annual numbers of new HIV diagnoses were estimated from the reported cases to take into account completeness of reporting. 14 Even though HIV has been a mandatory notifiable disease in France since 2004, HIV cases are not exhaustively reported. In addition, non-negligible reporting delays must be considered when estimating the number of not-yet-reported cases. So in the first step, the number of diagnoses that are or will be reported to the surveillance system is estimated by taking into account the reporting delays using the Brookmeyer approach. 15 In the second step, a laboratory survey is performed. Each participating laboratory declares the number of confirmed positive tests over a time period. The number of confirmed positive tests is estimated using survey techniques. Finally, the completeness of reporting is obtained by dividing these two estimates (i.e., estimated number of reported and confirmed cases). Missing data were treated through multiple imputations by chained equations. 16 In the HIV mandatory notification, all variables with missing data are imputed for different analyses. Some imputed variables are not used for our analysis. For some variables, the proportion of missing data can reach 75%. Bodner 17 and White et al. 16 proposed the rule of thumb that the number of imputed data sets should be at least equal to the percentage of incomplete cases. This is why 75 complete databases are imputed and used. The 75 complete databases are constructed in two stages. The first step of the imputation creates 5 complete databases, while the second step creates 15 complete databases for each of the 5 complete databases from the first step. Thus, the 75 complete database were set, while the estimates and their variances were obtained through a combined analysis of these databases according to Rubin’s rules. 18
2.2 Simulated data
The simulation study aimed to create a realistic data set as close as possible to the HIV mandatory notification data set in order to evaluate the performance of the model (described in Section 3) for estimating the HIV incidence and the other epidemiological indicators of interest (number of diagnosed/undiagnosed individuals). We wanted to create a simulation study that was not dependent on the model so as to be able to compare different models in future research. The simulation study involved several steps. First, we wanted to simulate an incidence between 1981 what we consider to be the start of the epidemic and the year 2018 using different sources of information (graphs, estimates, literature). This justified our choice to simulate the incidence (hereafter, the simulated incidence) in the following periods:
1981–2003: We considered that the HIV epidemic started in 1981 in France. We do not have year-to-year HIV incidence values for this period, although we do have an idea of the shape of the curve and the peak value in 1987. First, we generated the number of new HIV infection cases from a theoretical incidence beginning at 0 in 1981 to 15,000 in 1987, the plausible date of the peak, using a linear trend. We then generated the annual numbers of new HIV infection cases until 2004 using another linear relationship, decreasing from 15,000 to 6038, which was the number of new HIV infection cases in 2004 estimated from last published estimation based on the French HIV mandatory notification data.
6
Although we do not have the incidence estimates before 2004, it is essential to simulate the incidence since the beginning of the epidemic because infected cases are not diagnosed until several years later and possibly after 2004, when the HIV mandatory notification began. Indeed, a person infected in a given year may be diagnosed and reported several years later. If we started the simulation of incident cases in 2004, we would have insufficient new diagnoses in 2004 and excessive new diagnoses for the following years. The simulation of the number of incident cases before 2004 is approximative, but it provides sufficient information to obtain a number of new diagnoses close to those observed in the HIV mandatory notification database for the years after 2004. 2004–2015: We used the annual numbers of new HIV infection cases estimated from a previous study.
6
We noted λi as the number of new HIV infection cases for the year i ( 2016–2018: The numbers of new HIV infection cases was simulated according to annual variation rates of −5% over the period.
We then simulated the time between infection and the first HIV-positive diagnosis (simply known as diagnosis for the rest of the article) which depended on both the clinical stage at the time of diagnosis and the testing behavior. As the distribution of the four HIV stages at diagnosis used in the HIV mandatory notification did not greatly vary over time, we chose the mean distribution over the period: 8.3% primary infection, 61.6% asymptomatic, 13% symptomatic, and 17.1% AIDS. For each individual, a clinical stage at HIV diagnosis was randomly assigned under the constraint of respecting this distribution, while the diagnosis date was simulated from the date of HIV infection according to a distribution specific to the clinical stage at diagnosis. Because the primary infection, symptomatic, and AIDS stages are associated with symptoms, the reason for diagnosis at these stages is mainly based on the presence of symptoms rather than test behavior. For the asymptomatic stage, simulated HIV test dates depend on the frequency of testing among diagnosed individuals because this stage is not associated with symptoms. For the individuals diagnosed at the asymptomatic stage, some are tested occasionally for various reasons including occasional risk-taking, whereas others are tested regularly because they engage in risky practices. Indeed, individuals have different HIV testing behaviors, and we distinguished between regular and non-regular testers. As the proportion of regular testers in the HIV mandatory notification has been stable since 2004, we chose a mean proportion of 23% of regular testers and used the following definition:
19
A regular tester had his last negative HIV test in the two years prior to his positive test date. A non-regular tester had his last negative HIV test more than two years prior to his positive test date or did not have a previous negative HIV test.
The two-year threshold is compatible with the observed delay between the last negative test and the positive diagnosis times in the HIV mandatory surveillance with a median of 18 months (1.5 years) and an average of 28 months (2.3 years).
Times from infection to diagnosis were simulated according to a distribution that depended on the stage and test behavior: for example, uniform for primary infection and Weibull for AIDS (see Supplemental Material for more details).
In this simulated database, we have a theoretical incidence, and for each individual, his/her date of diagnosis, clinical stage at diagnosis, date of infection, and testing behavior. The simulation study is described in Supplemental Material in greater detail.
3 Model
3.1 Description of the model
The multi-state model used to describe the progression of HIV infection, diagnosis, and pre-AIDS mortality is illustrated in Figure 1. We assumed that newly infected individuals enter into state 1 in continuous time according to a Poisson process with intensity
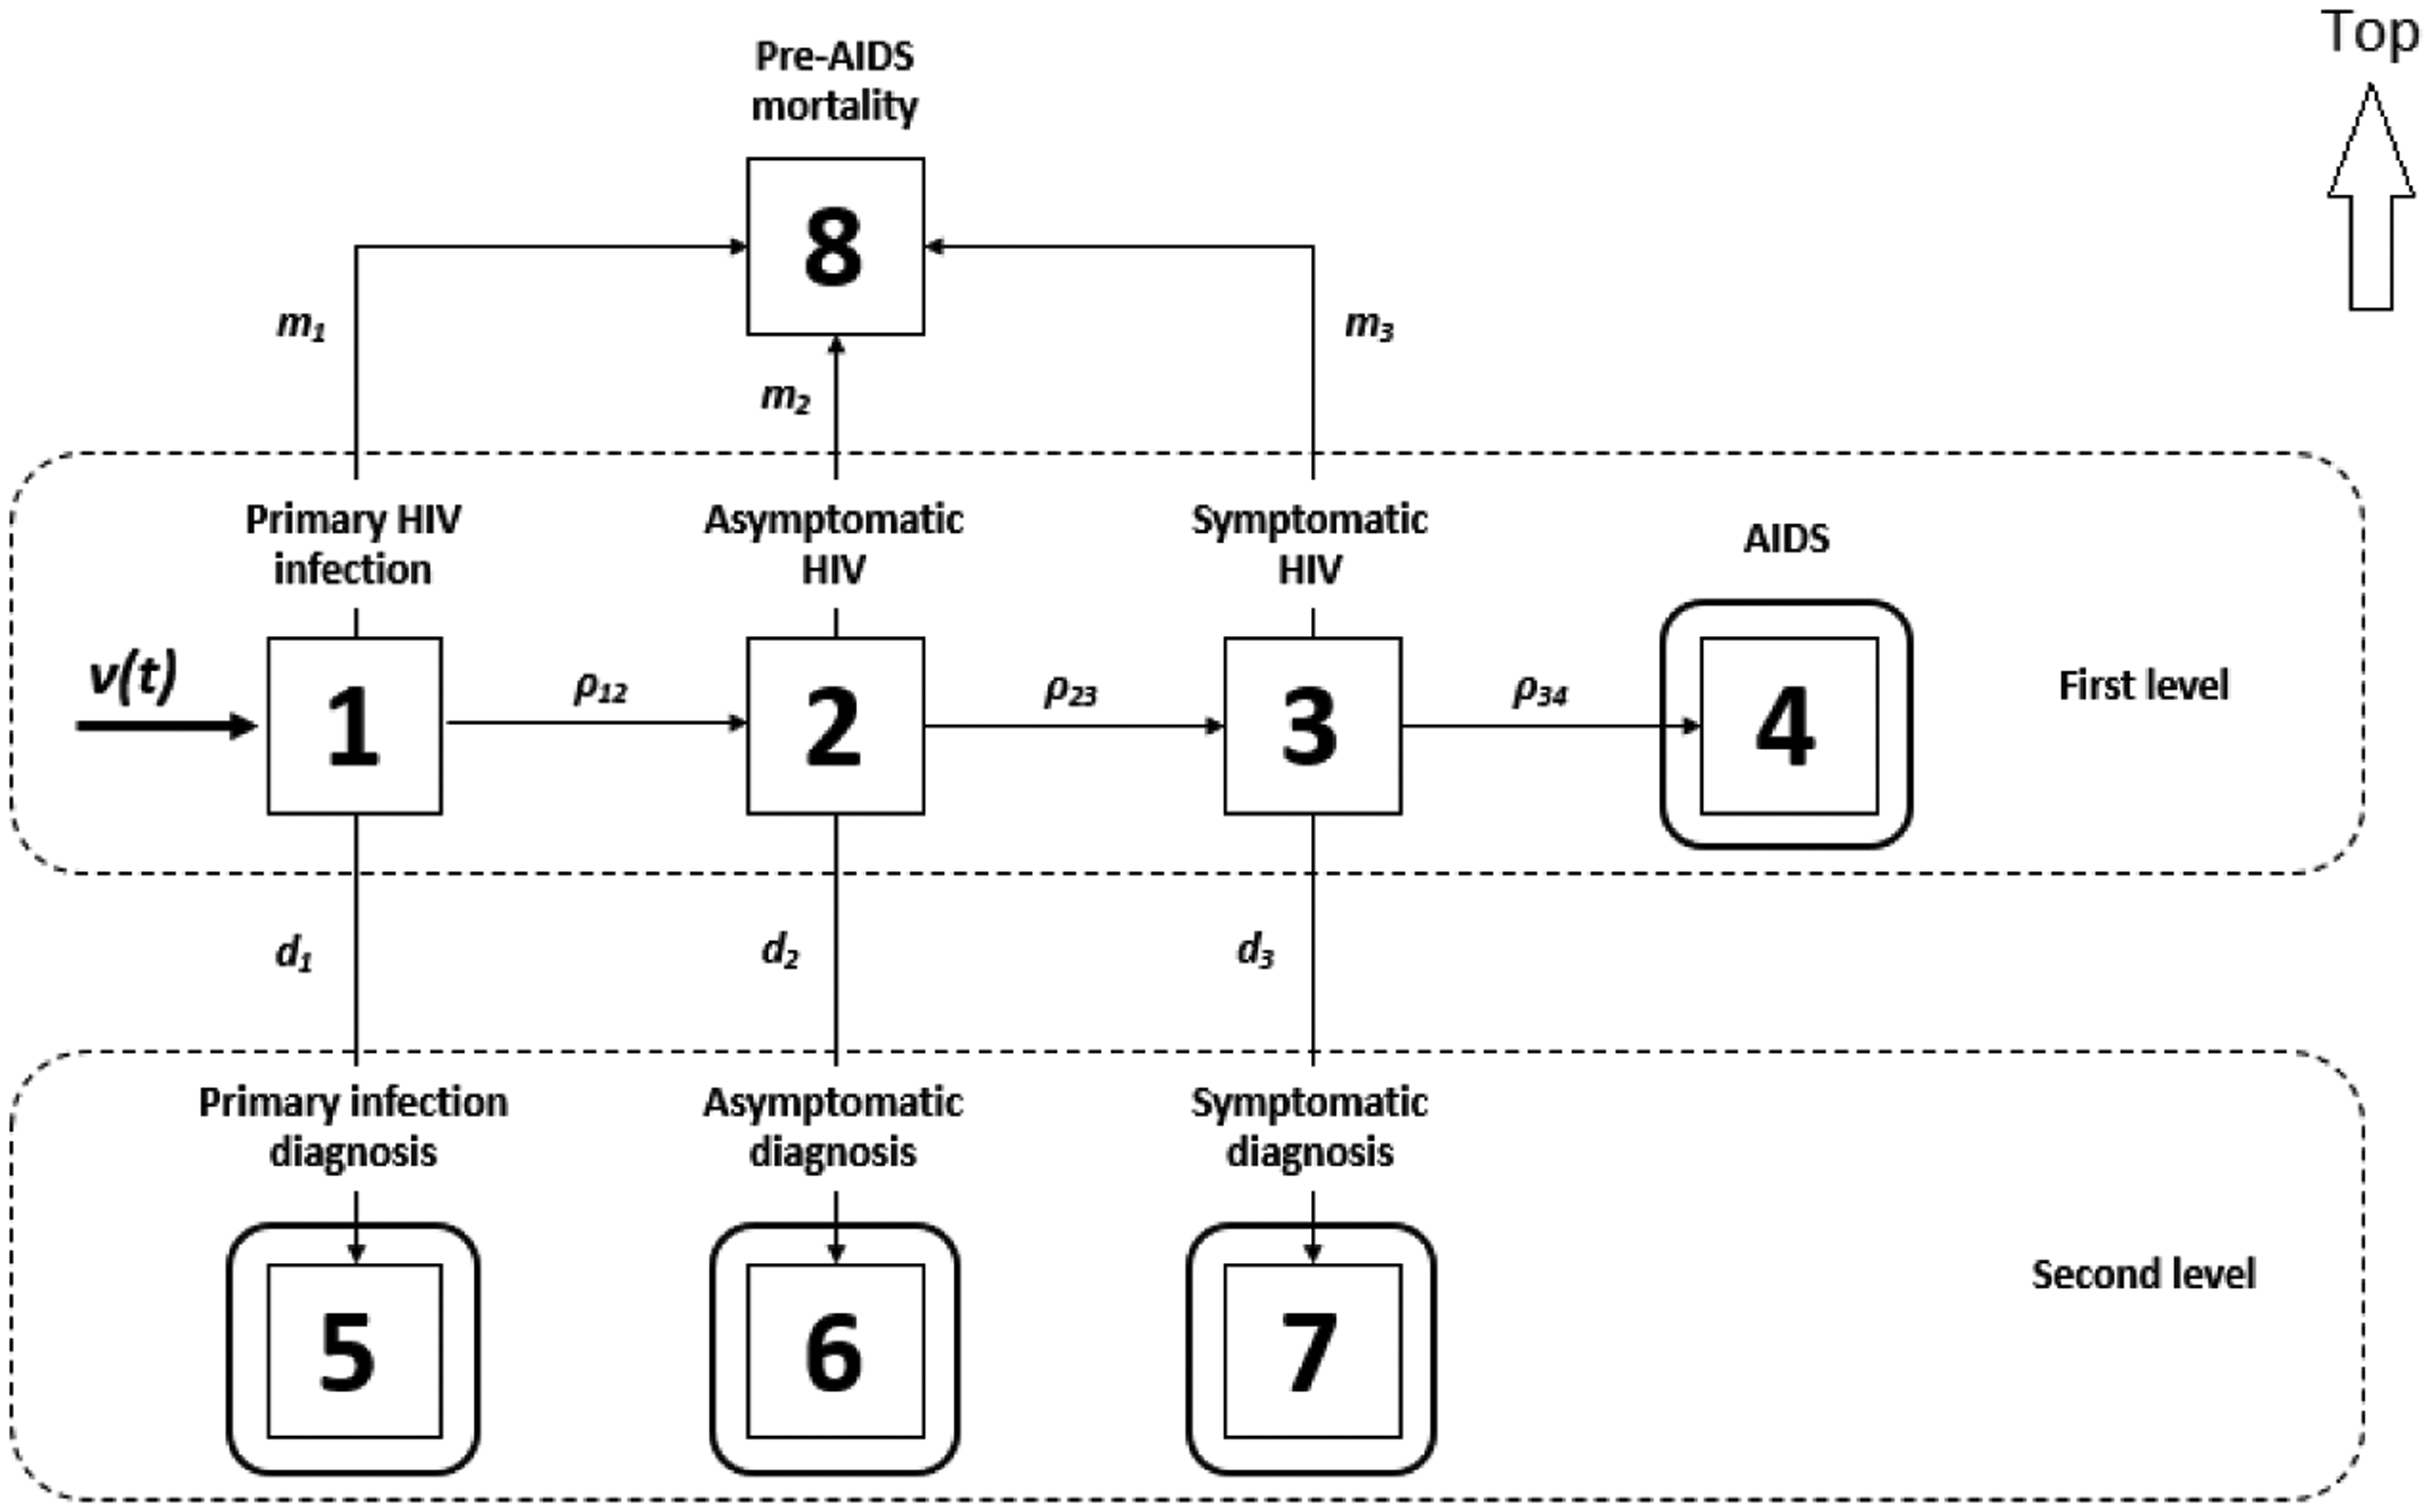
Multi-state Markov model describing the progression of HIV infection. The first level corresponds to the natural history of HIV with
The HIV mandatory notification system provides information on the number of individuals entering states 4, 5, 6, and 7. The individuals observed in state 4 are individuals with an initial HIV-positive diagnosis at the AIDS stage. Surrounded states are those for which data are available.
The main objective is to estimate the transition intensity
To take into account the temporal evolution of the HIV epidemic, the Markov process is assumed to be non-homogeneous, meaning that the transition probabilities may vary over time. Given that new infections occur according to a Poisson process, the new entries in states 4, 5, 6, and 7 were also Poisson processes. Once individuals reached these states (4, 5, 6, and 7), they were considered to be captured by the surveillance system, and their subsequent states were not useful for estimating the incidence. For this reason, we considered here that states 4, 5, 6, and 7 were absorbing states. In this model, we do not take into account the age of the subjects. According to the literature,22–24 introducing age can improve the estimates, but not taking it into account does not induce biased estimates if the study population and the distribution of incubation times are representative of the population. We chose our strata according to their screening heterogeneity and the indicators useful for monitoring prevention policies in France. Thus, we stratified our analyses by risk groups: MSM, heterosexuals born in France, and heterosexuals born abroad by sex (only MSM are shown in this article). Furthermore, adding age at this point would add more complexity to the stratification of the model. However, our model could be extended to take into account age in a similar way to the work of Brizzi et al. 25 although this represents a new study in itself.
3.2 Likelihood of the model
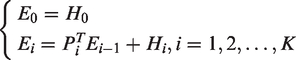
We adapted the approach proposed by Sommen et al.7,9 to the French HIV surveillance data by taking into account the primary infection stage to improve the HIV estimates in the recent period. We proposed a likelihood function of the model described in the previous section in Figure 1. As we worked in discrete time, transition intensities can be replaced by their corresponding transition probabilities for a step of the discrete-time Markov chain. We consider a discrete-time partition
Let Pi be the matrix of the discrete Markov chain transition probabilities for the time interval Ti, with t1 being the first week of 1994, tS being the first week of 2004, and tK being the last week of 2018. The incidence is estimated in the period 1994–2018 because we assume that the HIV diagnostic data from 2004 potentially contain information to estimate the number of infected subjects up to 10 years earlier. We can note
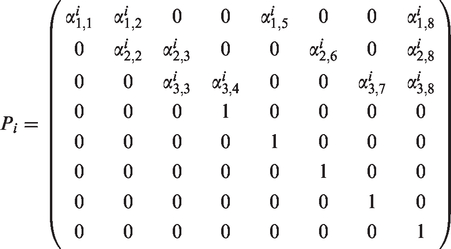
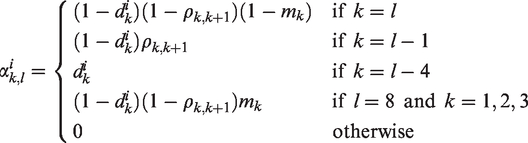
The elements of the matrix P can be defined as follows
5
For the discrete-time approximation, we assume that new infections enter at state 1 at each week Ti. The cumulative HIV incidence in
The HIV mandatory notification provides information on the observed number of HIV diagnoses. We note
Using the Poisson assumption, the likelihood of the model, for the estimation of the HIV incidence curve
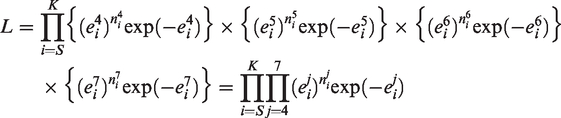
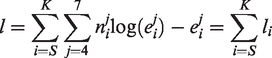
The sum starts at time TS, which corresponds to the first week of the year 2004 (start of data collection), and ends at time TK, which corresponds to the last week of 2018. The log-likelihood function l is expressed as
3.3 Penalized likelihood
It is desirable to produce a smooth estimate of the curve representing the incidence
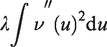
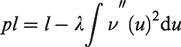
We consider pl to be penalized log-likelihood of the form
Estimated parameters are the HIV diagnostic probabilities vectors
Since the estimator of the incidence curve
These splines are easy to manipulate because, like polynomials, they are easily differentiable. A spline function is entirely defined in a given interval [L;U] by a sequence of a limited number (Q) of increasing nodes
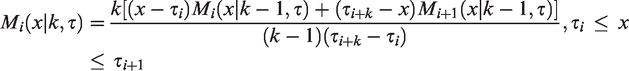
with
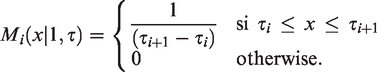
Each Mi is null outside the interval
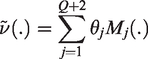
We want to estimate the parameter vector
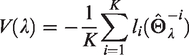
It is not possible a priori to estimate the magnitude of the value taken by the smoothing parameter λ. Thus, an automatic method can be used to give a value of the smoothing parameter more rapidly. One technique to choose the smoothing parameter is the cross-validation method. This involves to minimizing the following function29–31
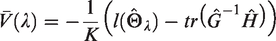
A binary search algorithm is used for the minimization of the approximate cross-validation score. Once the value of the parameter λ is estimated, this value is integrated into the penalized likelihood pl which is then maximized using the Marquardt algorithm.
32
Bayesian methods for obtaining point-to-point confidence bands when the approximation of the function to be estimated is obtained by combinations of splines were introduced by Whaba.
33
An approximate 95% Bayesian confidence interval for
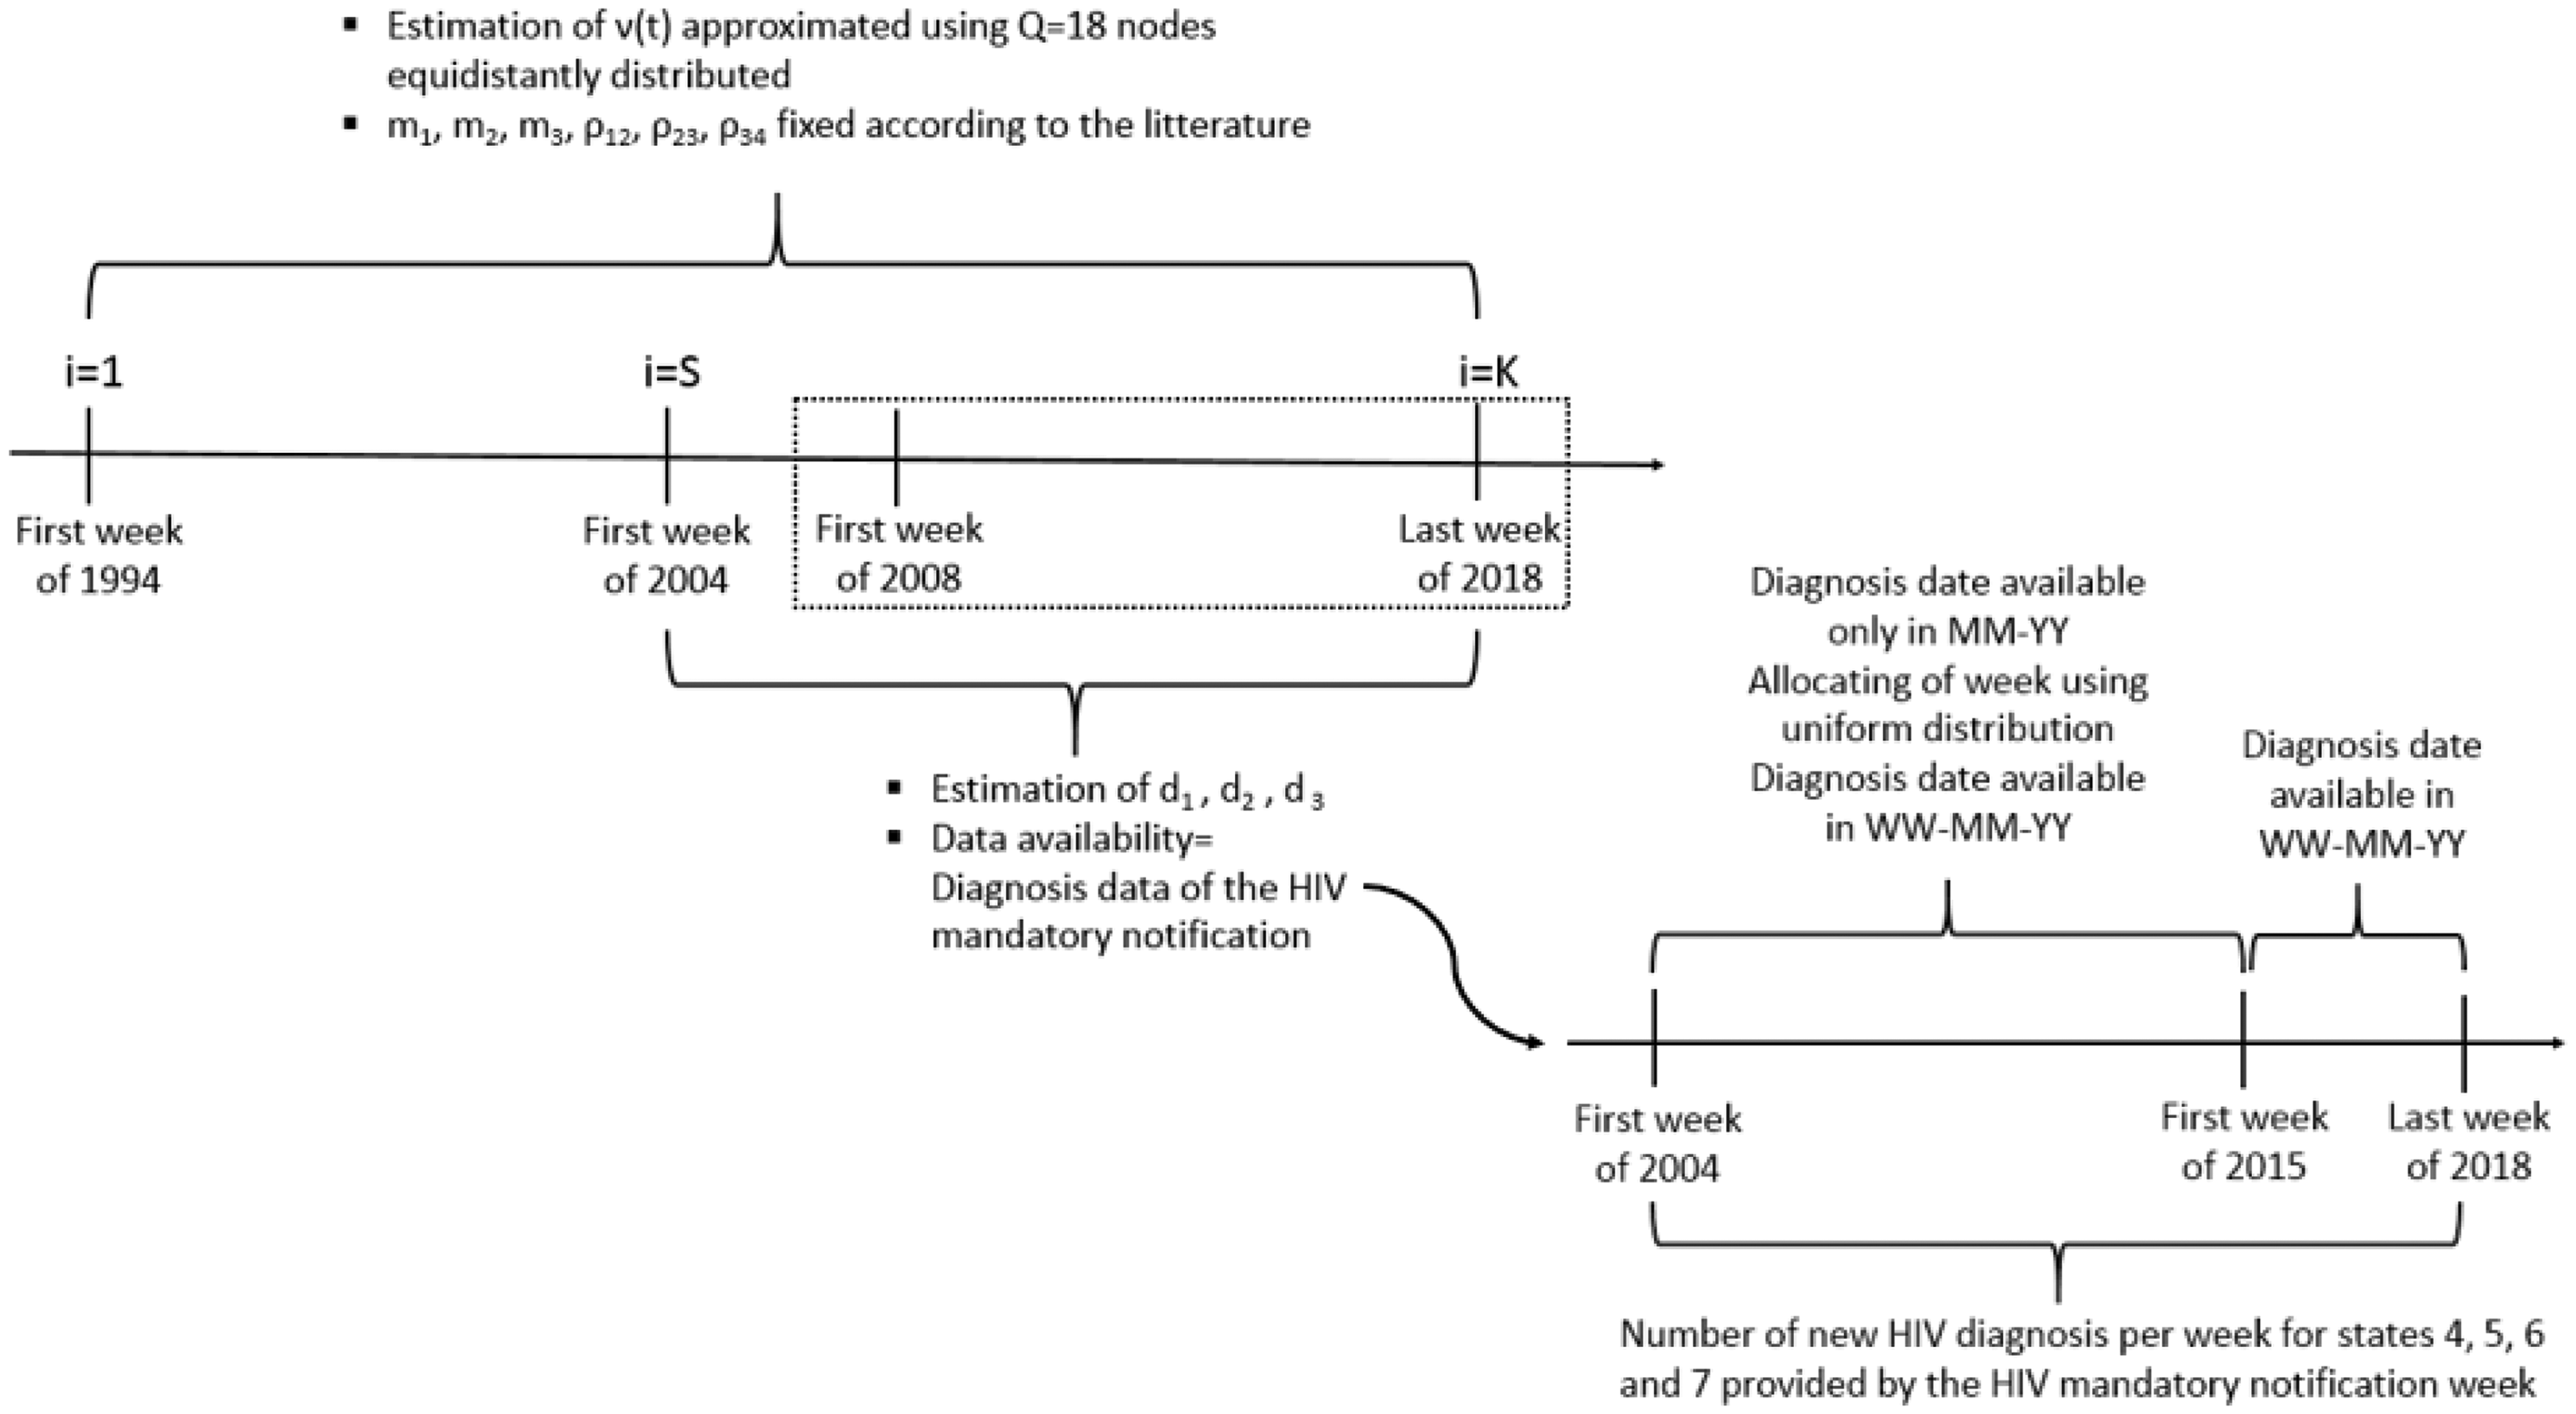
Summary of the dates and time units mentioned in the model and the data. The dotted square corresponds to the period where the results are presented. WW-MM-YY: Week-Month-Year.
3.4 Delay from infection to diagnosis
From the model presented in Section 3.1, we can estimate the HIV incidence, the number

We assume that the transition intensities are constant in a reduced number M of time periods Wj defined by

Each matrix in the product can be calculated as a function of a transition intensity matrix which is constant in the corresponding period Wj. The quantities
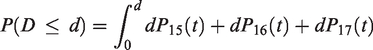
The calculation of the cumulative distribution function
4 Results
4.1 Practical assumptions
Our HIV notification data spans from the first week of 2004 to the last week of 2018, and all duration intervals Ti are in weeks. We decided to consider five calendar periods in which transition probabilities were assumed to be constant but can vary between periods:
In this model, it is necessary to specify the rates of disease progression and pre-AIDS mortality. The specific probabilities were chosen so as achieve a mean occupancy times of four weeks in state 1, 563 weeks (10.8 years) in state 2, and 52 weeks (1 year) in state 3. Hence, for all weeks, this correspond to
To approximate the maximum of the penalized likelihood estimators
We were less interested in the earlier years of incidence, instead focusing on the last 10 years. The figures are therefore shown for the years 2008–2018, which are our years of interest.
4.2 Simulation results
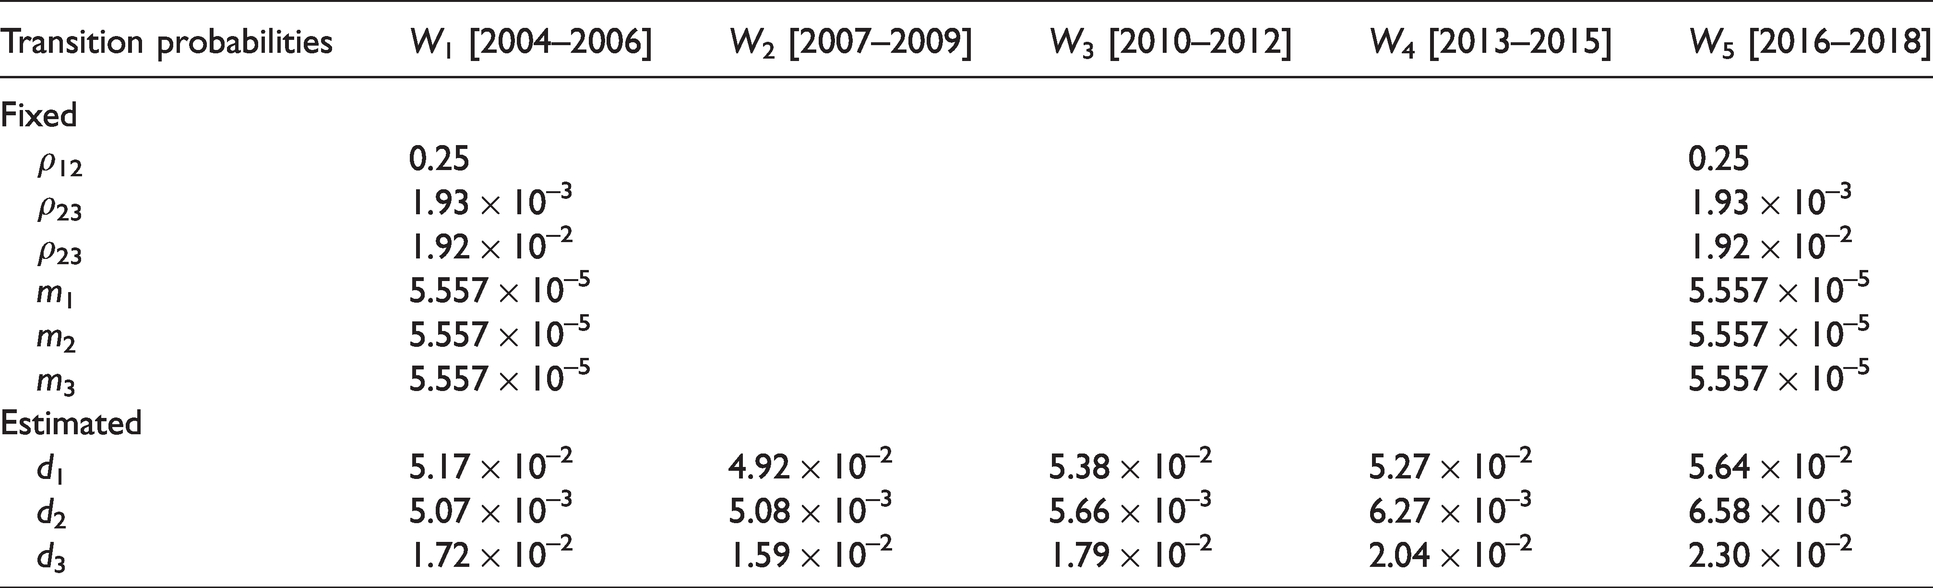
To evaluate the performance of the model for estimating both the HIV incidence and the transition probabilities for diagnosis, we performed 200 simulations. Minimizing the approximate cross-validation score for each of the 200 simulations was time-consuming, so we decided to minimize the approximate cross-validation score for only the first 10 simulations and consider the mean of these 10 approximate cross-validation scores. We obtained a mean of
Values of the fixed and estimated transition probabilities in the simulation for the five calendar periods.
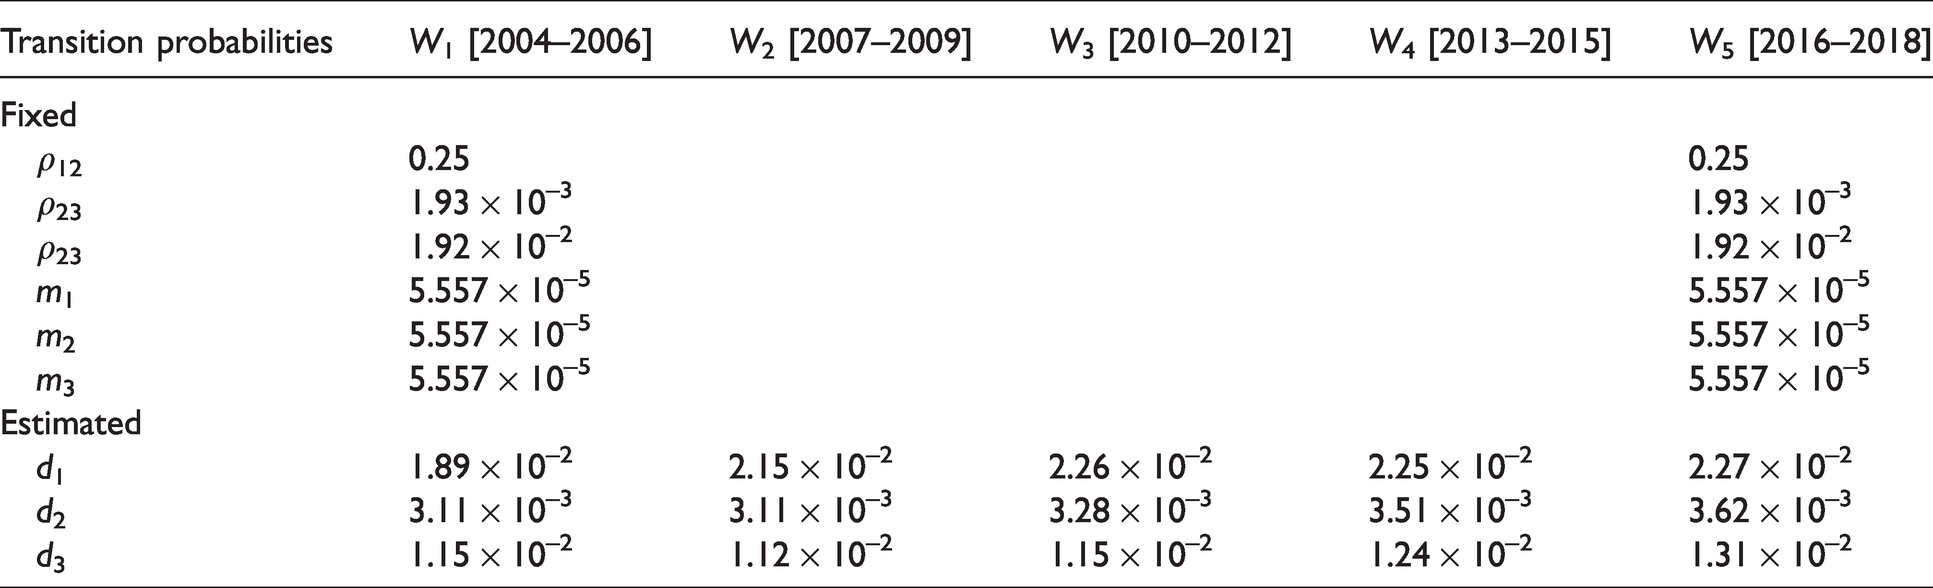
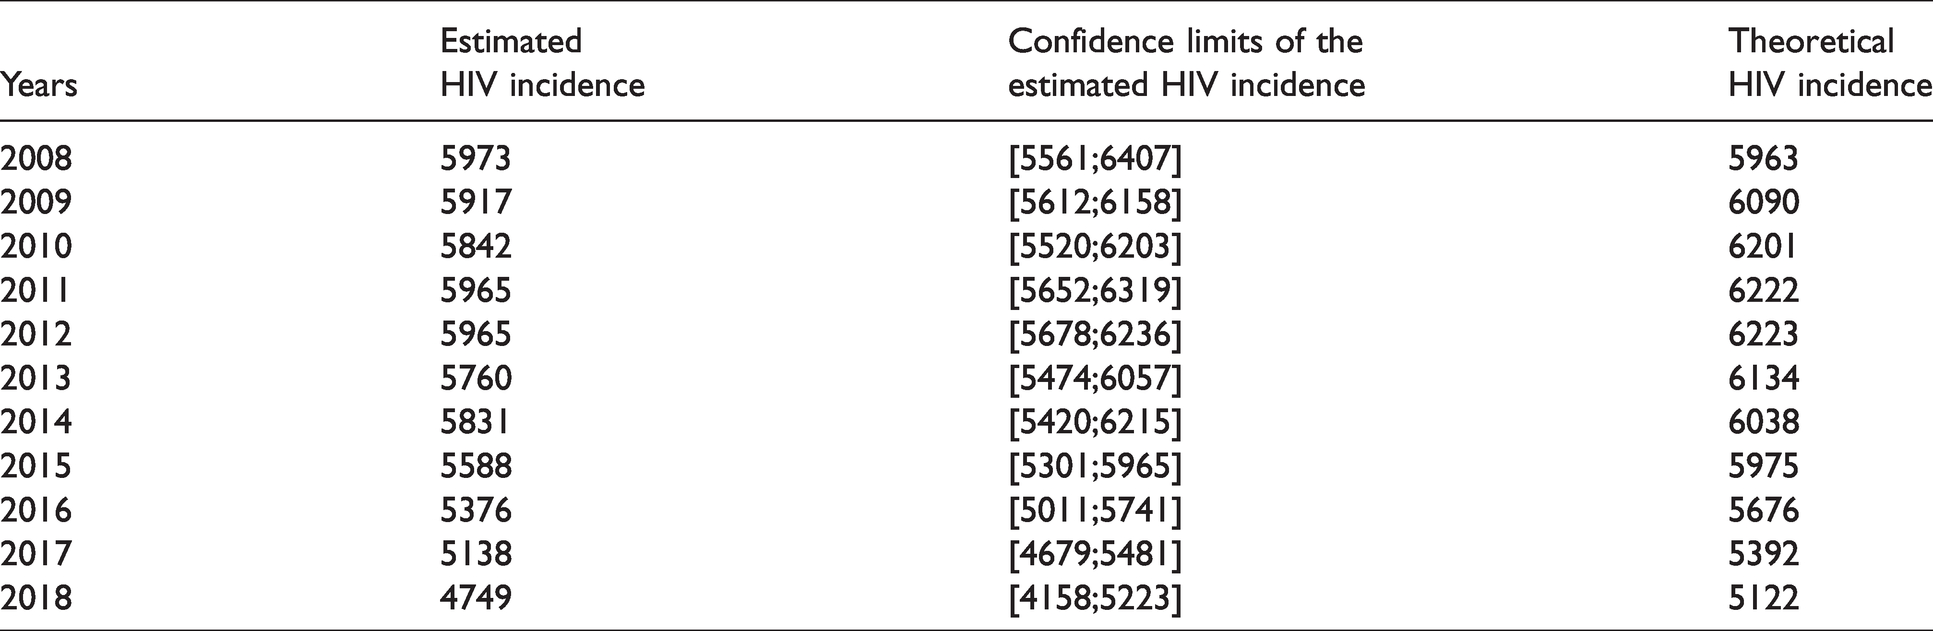
Figure 3 represents the theoretical HIV incidence curve, the simulated HIV incidence, the estimated HIV incidence, and the confidence intervals of the estimated annual HIV incidence between 2008 and 2018. Theoretical HIV incidence belongs to the confidence interval (pointwise Bayesian confidence limits) of the estimated HIV incidence for 9 years among 11. Only the years 2013 and 2015 are not in the confidence interval. The theoretical HIV incidence seems to be underestimated. The values of the theoretical HIV incidence, the estimated HIV incidence, and the 95% confidence limits of the estimated HIV incidence for the years 2008–2018 are presented in Table 2.
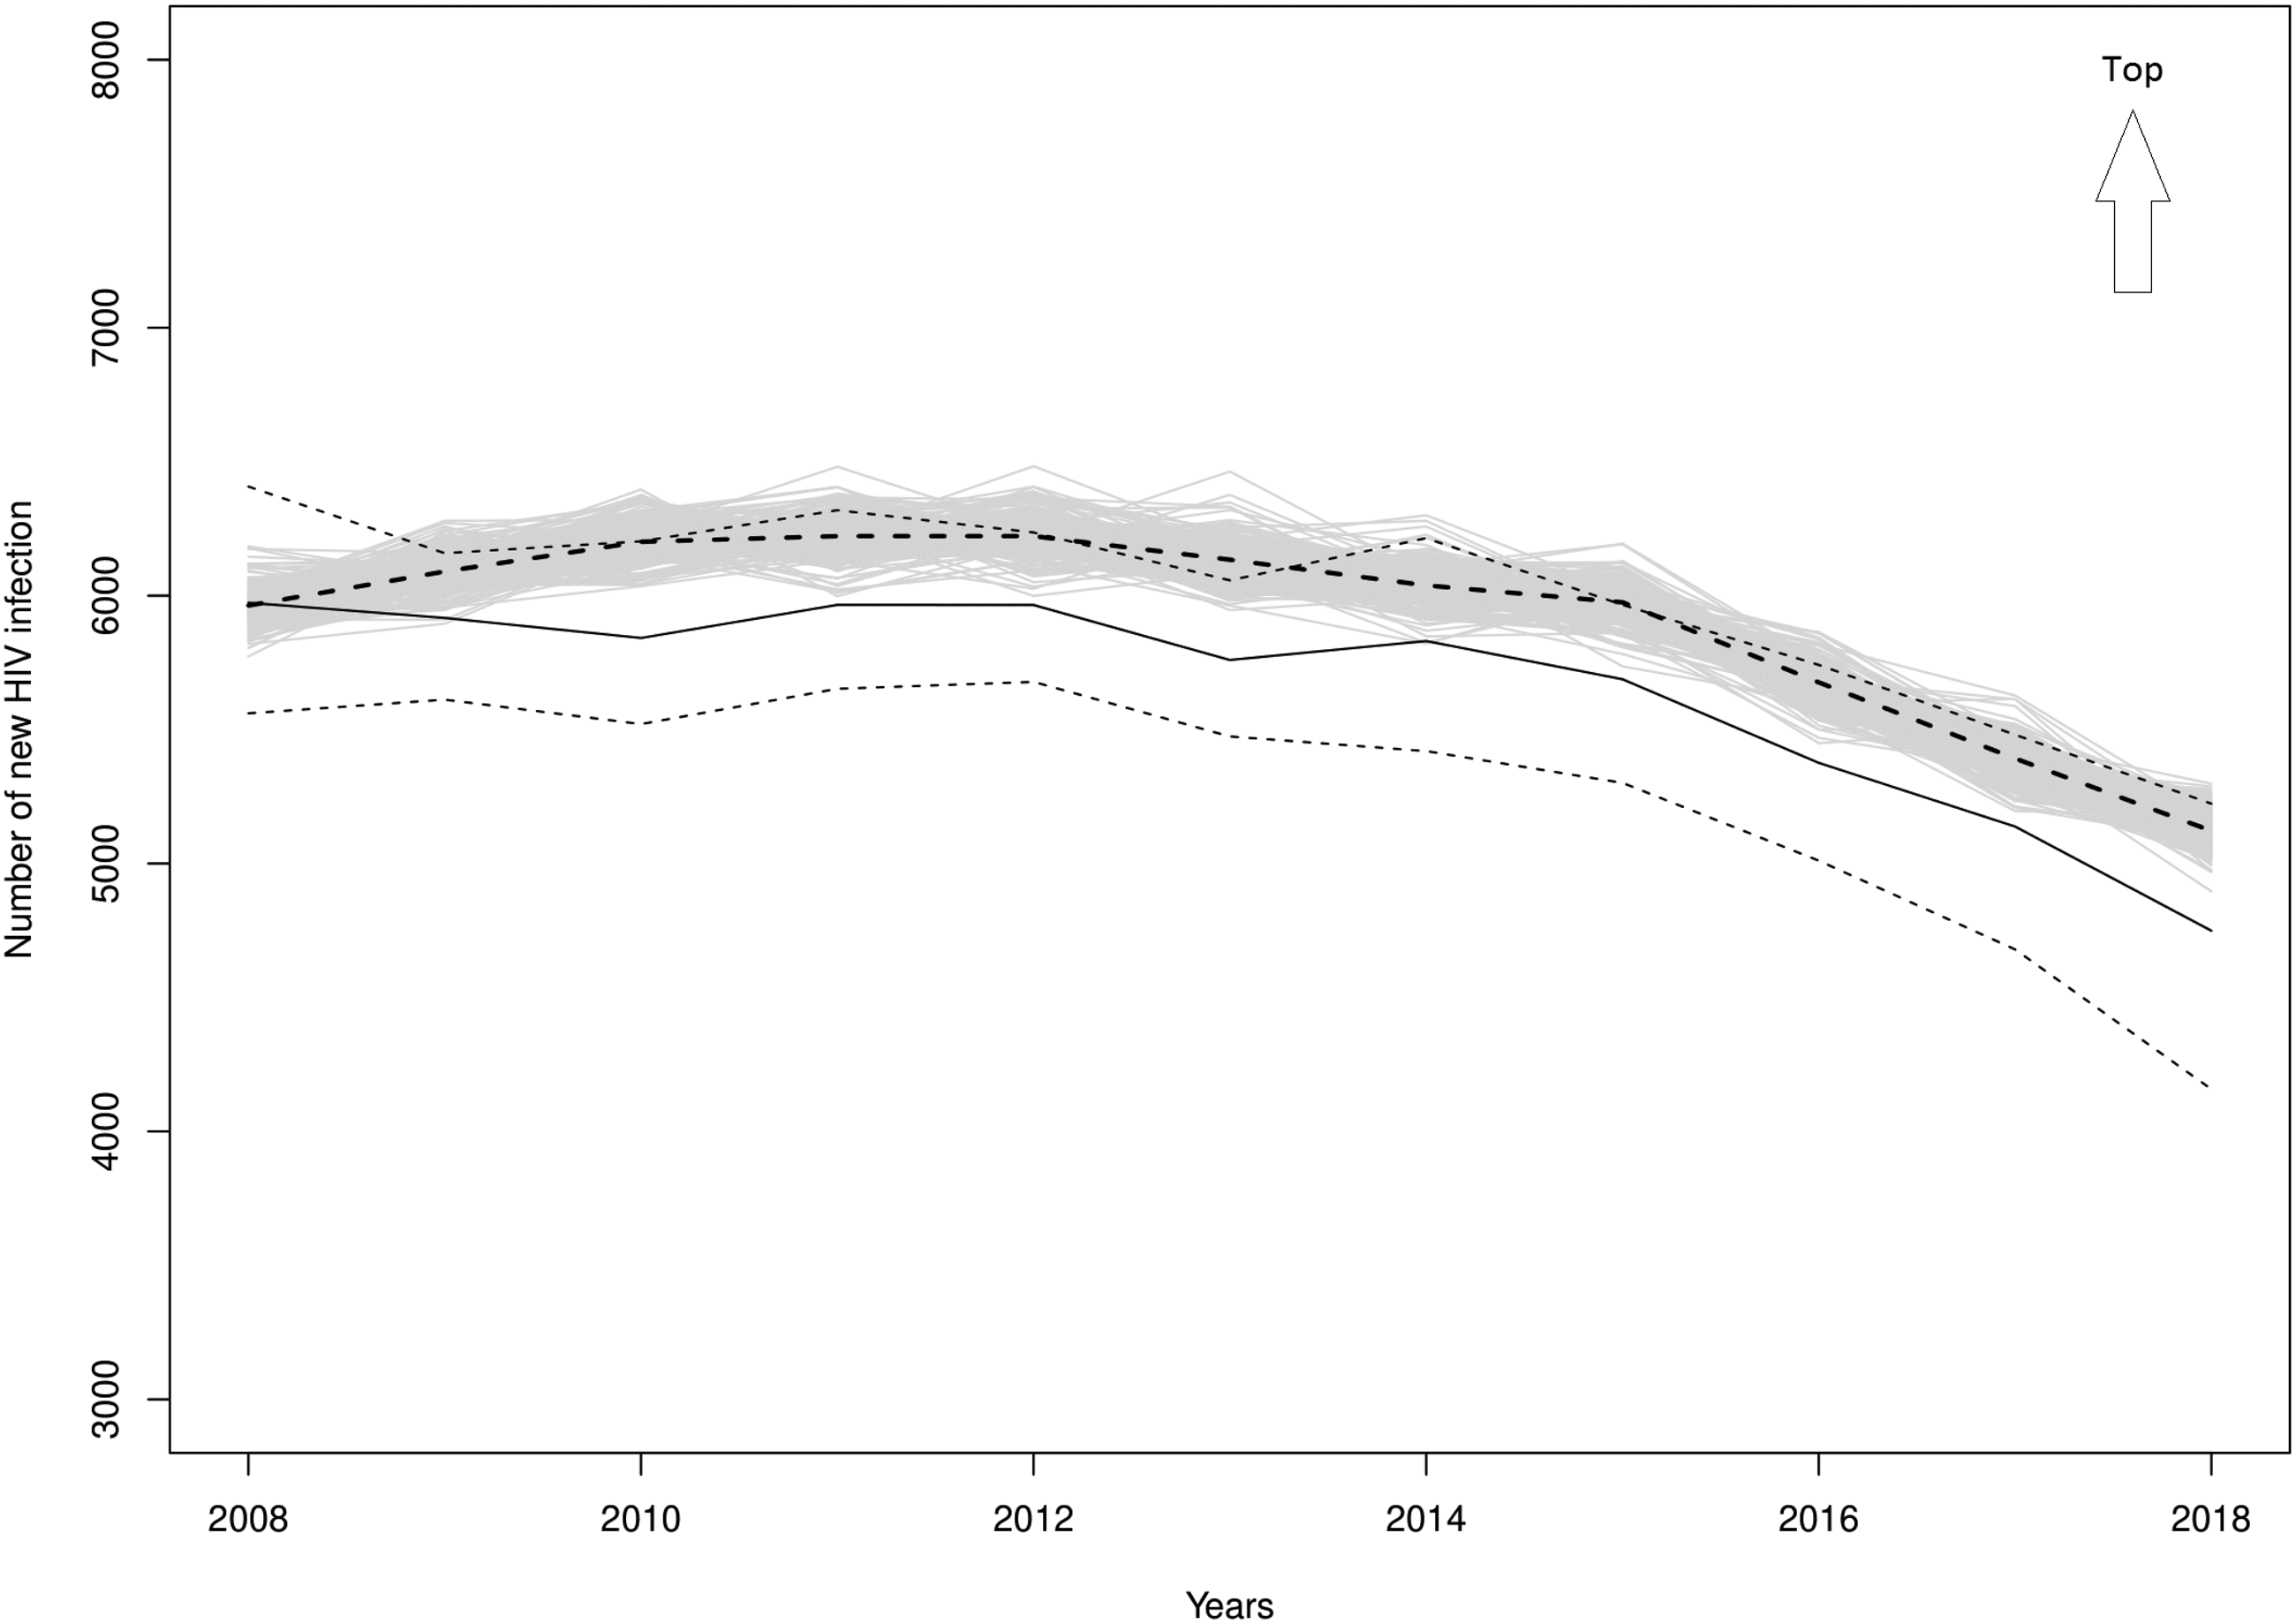
Theoretical (thick dashed line), simulated (gray strip), and estimated (solid curve) annual number of new HIV infections and the 95% pointwise Bayesian confidence limits (thin dashed lined) for the period 2008–2018.
Values for the theoretical and estimated HIV incidence as well as the 95% confidence limits of the estimated HIV incidence for the years 2008–2018.
Values of the fixed and estimated transition probabilities in the French MSM population for the five calendar periods.
The incidence is not our only criterion of judgment. We also have at our disposal the theoretical annual number of individuals in each state (
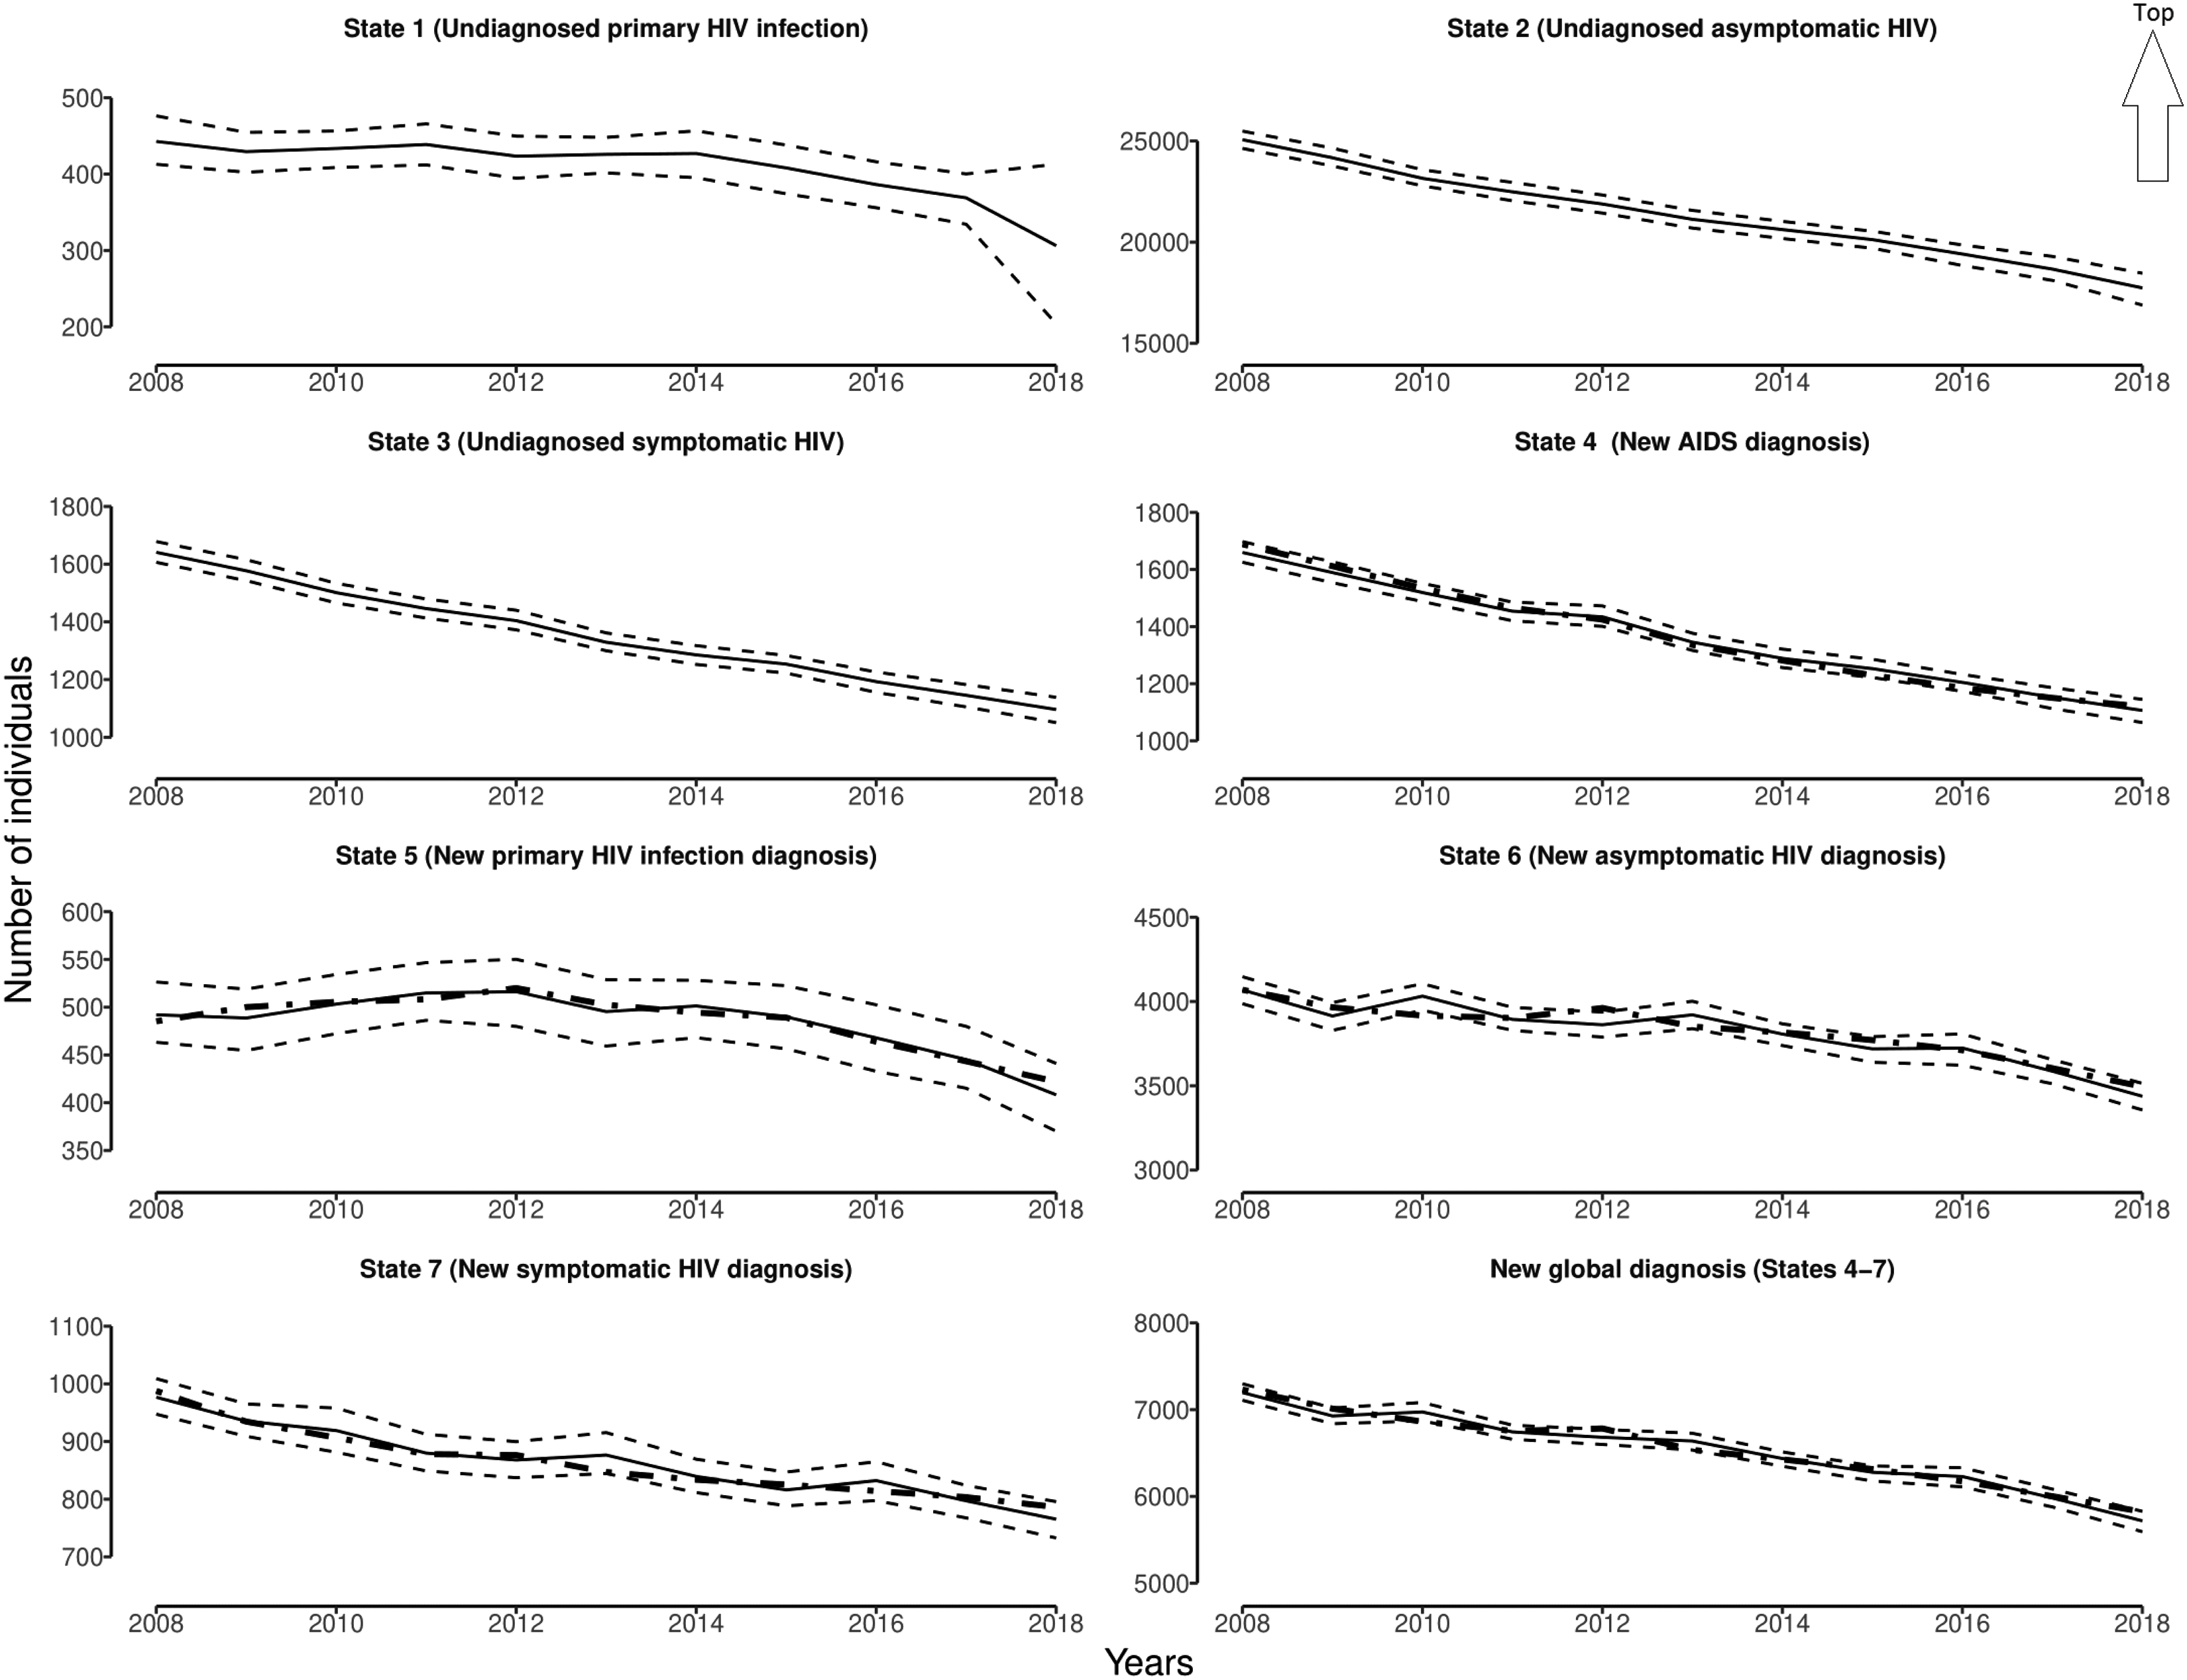
Theoretical (thick dashed line) and estimated (solid curve) annual number of individuals in each state of the model and the 95% pointwise Bayesian confidence limits (thin dashed line) for the period 2008–2018.
4.3 HIV mandatory notification results
The multi-state Markov model described in Section 3 is applied here to data for the global population of MSM taken from the French HIV mandatory notification system because this group has the highest risk of infection.
In the raw database of the HIV mandatory notification system, before taking into account reporting delays, completeness, and missing data, 83,283 new HIV diagnoses were reported between 2004 and 2018. Of the 83,283 new HIV declaration, 21,635 (26%) were in the MSM group, 32,654 (39.2%) in the heterosexual group, 1832 (2.2%) in the injection drug user group, and 982 (1.2%) in the other group (individuals without knowledge of their mode of contamination); 26,180 (31.4%) diagnosis had missing values. Of the 21,635 new declaration in the MSM group, 12,178 (56.3%) were at the asymptomatic stage, 3438 (15.9%) at the primary infection stage, 2048 (9.5%) at the symptomatic stage, and 2354 (10.9%) at the AIDS stage; 1617 (7.4%) diagnoses had missing values.
For the estimates, we use imputed data. Indeed, starting from the raw database, a multiple imputation of 75 databases was carried out to remove any missing data. The estimate is based on the 75 databases, with Rubin’s rules 18 then being applied. The resulting estimates account for both within- and between-imputation variance, taking into account the uncertainty due to missing data. Multiple imputation is performed under the assumption of a missing at random mechanism, and under this assumption, we obtained unbiased parameter estimates when proportions of missing data are less than 50%. 34
Values of the fixed transition probabilities (ρ12, ρ23, ρ34, m1, m2, and m3) and the estimated transition probabilities (d1, d2, and d3) in the French MSM population for the five calendar periods are presented in Table 3. All the estimated transition probabilities d1, d2, and d3 increase over time.
Figure 5 represents the estimated HIV incidence curve in the French MSM population, and the confidence intervals of the estimated annual HIV incidence between 2008 and 2018. We observe that the HIV incidence in the French MSM population slightly increases from 2008, has a first peak in 2011, a second peak in 2014, a drop from 2014 to 2015, a stabilization from 2015 to 2017, and then slightly increases to 2018.
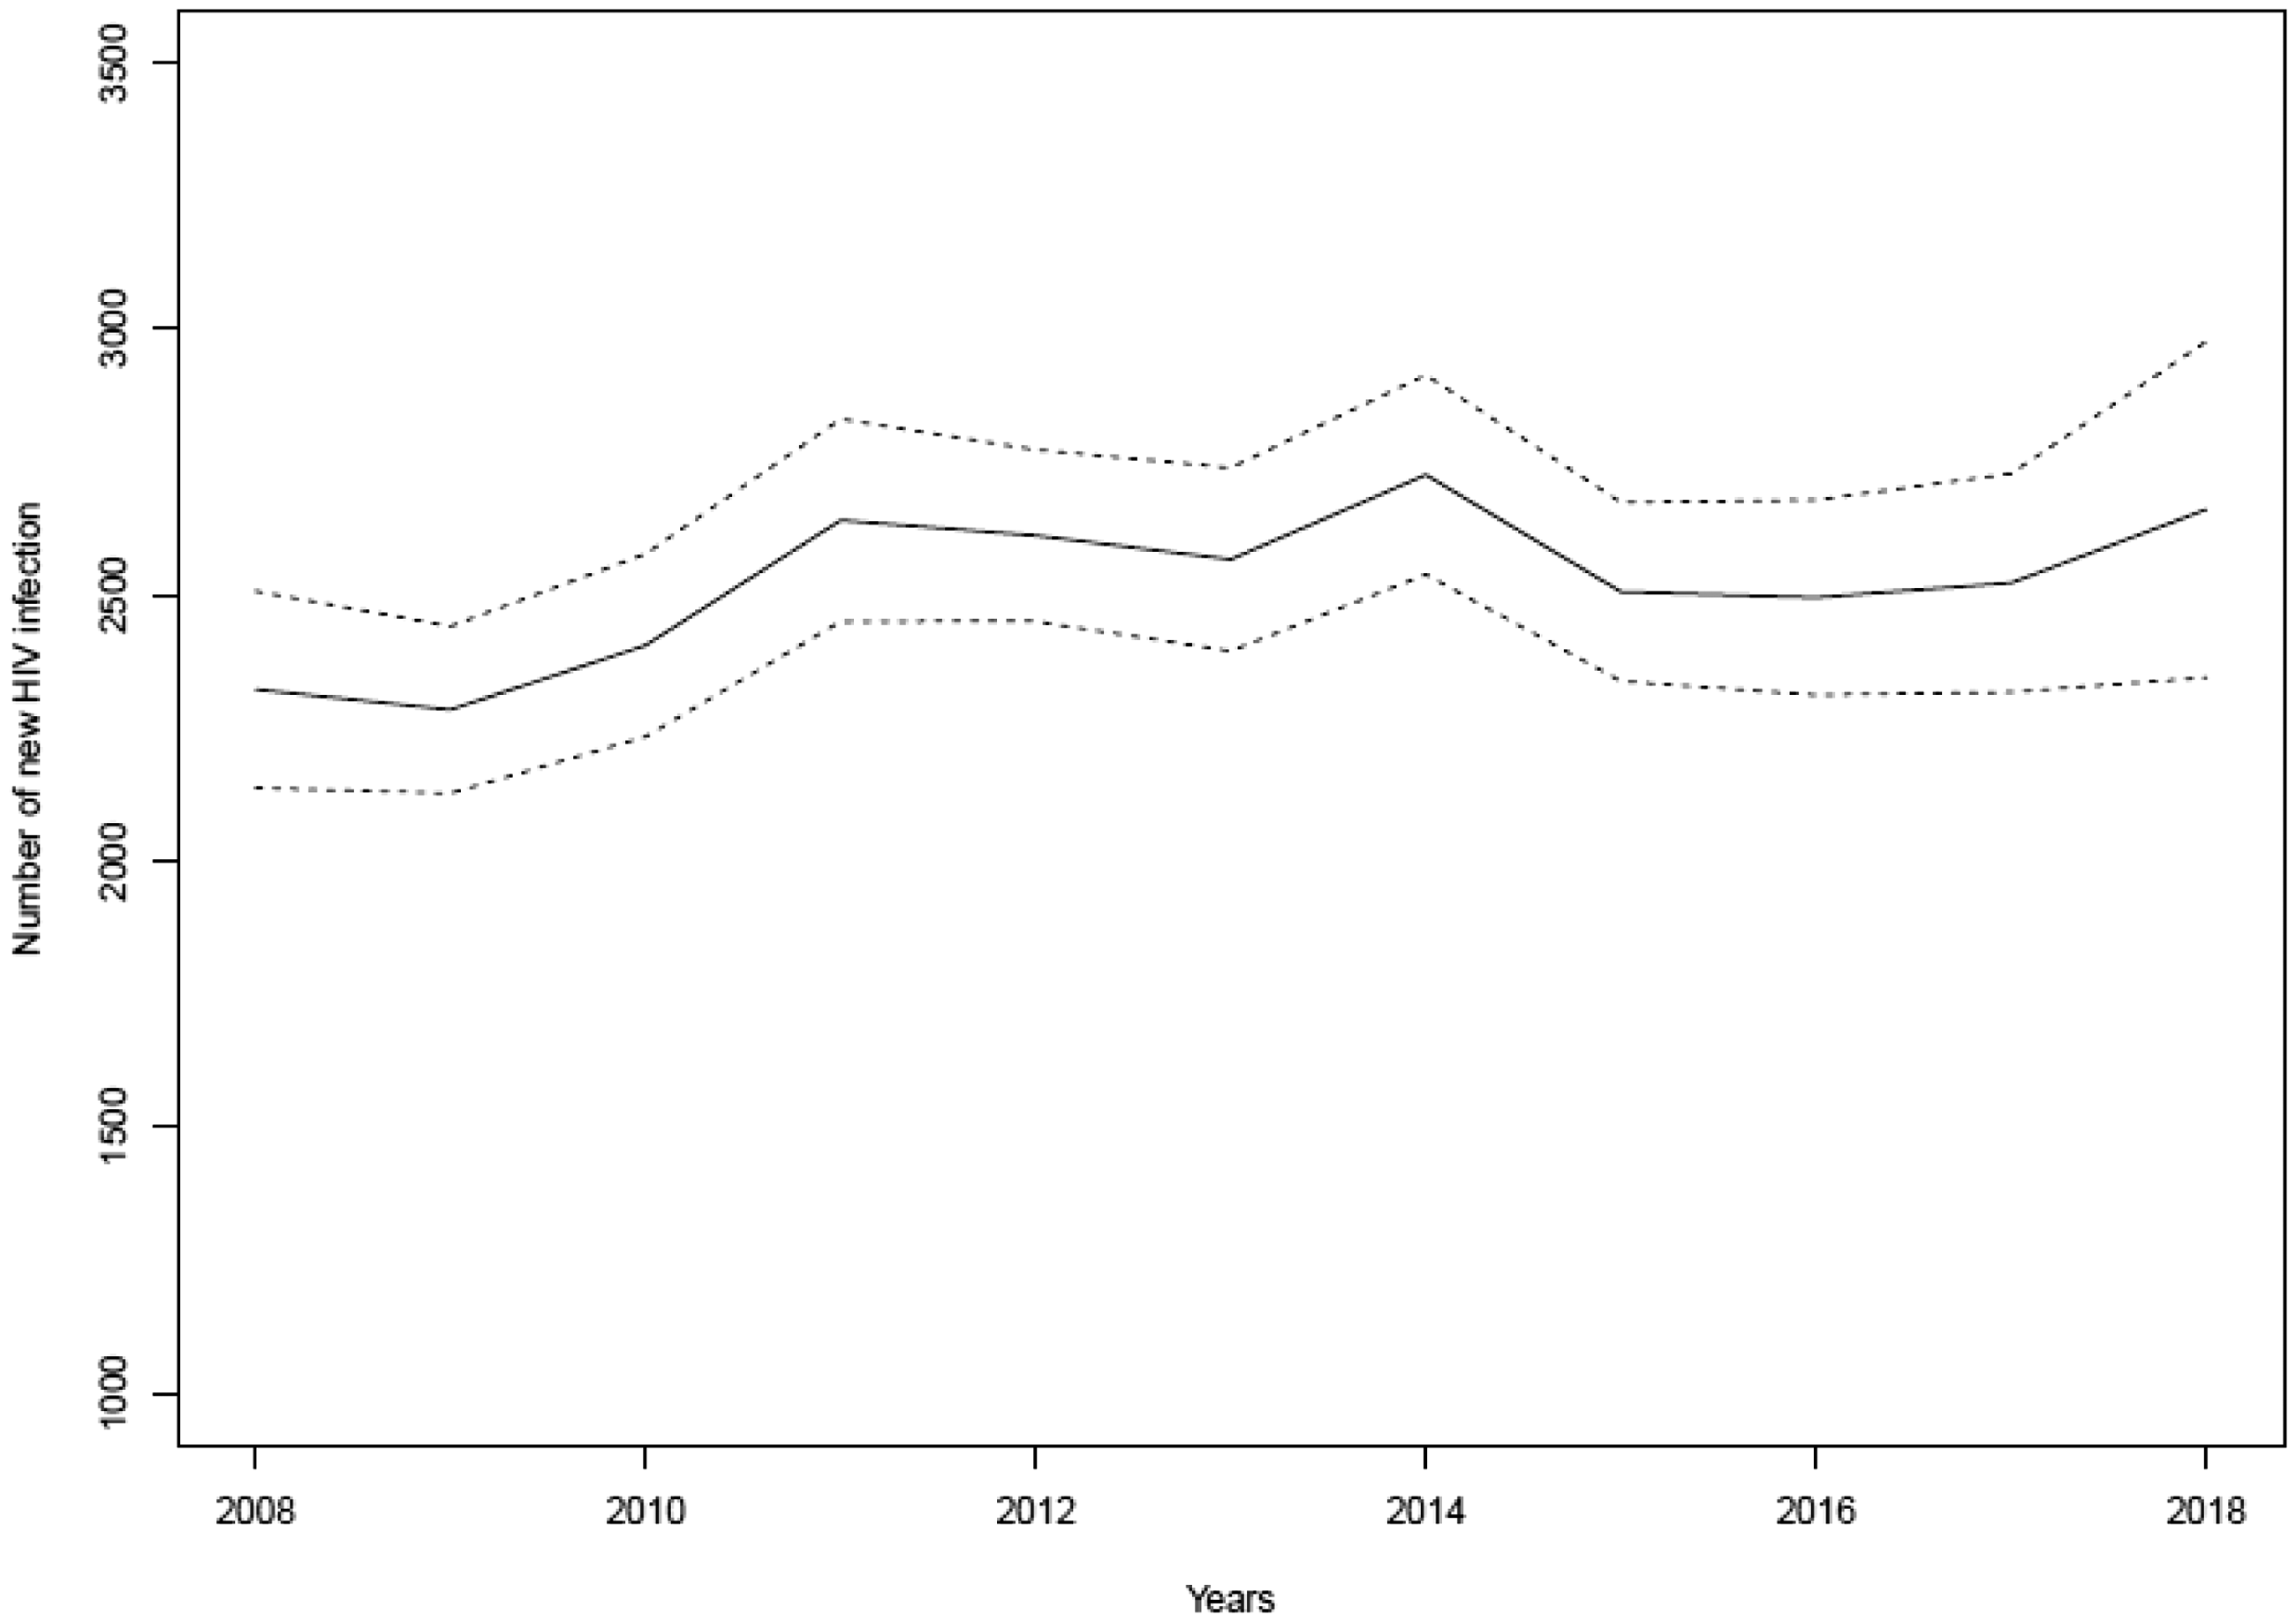
Estimated (solid curve) annual number of new HIV infection in the French MSM population and the 95% pointwise Bayesian confidence limits (thin dashed) for the period 2008–2018.
To investigate the model’s goodness-of-fit, we show the observed and expected annual number of individuals in each state of the model in the French MSM population as well as the 95% pointwise Bayesian confidence limits for the period 2008–2018 in Figure 6. Note that the trend of the expected number of individuals in each state is correctly captured.
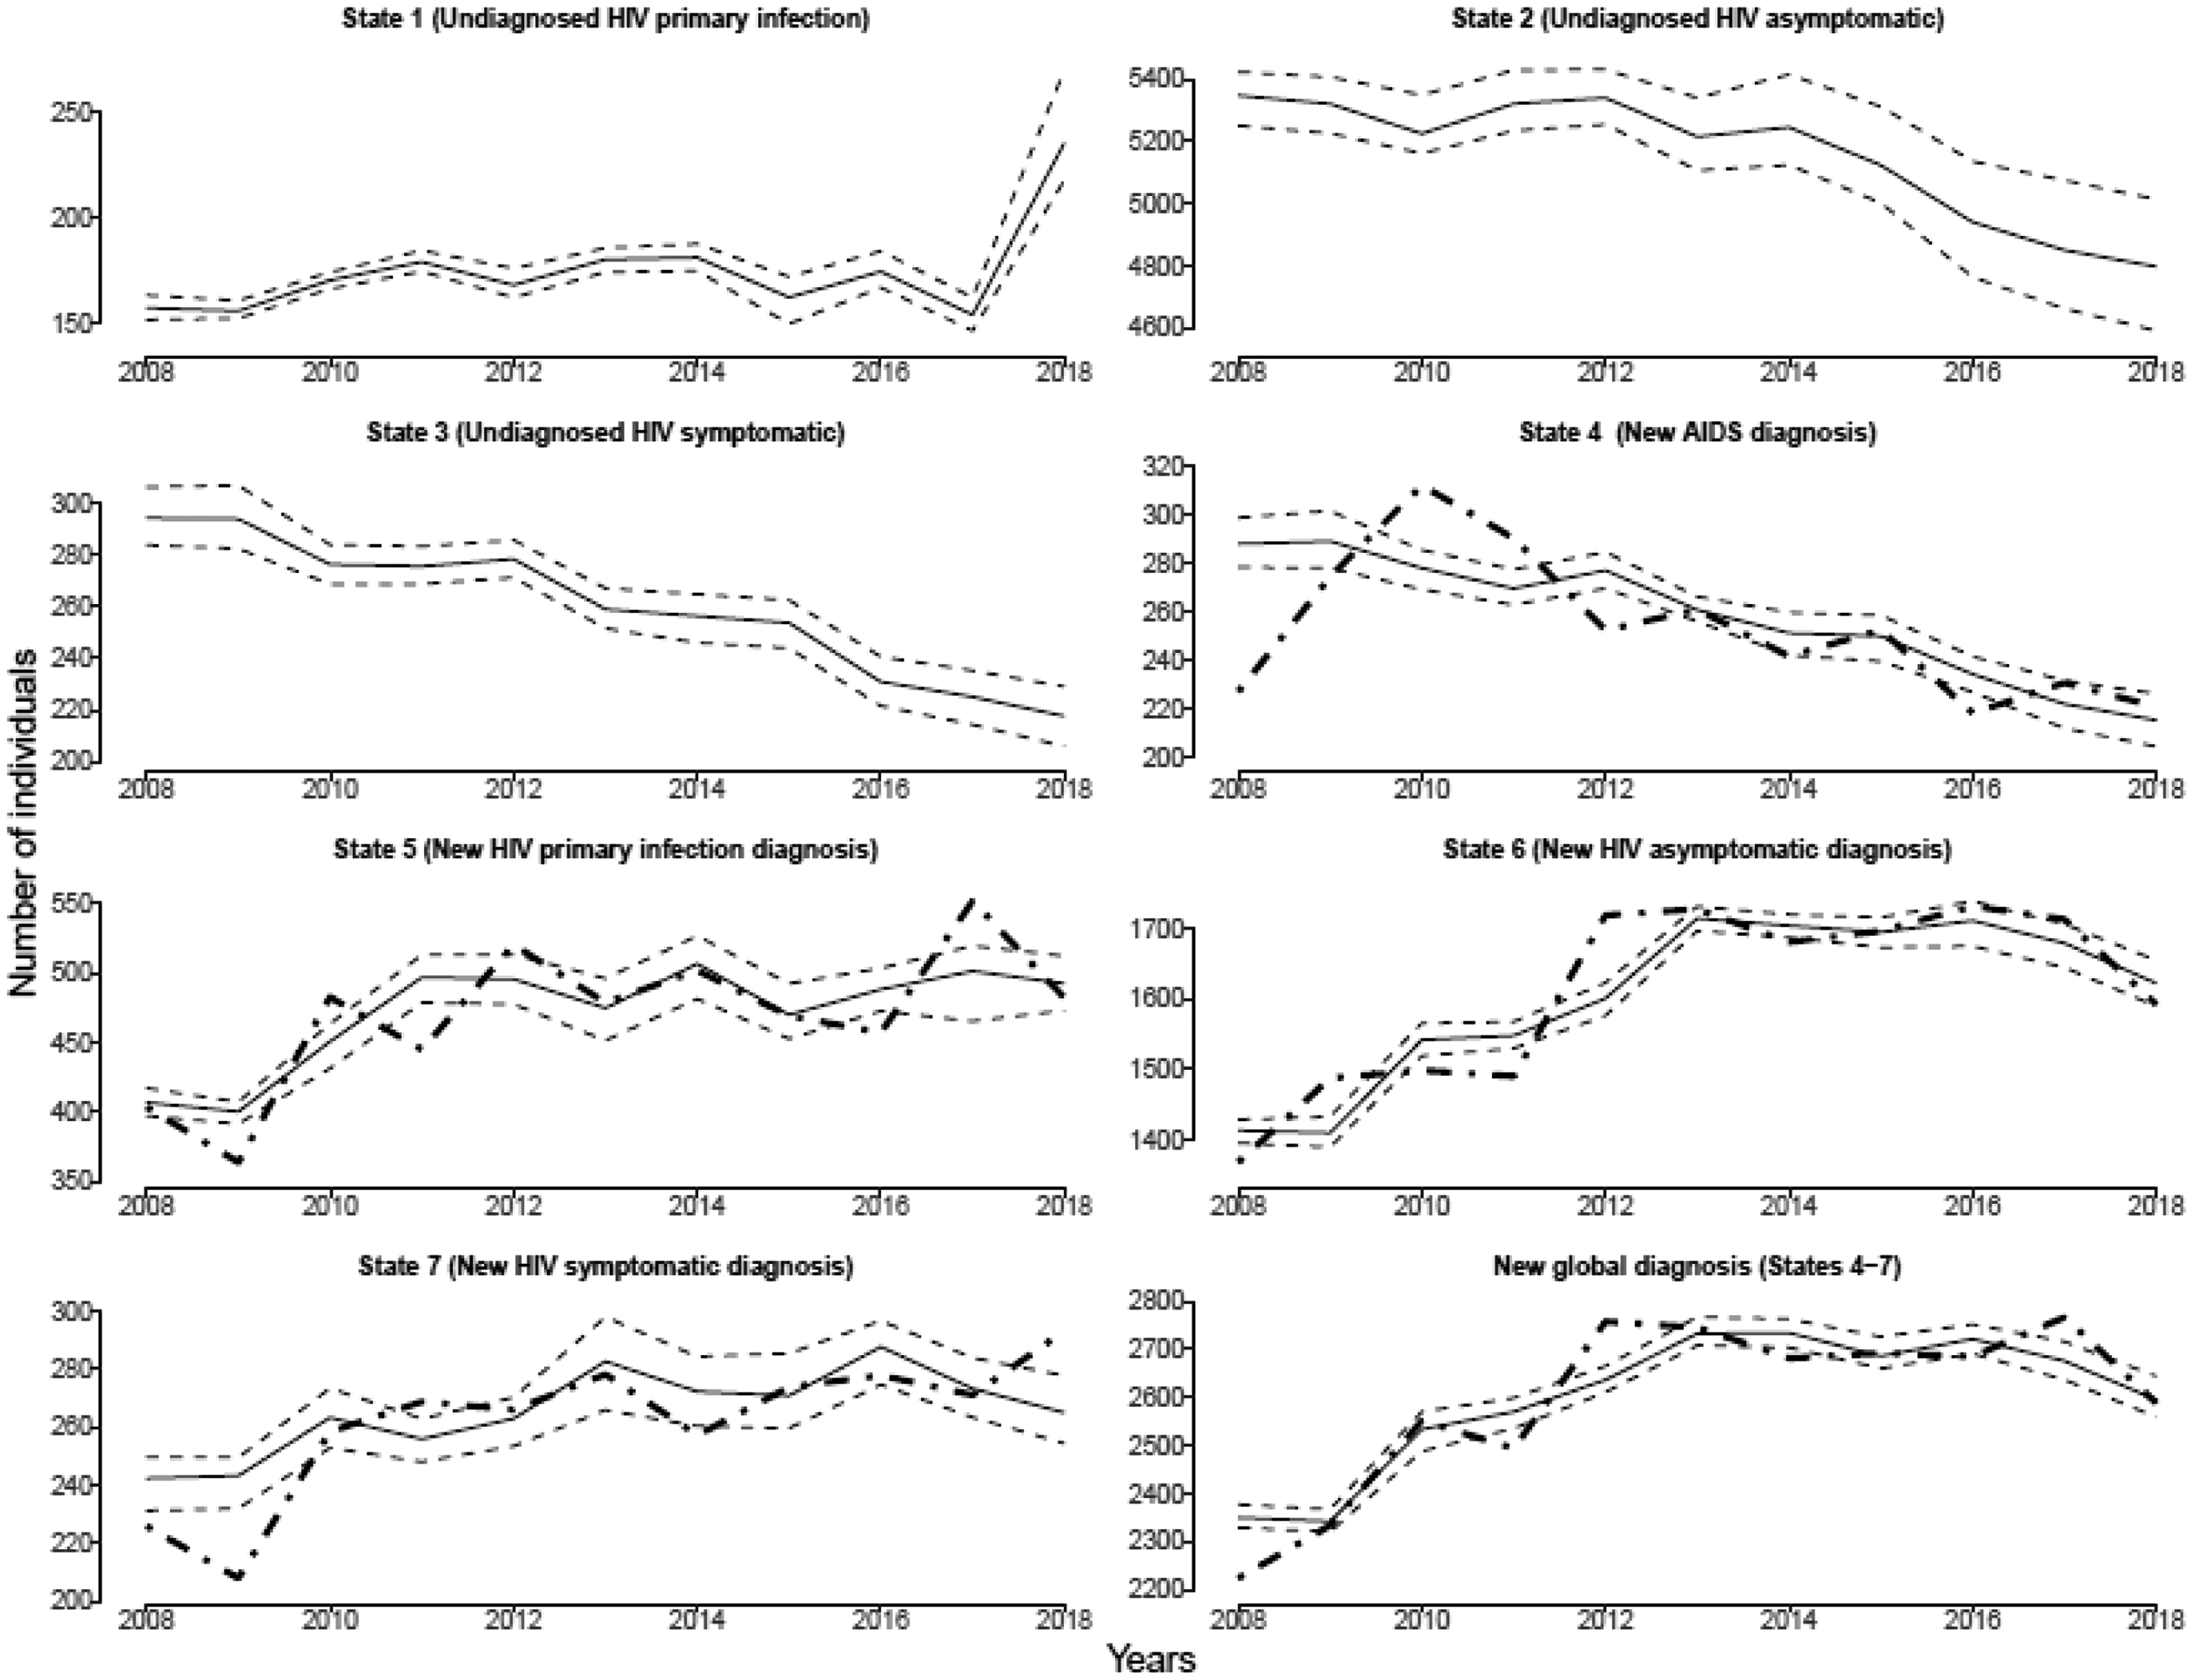
Theoretical (thick dashed line) and estimated (solid curve) annual number of individuals in each state of the model in the French MSM population and the 95% pointwise Bayesian confidence limits (thin dashed line) for the period 2008–2018.
To compare the time between infection and diagnosis, we consider individuals infected in period W1 and W5. For the sake of simplicity, we assume that the transition probabilities for infected individuals in W1 remain constant until W5. With this assumption, we estimated the probability distribution of the delay between infection and diagnosis for the two groups of individuals. The evolution of the two cumulative distribution functions in the French MSM population is shown in Figure 7.
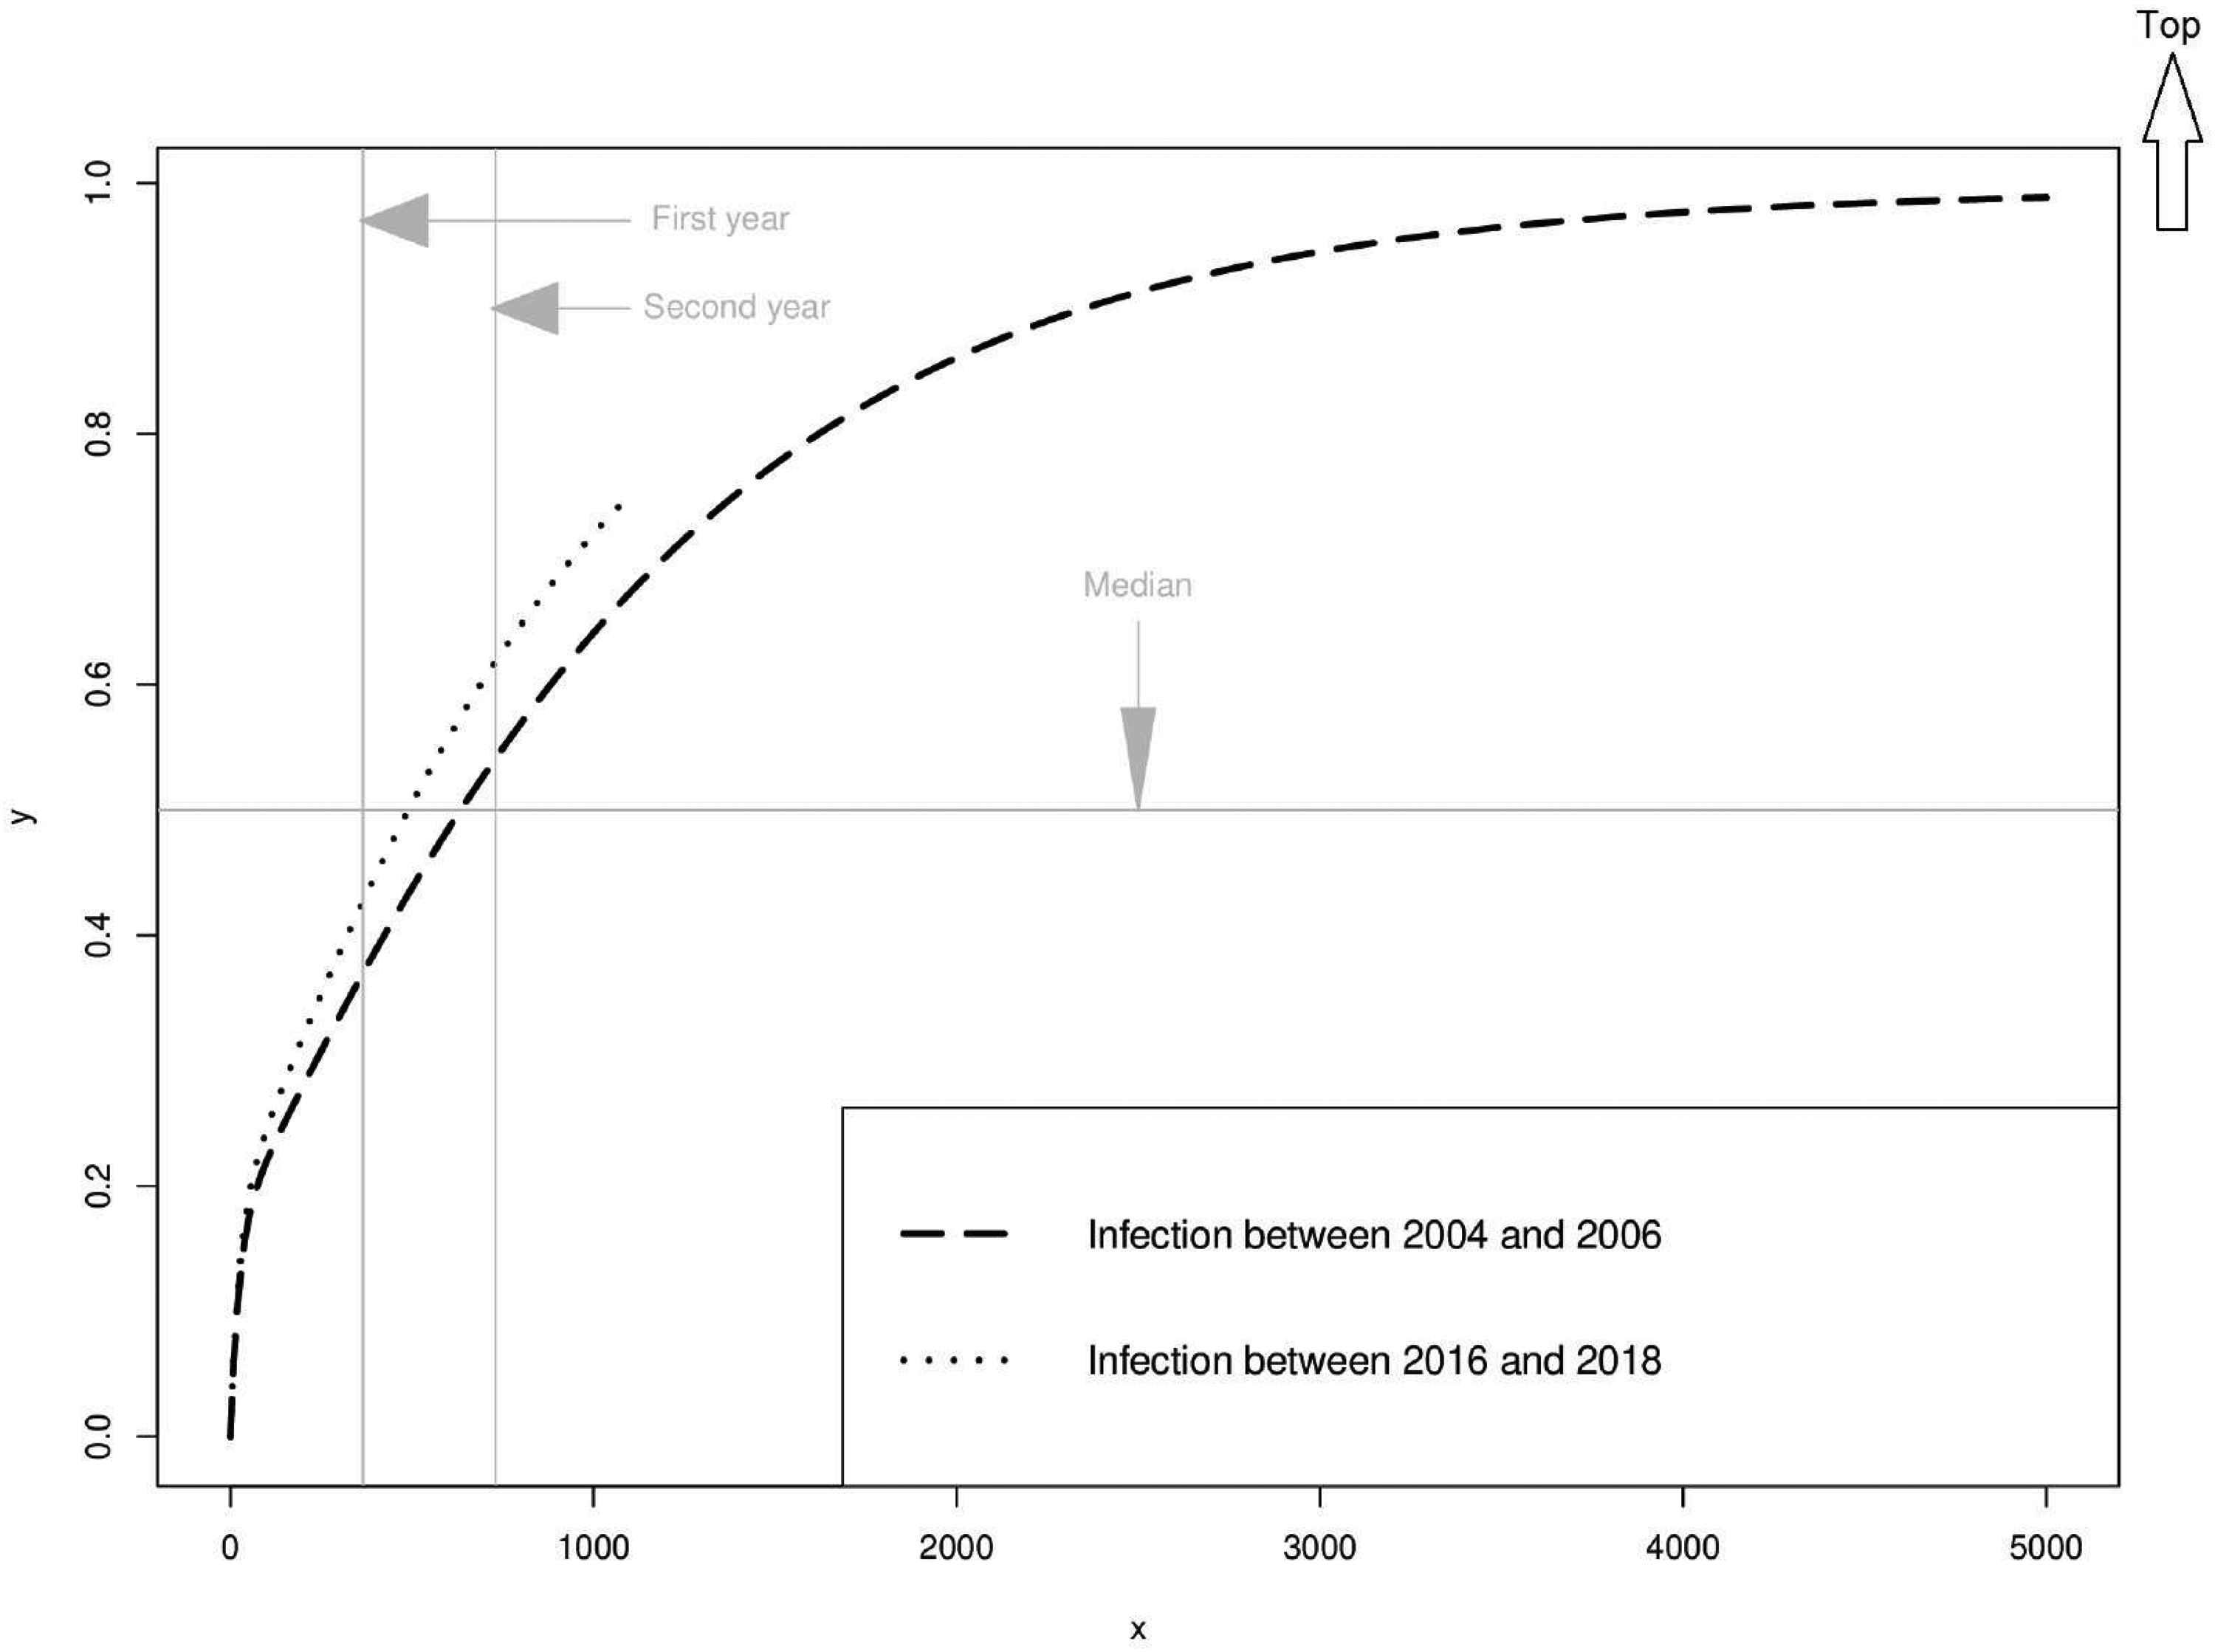
Cumulative distribution function of the delay between infection and diagnosis for an individual infected between 2004 and 2006 (W1) and between 2016 and 2018 (W5) in the MSM population.
The median delay from infection to diagnosis for individuals infected in W1 is 636 [593;685] days, while it is 492 [452;533] days for those infected in the last period W5. The median delay from infection to diagnosis decreased by five months from individuals infected in the first period W1 to those infected in the last period W5. The proportion of people diagnosed at least one year after infection among those infected in the first period W1 was 37% [35.2;38.6] compared to 42.6% [40.5;44.8] for those infected in the last period W5. The proportion of people diagnosed at least one year after infection increased by 5.6% from individuals infected in the first period W1 to those infected in the last period W5. The proportion of people diagnosed at least two years after infection among those infected in the first period W1 was 54% [51.9;56] compared to 61.8% [59.5;64.1] for those infected in the last period W5. The proportion of people diagnosed at least two years after infection increased by 7.8% from individuals infected in the first period W1 to those infected in the last period W5.
5 Discussion
The multi-state Markov model presented in this article is an alternative approach for estimating the HIV incidence and the delay between infection and diagnosis. The model also allows us to estimate an important indicator, namely, the number of individuals living with HIV infection who are unaware of their status. A non-homogeneous Markov model is used to take into account information on the clinical stages at the time of HIV diagnosis and any potential changes in screening behavior over time. In France, different strategies have been implemented in recent years to promote the use of screening. In 2003, the use of condoms was promoted; in 2006, a campaign was launched to change the way in which people look at those with HIV; in 2010, screening was promoted; in 2015, rapid self-testing was implemented; and in 2017, the Haute autorit de sant published new recommendations. 35 These different strategies may have influenced the screening rates over time.
Splines are used to model the HIV incidence curve. They have the advantage of providing a smooth estimation of the infection curve without strong parametric assumptions.36,37
In this study, the method was first illustrated on simulated data and then on data collected through the HIV mandatory notification system for the MSM population in France.
We created a realistic simulation data set that was as close as possible to the HIV mandatory notification data set to evaluate the ability of the model not only to reconstruct the HIV incidence curve, which is the main indicator, but also to estimate the number of individuals in each state and the number of undiagnosed individuals. The classical simulation approach would have been to fix the annual incidence as well as the diagnostic probabilities and then to let the infected individuals propagate in the different states according to the fixed probabilities. However, as we were unable to use the observed incidence data, we had to make an important assumption about the incidence in the simulation. Only the diagnosis data observed in each state at the time of HIV diagnosis could be used in the model to verify whether the model correctly reconstructed the incidence curve and whether it estimated the same probabilities of diagnosis. However, we did not want to use a classical simulation approach. Our idea was to test the model on data as close to reality as possible, while knowing that this choice of simulation involves heavy constraints that are not specific to our model.
The advantages of this method are that it estimates the incidence, the delay between infection and diagnosis, and the number of individuals unaware of their HIV status, while taking into account changes in testing behavior over time, which is not the case for the other methods currently used in France.6,10 A secondary advantage of this method is its reasonable calculation time (48 h for the cross-validation and approximately 3 h for the maximization of the penalized likelihood). The limitation of the model is that the incidence fit is not perfect, probably due to the model complexity and the simulation constraints. One hypothesis regarding the underestimation of HIV incidence is that it probably derives from the constraint that we imposed to generate the diagnosis dates. Indeed, the diagnosis dates are simulated from the infection date according to a distribution that depends on the clinical stage at the time of diagnosis. In our model, we consider that an individual will pass into the different states according to the transition probabilities after diagnosis, which can deprive us of the tail of the distribution, thus underestimating the estimated impact. However, it is important to observe that the trend of the HIV infection curve fits well with the model. In addition, the confidence interval is reduced in the last three years compared to the model of Sommen et al. 9 due to the use of the primary infection stage, which provides more information for recent periods.
The results obtained for the HIV mandatory notification data are consistent with previous estimates of HIV incidence in France using other approaches. Marty et al. 6 estimated an HIV incidence of 2302 [2041;2628] in 2014 in the MSM group compared to our estimation of 2726 [2539;2913] in 2014 in the MSM group.
This method makes it possible to routinely estimate HIV indicators on an annual basis and more frequently, if necessary. This provides a more responsive measure of the dynamics of the HIV epidemic. This approach is not based on strong hypotheses specific to the French HIV data. It can be applied to any country with an HIV notification-based surveillance system without virological data. This work could potentially provide a framework to apply this method to other infectious diseases by changing the natural history of the disease. Information available in the HIV surveillance database that was not used for this study could be used to either improve the estimates or stratify the results according to variables known to be correlated with HIV incidence. In terms of improved estimates, especially for the most recent years, some biological markers are a sign of recent infection. Integrating these markers into the model would correct the underestimation observed for the most recent years. This integration of biological markers could thus improve the likelihood of the model by correcting the observed numbers at the time of diagnosis In terms of stratified analyses, it is well known that the HIV incidence is significantly associated with sex, mode of transmission, geographic origin, and region of residence. 10 The first interesting perspective for future research would therefore be to give the epidemiological indicators based on these variables. Finally, the second interesting perspective for future research would use the simulated database described in this article to compare our method with other methods using clinical stages at diagnosis.
Supplemental Material
sj-pdf-1-smm-10.1177_09622802211032697 - Supplemental material for A multi-state Markov model using notification data to estimate HIV incidence, number of undiagnosed individuals living with HIV, and delay between infection and diagnosis: Illustration in France, 2008–2018
Supplemental material, sj-pdf-1-smm-10.1177_09622802211032697 for A multi-state Markov model using notification data to estimate HIV incidence, number of undiagnosed individuals living with HIV, and delay between infection and diagnosis: Illustration in France, 2008–2018 by Charlotte Castel, Cecile Sommen, Yann Le Strat and Ahmadou Alioum in Statistical Methods in Medical Research
Footnotes
Acknowledgements
We thank our colleagues from the HIV/STI unit who provided insight and expertise, which greatly improved the research. We particularly acknowledge Franoise Cazein for providing us with the data set and for sharing her expertise in interpreting it.
Declaration of conflicting interests
The author(s) declared no potential conflicts of interest with respect to the research, authorship, and/or publication of this article.
Funding
The author(s) disclosed receipt of the following financial support for the research, authorship, and/or publication of this article: This research was fully supported by the French Institute for Public Health Surveillance.
Supplemental Material
Supplemental material is available online.
References
Supplementary Material
Please find the following supplemental material available below.
For Open Access articles published under a Creative Commons License, all supplemental material carries the same license as the article it is associated with.
For non-Open Access articles published, all supplemental material carries a non-exclusive license, and permission requests for re-use of supplemental material or any part of supplemental material shall be sent directly to the copyright owner as specified in the copyright notice associated with the article.