






Abstract
An important goal of personalized medicine is to identify heterogeneity in treatment effects and then use that heterogeneity to target the intervention to those most likely to benefit. Heterogeneity is assessed using the predicted individual treatment effects framework, and a permutation test is proposed to establish if significant heterogeneity is present given the covariates and predictive model or algorithm used for predicted individual treatment effects. We first show evidence for heterogeneity in the effects of treatment across an illustrative example data set. We then use simulations with two different predictive methods (linear regression model and Random Forests) to show that the permutation test has adequate type-I error control. Next, we use an example dataset as the basis for simulations to demonstrate the ability of the permutation test to find heterogeneity in treatment effects for a predicted individual treatment effects estimate as a function of both effect size and sample size. We find that the proposed test has good power for detecting heterogeneity in treatment effects when the heterogeneity was due primarily to a single predictor, or when it was spread across the predictors. Power was found to be greater for predictions from a linear model than from random forests. This non-parametric permutation test can be used to test for significant differences across individuals in predicted individual treatment effects obtained with a given set of covariates using any predictive method with no additional assumptions.
Keywords
1 Introduction
The key premise of personalized medicine is the identification and targeting of individuals most likely to benefit from a given intervention, 1 with the goal of improving health care outcomes and decreasing costs.1,2 Much recent research has focused on statistical approaches for identifying a small number of subgroups of individuals who differ in their response to interventions,3–13 while a smaller body of research has focused on predicting intervention responses at an individual level.4,14–19 For situations in which treatment response is related to a set of covariates, which is not a small number of clearly defined subgroups, individual-level predictions are particularly appropriate. Even if most covariates were categorical, with high dimensional data and finite samples, individual-level predictions may contain more information about heterogeneity in treatment effects than is contained in subgroups. This study focuses on the use of predicted individual treatment effects (PITEs),20,21 which builds on the potential outcomes framework22,23 and results in predictions of the intervention response for individual patients.
The PITE approach utilizes data from a randomized clinical trial with a potentially large number of baseline covariates to generate predictions from a model or algorithm, which are then used in estimating PITEs. The same model or algorithm can then be used to generate treatment effect estimates for new subjects not used in training. Once predictive algorithms have been trained, the next question becomes whether the data reveal more variability in individual predictions than would be expected due to chance. In other words, ‘Do individuals differ in the predicted effects of the intervention?’ is a question that should be answered before a given set of PITE estimates are used. This ensures that this personalized method is only used when there are individual differences. This paper proposes a permutation test that can help to answer this question. An advantage of the proposed method is that it can be generally applied to any method for estimating predictions for the treated group and the control group. While methods exist for estimating the significance of heterogeneity in treatment effects using kernel regression and instrumental variable regression24,25 and for estimating whether subgroups identified by treatment response improve on group means, 26 the proposed permutation test provides flexibility in choosing the estimator and can use machine learning to estimate potential outcomes while retaining frequentist properties. The next section describes the PITE approach in general terms before providing details of our proposed permutation test. In Section 3, we use the PITE framework and the proposed test to evaluate heterogeneity in the effects of interventions for an example dataset targeting Amyotrophic lateral sclerosis (ALS); Section 4 uses this test on simulated data to show the type I error rates of the PITE permutation test using two different predictive models with and without main effects of covariates. In Section 5, we use the ALS example as the basis for simulations that demonstrate the ability of the permutation test to find heterogeneity in treatment effects as a function of both effect size and sample size. Section 6 concludes with a discussion of results.
2 Permutation test for PITE
Potential outcomes23,27,28 provide a powerful way for understanding causal effects. In the context of a two-arm randomized trial, before treatment assignment, each individual has a potential outcome under both treatment conditions, which is the outcome that they would obtain if assigned to treatment (
The “fundamental problem of causal inference”
29
is that this effect is never observed because once an individual is assigned to a condition, the outcome can only be realized for that condition. The PITE framework proposes that we can use a predictive function to capture some proportion of the potential outcomes
1
The PITE, therefore, is an estimate of the treatment effect for a particular individual given the covariates and predictive model or algorithm used. The PITE is equal to the potential outcomes definition of an individual causal effect only in the unlikely, and unknowable, scenario that the random effects for both conditions are equal to zero. It should be noted that even if the average treatment effect equals zero, it is still possible that there are some individuals who would be expected to do better given the treatment than control and others who would be expected to do better under control. Therefore, in this paper, we exclude the expected value of the PITE from the test, as this value is an estimate of the average treatment effect and not evidence of individual differences. Because the PITE is defined very generally as the difference between two predictions, it can be used with any predictive model that provides outcome prediction on a patient-level (e.g. the General Linear Model, Random Forests, 30 Bayesian additive regression trees, 31 neural networks 32 ). In addition, PITE can be used for predicting treatment effects given information on covariates for patients who are not originally part of the clinical trial.
The presence of individual differences has implications for how a treatment would be implemented: if there are individual differences in the treatment effect, it suggests that it may be worthwhile to collect and use individual-level data to help guide treatment decisions. Therefore, we propose a permutation test to evaluate whether there are individual differences in PITEs. This paper demonstrates the use of a permutation test with two different predictive approaches, Random Forests 30 and linear regression.
Following equation (2), we begin by using data from those randomized to treatment to estimate
Once
We propose a permutation test23,36–39 be used to test for individual differences in PITEs. Our test focuses on the standard deviation (SD) of the PITEs, because this estimate quantifies individual differences in the predicted treatment effects. More specifically, we test the hypothesis:
In other words, the null hypothesis is that there are no individual differences in the PITEs obtained. To test this hypothesis, the permutation test first approximates the sampling distribution of PITEs’ SDs under the null hypothesis, i.e. when the set of covariates in the PITE prediction models have the same effect on the outcome across treatment groups, the covariates may be prognostic, but not predictive. This is done by permuting treatment assignment. The observed SD of the PITEs from the data is compared against the resulting distribution.
The following algorithm describes the procedure in detail.
Estimate PITE models and compute
Estimate the standard deviation of the estimated PITEs as
Randomly permute the treatment assignment of all patients in the study. Estimate the PITE model and compute
Estimate the standard deviation,
Repeat steps 3 through 5, P times. Obtain the p-value, pP, associated with the above hypothesis as
Reject the above hypothesis at level α if pP < α.
The proposed PITE permutation test is intended to be conducted once per dataset and does not inherently involve multiple comparisons or multiple testing, which requires strong assumptions for permutation tests. 40
For each of 1000 replications in this study, 1000 permutations were used in our subsequent evaluations. Following binomial arguments, this yields a .007% uncertainty in estimated p-values of which the true value should be 5%.
3 Demonstration of the permutation test: an intervention for individuals with ALS
Amyotrophic Lateral Sclerosis (ALS, also known as Motor Neuron Disease) is a neurodegenerative disorder that affects motor neurons in the brain and spinal cord. We use the Pooled Resource Open-Access ALS Clinical Trials database (PRO-ACT), 41 which is publicly available at their website: http://nctu.partners.org/ProACT. In 2011, Prize4Life, in collaboration with the Northeast ALS Consortium formed the PRO-ACT Consortium, which makes data from 23 randomized trials of the drug Riluzole available. We note that one other study has used this data to evaluate a personalized approach based on the identification of subgroups of responders,26,42 finding evidence for significant individual differences in response to previous Riluzole use.
The advantage of this dataset is that it pools data from many randomized trials of Riluzole and thus has the sample size needed to test for heterogeneity in treatment effects. However, to maintain confidentiality, the data does not include a study identifier, and thus it is impossible to model study-specific effects. This is problematic because it is possible that systematic differences in subject populations as well as outcomes between studies exist, which could themselves result in the identification of heterogeneity in treatment effects. Thus, we use the PRO-ACT dataset as an illustrative example for testing the proposed permutation test without making statements about the implication of the results for ALS treatment. Conclusions about heterogeneity in the effect of ALS treatment would be best supported by separate tests for each clinical trial, followed up with an integration of results across trials.
After estimating PITEs using a linear model with the PRO-ACT data, we then use the permutation test to examine heterogeneity in individual treatment effects. PRO-ACT includes information from more than 8500 patients with ALS. Each of them participated in a clinical trial and received either a placebo or treatment. Following Küffner et al., 41 we used the slope of the ALSFRS score from a repeated measures model for each patient as the primary outcome, and the 2910 patients (1766 in experimental treatments and 1144 in control ones) who had complete data for 17 covariates, treatment condition, and the outcome.
To avoid overfitting the data, we advocate either choosing both the predictive method and the covariates for the PITEs a priori, or adjusting for the variable selection process. 43 Here, we demonstrate the permutation test based on a linear model that included seven (out of 17) covariates found to have significant interactions with treatment. In its simplest form, with a linear model, PITE captures baseline by treatment interactions; thus, we used this as the criteria for variable selection. PITEs, however, are much more general than these interactions as they capture the joint effect of many predictors and, depending on the predictive method used, implicitly capture non-linear and higher-order interactions. The seven covariates used for obtaining PITE estimates were respiratory rate, systolic blood pressure, age, gender, limb only (coded 1 if the onset location was only in the limb), use of Riluzole, and delayed medication (coded 1 if the time duration between the first time the patient was assessed during the trial and the time medication was first given was more than a year, zero otherwise).
Results
Tables 5 and 6 of Appendix 1 showed the descriptive statistics of the seven covariates that were found to have significant interactions with treatment. Table 4, Appendix 1 showed the linear regression model’s coefficients and standard errors for both treatment and control conditions with all 17 covariates in the PRO-ACT dataset. The results for the control group can be considered to be the main effects, in the absence of treatment, from the linear model and the differences between the treatment and control groups are the linear interactions that contribute to predicted individual differences in treatment effects. Figure 1 includes the permutation distribution of SDs of PITEs based on the procedure outlined above together with the observed SD from the PRO-ACT dataset, which at .127 is on the upper tail of this distribution. The p-value for the permutation test was .005, providing evidence for individual-level treatment heterogeneity based on the linear model and the seven covariates included.

Permutation distribution of PITEs’ SDs and the observed PITE’s SD in the ALS study. ALS: Amyotrophic Lateral Sclerosis; PITE: predicted individual treatment effects.
4 Type I error rates for the permutation test
The promise of this permutation test is that one can use any conventional or machine learning function and still get correct frequency properties. In this section, we investigate if this promise is fulfilled. We begin our evaluation of the proposed test by examining the type I error rate of the permutation test under the null hypothesis, i.e., that the treatment effect is the same for all individuals. Simulations were conducted with the true PITE for each individual being equal to the average treatment effect, meaning that covariates had no impact on the PITE. When the type I error is .05, the p-value obtained from step 7, above, should be below .05 in only 5% of the simulations.
In this phase of our investigation, PITE was estimated with sample sizes of 100, 250, 500, 1000, and 5000 using both linear regression (via the lm function in R) and Random Forests (via the randomForestSRC package in R, 44 tuned to have a node depth of 10). To make the simulation more realistic, we included five prognostic covariates that had the same effects across the treatment and control conditions. These included three normally distributed covariates with means of 0 and variances of 1, and two binary variables, each with a 0.5 probability of endorsing 1 or 0. The covariate effects of 0.406, −0.239, 0.703, −0.090, and −0.299, respectively, were identical across the treatment and the control groups – implying that they did not predict differential responses to the treatment – and were included in all analyses. To show type I error rates when many additional variables were included in the predictive model, we ran analyses with varying numbers of continuous variables with standard normal distribution and binary variables with binomial distributions with a probability of success of .5. They were generated to be unrelated to the outcome, hereafter called ‘nuisance variables.’ Because sample size limits the number of nuisance variables that can be included in a linear regression model, we examined an increased number of nuisance variables with larger samples. Analyses also varied the true treatment effect to show that the PITE, as described above, does not capture the main effects of treatment. For the Random Forest model, we used 500 trees and 10 random split points to split a node.
Results
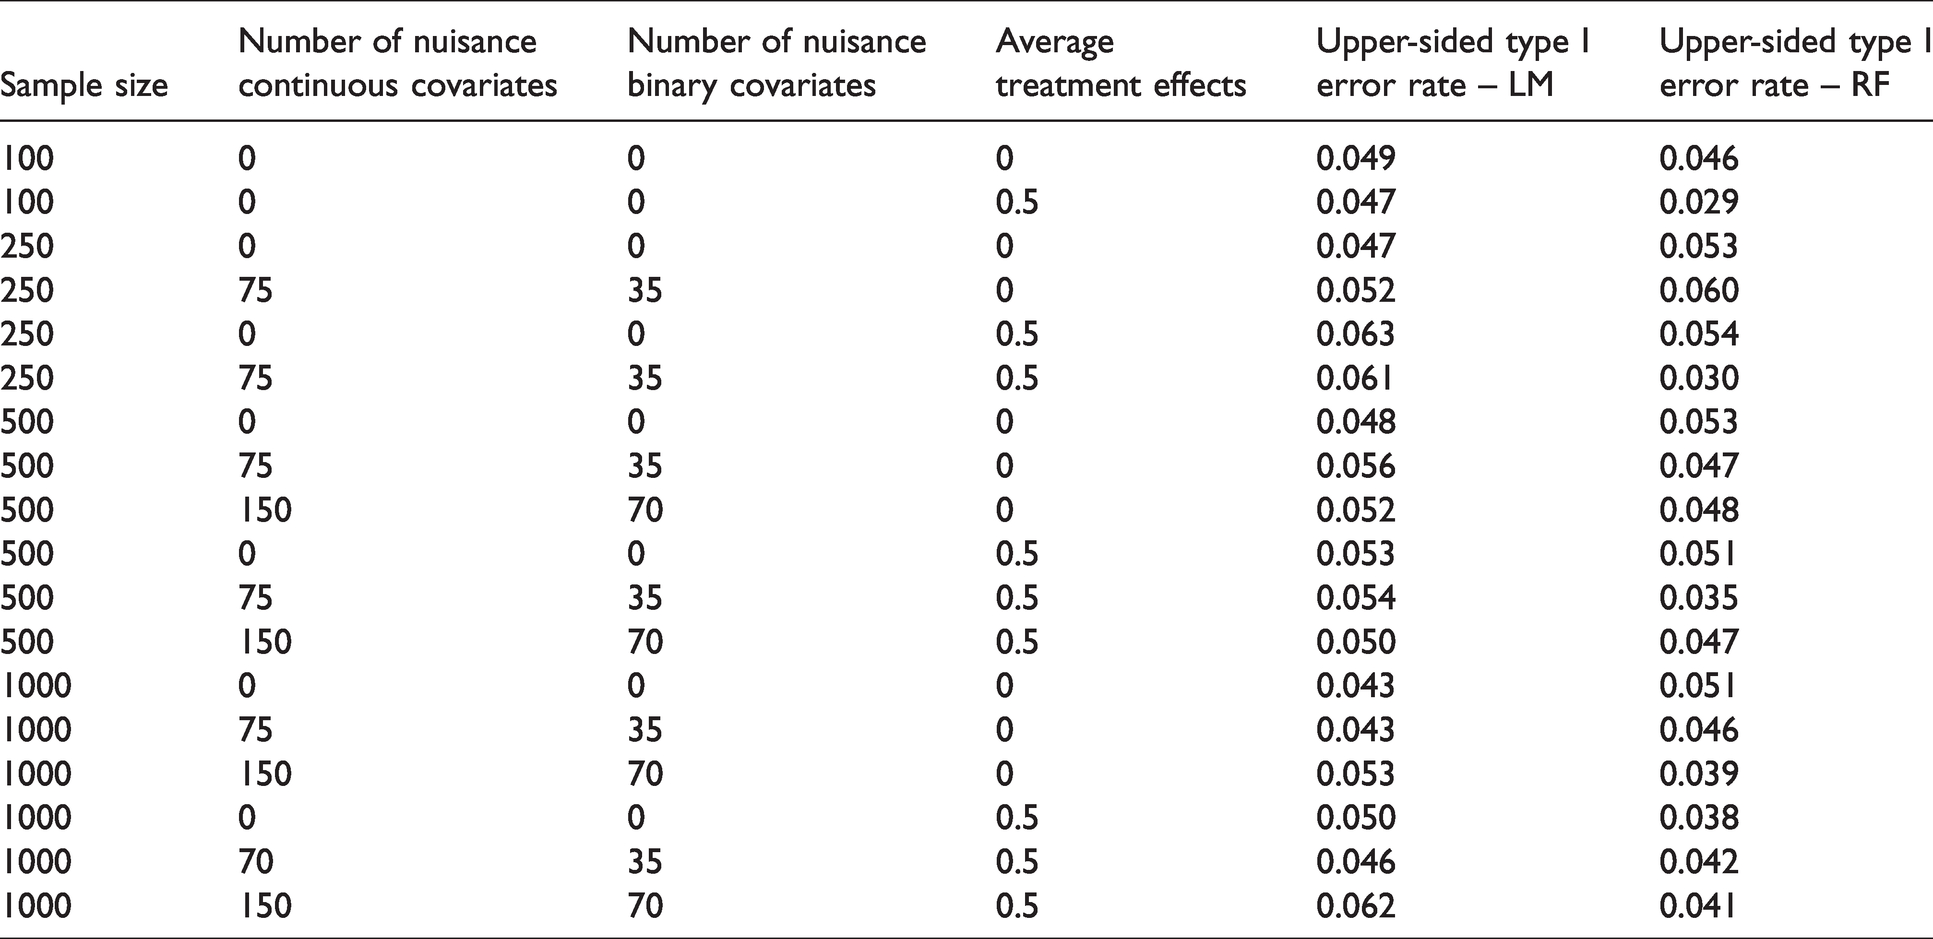
The results (see Table 1) established that across all conditions, the permutation test rejected the null hypothesis between 4.7% and 6.3% of the time with the linear regression model, and 2.9% to 6.3% of the time with Random Forests. The estimated type I errors appear to be mostly within simulation error (±0.007) with no discernable pattern detectable in relation to the number of nuisance variables, main effect, or total sample size.
Type 1 error rates for the PITE permutation test, the linear regression model and Random Forests.
5 Power of the permutation test
Next, we used the ALS results in section 3 as the basis for simulations examining some of the factors that influence the permutation test’s statistical power. In the data generation model for the power simulations, the parameters from the predictive linear model using the ALS example (shown in Table 4, Appendix 1) were used as the starting point. To mimic the real-world scenario, we included only the seven covariates that were found to have significant interactions with treatment in the simulation. The first three of these, respiratory rate, systolic blood pressure, and age, were generated as normally distributed random variables with means and SDs equal to the corresponding values estimated from the PRO-ACT dataset (details provided in Table 5). Similarly, the remaining four binary random variables, gender, limb only, use of Riluzole, and Delayed Medication, were generated as binomial with the same probabilities as observed (in Table 6). The covariance matrix was generated by mimicking that of the ALS data. The outcome was generated with the effect size scaled to mimic the ALS example with sample sizes of 1000 (to examine if the effects could have been found with a smaller sample) and 3000 (as in the ALS example), with equal size for the treatment and placebo groups. To assess the impact of adding further covariates when fitting PITE, we evaluated statistical power with 0, 20, 50, or 100 nuisance variables, all of which were generated either from standard normal distributions or binomial distributions with a probability of success of .5. The nuisance variables were included when estimating PITEs despite not being related to the outcome.
A challenge in estimating power was that measures of effect size for PITE have not been previously defined. In this study, we used the average PITE estimate divided by the pooled SD of the outcome as follows:
This resulted in an estimated effect size of 0.19 for the PITEs in the ALS example, meaning that the average person was 0.19 SD from the average effect size. When estimating power, data were generated with effect sizes of either 0.19 or 0.38, with the latter included to examine the method’s ability to identify a larger effect.
We also examined the permutation test’s power to detect heterogeneity that is mostly due to a single variable as well as when heterogeneity was spread across multiple variables that each contribute a small amount. Power simulations were run for six conditions, which differed from one another in the relative contributions of the seven predictors. Specifically, these six conditions were: (1) the total heterogeneous effect is evenly spread across all seven covariates (“Spread”); (2) 90% of the total heterogeneous effect is due to the first continuous variable, and 10% to the other six covariates (“90/10 Cont.”); (3) as 90/10 Cont., but with 75%/25% split between the first continuous variable and the other six covariates (“75/25 Cont.”); (4) as above, but with a 50%/50% split (“50/50 Cont.”); (5) as above, but with a 25%/75% split (“25/75 Cont.”); and (6) 90% of the total heterogeneous effect is due to the first binary variable, and 10% to the other six covariates (“90/10 Bin.”). Thus, the power of PITE prediction was examined in a total of 96 conditions, i.e., in 2 (sample sizes)
Once data were generated, both the linear model and Random Forests were run for each dataset and under each condition using the procedures described above. For the Random Forest model, the depth was restricted to 10. The percentage of times that the permutation test was significant for each condition was recorded as the power estimate.
Results
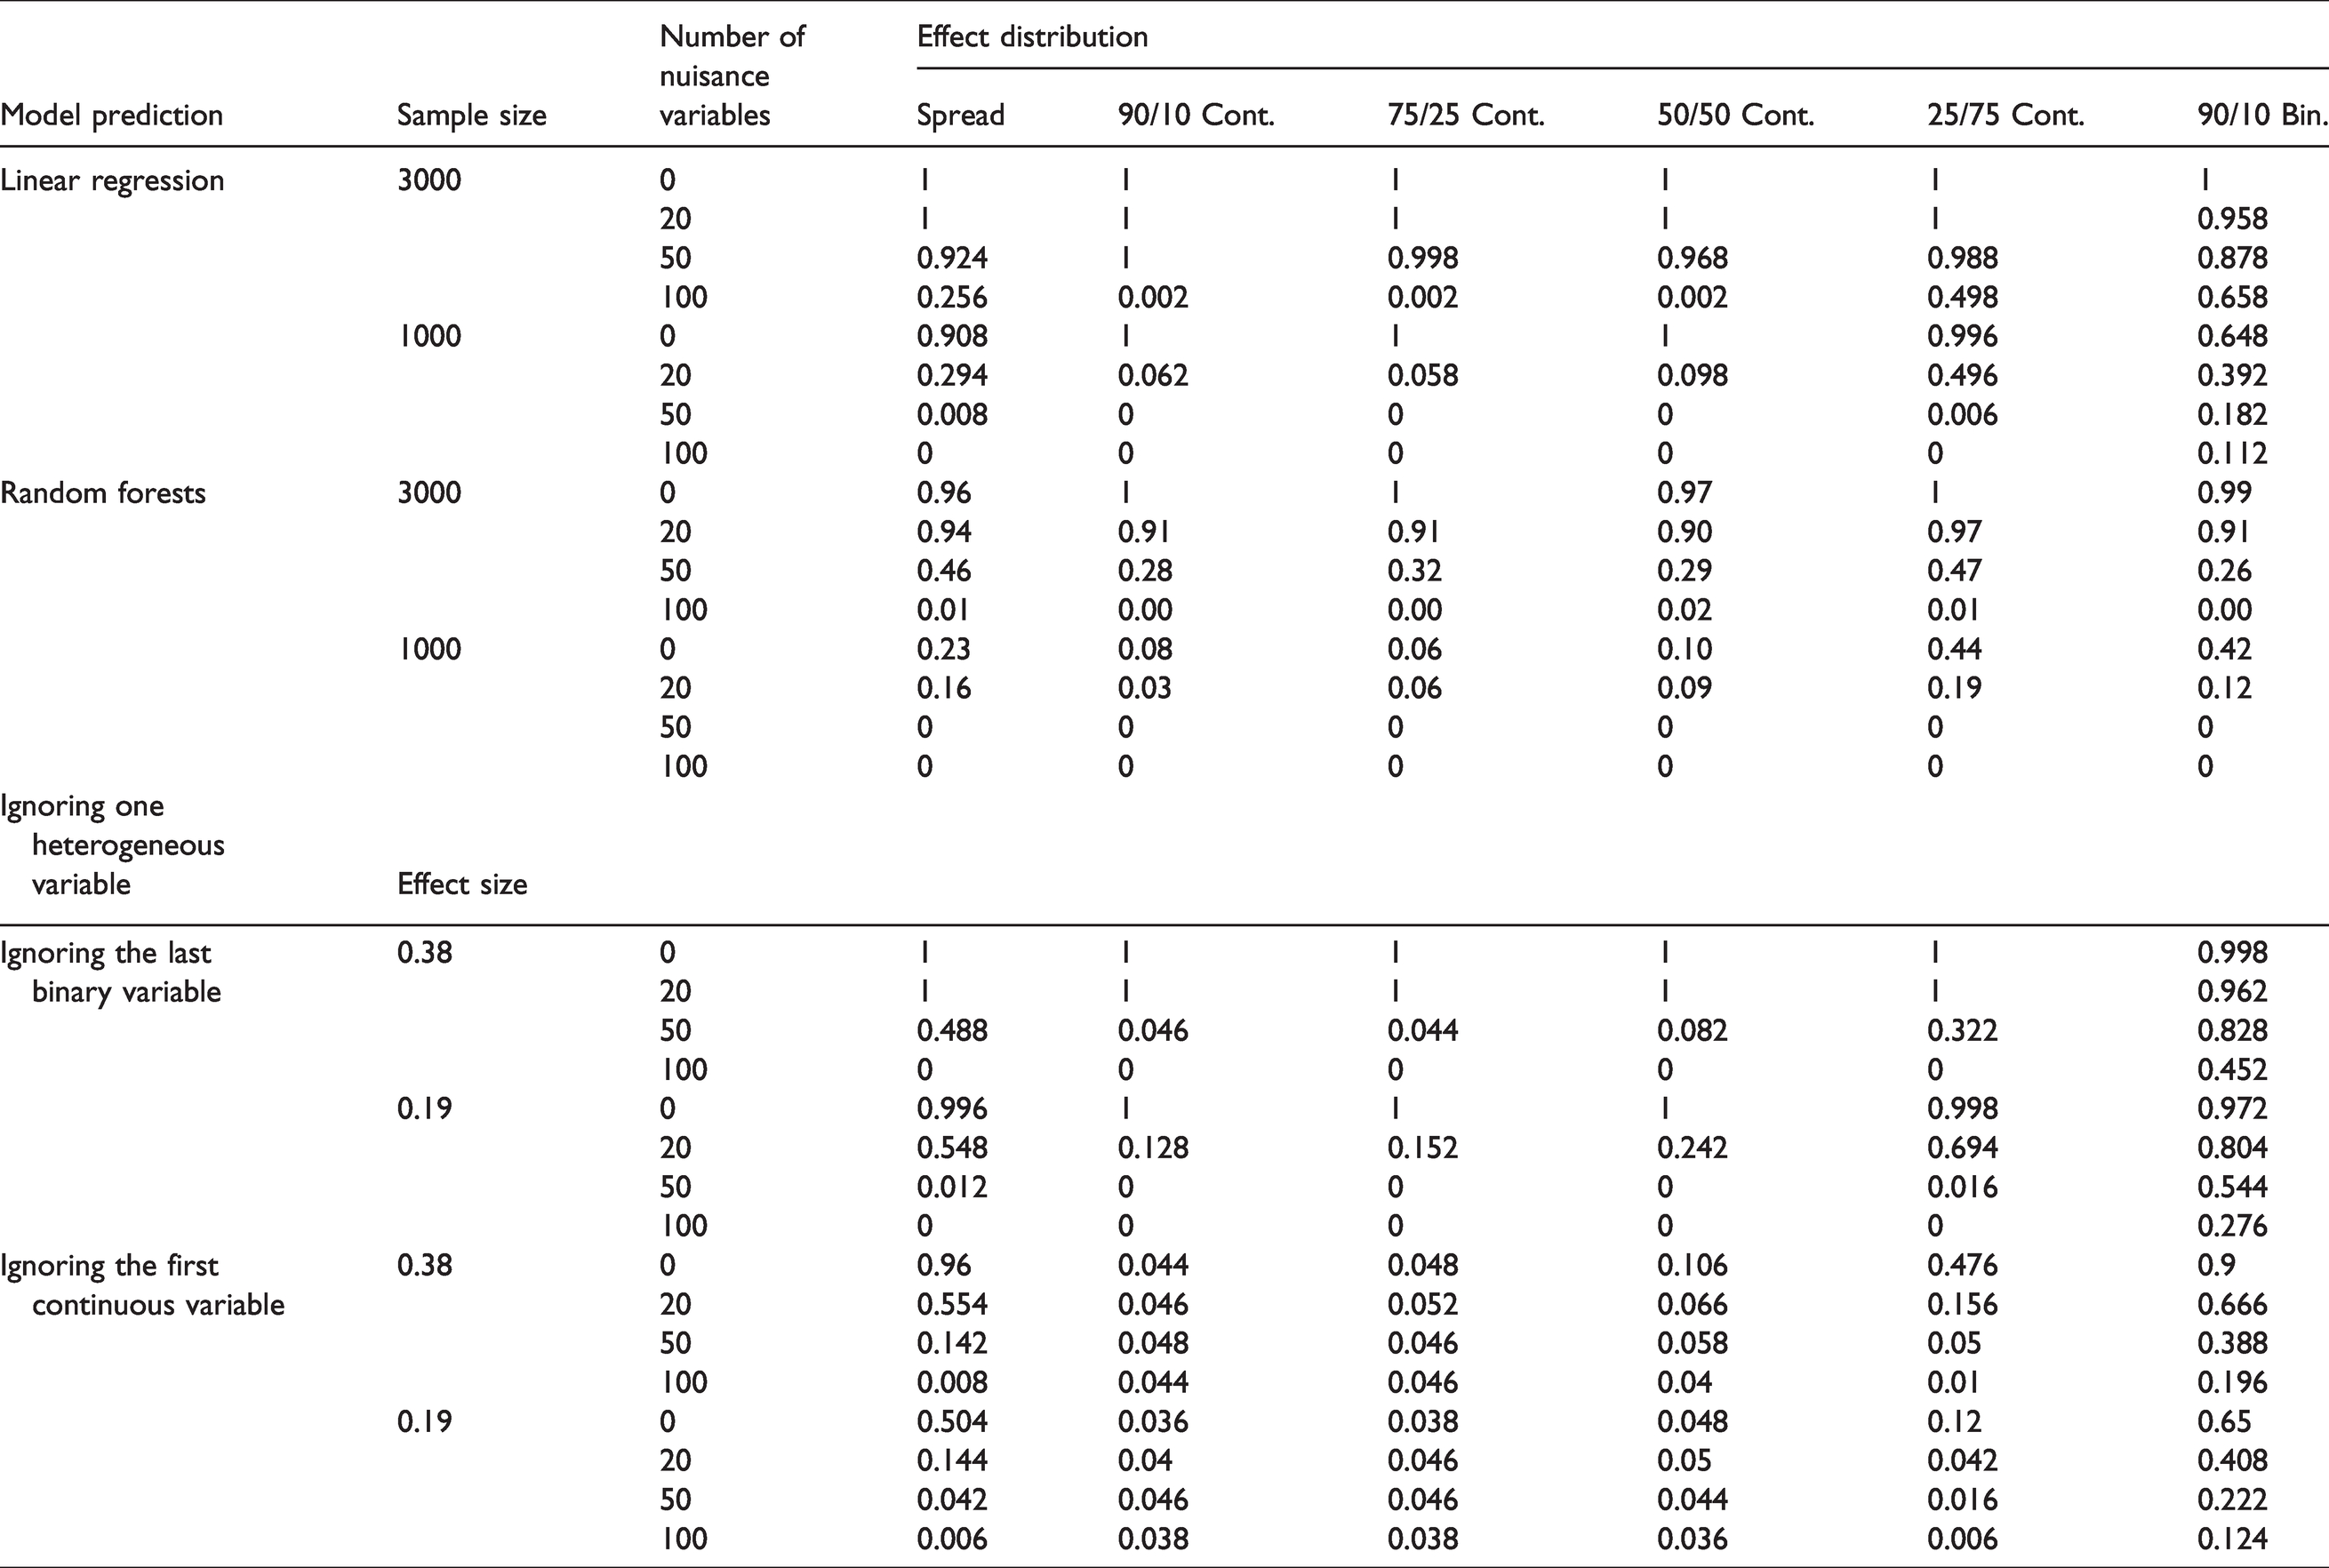
Power for each of the 96 conditions was estimated as the proportion of 1000 simulations for which the permutation test was significant. The results obtained with an effect size of 0.19 are presented in Table 2, and those obtained with an effect size of 0.38 in Table 3. As expected, power increased both when sample size increased and when effect size increased. Our results also indicated that increasing the number of nuisance variables decreased power substantially, highlighting the importance of selecting meaningful covariates. With the ALS observed effect size and sample size, the predictive (post-hoc) power obtained from the linear regression model was adequate (>.80) when there were 50 nuisance variables, but not when there were 100. When using Random Forests for predictions, on the other hand, power was adequate with 20 nuisance variables at the same sample size. However, with a sample size of 1000, the linear regression model’s power was poor even with 20 nuisance variables and would be inadequate with Random Forests using the same tuning parameters.
Power to detect heterogeneity in treatment effects, based on the linear regression model and the Random Forests predictions from the ALS example with an effect size of 0.19.
Power to detect heterogeneity in treatment effects, based on the linear regression model and the Random Forests predictions from the ALS example with an effect size of 0.38.
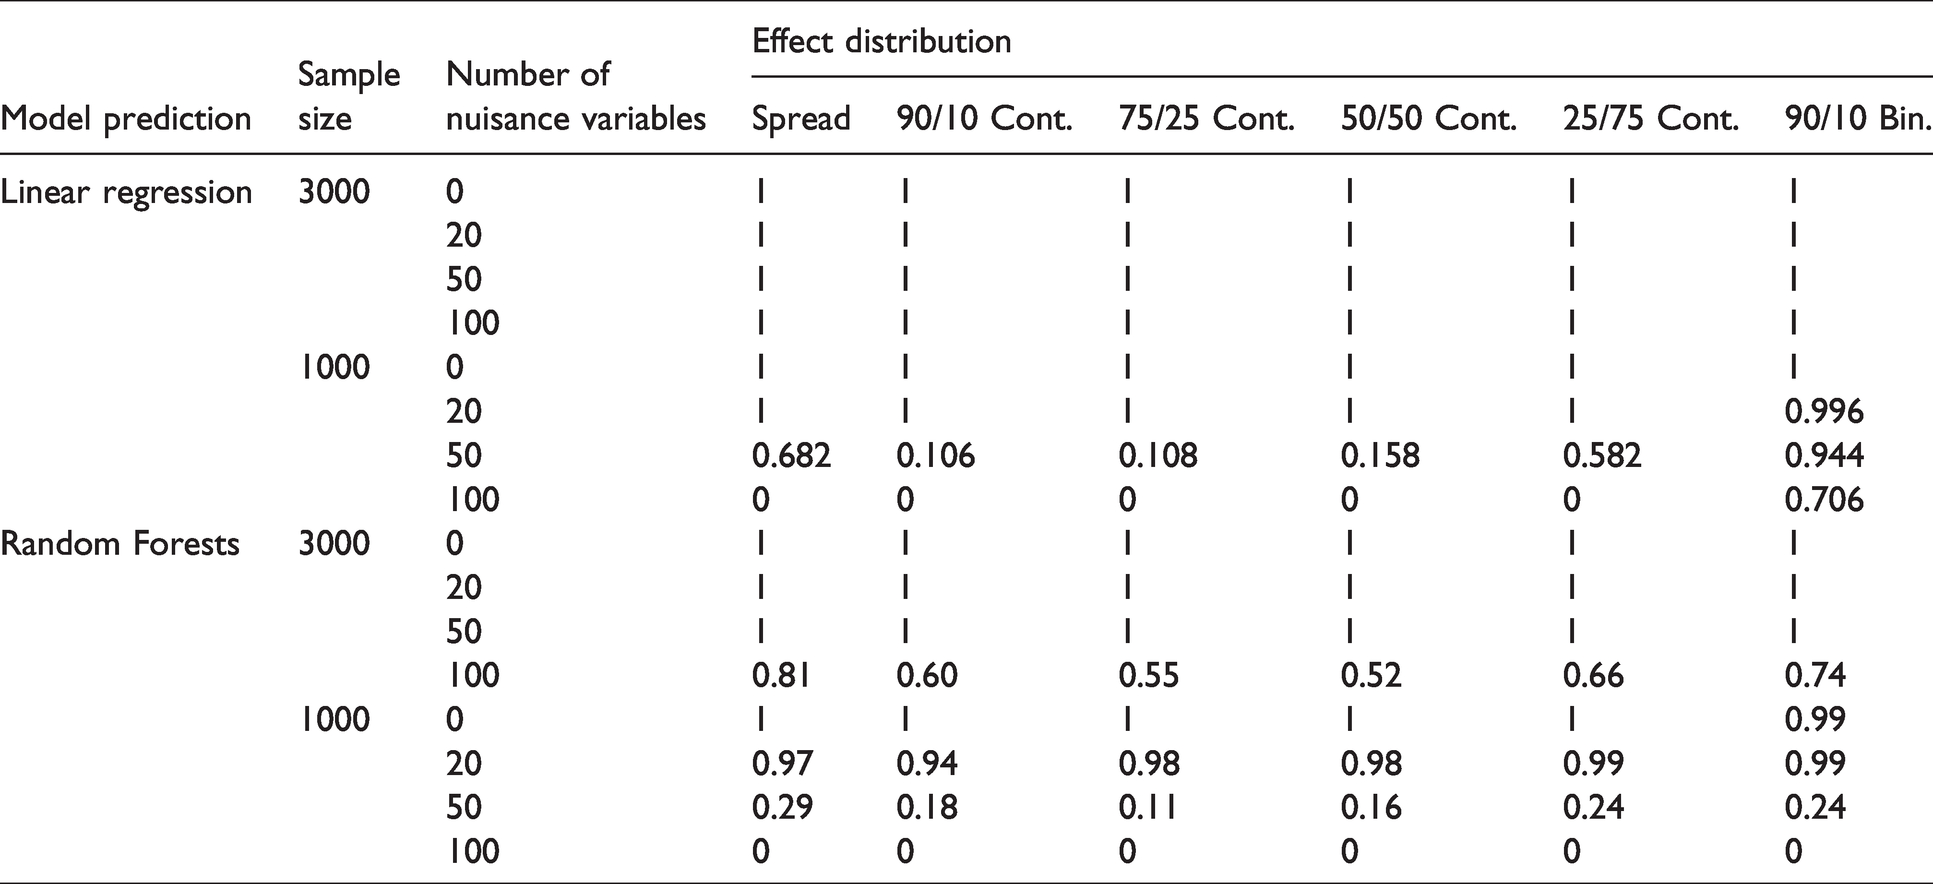
With an effect size twice as great as observed, the power of the permutation test using linear regression model was low only when the sample size was 1000, and there were 50 or 100 nuisance variables, but Random Forests’ power was marginal even with a sample size of 3000 if there were 100 nuisance variables. We note that power estimates for Random Forests were expected to be lower than those for the linear regression model given that the data were simulated using the latter method and that no higher-order interactions or non-linear effects were included.
The other factor that we varied across the simulations was how the effect of the covariates on heterogeneity in treatment effects was spread out. The reason for this is to show a core advantage of PITE, which is its ability to detect many small effects that add up to something meaningful rather than just one large effect. When looking across the six different spreads of the PITE effect, it was striking that when there was adequate power for one of them, there was usually adequate power for all. The only two exceptions to this were (1) when the effect was carried primarily by one binary variable (i.e., there are only two different kinds of responses), in which case, power was higher than for the other conditions; and (2) for Random Forests the power is lower for the binary predictor. The key result here is that, in the ALS example, power was about the same regardless of whether the heterogeneity in treatment effects is attributed primarily to one of the seven important variables or when it is spread out across all 7.
One apparently inconsistent finding in these results was that in some conditions, power was less than 5%, the type I error rate. The reason for this is that any random variable will cause variability in the PITE to a certain extent. In some cases, with many nuisance variables, the effects of the predictors we were simulating were smaller than effects due to chance, resulting in a lower probability of finding heterogeneity in the effects of the predictor than would have been expected due to chance. Importantly, this implies that adding more predictors will increase the noise in PITE estimates and result in larger heterogeneity being estimated.
Finally, in order to illustrate that PITEs do not capture heterogeneity due to variables not included in the predictive models, we reran several sets of simulations, dropping the predictor accounting for most of the individual differences. Looking at the linear model with a sample size of 1000 and effect size of .38, we found that when the continuous variable accounting for the most heterogeneity was dropped, power went from 1, .94, .18, and 0 across levels of nuisance variables to under .05 for all conditions. When the binary indicator accounting for most of the variance was dropped, power went from 1, 1, .94, and .71 across levels of nuisance variables to 1, .96, .83, and .45. When even one important variable is left out of the PITE predictive model, the ability of the permutation test to find heterogeneity in treatment effects is reduced.
6 Discussion
For PITEs to be useful for quantifying individual differences in the effects of an intervention, it is necessary to have a test that can show that there are differences larger than chance between individuals. The proposed permutation test is therefore very important. Under the 96 conditions we examined, the test was shown to have appropriate, nominal type I error rates, practical utility in an applied example, and adequate power given a moderately sized sample and 20–50 nuisance covariates. The effect size observed in our applied example was fairly small (the average individual was 0.19 SD from the average treatment effect). However, if the effect size had been doubled, then the permutation test would have had adequate power even with 100 nuisance covariates. The permutation test also demonstrated an ability to detect heterogeneity in treatment effects due primarily to a single predictor, or when it was spread across the seven predictors that had an impact in the ALS example. It also worked reasonably well when either the linear regression model or Random Forests were used as the predictive method. These are important because in practice, it means the test can be used with a large number of covariates when heterogeneity is due to just a small set of covariates, and it can be used with any predictive method while making no assumptions beyond those of that method. A final set of simulations illustrated that, while PITEs are inspired by potential outcomes, neither PITEs nor the permutation test allow us to detect the true individual-level causal effect. Instead, these methods detect only those individual differences which arise from the variables included in obtaining the predictions, and the null hypothesis for the permutation test is that there are no individual differences for a given predictive method and set of covariates.
The permutation test was also found to have an unexpected benefit in that the variance of the PITEs across permuted datasets provides an estimate of the variability in PITEs that, due to chance, can be attributed to the number and distribution of the covariates used in a given application and to the model or algorithm used to obtain predictions. Thus, this test can help assess the amount of noise in PITEs for a given number of covariates and predictive methods.
We noted that for Random Forests with nuisance variables, the choice of tuning parameters made a meaningful difference in the results. If there is heterogeneity in treatment effects or added nuisance variables, the Random Forests requires more tuning or corrections for bias, irrespective of sample size. For instance, allowing deep trees led to high levels of overfitting, with many nuisance variables being identified as important. In this case, we chose a maximum node depth of 10 to reduce overfitting. While how to appropriately tune Random Forests when estimating PITEs is beyond the scope of this study, it is a non-trivial issue which merits further research.
Concerning the ALS example with the PRO-ACT dataset,26,42 PITEs used with the permutation test suggest the possibility of individual differences in the effects of treatment. Because this dataset consists of information pooled across a large number of clinical trials without an identifier for the clinical trial, we would like to stress that suggesting the heterogenetiy in practice is not our original intention. In practice, establishing heterogeneity in treatment effects with PITE requires a known sample of participants who were randomized to receive one of at least two treatment arms. In this case, since there are multiple samples each with different and unknown treatment arms, the primary utility of the data is to illustrate the PITE permutation test.
Other limitations of this study are that we examined the proposed PITE permutation test using predictions from only the linear regression model and Random Forests (with one set of tuning parameters), and under a set of conditions that were designed to clarify our understanding of its power via an applied example. In principle, we see no reason why this test should not work well with any method chosen but cannot claim that the present paper has established this. We should also note that, in the ALS example, the permutation test required a relatively large sample to attain adequate power. While the observed effect size was small in this case, even with a larger effect, the test required an N of 3000 if many covariates were included. Because the outcome of interest is individual predictions, we believe that PITEs will generally require substantial sample sizes, unless the effects are very large. Nevertheless, as a very flexible test for the presence of individual differences, this permutation test is an important tool for personalized medicine.
Footnotes
Authors’ note
Data used in the preparation of this article were obtained from the Pooled Resource Open-Access ALS Clinical Trials (PRO-ACT) Database. As such, the following organizations and individuals within the PRO-ACT Consortium contributed to the design and implementation of the PRO-ACT Database and/or provided data, but did not participate in the analysis of the data or the writing of this report:
Neurological Clinical Research Institute, MGH Northeast ALS Consortium Novartis Prize4Life Regeneron Pharmaceuticals, Inc. Sanofi Teva Pharmaceutical Industries, Ltd.
Declaration of conflicting interests
The author(s) declared no potential conflicts of interest with respect to the research, authorship, and/or publication of this article.
Funding
The author(s) disclosed receipt of the following financial support for the research, authorship, and/or publication of this article: This paper was partially supported by grant # MR/L010658/1 awarded to Thomas Jaki by the United Kingdom Medical Research Council and by grant # 1R01HD054736 awarded to M. Lee Van Horn by the National Institute of Child Health and Human Development.
