
Abstract
The amount of data collected from patients involved in clinical trials is continuously growing. All baseline patient characteristics are potential covariates that could be used to improve clinical trial analysis and power. However, the limited number of patients in phases I and II studies restricts the possible number of covariates included in the analyses. In this paper, we investigate the cost/benefit ratio of including covariates in the analysis of clinical trials with a continuous outcome. Within this context, we address the long-running question “What is the optimum number of covariates to include in a clinical trial?” To further improve the benefit/cost ratio of covariates, historical data can be leveraged to pre-specify the covariate weights, which can be viewed as the definition of a new composite covariate. Here we analyze the use of a composite covariate to improve the estimated treatment effect in small clinical trials. A composite covariate limits the loss of degrees of freedom and the risk of overfitting.
Introduction
The amount of information collected from patients involved in clinical trials is steadily growing, in particular with the advent of genomics and proteomics. All collected baseline characteristics are potential covariates linked with the patient’s outcome. Some covariates may not always be of primary interest in a randomized controlled trial (RCT), however they could be used to explain the variability of the patients’ response and improve the study power when assessing treatment efficacy.
The adjustment for baseline covariates to improve the efficiency of randomized clinical trial analysis can be done in many ways. One of the most traditional methods is to include covariates in a general regression equation of the form
Including covariates associated with the study outcome could greatly improve the efficiency and power of the trial1,2. They could correct for potential bias coming from baseline imbalances between the study arms. However, adding covariates in the analysis comes with a cost in degrees of freedom. As such, regression adjustment should be seen as a trade-off between explained variance and loss of degrees of freedom. Clearly, for small trials, the number of covariates to be included in the model must be limited. There are many rules-of-thumb on the number of covariates that can be included in an analysis3,4. A common one is to have 10 subjects per variable in the model. The problem with this heuristic rule and other approaches is the variance explained by the covariates which is not taken into account.
In this paper, we intend to investigate the benefit/cost ratio of including covariates in the analysis of RCTs using a continuous outcome. Instead of focusing on the estimation of the treatment effect, we search to minimize its sampling variance, i.e., to increase its statistical precision, while considering the covariates as nuisance factors. Within this context, we address the long-running question “What is the optimum number of covariates to include in a clinical trial?”
To improve the benefit/cost ratio of covariates, their weights in the model could be estimated from historical data accumulated from outside sources. In cancer research, the treatment effect is often adjusted for a single baseline prognostic index. For example, the breast cancer Nottingham prognostic index (NPI) incorporates the size and grade of the tumor as well as the nodal status 5 . Adjusting for all three parameters would explain more variance but at an additional cost in terms of degrees of freedom5–8. There are numerous examples of this kind. Here, we investigate the benefits of replacing individual covariates by a composite covariate fitted on external data to optimize the precision of the treatment effect estimation.
The composite covariate approach was motivated by the recent advances in placebo effect characterization9–11. In chronic pain, the magnitude and the variability of the placebo response can obscure the superiority of active compounds compared to placebo25–28. Recently, many patient’s baseline characteristics were found to be associated with the placebo response in pain trials9,11,29,30. However, the complexity of the placebo effect phenomenon and its highly multifaceted nature make any adjustment difficult and could therefore benefit from a composite covariate approach.
This work is structured as follows. In Section Generative model of the data, we introduce the general model describing the relationship between the patient’s outcome and the treatment while accounting for a vector of potential covariates. It serves as the generative data model in our theoretical developments, simulations and illustrations. Section Variance of the estimated treatment effect focuses on the sampling variance of the treatment effect with and without covariate adjustment. In Section Optimal number of covariates, we propose an approach to select covariates minimizing the expected treatment effect sampling variance based on historical data. In Section Composite covariate approach, we discuss the relative efficiency of combining covariates a priori as a way to limit the number of parameters to be fitted in the model. In Section Simulation studies, we perform simulation studies to demonstrate the benefit of the composite covariate approach. An application of our method in a phase II trial is illustrated in Section Real life application. We conclude with a brief discussion section.
Generative model of the data
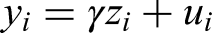
Suppose we focus on the treatment effect only. Then, the response model writes

The random variable

Thus, by combining Equations (1) and (2) and assuming

Variance of the estimated treatment effect
To estimate the added value of the covariates, we should compare the variance of the estimators of
Now, consider a random sample of

Without covariate (
)
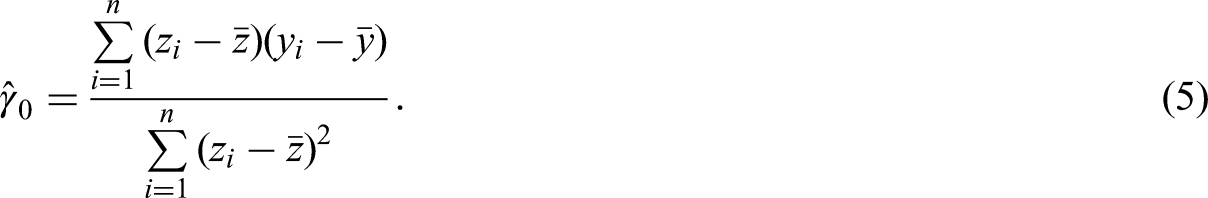
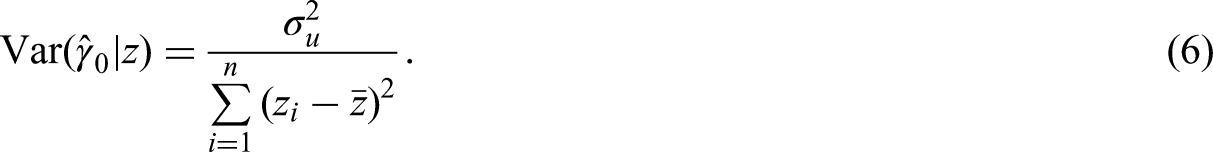
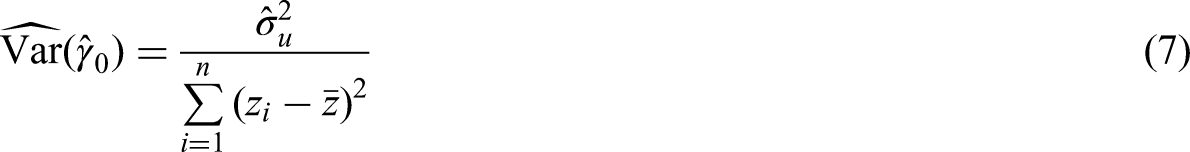
When no covariates are included in the model, Equation (4) is simplified as
With
covariates
In a similar way, when
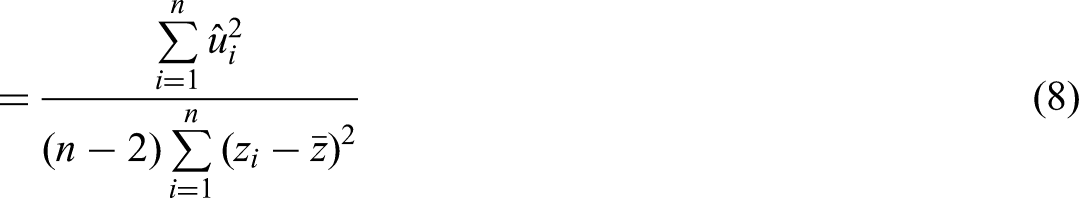
As before, we note that


Benefits of including covariates
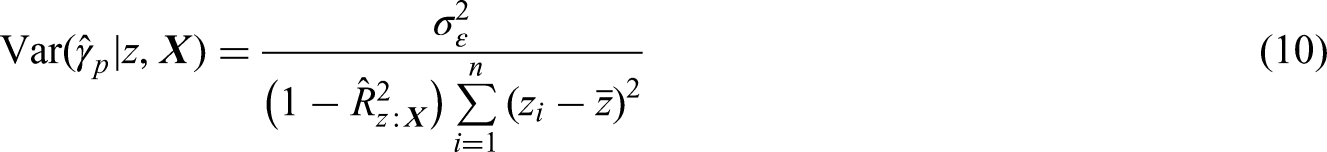
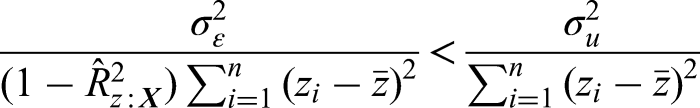
Conditional on


Optimal number of covariates
In the previous section, we showed how to estimate the maximum number of covariates. The next obvious question is: “What is

In a more realistic scenario, the amount of explained variance would not be equally spread amongst all covariates and the covariates might not be independent of each other. In a clinical research context, it is relatively fair to assume that a ranking from the most to the least important covariates is known. Then using Equation (20), the optimal number of covariates is:

Indeed, developing a new drug requires the conduct of several successive clinical trials. In most cases, it is fair to assume the existence of previous/historical study data in the same indication. As the covariates are expected to be independent of the study treatment, historical data could come from studies investigating other compounds as well. These historical study data could be leveraged to estimate all

Of note, the assumption that a ranking of the covariates is known is not strictly required. Indeed, one could compute
Composite covariate approach
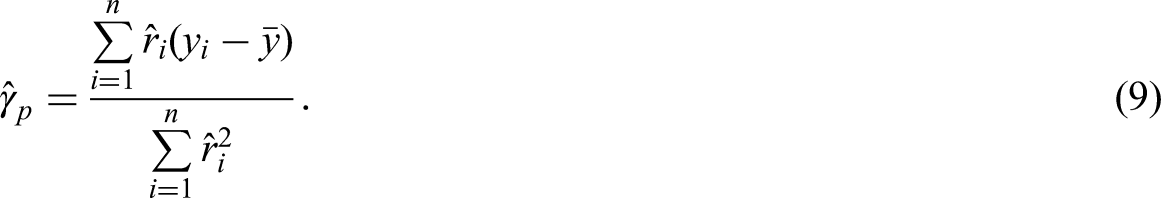
Assuming that historical data exist, as in the previous section, could we do better than only estimating the optimum number of covariates? The main problem with the use of covariates is the associated loss in degrees of freedom. To avoid this issue, we could derive the vector of covariates weights,


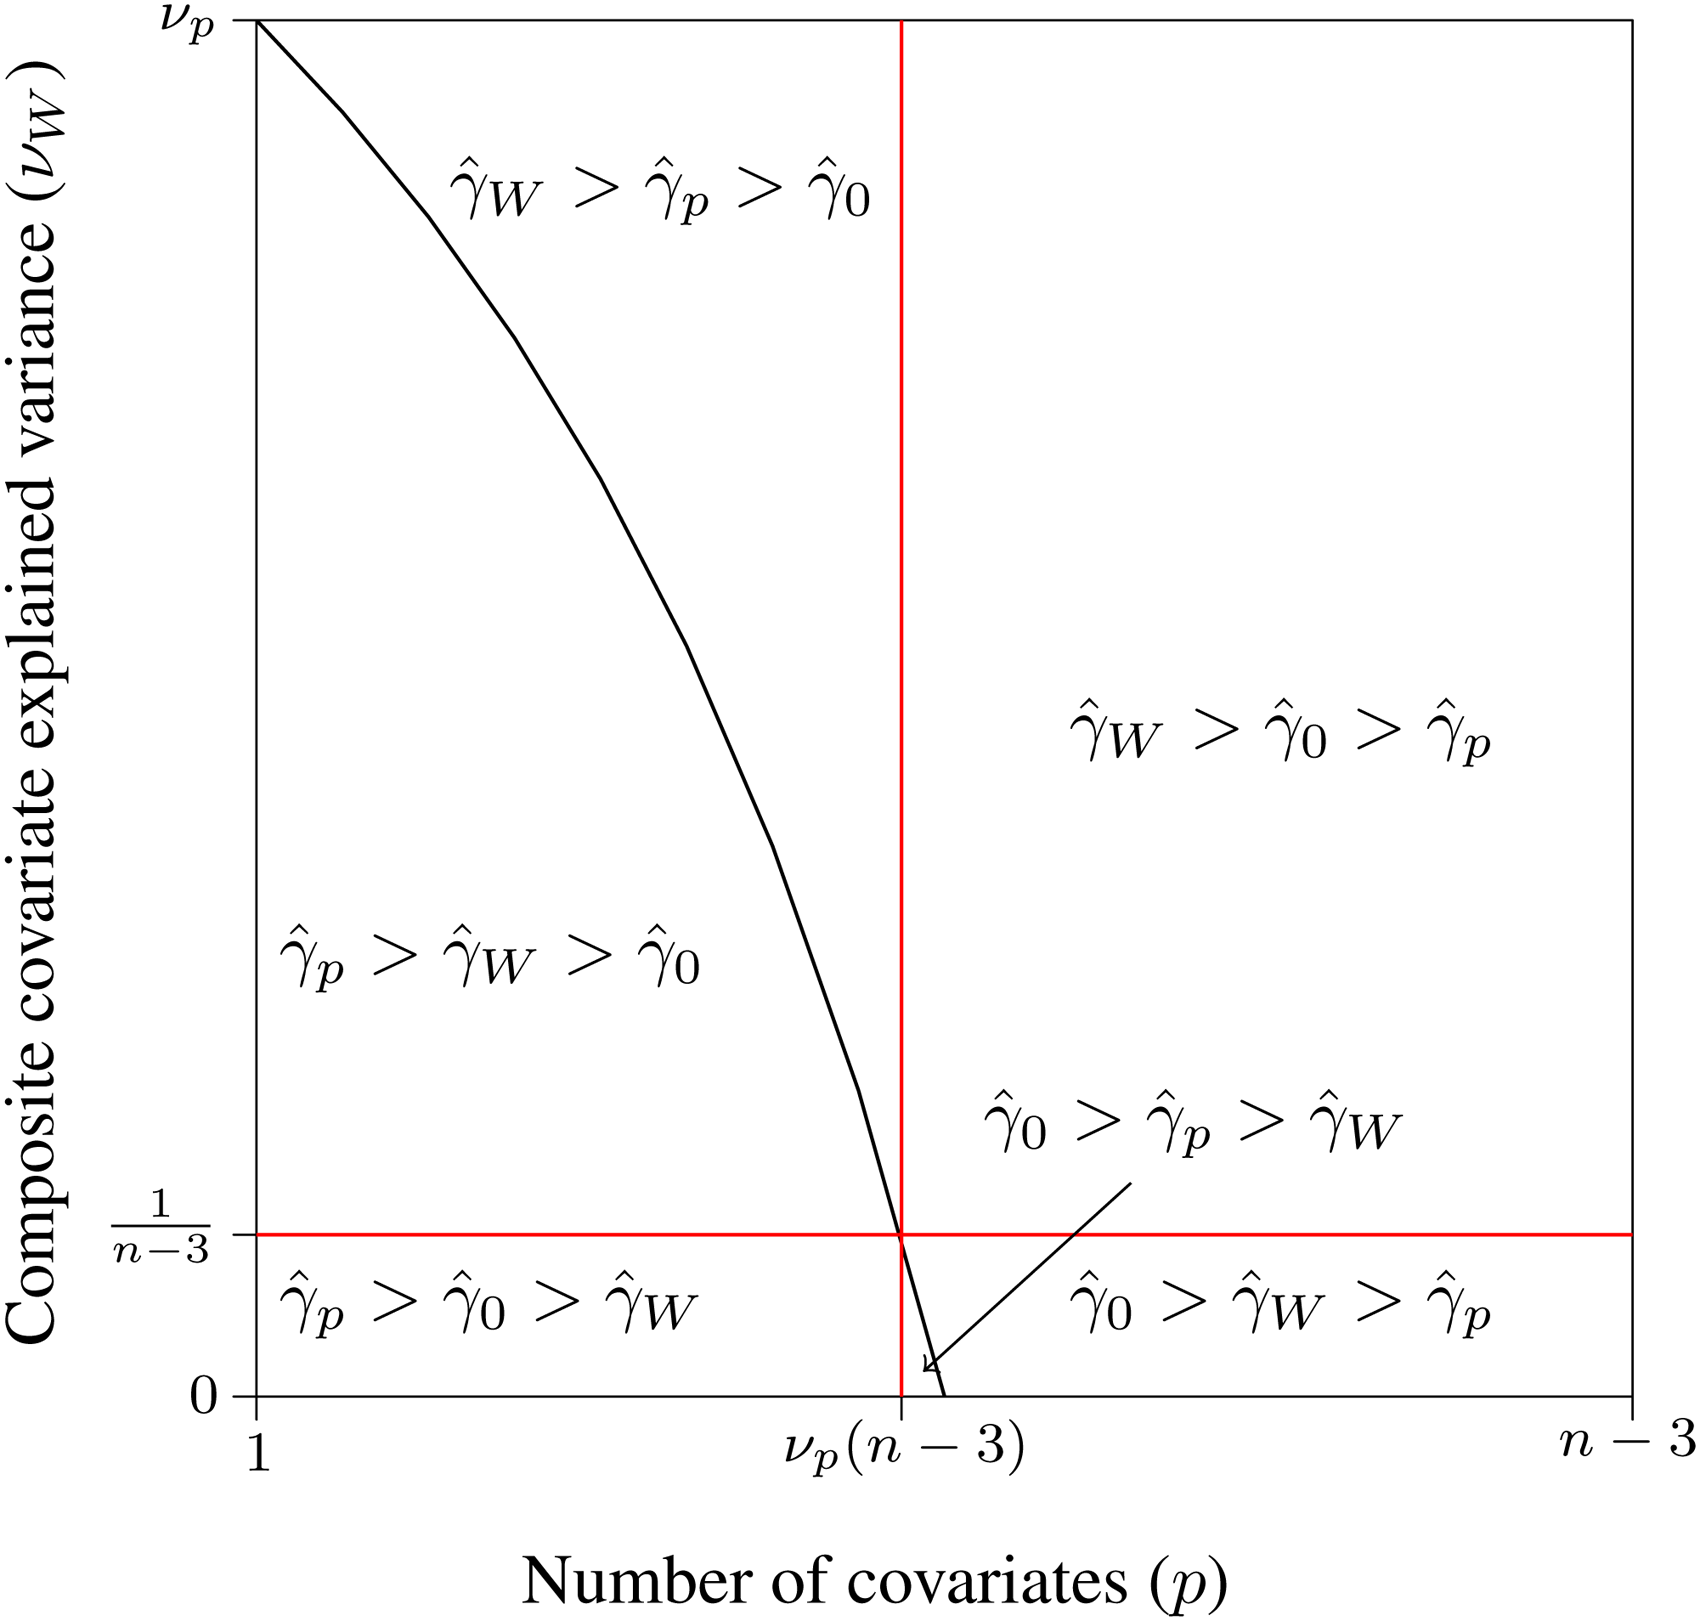
Pairwise comparisons of relative efficiency of the treatment effect estimator between models with no covariate
The three lines cross each other at the same point, hence defining six sets of values for
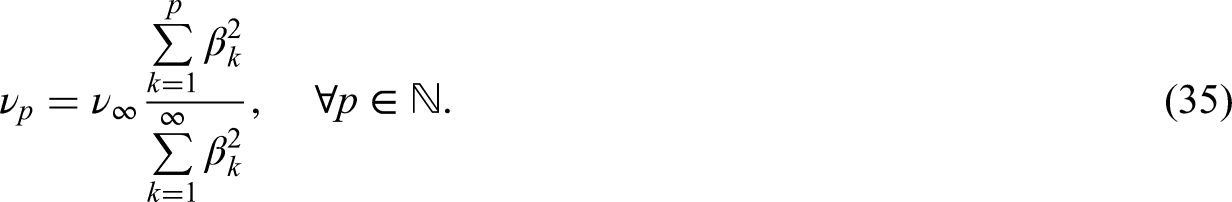
Replacing the covariates by a composite covariate
It is important to mention that these results are not dependent on the model/method used to fit the composite covariate. Many machine learning algorithms are proven to be consistent and thus to converge in probability to the true value (17–20). Using the continuous mapping theorem, the variance explained by the composite covariate,

In finite samples, however, the choice of the model fitting the composite covariate might impact its performance,
Of note, composite covariates are already used in practice, e.g. through prognostic indexes (5–7). A common non-linear example is the Body Mass Index (BMI) ( 8 ). However, in this paper, we propose to use them as a way to optimize the precision of the estimated treatment effect.
Simulation studies
To further illustrate the impact and relative gain of covariates or of a composite covariate on treatment precision and power, numerical simulations are performed. All the simulations are performed with

For the simulations, we choose to fix the total number of patients to

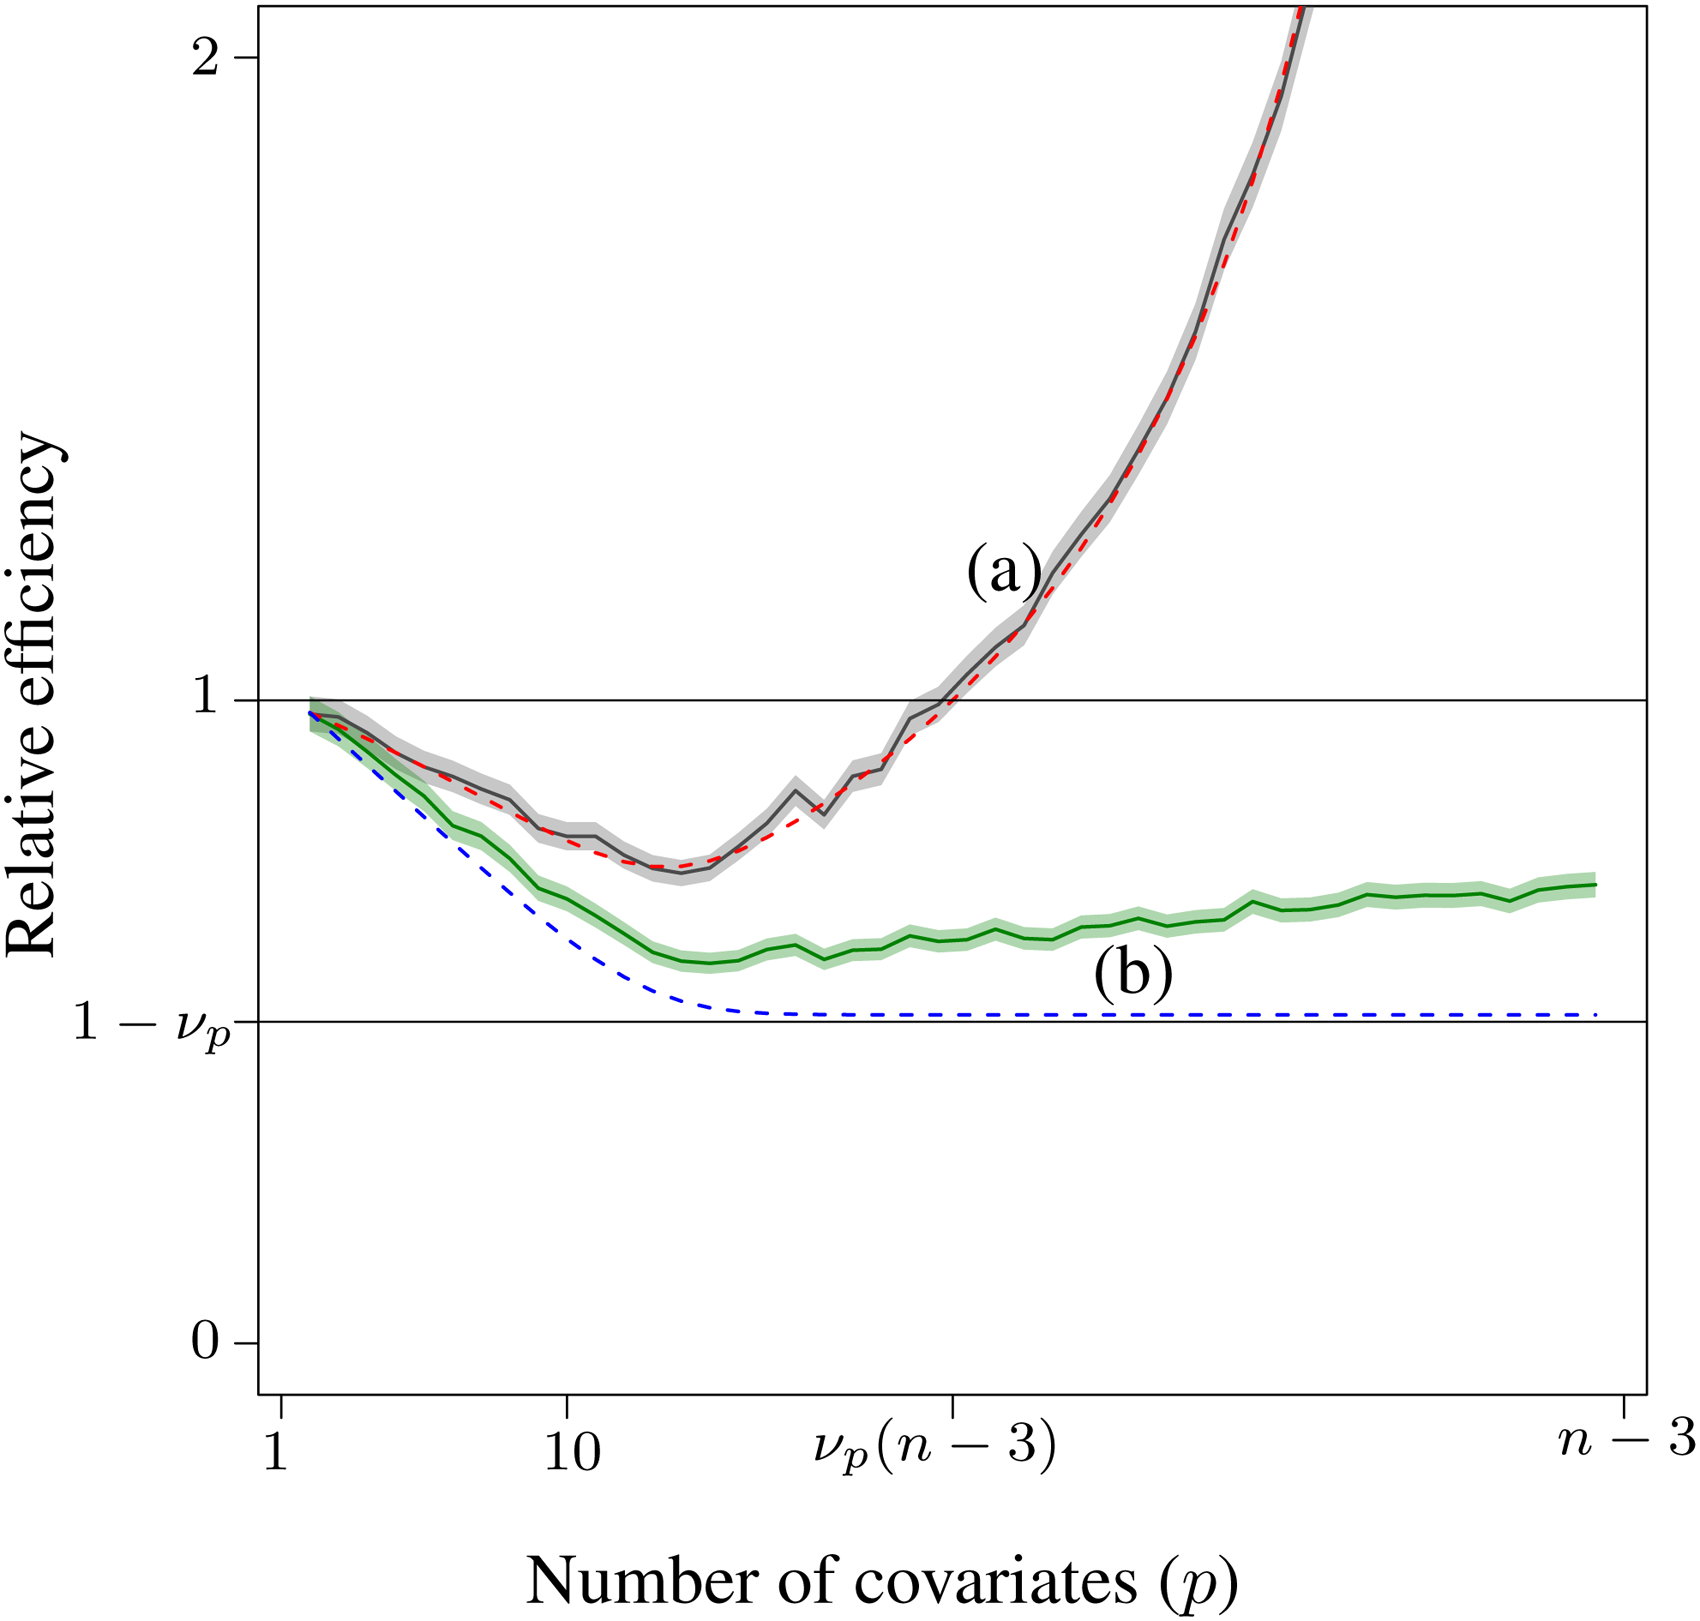
Relative efficiency with respect to the estimation of the treatment effect without covariates. (a) The solid curve is the mean relative efficiency of the
As shown in the figure, the relative efficiency first decreases and then increases when too many covariates are included. This curve may appear to be highly dependent on the simulation parameters, but it is not. The relative efficiency, as a function of the number of covariates, is lower-bounded by:

To illustrate the use of a composite covariate, a ridge regression is trained on the historical data for each simulation while changing the number of covariates (
22
). These ridge models are then used to predict the composite covariate,
Figure 3 presents the power associated with the three approaches in the simulated studies: (a) without any covariate, (b) with
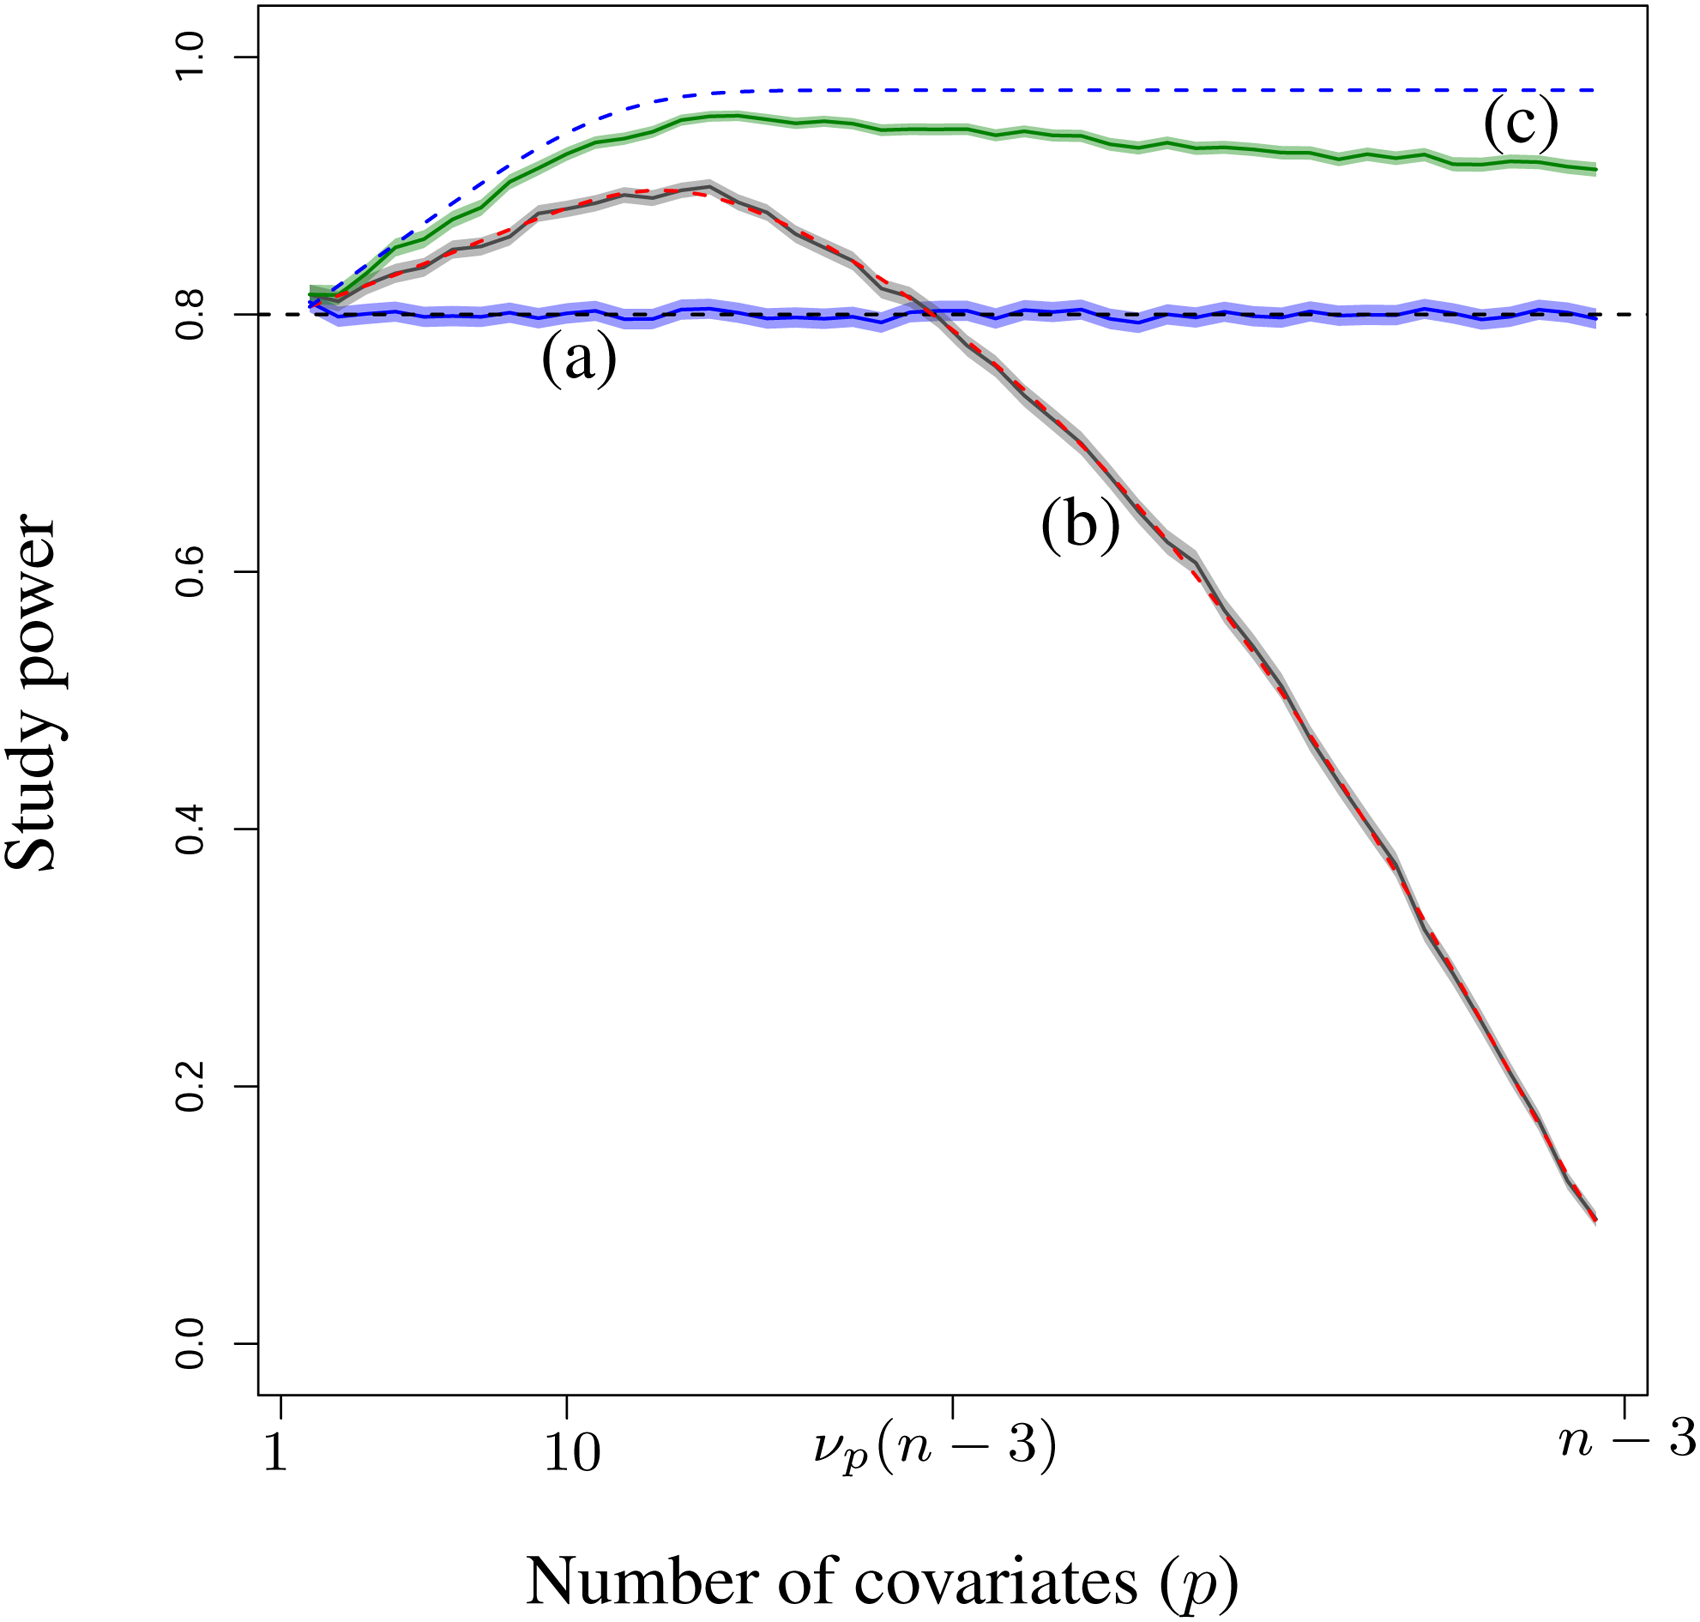
Study power of the three approaches and their 95% confidence intervals: (a) without covariate , (b) with p covariates, and (c) the composite covariate. The dashed curves are the expected power (a) without covariate, (b) with p covariates and (c) with an ideal composite covariate.
The dashed line (b) represents the expected power of using the covariates with respect to the simulation hypotheses. The dashed line (c) represents the expected power of an ideal composite covariate. These power estimations are performed using the approach proposed by
12
. Similarly, as for the relative efficiency, the advantage of the composite covariate grows with
Real life application
The composite covariate approach was applied in a phase 2 trial testing the efficacy of a single-dose intra-articular injection in patients suffering from painful osteoarthritis (OA) of the knee23,24. In OA and more generally in chronic pain, the magnitude and the variability of the placebo response have a blurring effect when testing for the superiority of active compounds compared to placebo25–28. Recently, several studies have identified baseline patient characteristics potentially associated with the placebo responses in pain trials9–11,29,30. However, the intrinsic complexity and the multifactorial aspect of the placebo response make it difficult to control for the placebo effect in the statistical analyses. To overcome the problem, the composite covariate approach was used.
Data from four analgesia clinical trials24,31 were used to fit the composite covariate. The four chronic pain studies included patients suffering from peripheral neuropathic pain or painful osteoarthritis of the knee and hip. When pooled, a total of 211 placebo patients were available. These studies were selected for two main reasons. First, the homogeneity of their study designs and placebo responses allowed us to build one model by pooling all patients. Indeed, they received a blinded placebo (oral, BID) for a duration varying from 1 to 3 months. The primary endpoint was the reduction from baseline of the weekly mean of the daily average pain score (APS). The placebo response was measured on the placebo patients along with the primary endpoint. Second, the studies were selected as they shared many common baseline features which were described as associated with the placebo response in the literature9–11,29,30. Among those baseline features, a subset of 36 features was also available in the targeted OA trial and was selected to be part of the composite covariate modeling. These features included baseline disease intensity measures (average pain score, worst pain score, WOMAC-Pain,…), demographics (age, gender, BMI), and patient psychological profile (Big-Five,…).
The composite covariate was fitted on these 36 features after normalization to predict the placebo response. The fitting was performed using a ridge regression 22 . The ridge regression is a regularized linear model penalizing the sum-of-squares of the model weights. This penalization/regularization is often used to improve the regression performance in the presence of correlated features 15 . In our data, such correlations were expected and observed among the psychological traits. For the purpose of the article, we limited ourselves to linear models, hence the choice of the ridge regression. As discussed in the previous sections, the gain associated with a non-linear composite covariate comes both from the reduction in degrees of freedom and from the additional expressiveness of the model. If useful in practice, we perceived this additional expressiveness as an unfair advantage and a particular case in the comparison between individual and composite covariates. The model weights, as well as the features’ normalization parameters, were fixed before the analysis of the new OA trial defining the composite covariate.
In the target OA trial, the change from baseline of the WOMAC-Pain was the primary endpoint. A total of 173 patients completed the protocol without any major deviation. More details about the trial can be found in the original publication 23 . The composite covariate was computed for each patient using the predefined placebo model. The composite covariate highly correlated (r = 0.60, p < 0.001) with the observed placebo response (primary endpoint response of the placebo patients) confirming the predictive performance of the model. When used in the estimation of the treatment effect comparing the placebo and active arms, the estimated variance of the average treatment effect decreased by 26.8%. The F-test comparing the nested models with and without the composite covariate was highly significant (p < 0.001). For comparison purposes, the 36 features were included individually in the estimation of the average treatment effect. A slightly lower gain was observed in treatment effect precision (variance decrease of 23.3%). The individual covariates benefited from the fairly large study sample size. However, the high number of covariates makes the interpretability of the study difficult and is not recommended by both the FDA and EMA guidelines on baseline covariates32,34.
Looking at a subset of data, comparing placebo and each treatment arm, the benefit of the composite covariate was much larger. The composite covariate reduction in variance was 27.3%, respectively 23.2%, 34.7%, and 23.9% for the three comparisons. Clearly, the individual covariates are much more impacted by the sample size reduction with an average gain in variance of only 14.3% (respectively 18.7%, 11.3%, and 12.9%).
Discussion and conclusion
Assessing correctly the treatment efficacy is of critical importance in randomized clinical trials. However, since it is not ethical to expose too many patients to an unproven treatment, the sample size and power of initial phase I/II trials are often limited. In this context, several statistical approaches have been developed to maximize the study power and the statistical precision of the treatment effect estimate. One of such approaches, the analysis of covariance (ANCOVA), relies on baseline covariates to adjust for possible imbalance between study groups and to explain the variability of the patient’s response improving the study power.
Including covariates associated with the study outcome could greatly improve the efficiency and power of the trial. However, adding covariates in the analysis comes with a cost in degrees of freedom. As such, regression adjustment should be seen as a trade-off between explained variance and loss of degrees of freedom. There are many rules-of-thumb on the number of covariates that can be included in an analysis. To the best of our knowledge, none of them balances both explained variance and degrees of freedom.
In this paper, we answered the question of the number of covariates while focusing on the precision of the estimated treatment effect in an ANCOVA. Our result for the maximum number of covariates is a simple closed-form formula,
Assuming data of previous studies to be available, we showed how to further improve the study power by fitting the covariates weights a priori. Similarly, a composite covariate is fitted on historical data and replaces the individual covariates in the treatment effect estimation. The composite covariate approach is already used in practice, e.g. through prognostic indexes (see5–7). With this paper, we investigated the use of composite covariates specifically to optimize the precision of the treatment effect estimation. Using a composite covariate allows to trade some explained variance to avoid the loss in degrees of freedom. The associated gain is particularly relevant when the sample size is small and the number of covariates is large.
It is important to note that the composite covariate approach differs greatly from other methods used to leverage historical data in the analysis of clinical trials, such as Pocock’s method, power prior, etc. As discussed in 33 , these methods require historical trials/data that are sufficiently comparable to the current trial to improve its power and precision. Furthermore, they need to account for between-trial heterogeneity. This is not the case with a composite covariate. The historical data are used only to fit the composite covariate, not to estimate the treatment effect. The composite covariate approach fits within the well-studied ANCOVA framework. As such, it can produce unbiased estimates regardless of the study used to fit the composite covariate 1 .
The proposed method fits within the guidelines of the EMA and FDA on the use of baseline covariates32,34. A composite covariate is fitted and fully defined in advance, including variable selection and possible complex/non-linear modeling. Conducting this modeling on pre-existing data simplifies the estimation of the treatment effect limiting the risk of overfitting. The approach also limits the number of covariates which is recommended by both agencies.
Considering the recent advances in placebo effect characterization (29,9–11), the composite covariate approach could have a major impact on future RCTs by disentangling the placebo response from the actual treatment efficacy. The placebo effect is a complex phenomenon, individual-dependent with components linked to the subject’s demography, psychology, sociology and disease intensity. This highly multivariate aspect of the placebo makes any adjustment difficult. The composite covariate approach is one way to overcome the problem. We demonstrate its applicability and benefits in this context on a phase II study studying the effect of an intra-articular injection on patient suffering from painful osteoarthritis (OA) of the knee.
Supplemental Material
sj-R-1-smm-10.1177_09622802211065246 - Supplemental material for Leveraging historical data to optimize the number of covariates and their explained variance in the analysis of randomized clinical trials
Supplemental material, sj-R-1-smm-10.1177_09622802211065246 for Leveraging historical data to optimize the number of covariates and their explained variance in the analysis of randomized clinical trials by Samuel Branders, Alvaro Pereira, Guillaume Bernard, Marie Ernst, Jamie Dananberg, and Adelin Albert in Statistical Methods in Medical Research
Footnotes
Acknowledgements
The authors are grateful for the valuable feedback and suggestions provided by Marc Buyse which greatly improved this article. They also thank Ben Xie for the review and the comments.
Declaration of conflicting interests
The author(s) declared no potential conflicts of interest with respect to the research, authorship and/or publication of this article.
Funding
The author(s) received no financial support for the research, authorship and/or publication of this article.
Generalization to multiple groups
In this section, we generalize the previous results to
When there is no covariate, the sampling variance-covariance matrix of
When there are
The treatment effects are computed using a contrast matrix
References
Supplementary Material
Please find the following supplemental material available below.
For Open Access articles published under a Creative Commons License, all supplemental material carries the same license as the article it is associated with.
For non-Open Access articles published, all supplemental material carries a non-exclusive license, and permission requests for re-use of supplemental material or any part of supplemental material shall be sent directly to the copyright owner as specified in the copyright notice associated with the article.