
Abstract
In medical diagnostic studies, the area under the receiver operating characteristic curve (AUC) is a widely used metric that captures a continuous test’s overall ability to discriminate between diseased and non-diseased individuals across all possible cutoffs. However, in practice, disease status is sometimes only partially verified, introducing verification bias that undermines the validity of AUC estimation. While numerous methods address bias correction for AUC estimation, approaches that directly construct confidence intervals for the AUC remain limited. This paper proposes two robust methods for constructing bias-corrected confidence intervals for the AUC under the missing-at-random assumption: one based on bootstrap resampling and the other on empirical likelihood. Both approaches accommodate missing disease verification by leveraging the bias-corrected ROC estimators introduced by Alonzo and Pepe. Extensive simulation studies and real-world data analyses demonstrate that our proposed methods yield valid and precise interval estimates for the AUC under various clinically relevant settings.
Keywords
Introduction
Diagnostic tests have become indispensable tools in modern medicine, playing a pivotal role in patient care. Their typically rapid, inexpensive, and non-invasive nature allows for broad application across large populations. However, the ability of different diagnostic tests to discriminate between healthy and diseased individuals can vary substantially. Consequently, rigorous assessment of diagnostic accuracy is essential before their adoption into clinical practice. The area under the receiver operating characteristic curve (AUROC, or AUC) is a widely used summary measure of a test’s ability to distinguish between diseased and non-diseased subjects. Mathematically, the AUC represents the probability that the score of a randomly selected diseased individual exceeds that of a randomly selected non-diseased individual, assuming that higher scores indicate a greater likelihood of disease. 1 Typical AUC values range from 0.5 (no discriminatory ability) to 1.0 (perfect discrimination). Values below 0.5 usually suggest that the positive and negative labels have been reversed.2,3
Estimation of the AUC requires knowledge of the true disease status, determined by a reference standard (commonly referred to as the gold standard), which is the most reliable method currently available for confirming the presence or absence of the target condition. However, such tests are often expensive, labor-intensive, or invasive. As a result, in some situations, not all subjects who undergo the diagnostic test have their true disease status verified through a fully accurate gold standard test. For example, during the COVID-19 pandemic, when medical resources were limited, not everyone was able to undergo nucleic acid amplification testing, which is considered the gold standard for diagnosing COVID-19. In other words, the labels representing the true disease status of some subjects are partially missing. Simply ignoring this missingness and analyzing only subjects with verified disease status may lead to verification bias. 4 To address verification bias, the missing-at-random (MAR) assumption 5 is often adopted. It posits that the probability of a subject being verified does not depend on the true disease status and is only a function of observed data. The MAR assumption is considered plausible and feasible when data are missing by design. 6 For instance, a clinician may choose to administer the costly gold standard test only to patients classified as high-risk based on their initial diagnostic test results. Because patients at minimal risk are more likely to have their true disease status missing, the application of existing complete-data approaches under the MAR assumption may result in biased inference and loss of efficiency.
Several verification bias-corrected approaches have been proposed for estimating the AUC of a diagnostic test under the MAR assumption. Alonzo and Pepe
7
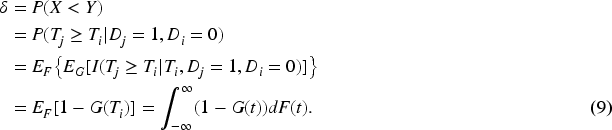
proposed and compared several imputation- and reweighting-based bias-corrected estimators of the ROC curve for continuous tests. He et al.
8
proposed a
Empirical likelihood (EL), as an alternative to bootstrap for constructing non-parametric confidence regions, was introduced by Owen.16,17 It provides a flexible non-parametric likelihood framework and has been widely used for statistical inference in a variety of settings.18–20 Key features of empirical likelihood include its automatic determination of the shape and orientation of a confidence region from the data and its implicit studentization, carried out through internal optimization without requiring explicit covariance estimation. 21 Based on the mean-like form of the Wilcoxon–Mann–Whitney estimator, Qin and Zhou 22 proposed an EL approach for inference on the AUC, which was shown to have good small-sample performance. Qin and Wang 23 proposed an imputation-based empirical likelihood method for constructing confidence intervals for the AUC with missing-completely-at-random data, offering strong small-sample performance while preserving the original data distribution. Inspired by their work, we propose EL-based confidence intervals for the AUC for continuous tests under the MAR assumption.
The remainder of the paper is organized as follows. In Section 2, we briefly review existing methods for estimating the sensitivity and specificity of a continuous test under verification bias. In Section 3, we motivate and develop our proposed confidence intervals for the AUC. Simulation studies and sensitivity analyses are presented in Section 4, followed by a real-world data study in Section 5. Finally, we conclude the paper with a discussion in Section 6.
Existing estimators for the sensitivity and specificity with verification bias
Consider a two-phase design. In the first phase, a continuous screening test is conducted on all subjects. Let

In a sample of size

In practice, only a subset of the
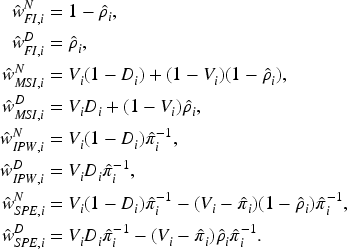
Full imputation
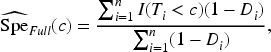
One imputation-based approach to estimate the prevalence of the disease in a two-phase design is to use full imputation (FI) over the distribution


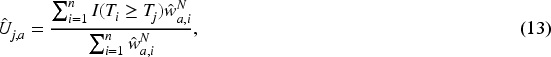
MSI is another imputation-based approach used for estimating the prevalence of the disease in two-phase studies. In contrast to FI, MSI only imputes disease status for subjects who are not in the verification sample and uses the observed disease status for those who are in the verification sample. Then, the MSI estimators of the sensitivity and the specificity are given by


An IPW estimator that weights each observation in the verification sample by the inverse of the sampling fraction (i.e. the probability that the subject was selected for verification) is a reweighting-based approach used to estimate the prevalence of the disease in a two-phase design.24,25 The IPW estimators of the sensitivity and the specificity are given by


Gao et al.
26
and Alonzo et al.
27
independently derived the following SPE estimators of the sensitivity and the specificity


AUC estimation with verification bias
We start with the point estimators for the AUC with verification bias. Let


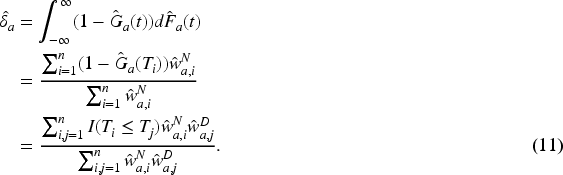
Hai and Qin
11
proposed this direct estimator
We may apply the bootstrap method to estimate the variance of Draw a bootstrap sample of size Calculate a bootstrap copy Repeat the first two steps Then, the bootstrap variance estimator
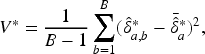
After obtaining such an appropriate variance estimate, we can construct bootstrap confidence intervals for the AUC
The
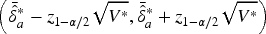
We also have a
Pepe and Cai
28
defined the following placement value


Let

However,


Under some regularity conditions (see Appendix A, see supplemental material), we can show that the asymptotic distribution of

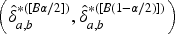
In order to construct confidence intervals for the AUC based on (17), we propose the following bootstrap procedure: Draw a bootstrap sample Compute the bootstrap copy Compute the bootstrap copy Repeat steps 2 to 4 Compute Compute the median
Then, two


To make our proposed methods accessible for practitioners, an R package
In this section, extensive simulation studies are conducted to evaluate the finite sample performance and robustness of the proposed confidence intervals for the AUC in the presence of verification bias at the 95% nominal level. The simulation setup is similar to that of Alonzo and Pepe
7
and Hai and Qin.
11
Briefly,
Parameter settings in simulation studies.
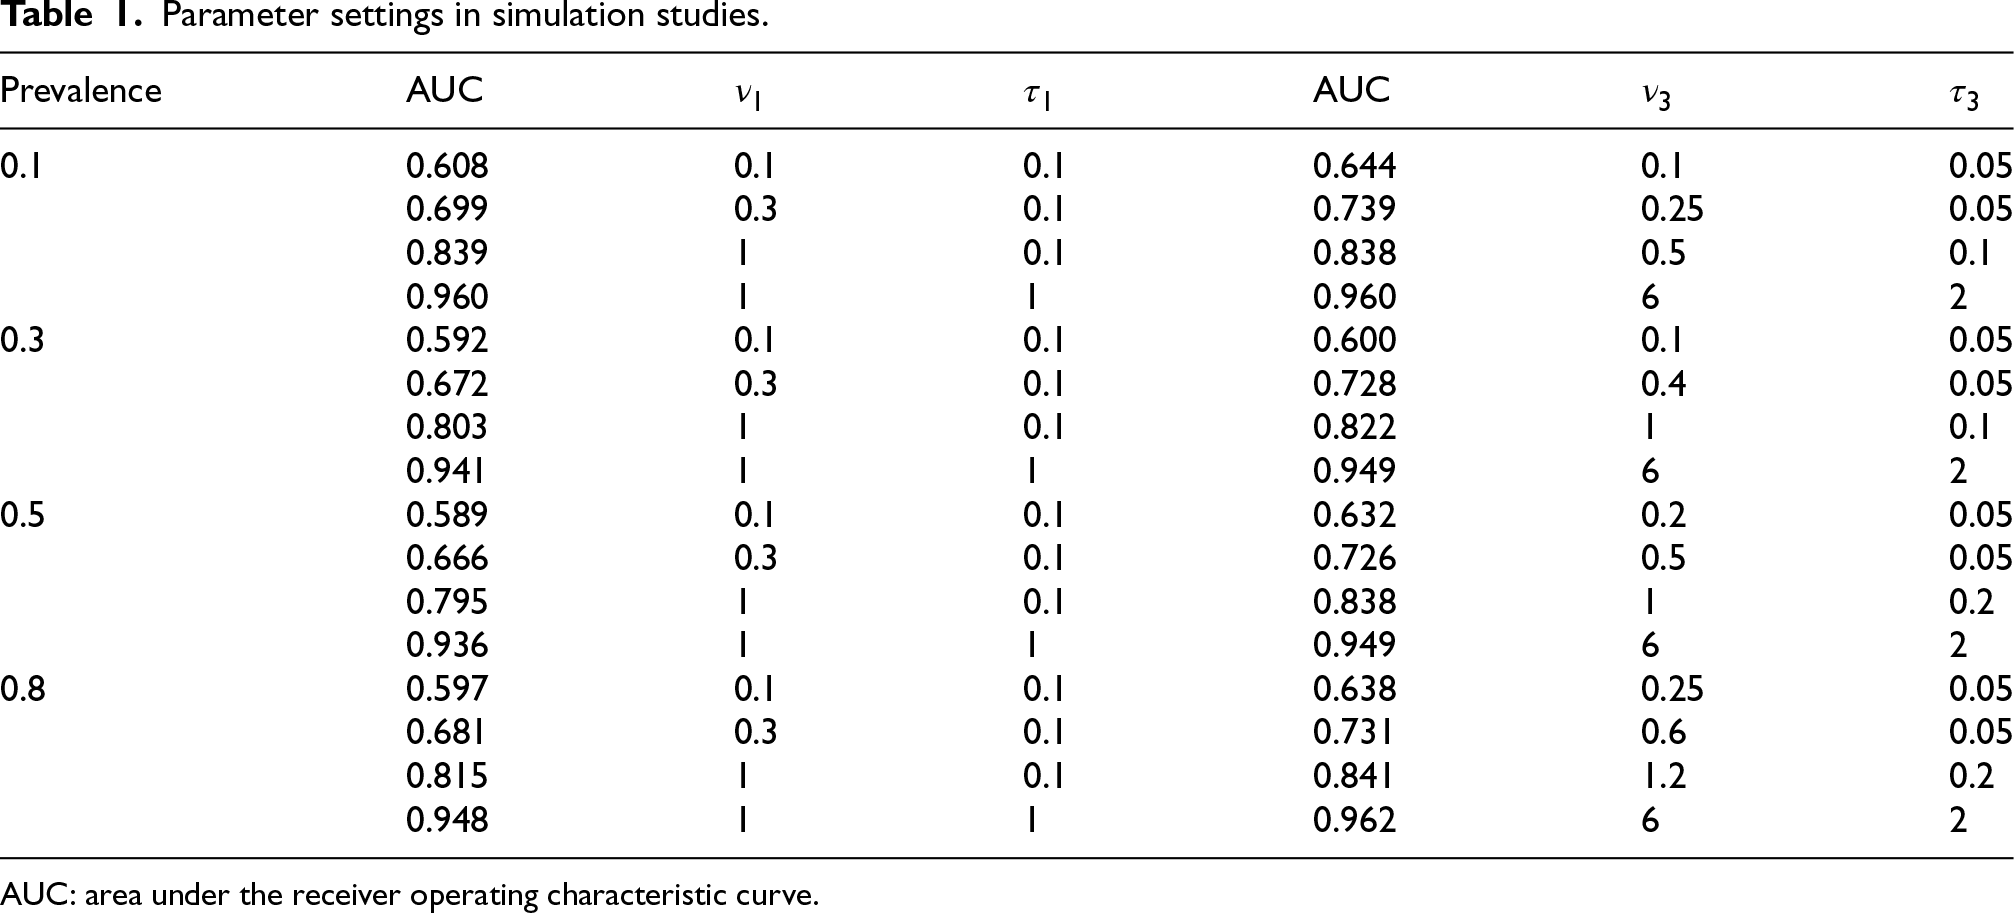
Parameter settings in simulation studies.
AUC: area under the receiver operating characteristic curve.
To introduce verification bias under the MAR assumption,
First, we evaluate the performance of the proposed confidence intervals using the correct disease and verification models. In order to apply FI, MSI, and SPE estimators, a parametric model for the disease probabilities 
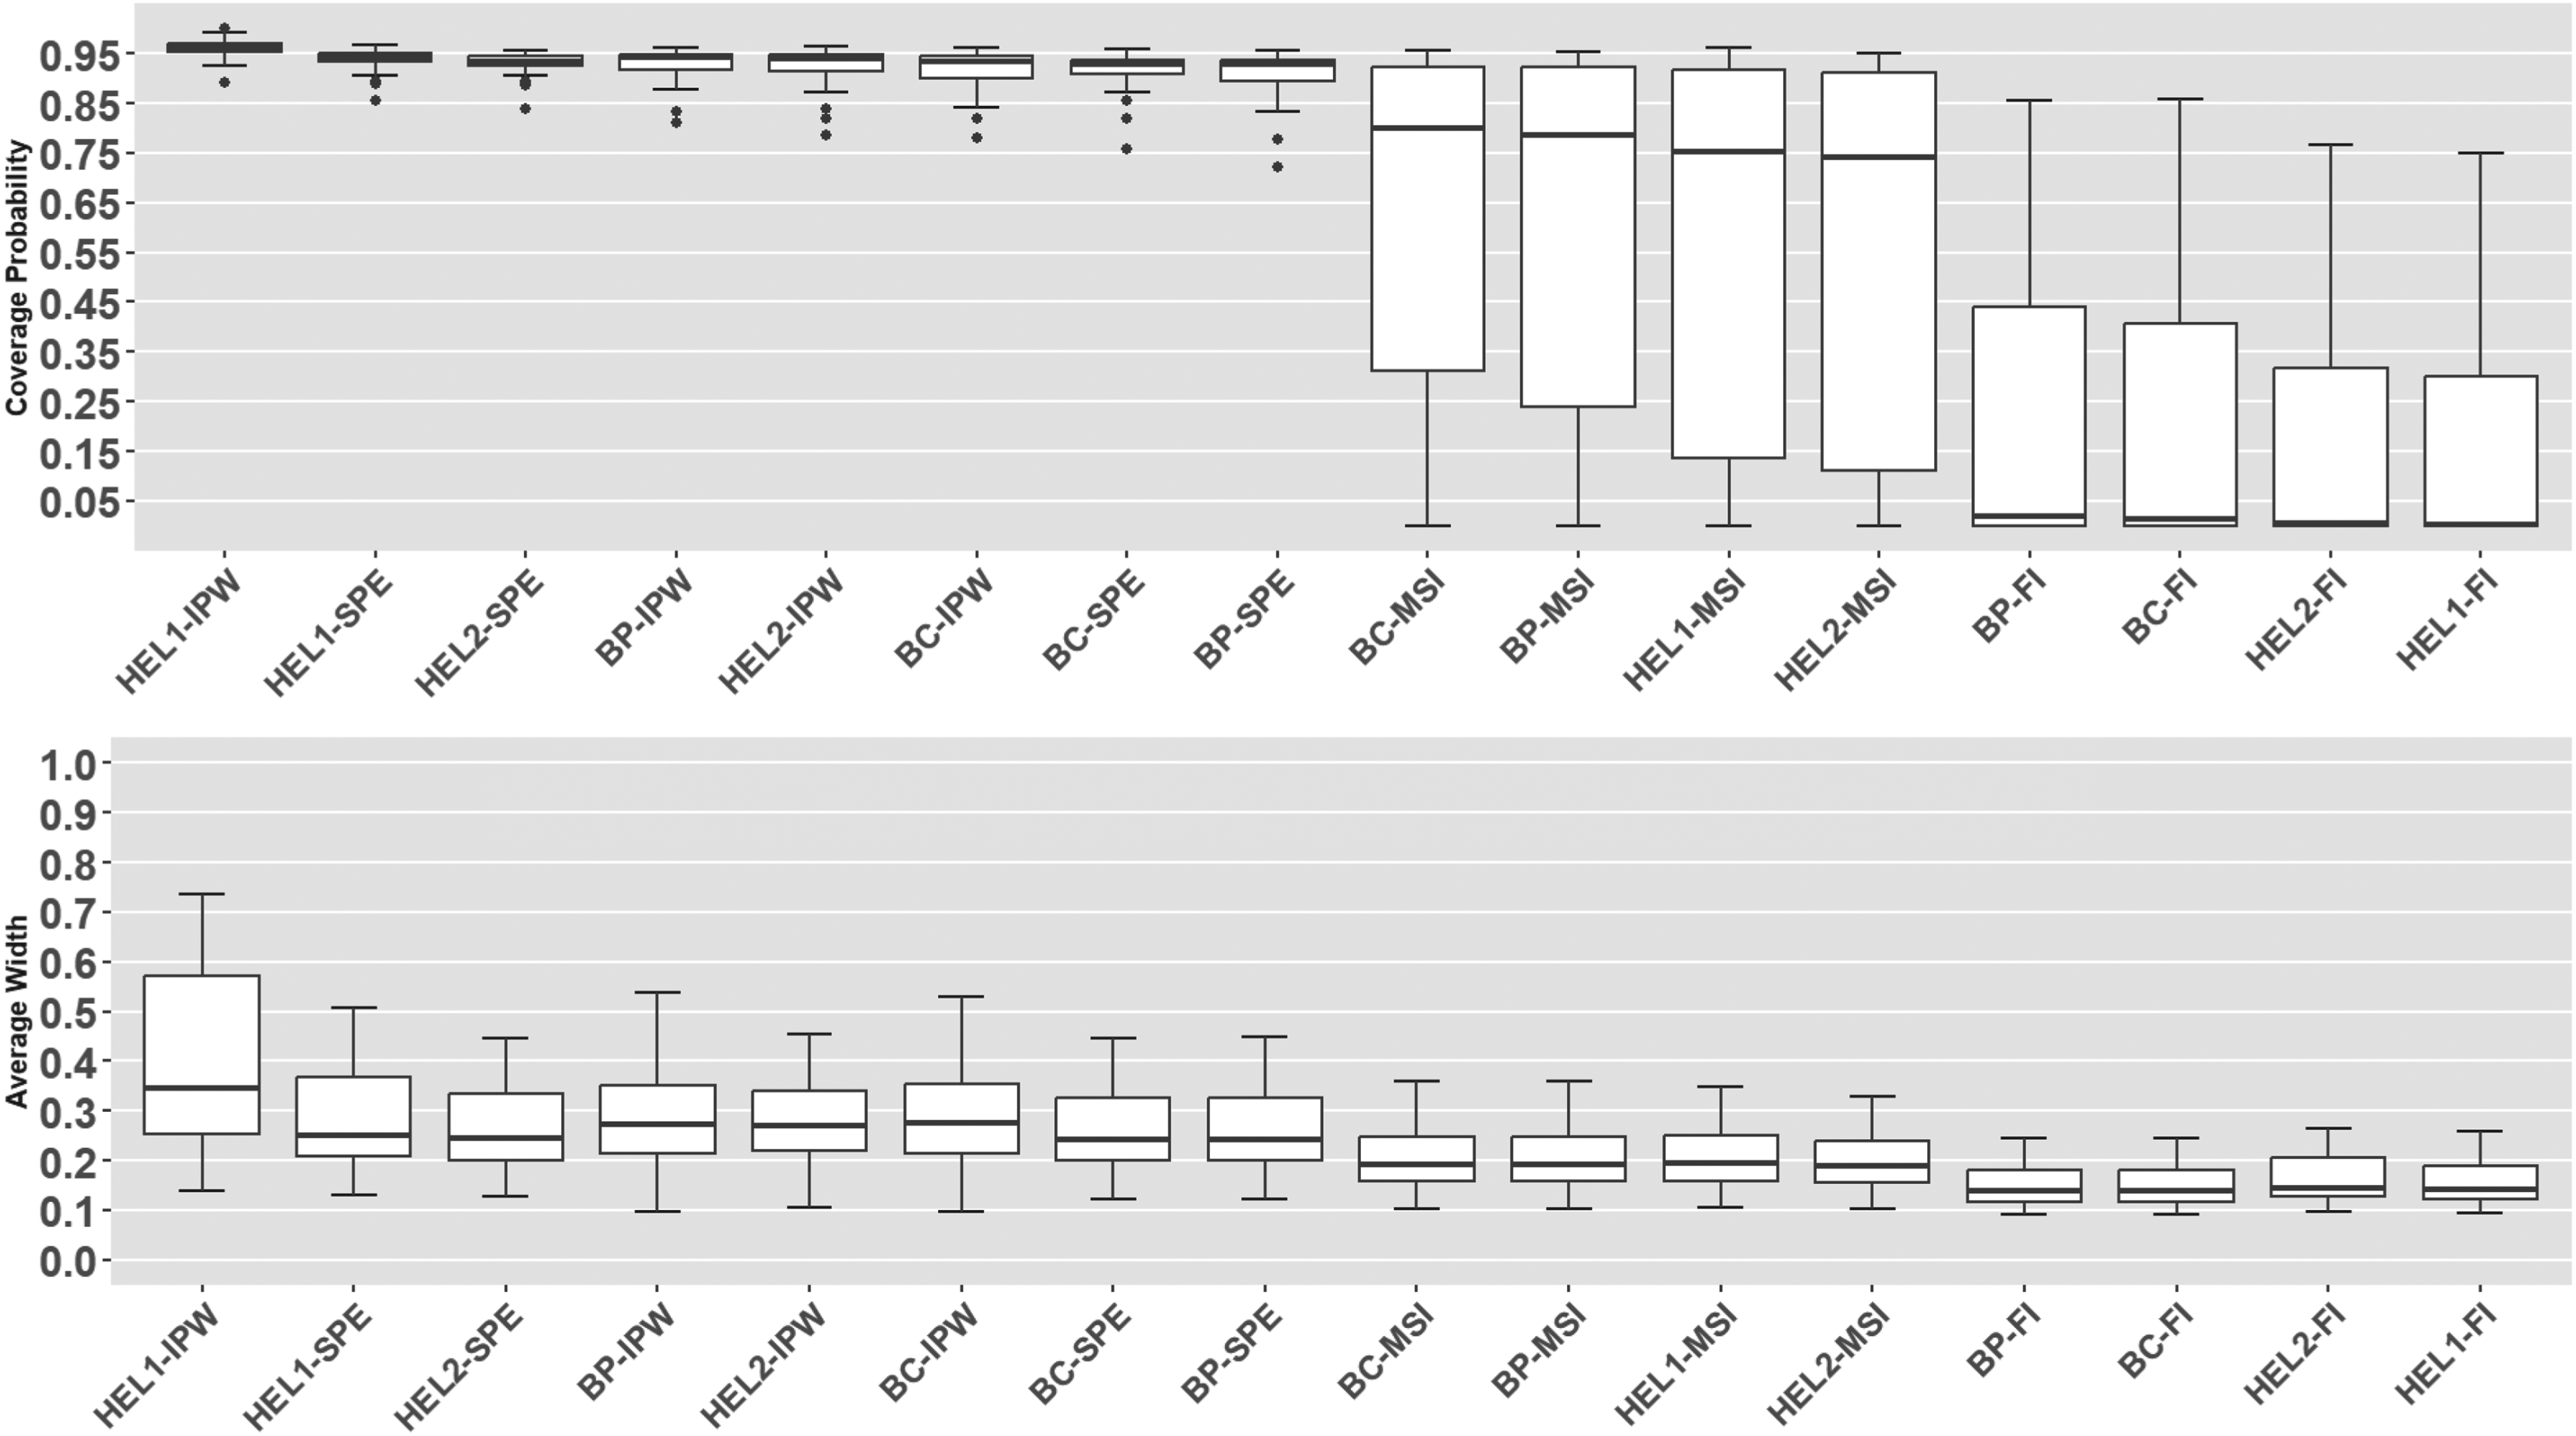
We report coverage probabilities and average widths of the proposed confidence intervals using boxplots in Figure 1 and Table 4 (in Appendix A.2, see supplemental material). From Figure 1 and Table 4 (in Appendix A.2, see supplemental material), we can observe that when both disease and verification models are correctly specified, HEL2-FI and HEL2-MSI (HEL2 interval using the FI and MSI estimator, respectively) deliver the strongest overall performance, achieving coverage closest to the nominal level while maintaining relatively narrow intervals. HEL1-FI and HEL1-MSI intervals show slight over-coverage and yield wider intervals. BP-SPE and BC-SPE follow closely, providing adequate coverage and interval width, with BP intervals generally showing a modest advantage over BC intervals in coverage. In contrast, all IPW-based intervals perform the weakest. Across all methods, interval precision improves with increasing sample size and with larger true AUC values.
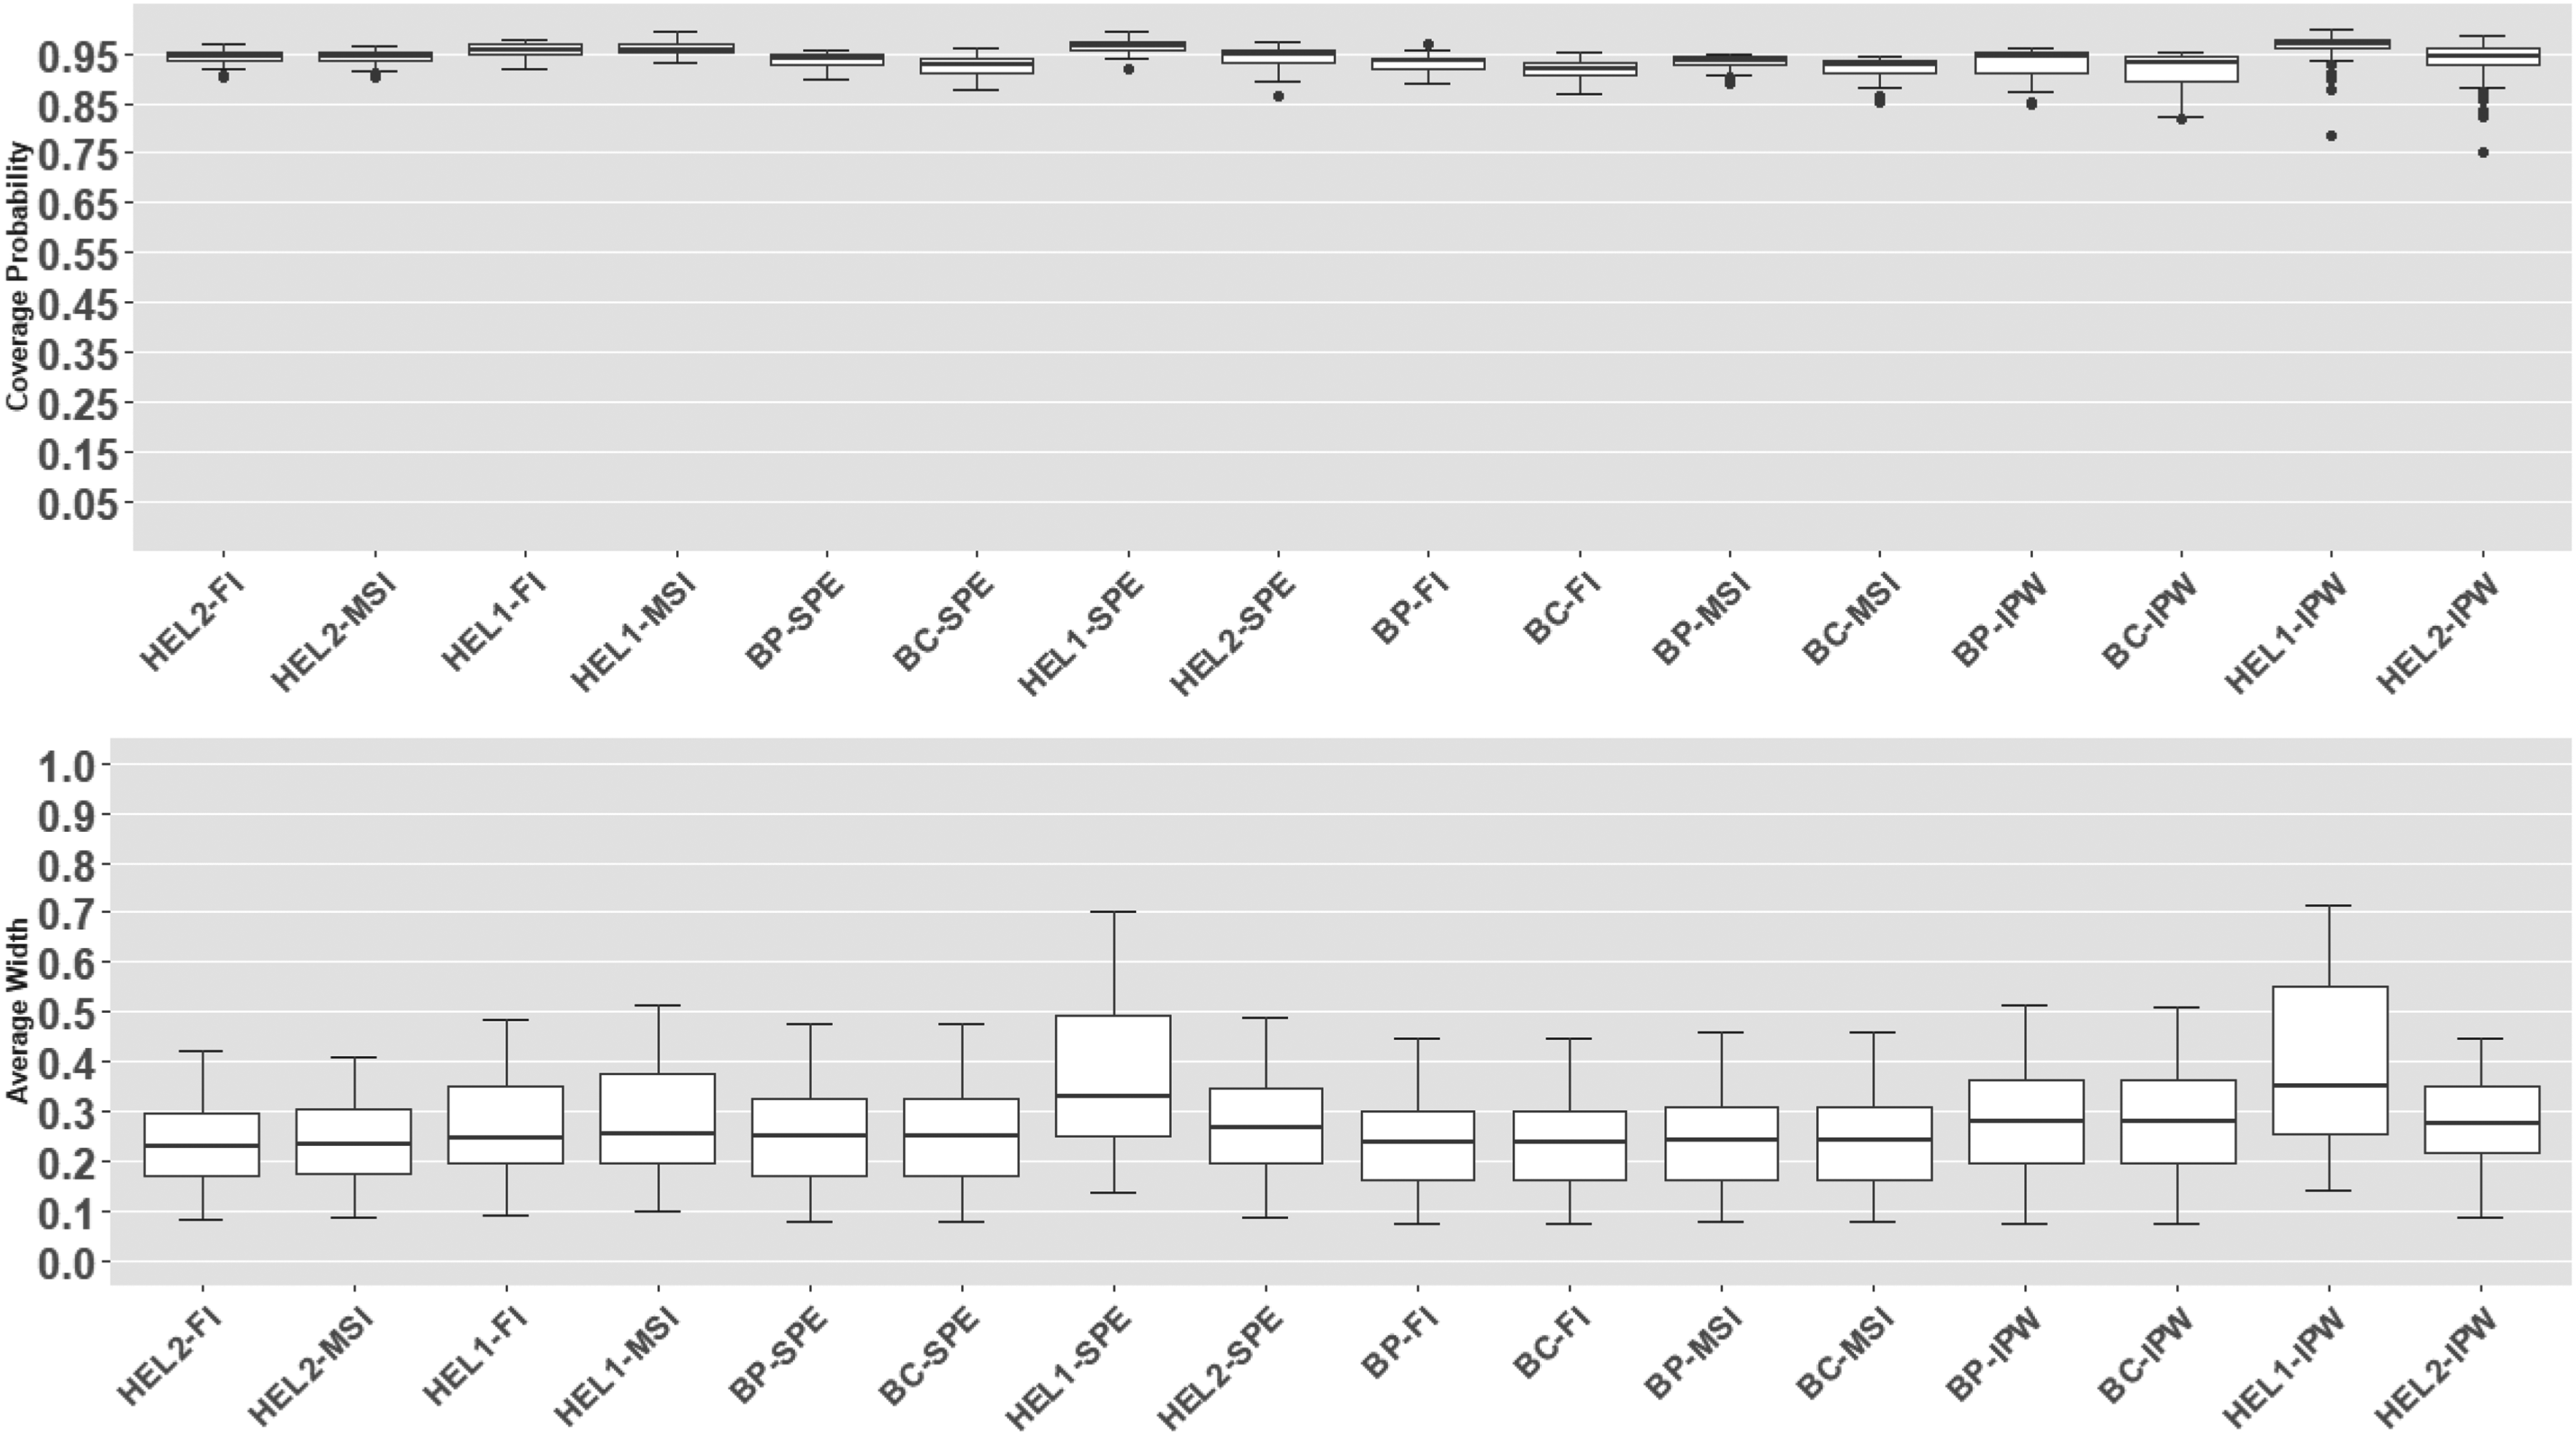
Coverage probabilities and average widths of the proposed 95% level CIs: correct model. (HEL2-FI denotes HEL2 interval using FI estimator, etc. The same applies to Figures 2–4. The proposed intervals are sorted by coverage probability, from the best (left) to the worst (right). The same applies to Figures 2–4.) CI: confidence interval; FI: full imputation.
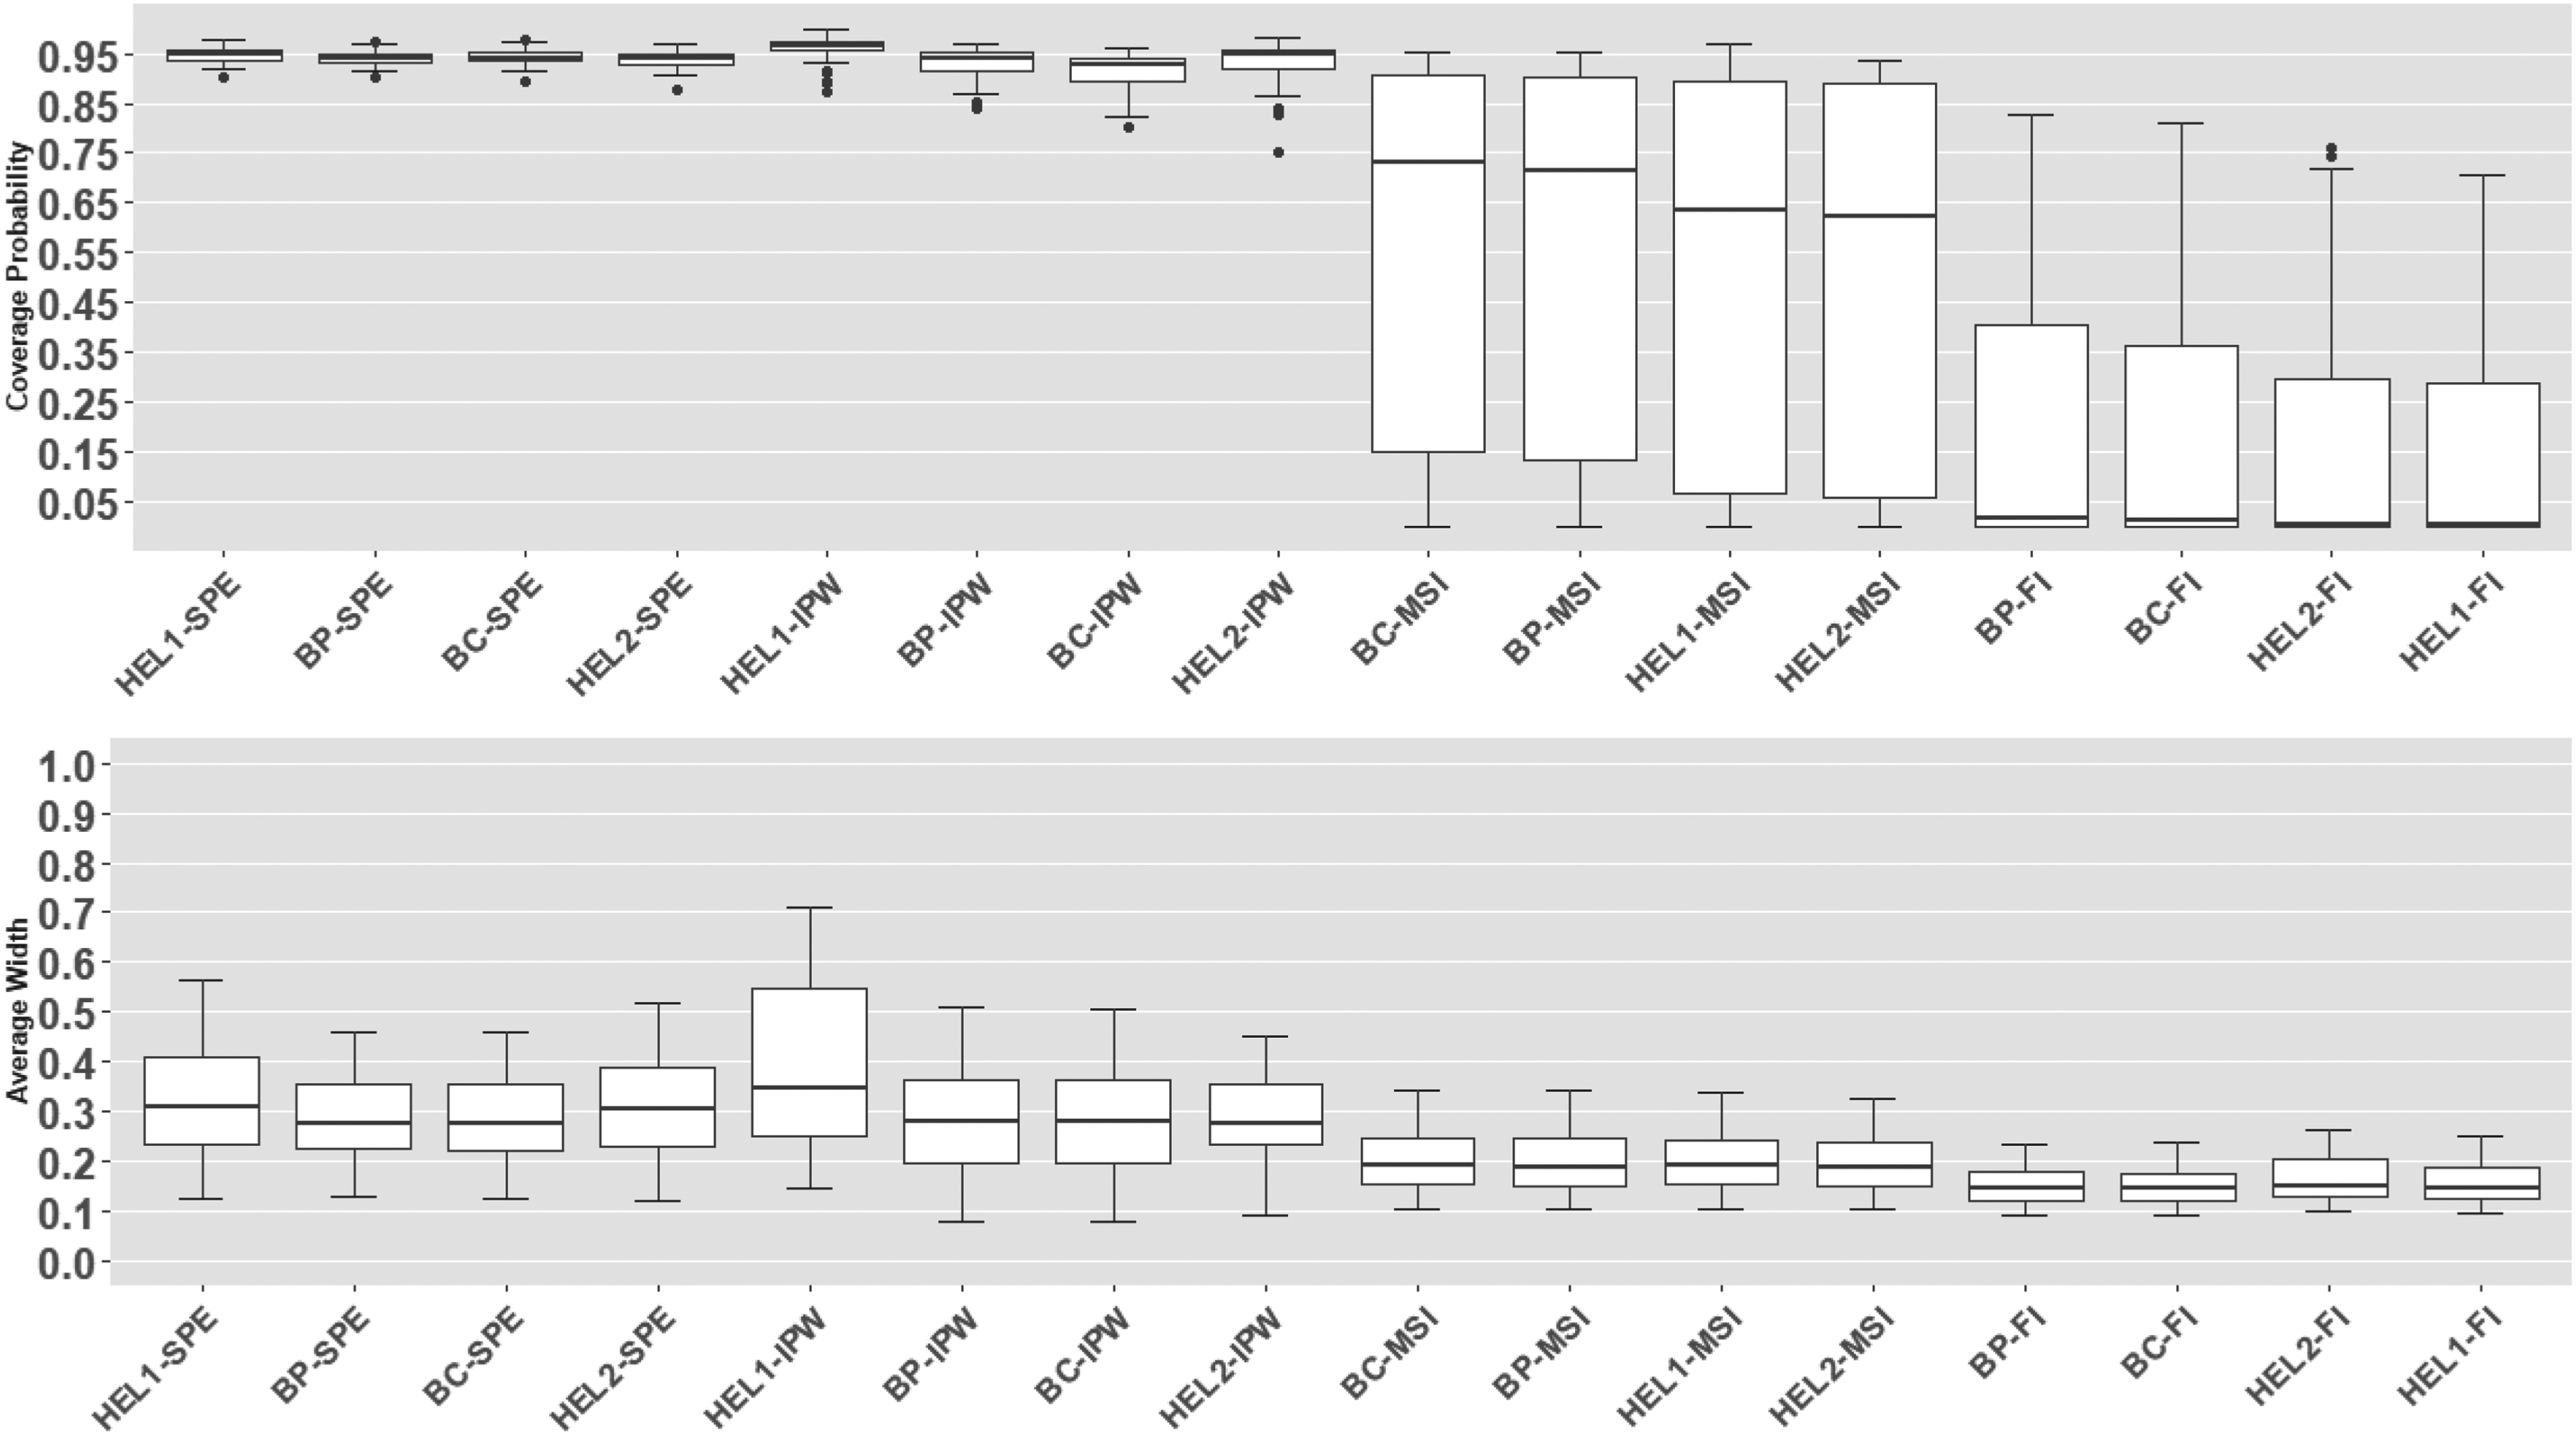
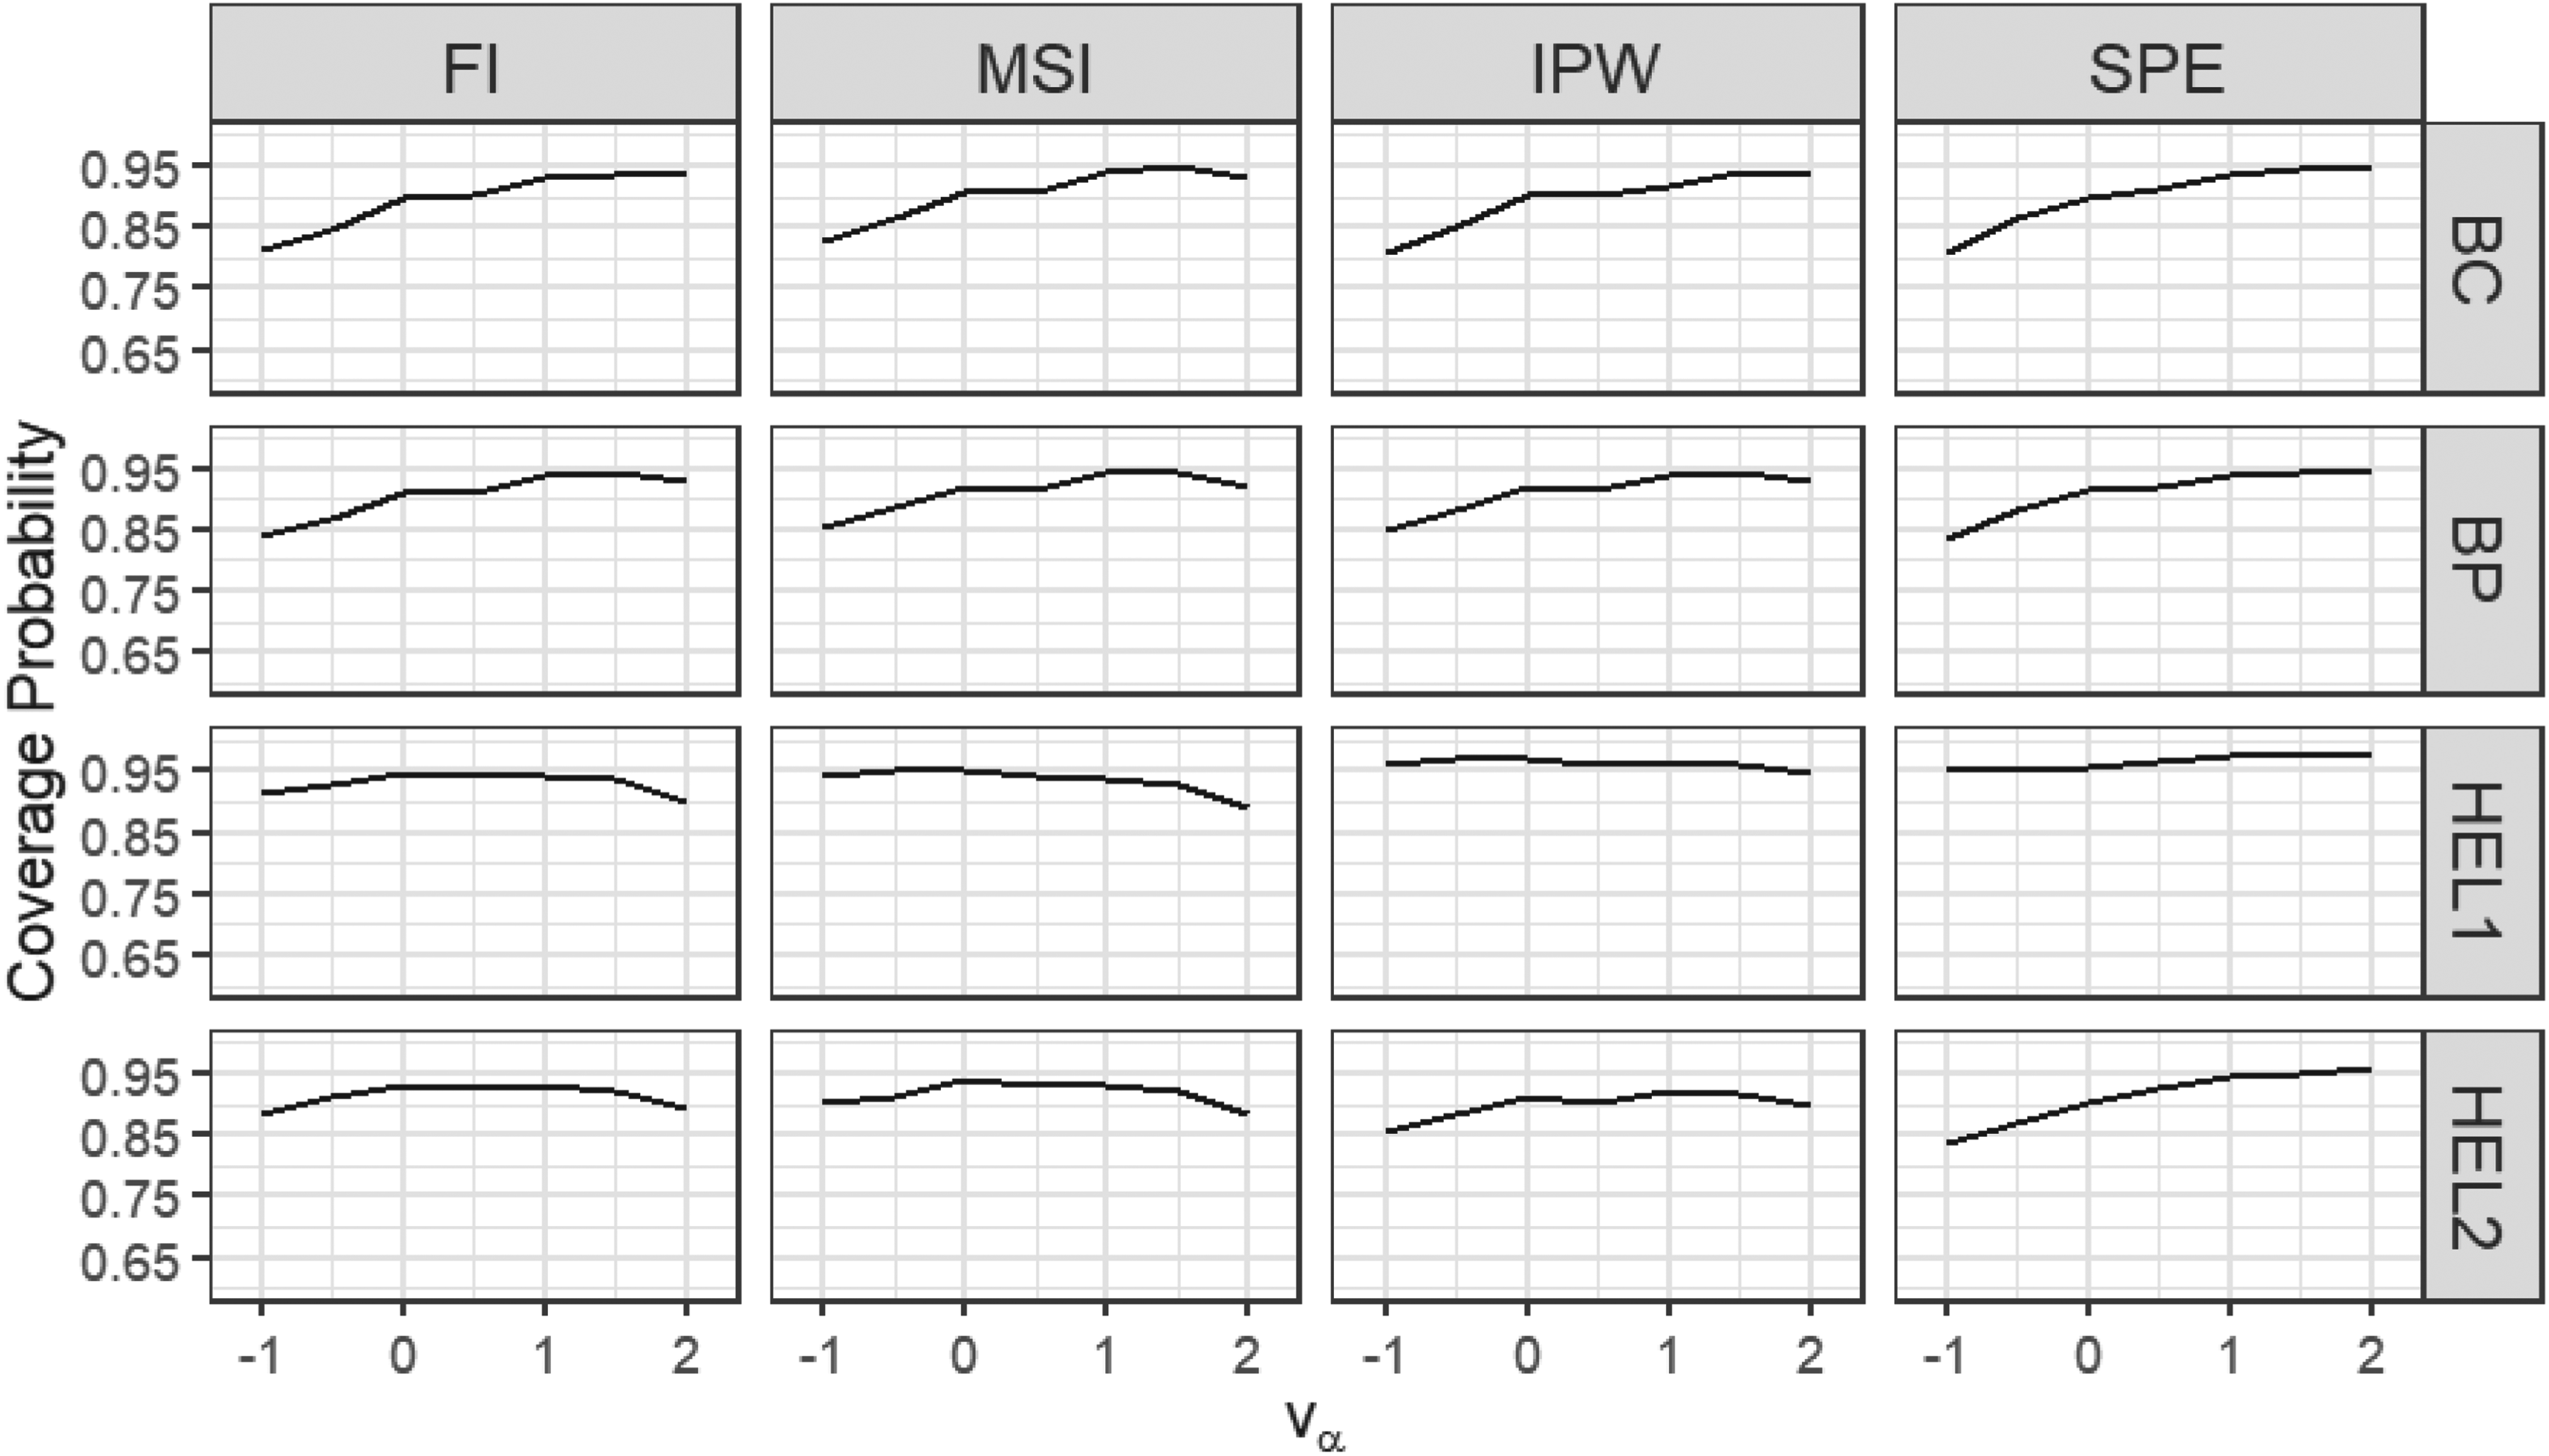
Coverage probabilities and average widths of the proposed 95% level CIs: misspecified disease model 1. CI: confidence interval.
While we have demonstrated the effectiveness of the proposed confidence intervals when both the disease model and the verification model are correctly specified, practical scenarios often involve uncertainty. In practice, we may not always know the true disease mechanism or the verification mechanism. To assess the robustness of our confidence intervals, we introduce model misspecification in this subsection. We follow simulation settings similar to those used by Alonzo and Pepe 7 and Hai and Qin, 11 which include both a misspecified disease model and a misspecified verification model.
Misspecified disease model
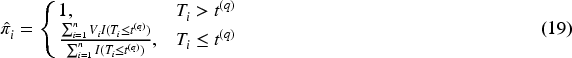
We consider two types of misspecified disease models. For the first one, recall that disease status is determined by
We then explore a second misspecified disease model, noting that the probit model (18) is correct only when the underlying distribution of the test result
We report coverage probabilities and average widths of the proposed confidence intervals using boxplots in Figures 2 and 3 and Tables 5 and 6 (in Appendix A.2, see supplemental material). In both studies, we use the correct verification model (19). In Figure 2 and Table 5 (in Appendix A.2, see supplemental material), we observe that when a relevant covariate is omitted in the disease model, all intervals using FI and MSI estimators fail to maintain adequate coverage. This is not surprising, as FI and MSI estimators rely on imputing missing disease status through a parametric disease model, making their performance heavily dependent on correct model specification. In contrast, SPE-based intervals show expected robustness by maintaining strong coverage and outperform IPW-based intervals, despite the SPE estimator’s partial dependence on the misspecified disease model. Among SPE-based methods, BP-SPE, BC-SPE, HEL1-SPE, and HEL2-SPE achieve comparable coverage, with BP-SPE and BC-SPE intervals generally being more precise.
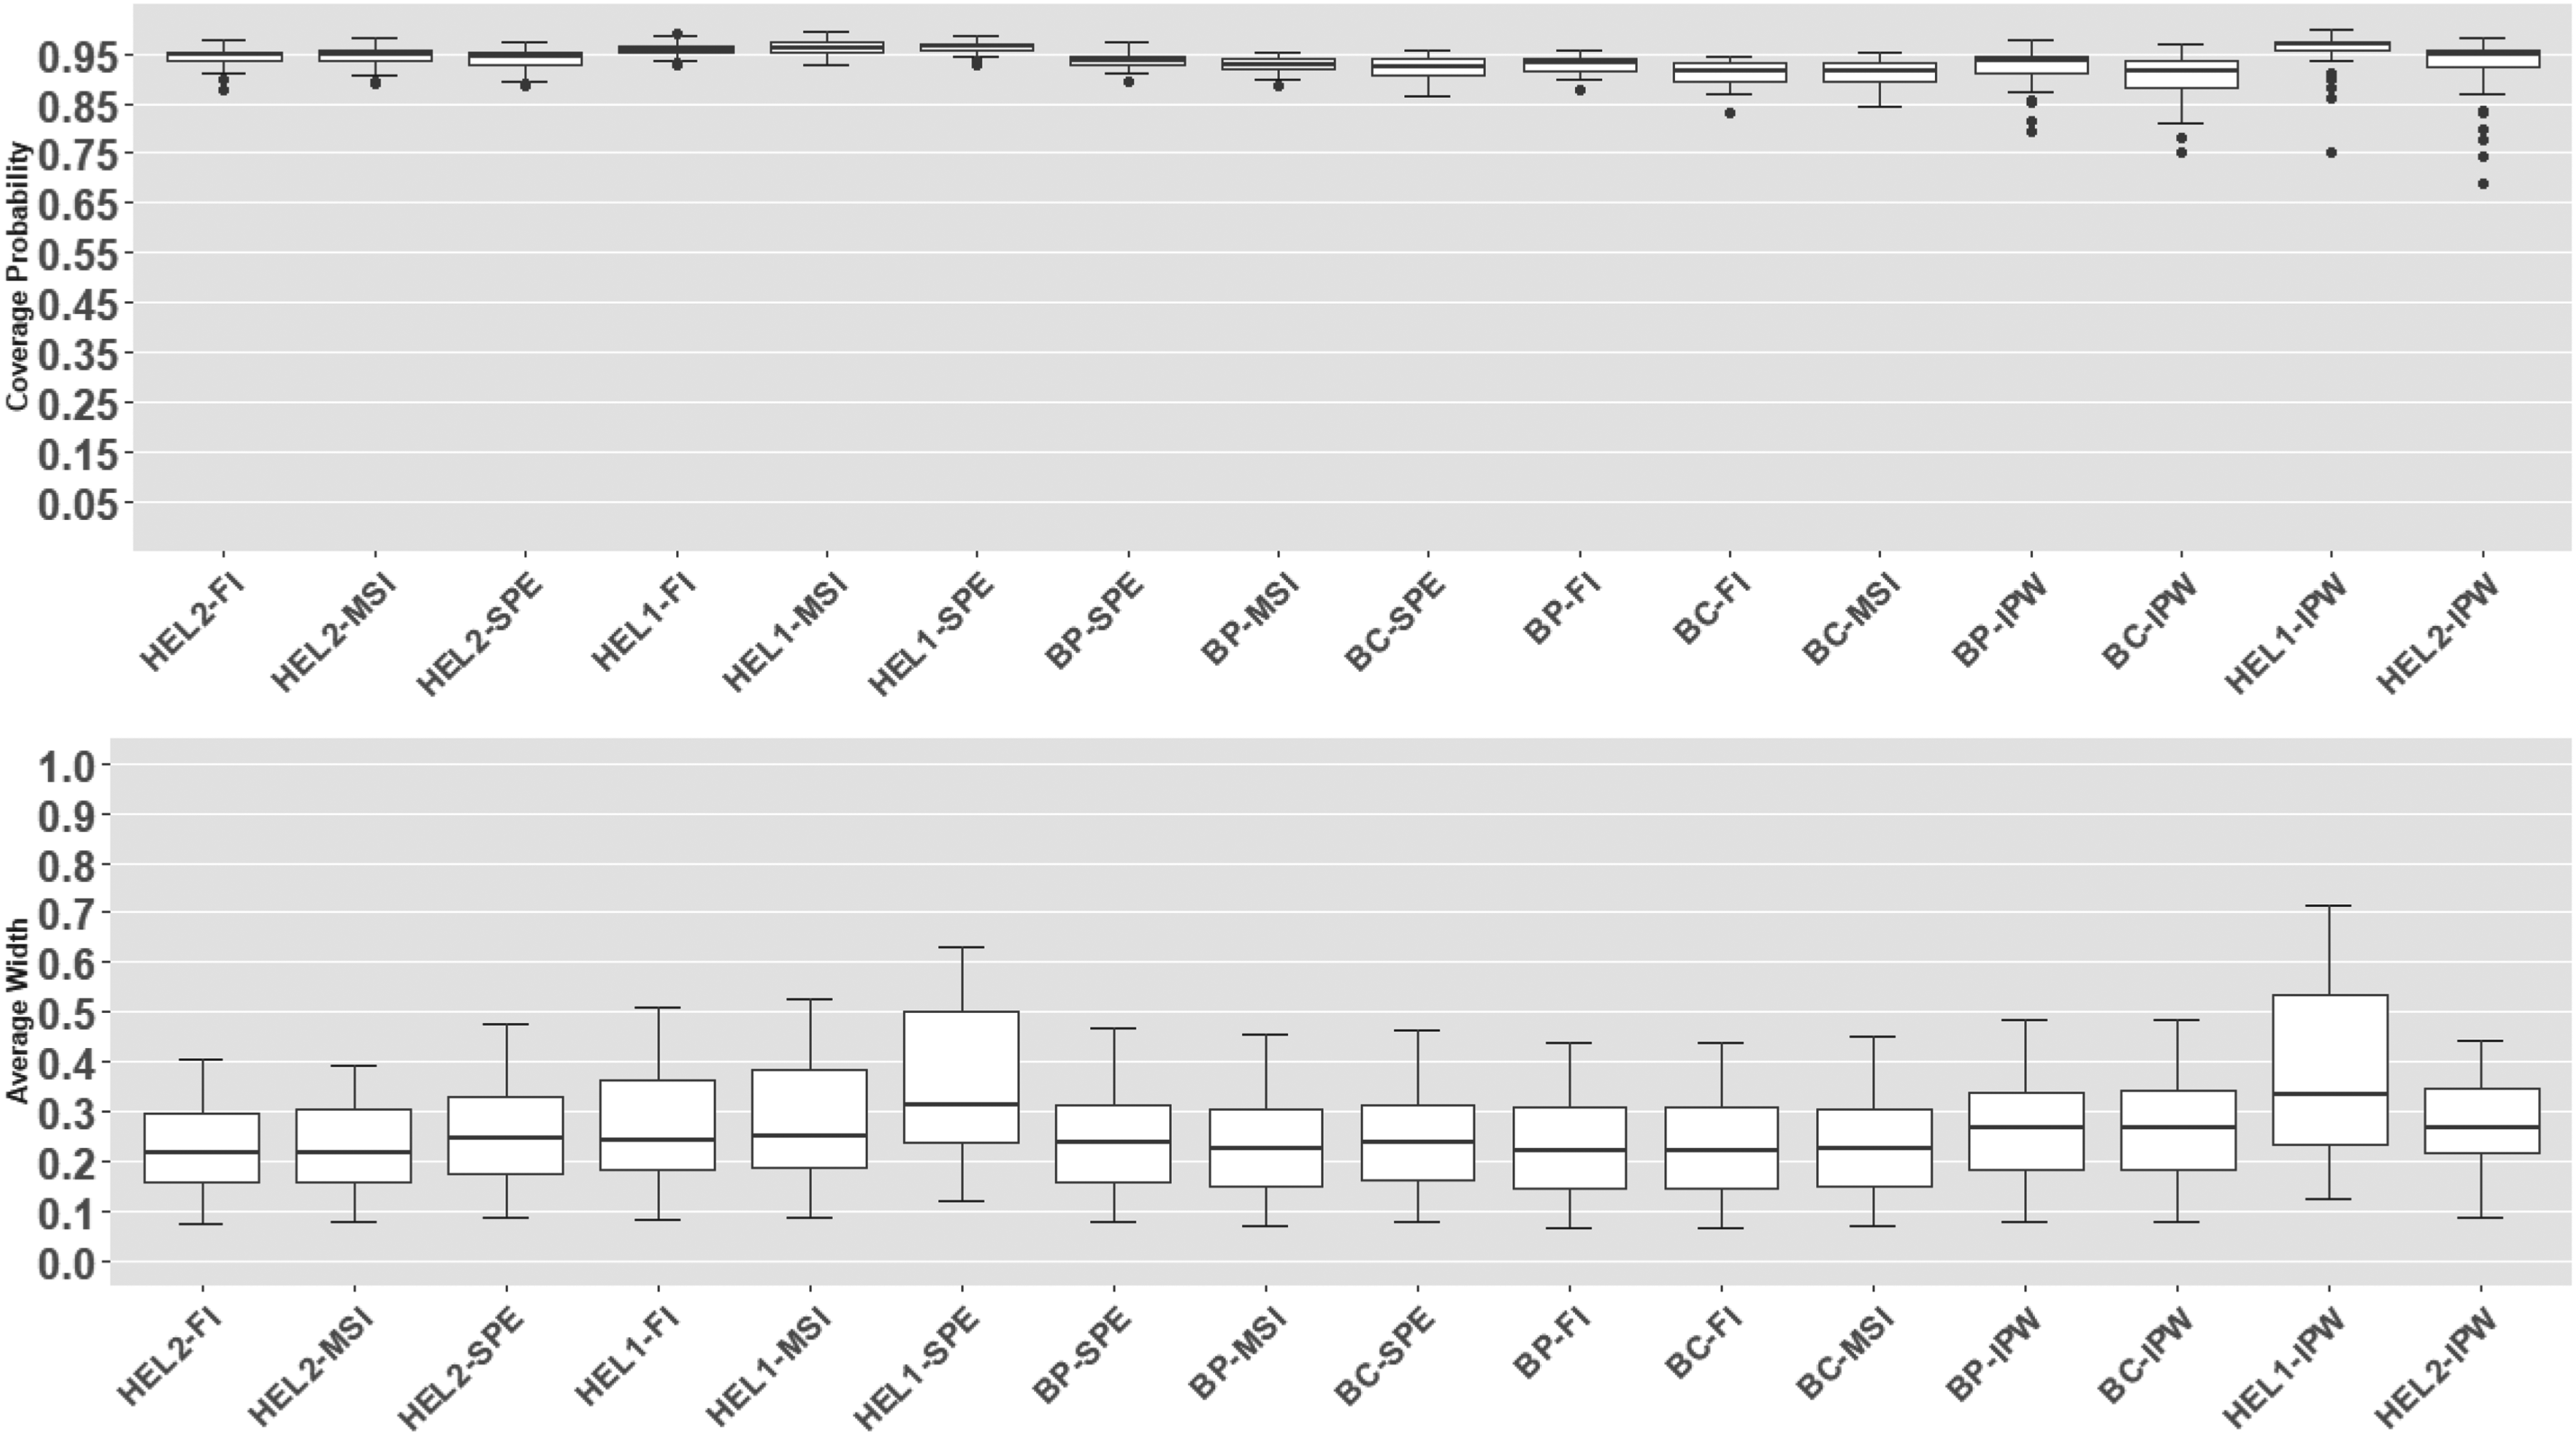
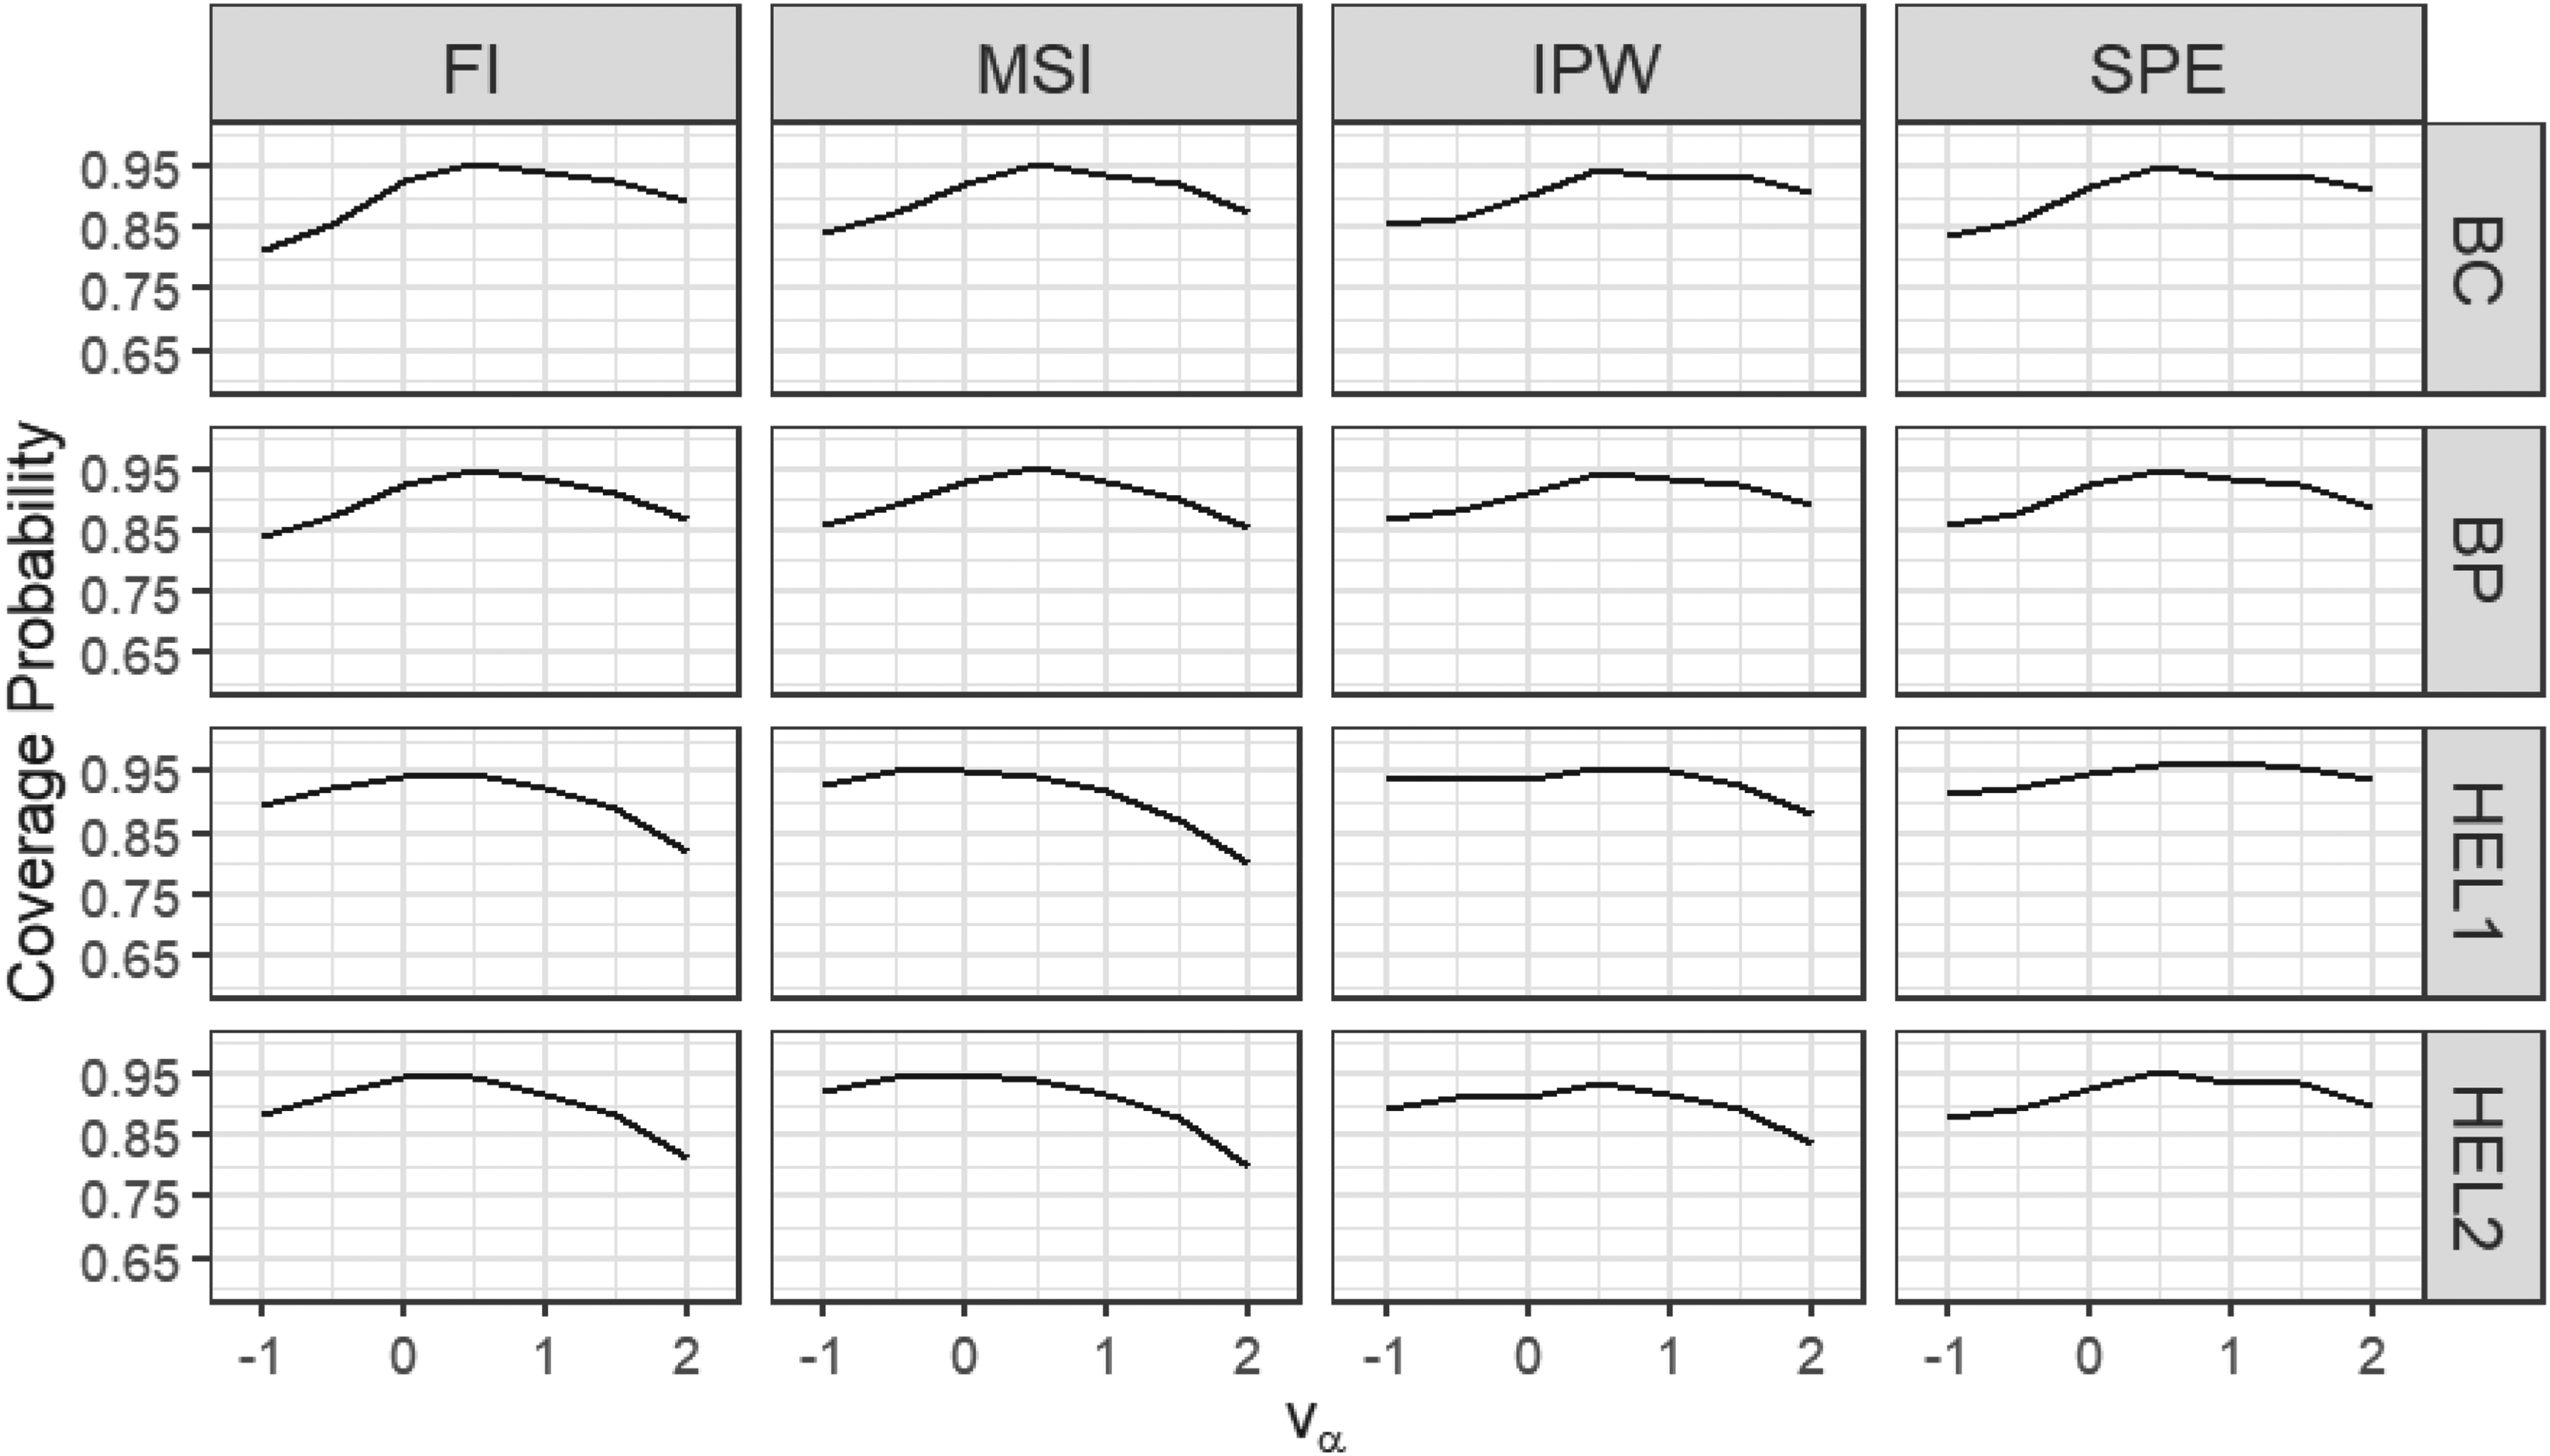
Coverage probabilities and average widths of the proposed 95% level CIs: misspecified disease model 2. CI: confidence interval.
In Figure 3 and Table 6 (in Appendix A.2, see supplemental material), we observe that when test results follow a skewed mixture of lognormal distributions, HEL2-FI and HEL2-MSI intervals using a probit disease model maintain performance comparable to that observed under the correctly specified model scenario. The HEL2–SPE interval also demonstrates reliable coverage performance, although it is generally wider. HEL1 intervals again show slight over-coverage and increased width, while BP and BC intervals exhibit slight under-coverage. Overall, these results highlight the strong robustness of our proposed HEL methods relative to traditional bootstrap intervals under disease model misspecification.
To introduce the misspecified verification model, we consider the setting where 
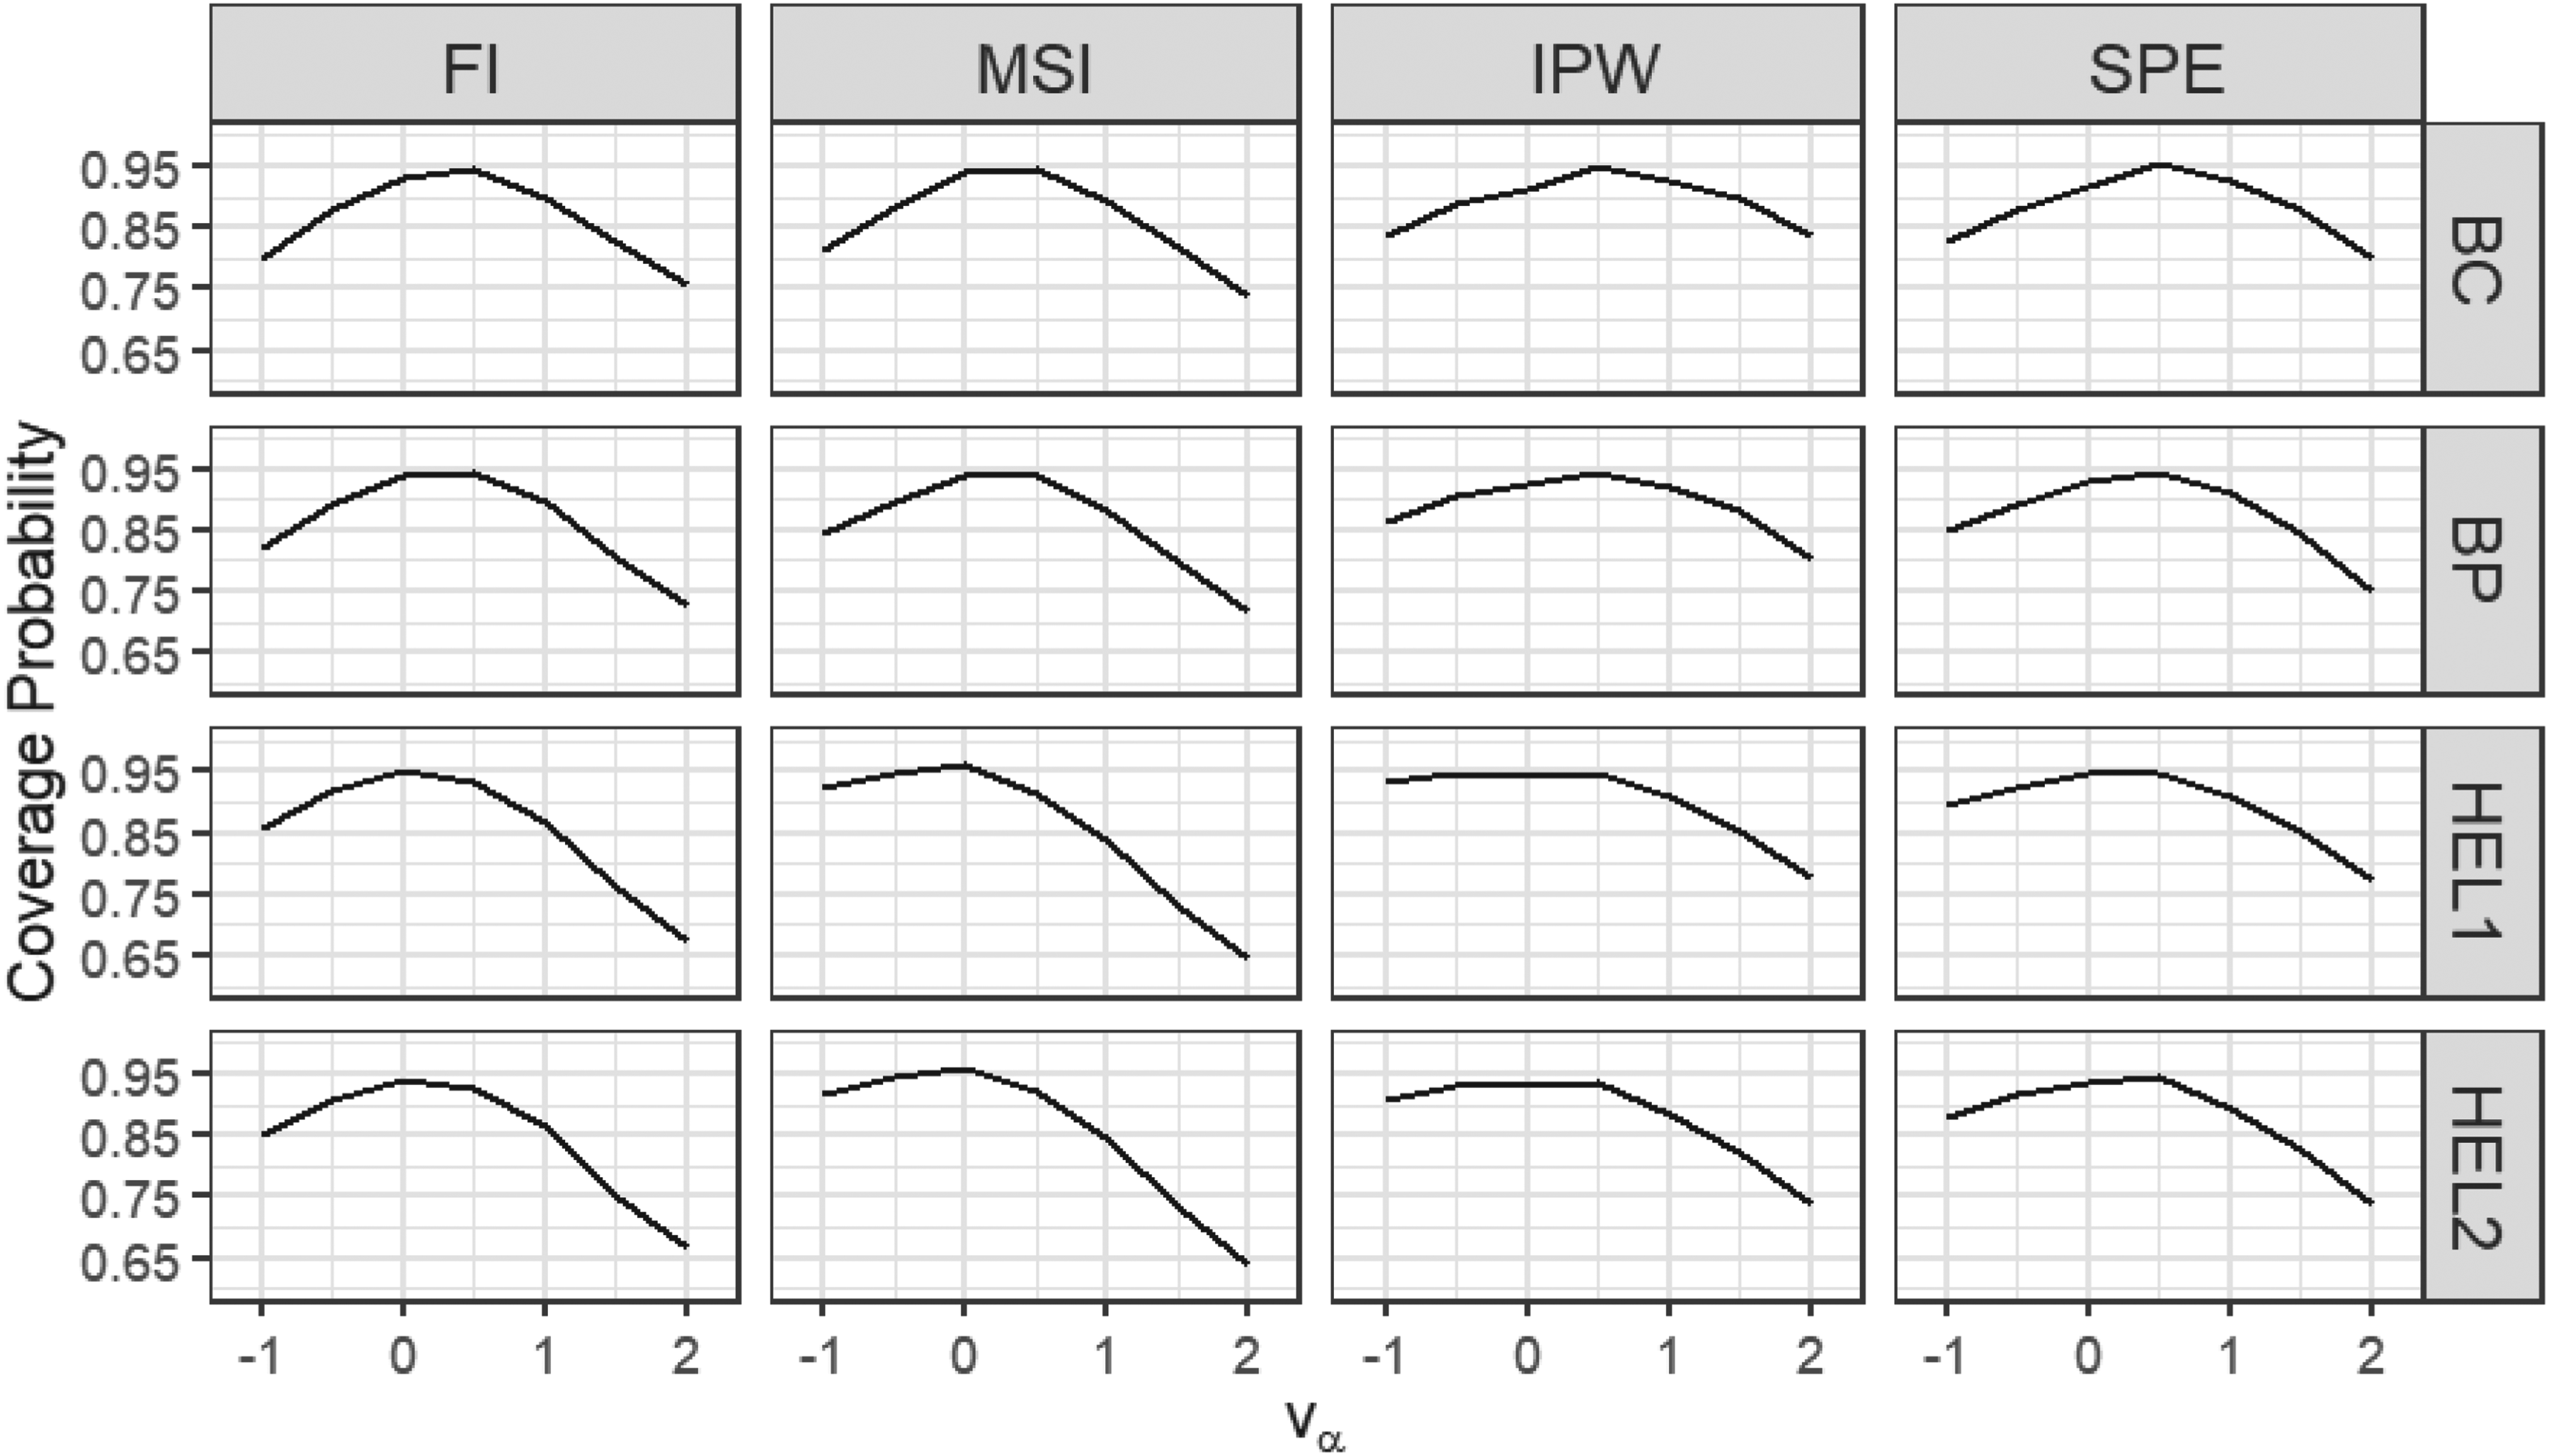
We report coverage probabilities and average widths of the proposed confidence intervals using boxplots in Figure 4 and Table 7 (in Appendix A.2, see supplemental material). We can see that when the verification model is misspecified, HEL2-FI and HEL2-MSI intervals once again yield the best coverage while preserving relatively narrow widths. BP–SPE achieves similar coverage but at the cost of wider intervals. HEL1-FI and HEL1-MSI continue to exhibit slight over-coverage and produce comparatively wider intervals.
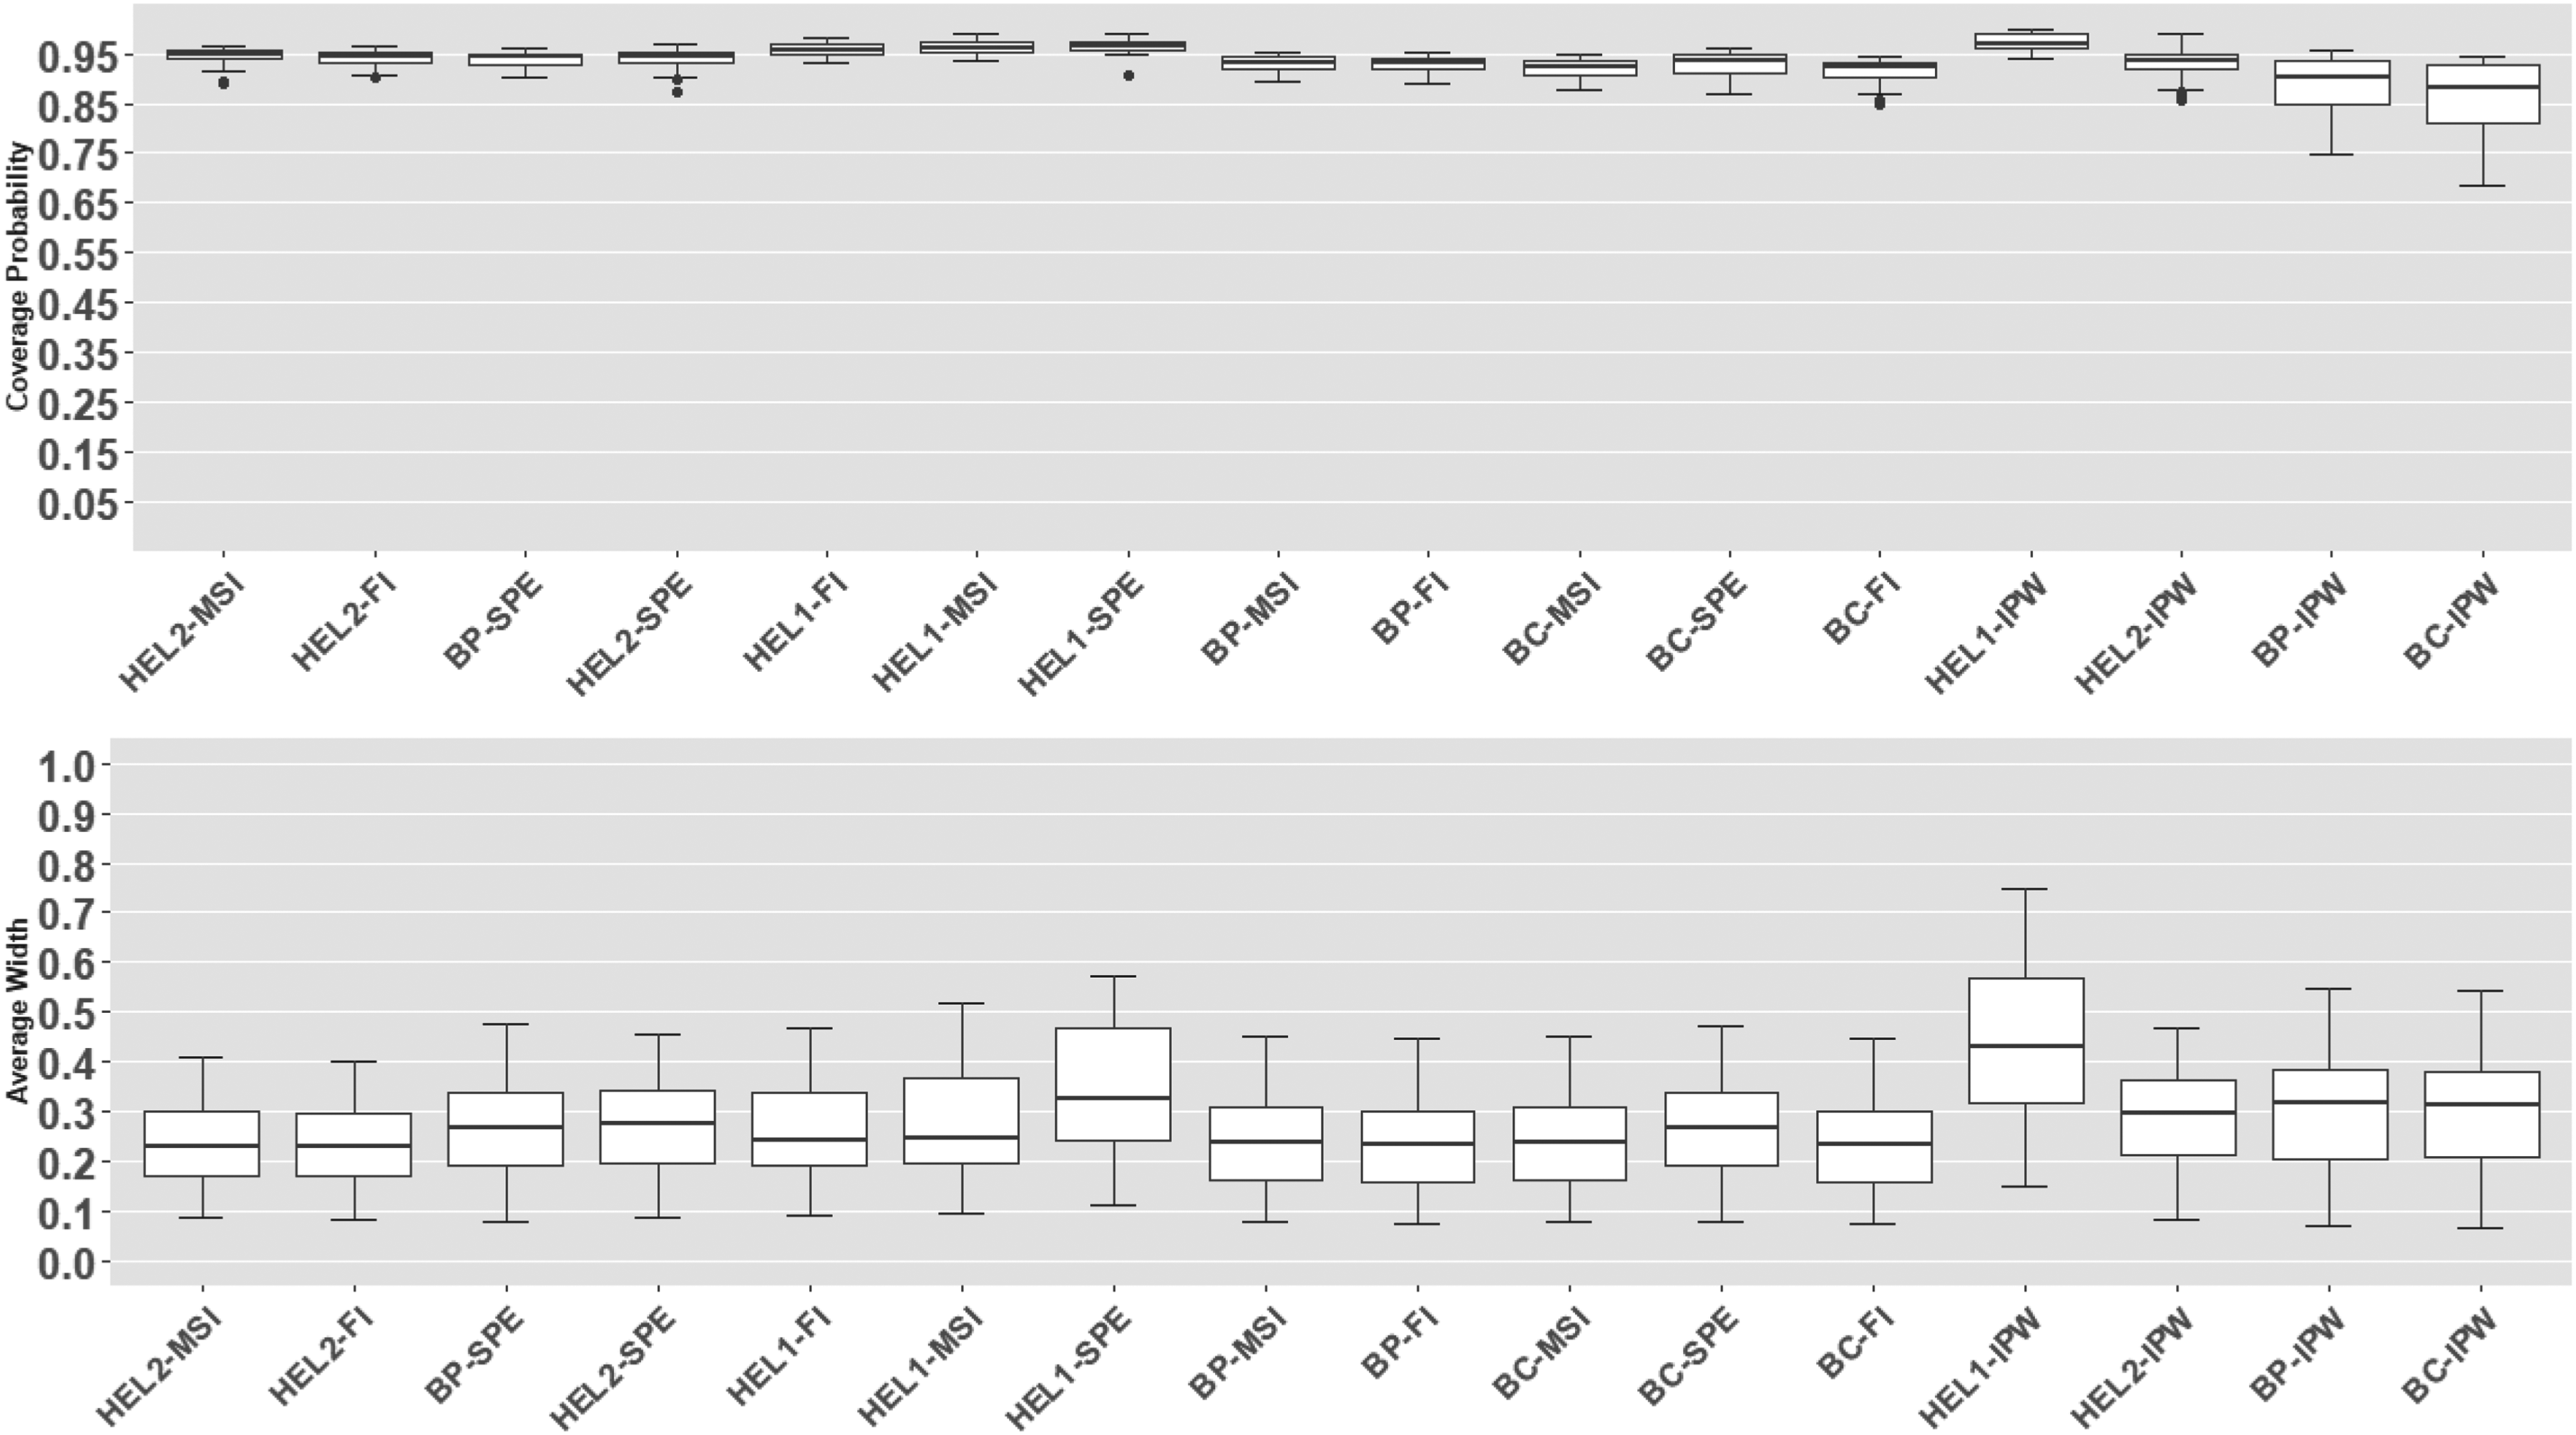
Coverage probabilities and average widths of the proposed 95% level CIs: misspecified verification model. CI: confidence interval.
In summary, across all four simulation scenarios, HEL2 intervals generally exhibit the strongest performance. In particular, HEL2-FI and HEL2-MSI perform best when the disease model is correctly specified, achieving high coverage with relatively narrow intervals. HEL2-SPE intervals provide reliable coverage across all scenarios, though occasionally at the expense of precision. HEL1 intervals typically show slight over-coverage with wider intervals. Overall, HEL2-FI and HEL2-MSI are recommended when the disease model is correctly specified, whereas HEL2-SPE intervals are preferable otherwise.
Coverage probabilities and average widths of the proposed 95% level CIs: misspecified disease and verification model. CI: confidence interval.
Coverage probabilities of the proposed 95% level CIs: sensitivity analysis,
Coverage probabilities of the proposed 95% level CIs: sensitivity analysis,
Coverage probabilities of the proposed 95% level CIs: sensitivity analysis,
So far, our proposed approaches rely on two key assumptions: that disease status is MAR and that at least one of the disease or verification models is correctly specified. To assess the robustness of our methods when either assumption is violated, we conduct a sensitivity analysis.
We first examine the scenario in which both the disease model
Next, we consider the scenario in which the MAR assumption is violated, meaning that the verification 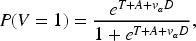
We can see that when the sample size is small (
Real data analysis
In this section, we apply the proposed methods to a real diagnostic test dataset, the Wisconsin Diagnostic Breast Cancer (WDBC) dataset. WDBC was created by Dr William H. Wolberg, W. Nick Street, and Olvi L. Mangasarian from the University of Wisconsin in 1995.33,34 In this dataset, features were computed from a digitized image of a fine needle aspirate of breast masses, and the verified diagnosis (malignant or benign) of breast masses was recorded. There are 569 instances of breast masses, each with 32 attributes, including their IDs, true diagnoses, and 30 real-valued input features. There are no missing values in the dataset. Here, we construct a subset of the WDBC data that resembles data that would be obtained from an unbalanced sample of diseased and non-diseased subjects, with 344 benign subjects and 86 malignant subjects, so the disease prevalence is 0.2.
Since each feature can be regarded as an independent continuous-scale diagnostic test for breast cancer and we have the verified disease status

Distributions of original measurements of biomarkers: malignant benign (- - - - - -).
We generate verification status similarly to Alonzo and Pepe.
7
Let the true verification model be a logit model linear in
WDBC data analysis: 95% CIs for AUC, verification proportion
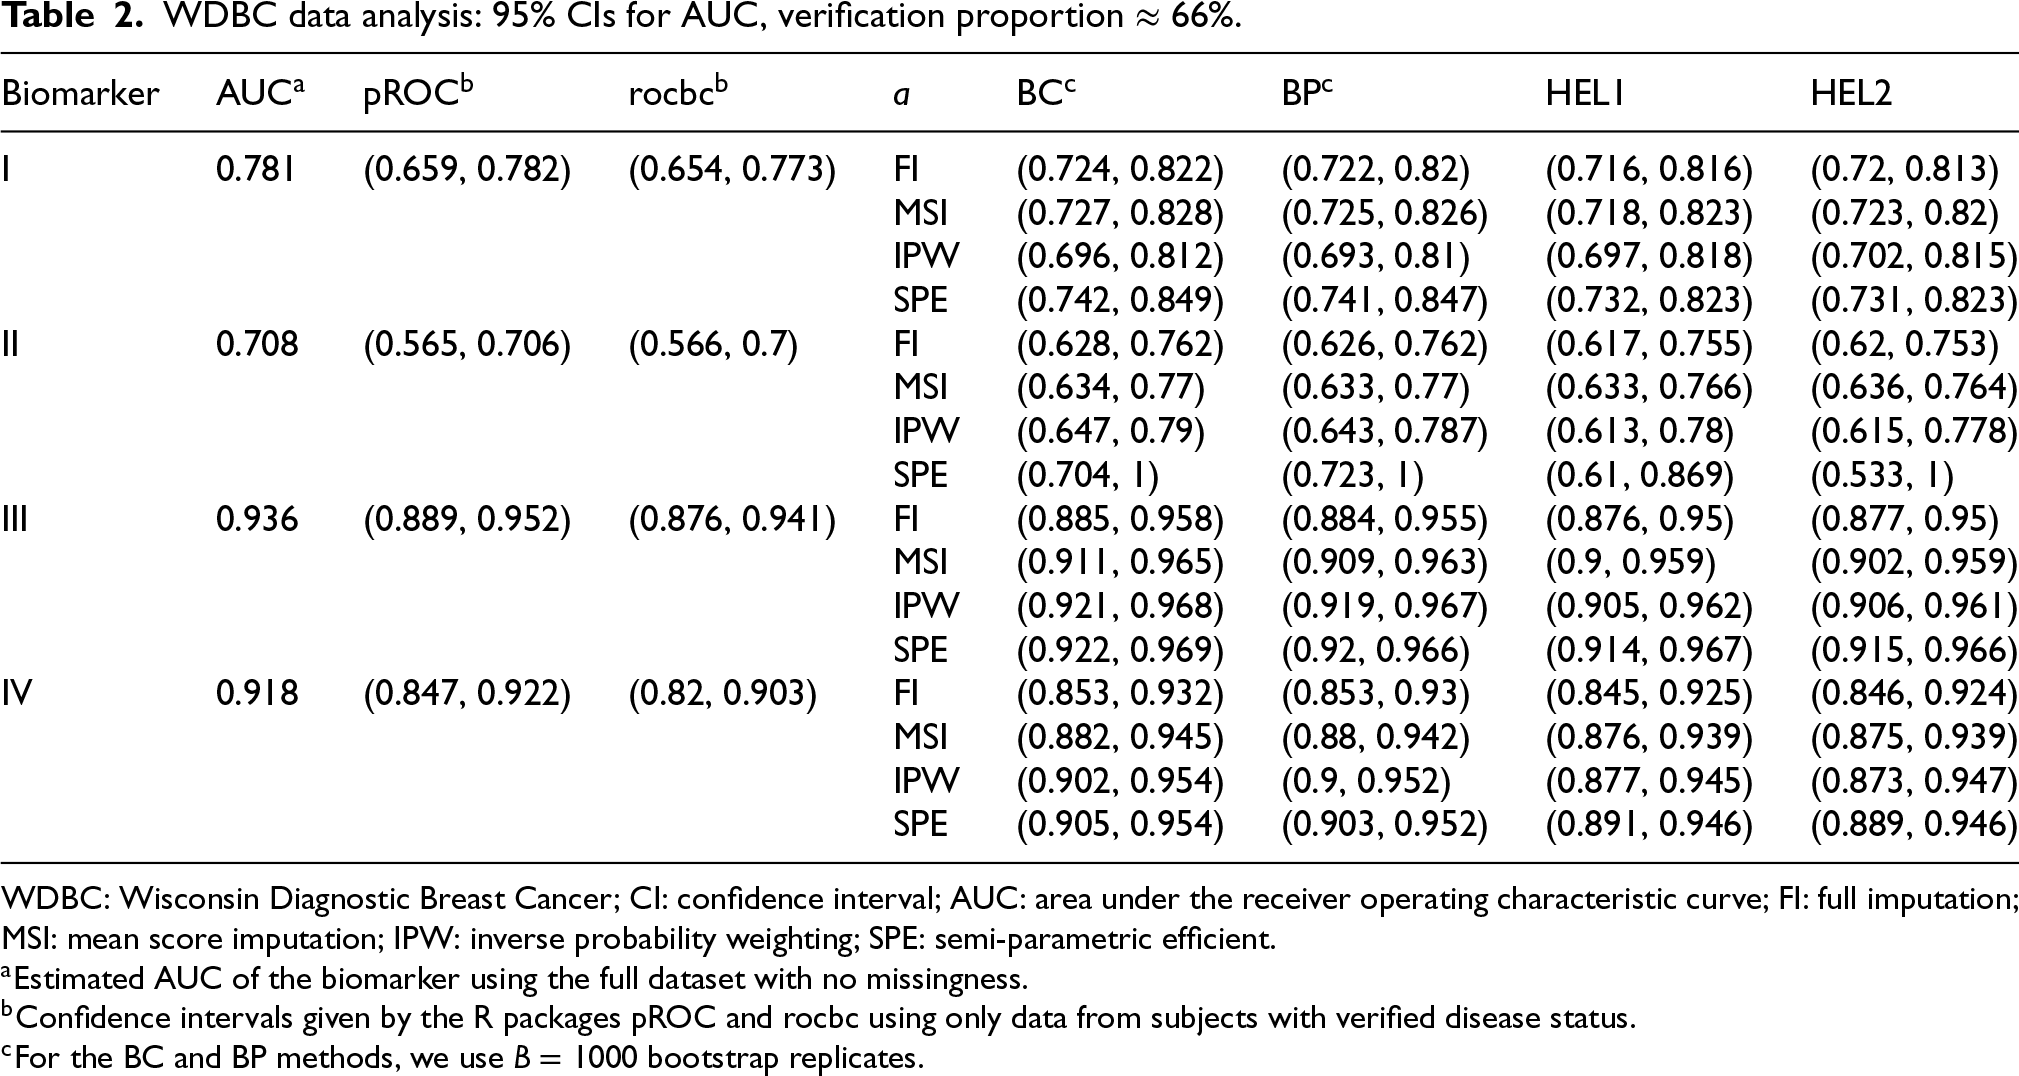
WDBC: Wisconsin Diagnostic Breast Cancer; CI: confidence interval; AUC: area under the receiver operating characteristic curve; FI: full imputation; MSI: mean score imputation; IPW: inverse probability weighting; SPE: semi-parametric efficient.
WDBC data analysis: 95% CIs for
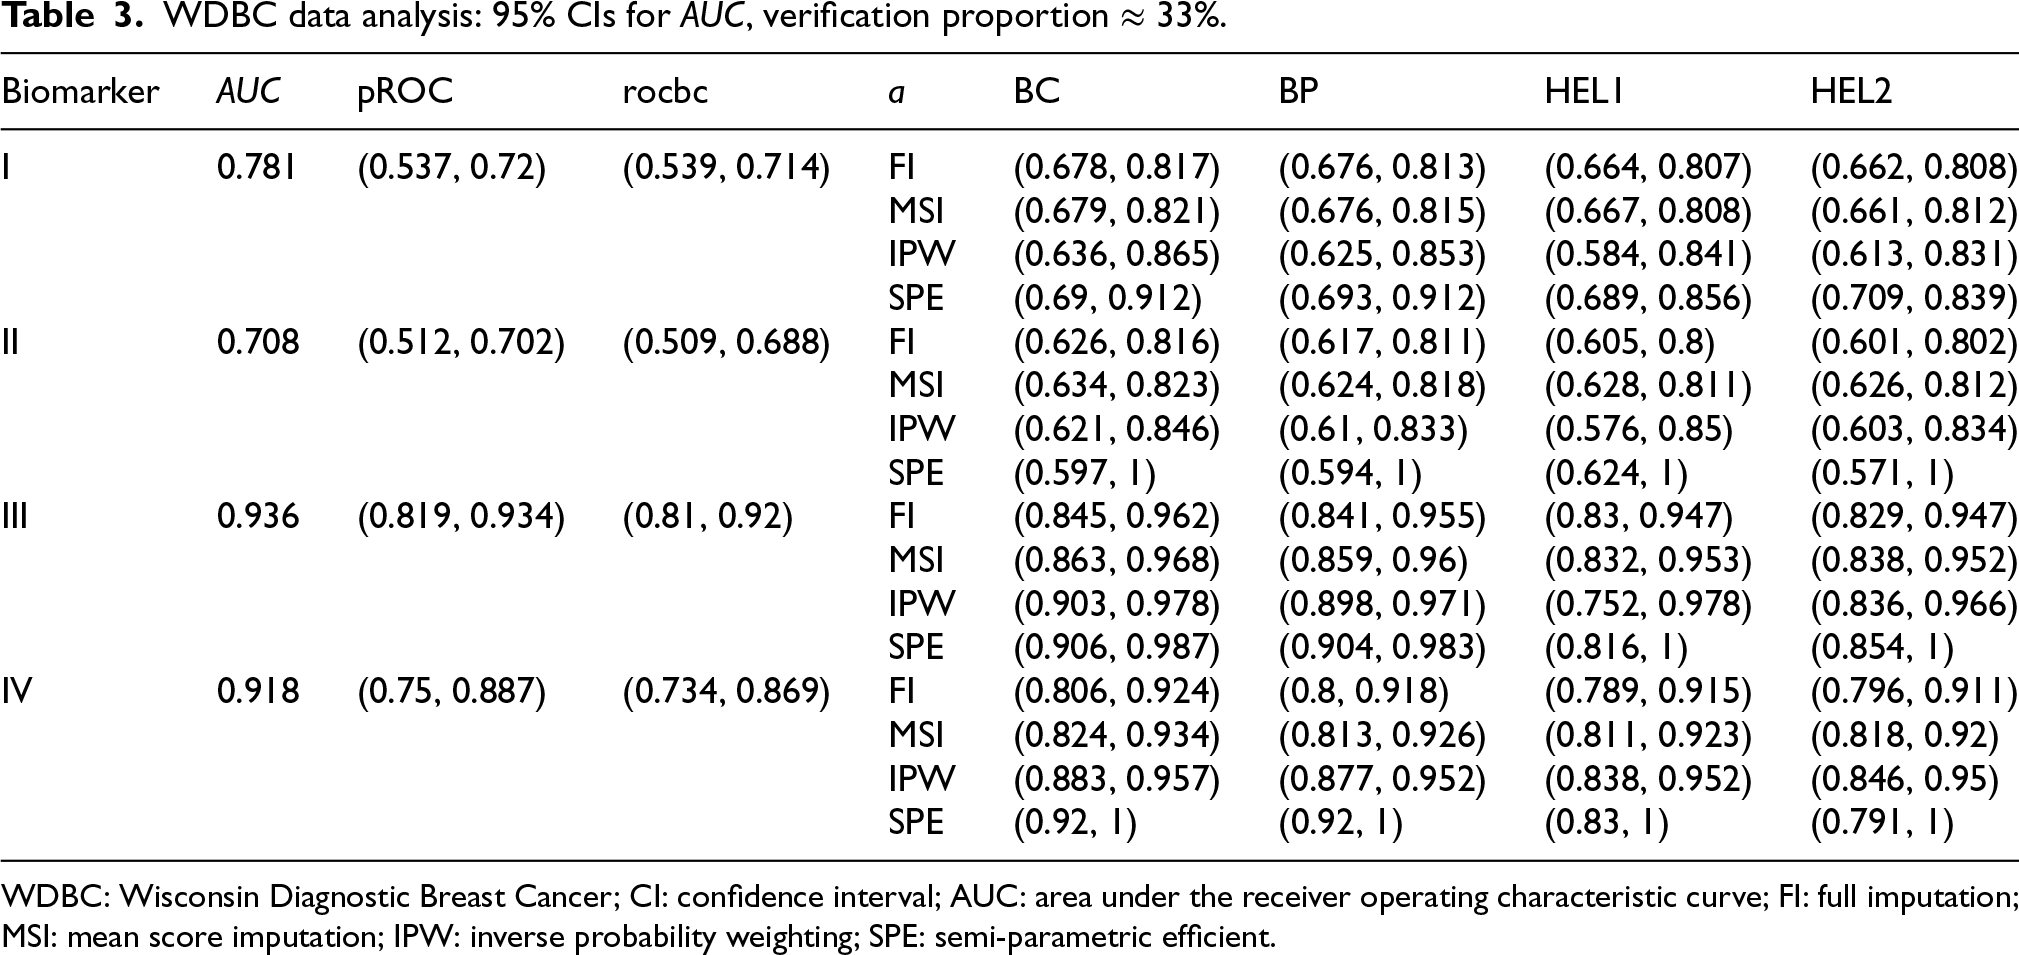
WDBC: Wisconsin Diagnostic Breast Cancer; CI: confidence interval; AUC: area under the receiver operating characteristic curve; FI: full imputation; MSI: mean score imputation; IPW: inverse probability weighting; SPE: semi-parametric efficient.
From Tables 2 and 3, we can see that when the verification proportion is around 66%, the rocbc package fails to produce correct CIs for biomarkers I, II, and IV, and the pROC package fails to produce a correct CI for biomarker II. When the verification proportion drops to 33%, both of them fail entirely as complete-case methods. In contrast, our proposed bias-corrected approaches are still able to provide correct intervals. For normal-like populations (biomarkers I and II), MSI- and FI-based intervals perform comparably well and are more precise than IPW-based intervals. The BC, BP, HEL1, and HEL2 methods yield similar results, with HEL2 showing a modest precision advantage. In skewed populations (biomarkers III and IV), MSI-based intervals remain robust while FI-based intervals become unreliable (Table 3, biomarker IV). IPW-based intervals now surpass MSI-based intervals in precision, especially when the verification proportion is low. SPE-based intervals, however, perform erratically. While adequate for biomarkers I, III, and IV, they fail or only succeed by sacrificing precision for biomarker II. This aligns with the results from the simulation studies, where we have seen greater variability in average width for SPE-based intervals. Despite this, we note that the BP-SPE and BC-SPE intervals exhibit superior precision in skewed populations (biomarkers III and IV).
The main contribution of this paper is to propose four bias-corrected confidence intervals for the AUC under the MAR assumption: two bootstrap-based approaches and two empirical likelihood (EL)-based approaches. These methods are designed to accommodate partial verification settings, in which only a subset of subjects has confirmed disease status, by leveraging the bias-corrected ROC estimators proposed by Alonzo and Pepe. 7 Through extensive simulation studies and a real-world data application, we demonstrate that the proposed HEL2 methods generally outperform other methods, and SPE-based intervals exhibit strong robustness under model misspecification. Based on our findings, when the distributions of test results in both disease and non-disease groups are approximately normal or can be made approximately normal through appropriate transformations (e.g. Box–Cox), the HEL2-MSI interval is recommended. Conversely, when normality assumptions are violated and no transformation is feasible, the HEL2-SPE method can serve as a reliable alternative. These recommendations aim to support practitioners in choosing appropriate interval estimation strategies for the AUC in real-world diagnostic studies affected by verification bias.
We conclude the paper with a discussion. First, while we recommend the use of SPE-based intervals and emphasize their “double robustness” to model misspecification, it is important to note that the SPE estimator of the ROC curve may exhibit non-monotonic behavior because both the weights
Next, we discuss some limitations of our work and outline directions for future research. While our proposed approaches primarily address two-class classification problems, an increasingly relevant scenario involves diagnostic testing for diseases that progress through multiple stages (e.g. Parkinson’s disease and Alzheimer’s disease screening). In such contexts, a multi-class framework is required, where the ROC surface and the volume under the surface, as generalizations of the ROC curve and the AUC, provide a more comprehensive measure of a test’s ability to distinguish among three or more disease states.15,40–42 It would be interesting to investigate how our approaches adapt to and perform in these multi-class diagnostic settings.
Another limitation of this work lies in its reliance on the MAR assumption for addressing verification bias. In clinical settings, especially when data are not missing by design, disease verification might depend on unobserved factors that are related to disease status, leading to missing-not-at-random (MNAR, or non-ignorable, NI) missingness. While the sensitivity analysis has shown that our approaches demonstrate reasonable robustness under mild dependence on disease status, methods are still needed for settings with stronger dependence. Some unified frameworks that accommodate both the NI and MAR mechanisms have been proposed, demonstrating that MAR can be viewed as a special case within the broader NI paradigm; see Alonzo, 43 Rotnitzky et al., 44 Fluss et al., 45 Liu and Zhou, 32 Yu et al., 46 and To. 47 This theoretical unification suggests promising directions for extending our MAR-based approach within these more general frameworks.
Finally, while the AUC provides a measure of a test’s overall diagnostic ability across all possible cutoff points, another key metric in ROC analysis, the Youden index, offers a direct assessment of the maximum correct classification rate a test can achieve. More importantly, it serves as a criterion for identifying the optimal cutoff point that yields this maximum performance. A promising direction for future research is to extend our EL-based approaches to construct bias-corrected confidence intervals for the Youden index. Some work has already addressed this problem,48–50 and further exploration could enhance the precision and interpretability of diagnostic decision-making.
Supplemental Material
sj-pdf-1-smm-10.1177_09622802261455678 - Supplemental material for Empirical likelihood inference for the area under the receiver operating characteristic (ROC) curve with verification biased data
Supplemental material, sj-pdf-1-smm-10.1177_09622802261455678 for Empirical likelihood inference for the area under the receiver operating characteristic (ROC) curve with verification biased data by Shirui Wang, Shuangfei Shi and Gengsheng Qin in Statistical Methods in Medical Research
Footnotes
Funding
The authors received no financial support for the research, authorship, and/or publication of this article.
Declaration of conflicting interests
The authors declared no potential conflicts of interest with respect to the research, authorship, and/or publication of this article.
Supplemental material
Supplemental material for this article is available online.
References
Supplementary Material
Please find the following supplemental material available below.
For Open Access articles published under a Creative Commons License, all supplemental material carries the same license as the article it is associated with.
For non-Open Access articles published, all supplemental material carries a non-exclusive license, and permission requests for re-use of supplemental material or any part of supplemental material shall be sent directly to the copyright owner as specified in the copyright notice associated with the article.