
Abstract
Recurrent health events often involve complex inter-relationships between longitudinal biomarkers and time-to-event outcomes, further complicated by sparse, irregular data collection and time-dependent correlations among events. Traditional statistical methods frequently struggle with these complexities, resulting in biased estimates and suboptimal modeling performance. To address these challenges, we propose the
Keywords
Introduction
Understanding disease progression often involves analyzing two inter-related outcomes: repeated measurements of biomarkers or health indicators (i.e. longitudinal data), and the occurrence of major health events over time (i.e. time-to-event outcomes). Recurrent events, in particular, provide valuable insights by capturing patterns, timing, and dependencies across multiple occurrences. These relationships are essential for predicting and managing conditions such as kidney stone recurrence, cardiovascular events, and cancer progression. Joint modeling approaches are commonly employed to analyze longitudinal biomarkers and recurrent events, typically using latent class joint models 1 or shared frailty models.2–4 However, these approaches often depend on rigid parametric assumptions that oversimplify real-world data by imposing predefined trajectory structures, such as linear mixed-effects models.1–3 Such models frequently fail to capture the complex and heterogeneous patterns observed in longitudinal data, especially when those patterns diverge from assumed parametric forms. Consequently, dynamic disease processes are simplified into static metrics, such as current values or slopes, resulting in biased or incomplete inferences.
Functional data analysis (FDA) provides a more flexible, nonparametric alternative by treating longitudinal data as continuous functions over time rather than discrete observations. Unlike linear mixed models, which impose parametric assumptions on trajectories, FDA accommodates complex temporal trends without imposing strong model constraints. In particular, functional principal component analysis (FPCA) derives smooth, low-dimensional representations of individual trajectories, allowing for deeper insights into underlying disease dynamics. Several methods have been developed to adapt FDA for longitudinal data,5–7 including approaches designed to handle sparse or irregular time observations.8–12
Beyond longitudinal modeling alone, FDA has been extended to link longitudinal data with single-event outcomes. For example, Yao et al. 8 proposed a nonparametric approach that jointly models longitudinal trajectories and time-to-event data by using flexible basis functions and incorporating functional principal component (FPC) scores into a Cox regression model to characterize disease progression. Applications of FDA span diverse areas, including high-dimensional gene expression data, 13 dynamic disease progression prediction, 14 and functional imaging analysis, 15 among others. More recently, Yang et al. 16 introduced a weighted functional linear Cox regression model that employs subject-specific inverse probability of censoring weights. Similarly, Cui et al. 17 developed an additive functional Cox regression model to quantify the association between functional covariates and time-to-event outcomes, applying transformations to better capture the inherent complexity of functional covariates.
While significant progress has been made in applying FDA to time-to-event data, most existing methods have focused on single-event settings, and extensions to recurrent event modeling remain relatively limited. Recurrent events, such as kidney stone recurrence, cardiovascular events, or hospital readmission, offer a more detailed perspective on disease evolution by accounting for both the timing and sequence of occurrences. However, modeling such events poses unique challenges, including time-dependent correlations among occurrences and evolving biomarker-event relationships. Classic recurrent event models, such as the Andersen–Gill model, 18 the Prentice–Williams–Peterson model, 19 the Wei–Lin–Weissfeld model, 20 as well as frailty models, 21 rarely integrate longitudinal biomarker trajectories, limiting their capacity to capture dynamic interactions between biomarkers and events. Although recent work by Hong et al. 22 proposed a joint frailty model using FPCA for recurrent and terminal events, their focus was primarily on dynamic prediction, rather than inference on time-varying functional covariate effects.
We propose the
This paper is organized as follows. Section 2 presents an overview of FPCA and the formulation of the FRAILTY method for analyzing recurrent events. Section 3 evaluates performance of the FRAILTY method through simulation studies, comparing its effectiveness against existing methods. Section 4 demonstrates its practical utility through applications to two datasets: the Systolic Blood Pressure Intervention Trial study and the Multicenter Collaboration to Study Treatment Outcomes in Nephrolithiasis Evaluation cohort. Finally, Section 5 concludes with a discussion of the findings, their implications, and potential directions for future research.
Methodology
Overview of functional principal component analysis (FPCA)
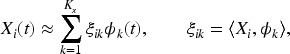
Consider a sample of
Assuming that the covariance function
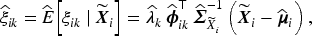
For densely observed data, the FPC scores
FPCA provides several advantages in modeling longitudinal trajectories. It decomposes a complex stochastic process into orthogonal eigenfunctions weighted by uncorrelated FPC scores, capturing dominant patterns in the data while reducing dimensionality. This basis truncation enables regularization and emphasizes interpretable signal components. Moreover, the nonparametric estimation of the mean and covariance functions supports a data-driven modeling approach that avoids restrictive assumptions.
FRAILTY: F unctional R egression with A utoregressI ve fraiLTY method
Notation
In recurrent event settings, a subject may experience the same event multiple times during follow-up. To characterize the association between the recurrent event process and longitudinal covariate trajectories, we formulate the model in terms of functional covariates. For simplicity, we present the method using a single functional covariate; however, the proposed method can accommodate multiple longitudinal covariates (see Section 2.4). For subject
Model formulation
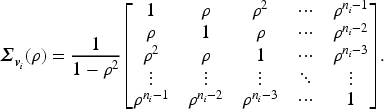
We model the recurrent event process using a gap-time proportional hazard framework that incorporates both scalar and functional covariates, together with subject-specific frailty terms. We assume a non-informative censoring mechanism; specifically, conditional on the covariates and frailty terms, the recurrent event process is independent of the censoring time. Extending the correlated frailty framework of Yau et al.,
23
we specify the hazard function for subject

The term
Let
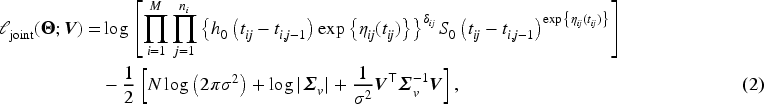
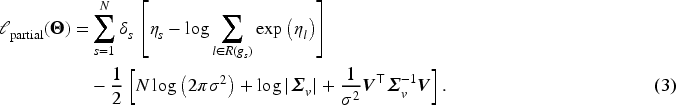
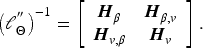
To eliminate the unspecified baseline hazard function
Two-step estimation procedure for the FRAILTY method
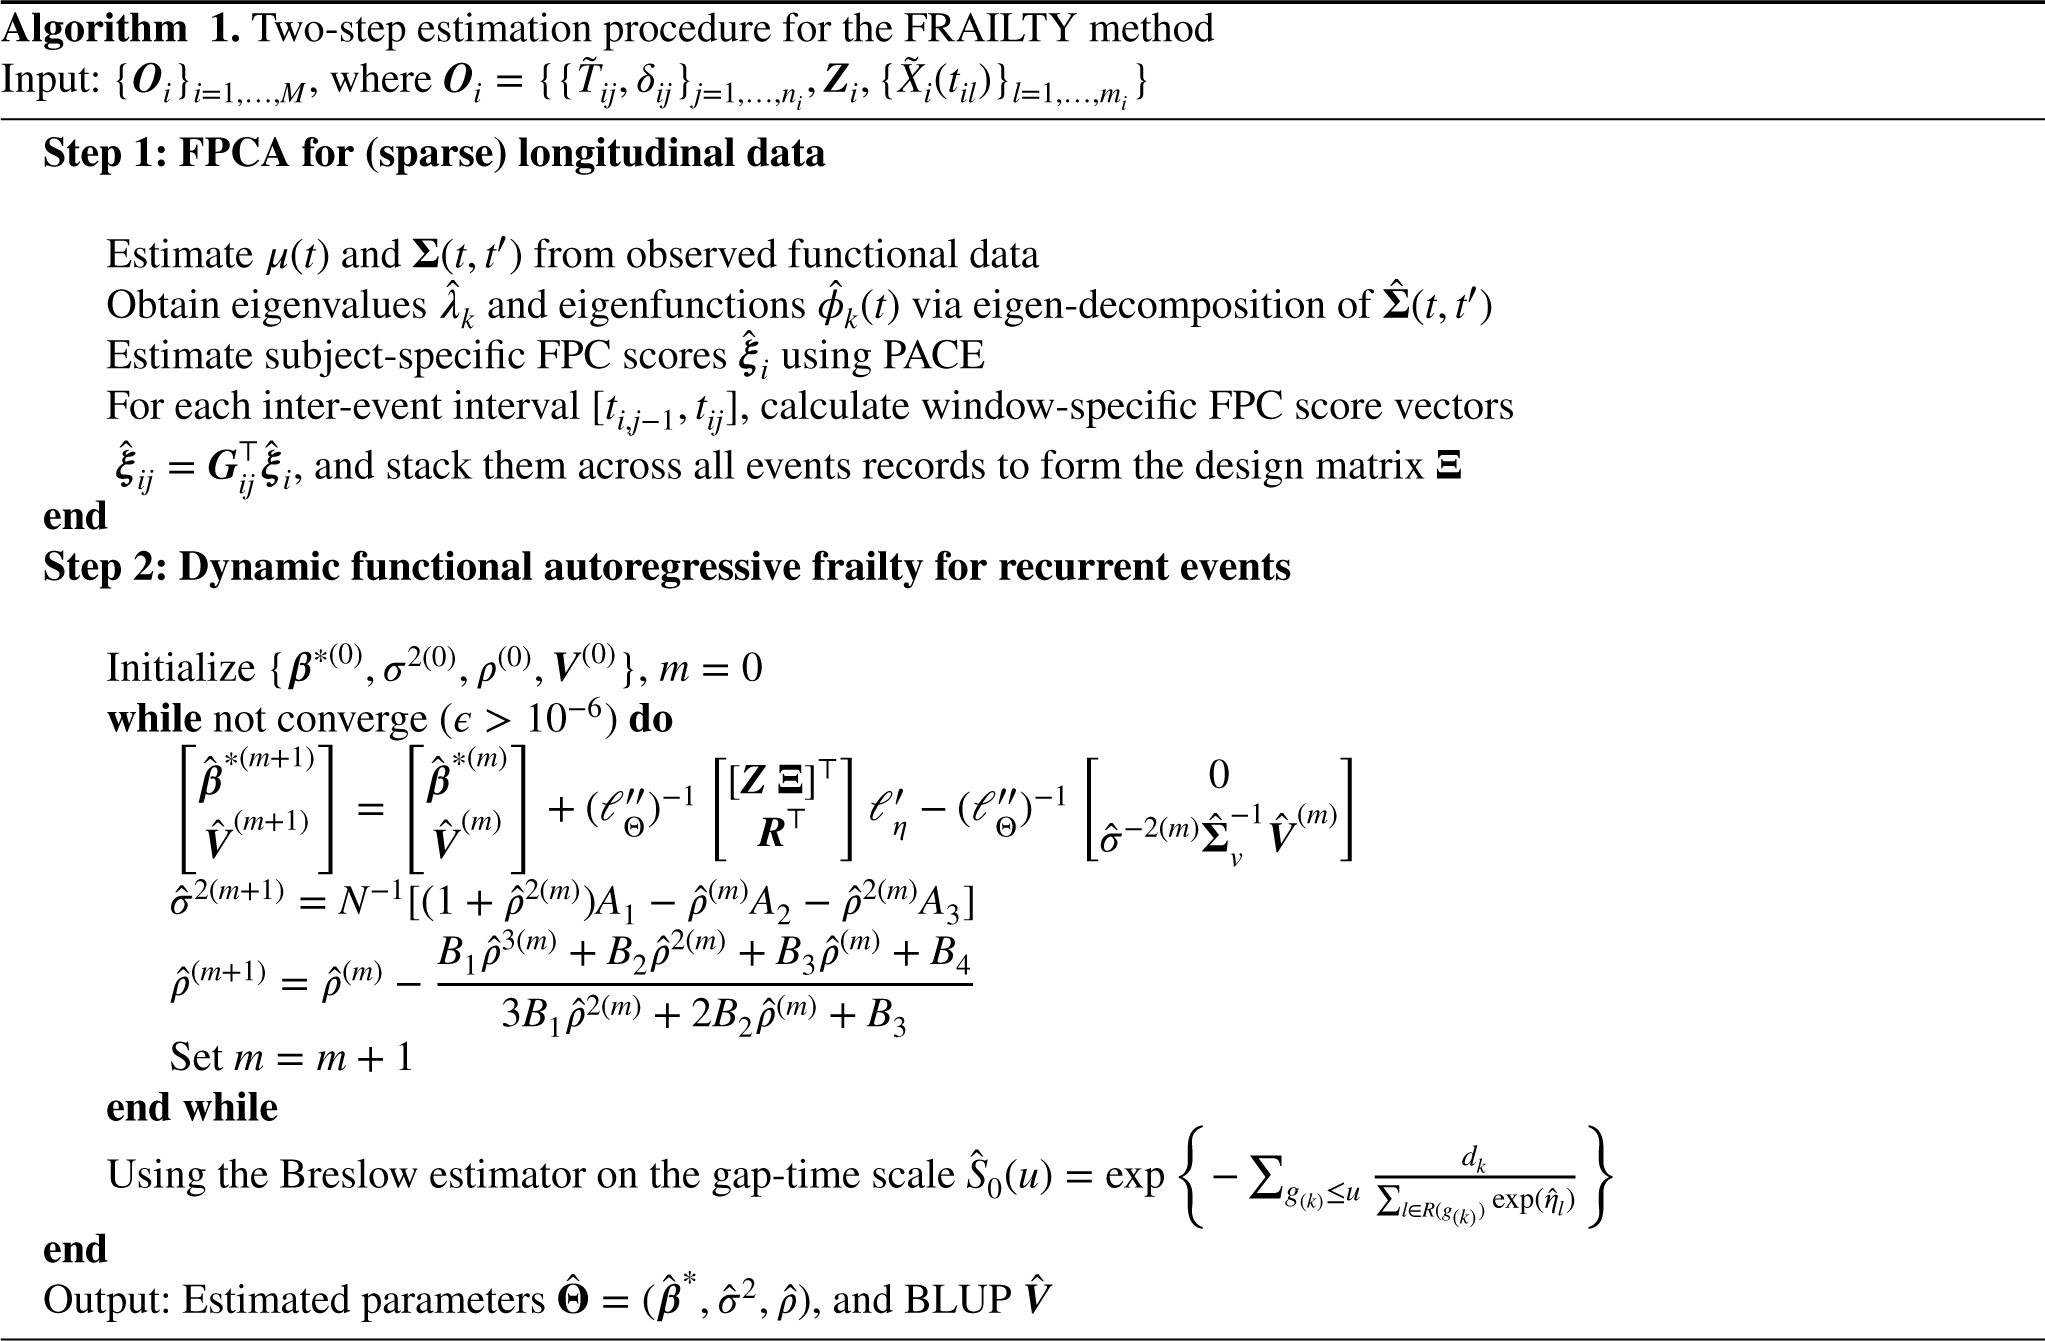
The proposed FRAILTY method employs a two-step estimation strategy. In the first step, FPCA is applied to (sparse) longitudinal data to extract principal components and compute event-specific scores. In the second step, a recurrent event model with dynamic frailty is fitted using the partial likelihood derived in Section 2.2.3. Below, we detail each step of the procedure, which is summarized in Algorithm 1.
We assume that the coefficient function
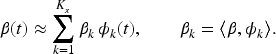
Substituting the truncated expansions of
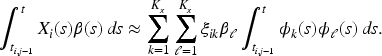
Let

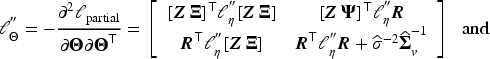
Hypothesis testing for functional parameters
To assess the association between the functional covariates and the recurrent event outcome, we consider the following null and alternative hypotheses


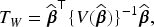
As the sample size
mFRAILTY: Extension to multivariate functional covariates
In many clinical scenarios, multiple functional processes may simultaneously influence the time-to-event outcome, such as several longitudinal biomarkers measured over time. These functional covariates are often correlated and ignoring such dependence may lead to suboptimal modeling and loss of efficiency. To accommodate this setting, we extend the FRAILTY framework to incorporate multivariate functional covariates. Let
Apply univariate FPCA to each functional covariate Combine the estimated FPC scores across all functional covariates into a single matrix. Let Perform eigen-decomposition of Use eigenvectors For each inter-event interval
Simulation
Data-generating mechanisms
To evaluate the performance of the proposed FRAILTY method, we conducted a simulation study following the setup described in Goldsmith et al.
29
We generated a single observed functional covariate Constant effect: Smooth periodic oscillation effect: Cyclic variation: Irregular fluctuations:
These scenarios encompass a spectrum of dynamic behaviors, from simple constant effects to more complex time-dependent patterns. In addition to the functional covariate, we incorporated a binary scalar covariate drawn from a Bernoulli distribution with a success probability of
Simulations were conducted for sample sizes
Finally, to assess statistical power of FRAILTY under the cyclic variation scenario, we tested
We assessed the performance of the proposed FRAILTY method in estimating the functional coefficient
We further evaluated the model’s discriminative ability using the time-dependent concordance index (C-index) of Kim et al.,
32
designed for recurrent event data. It is defined as

Simulation results
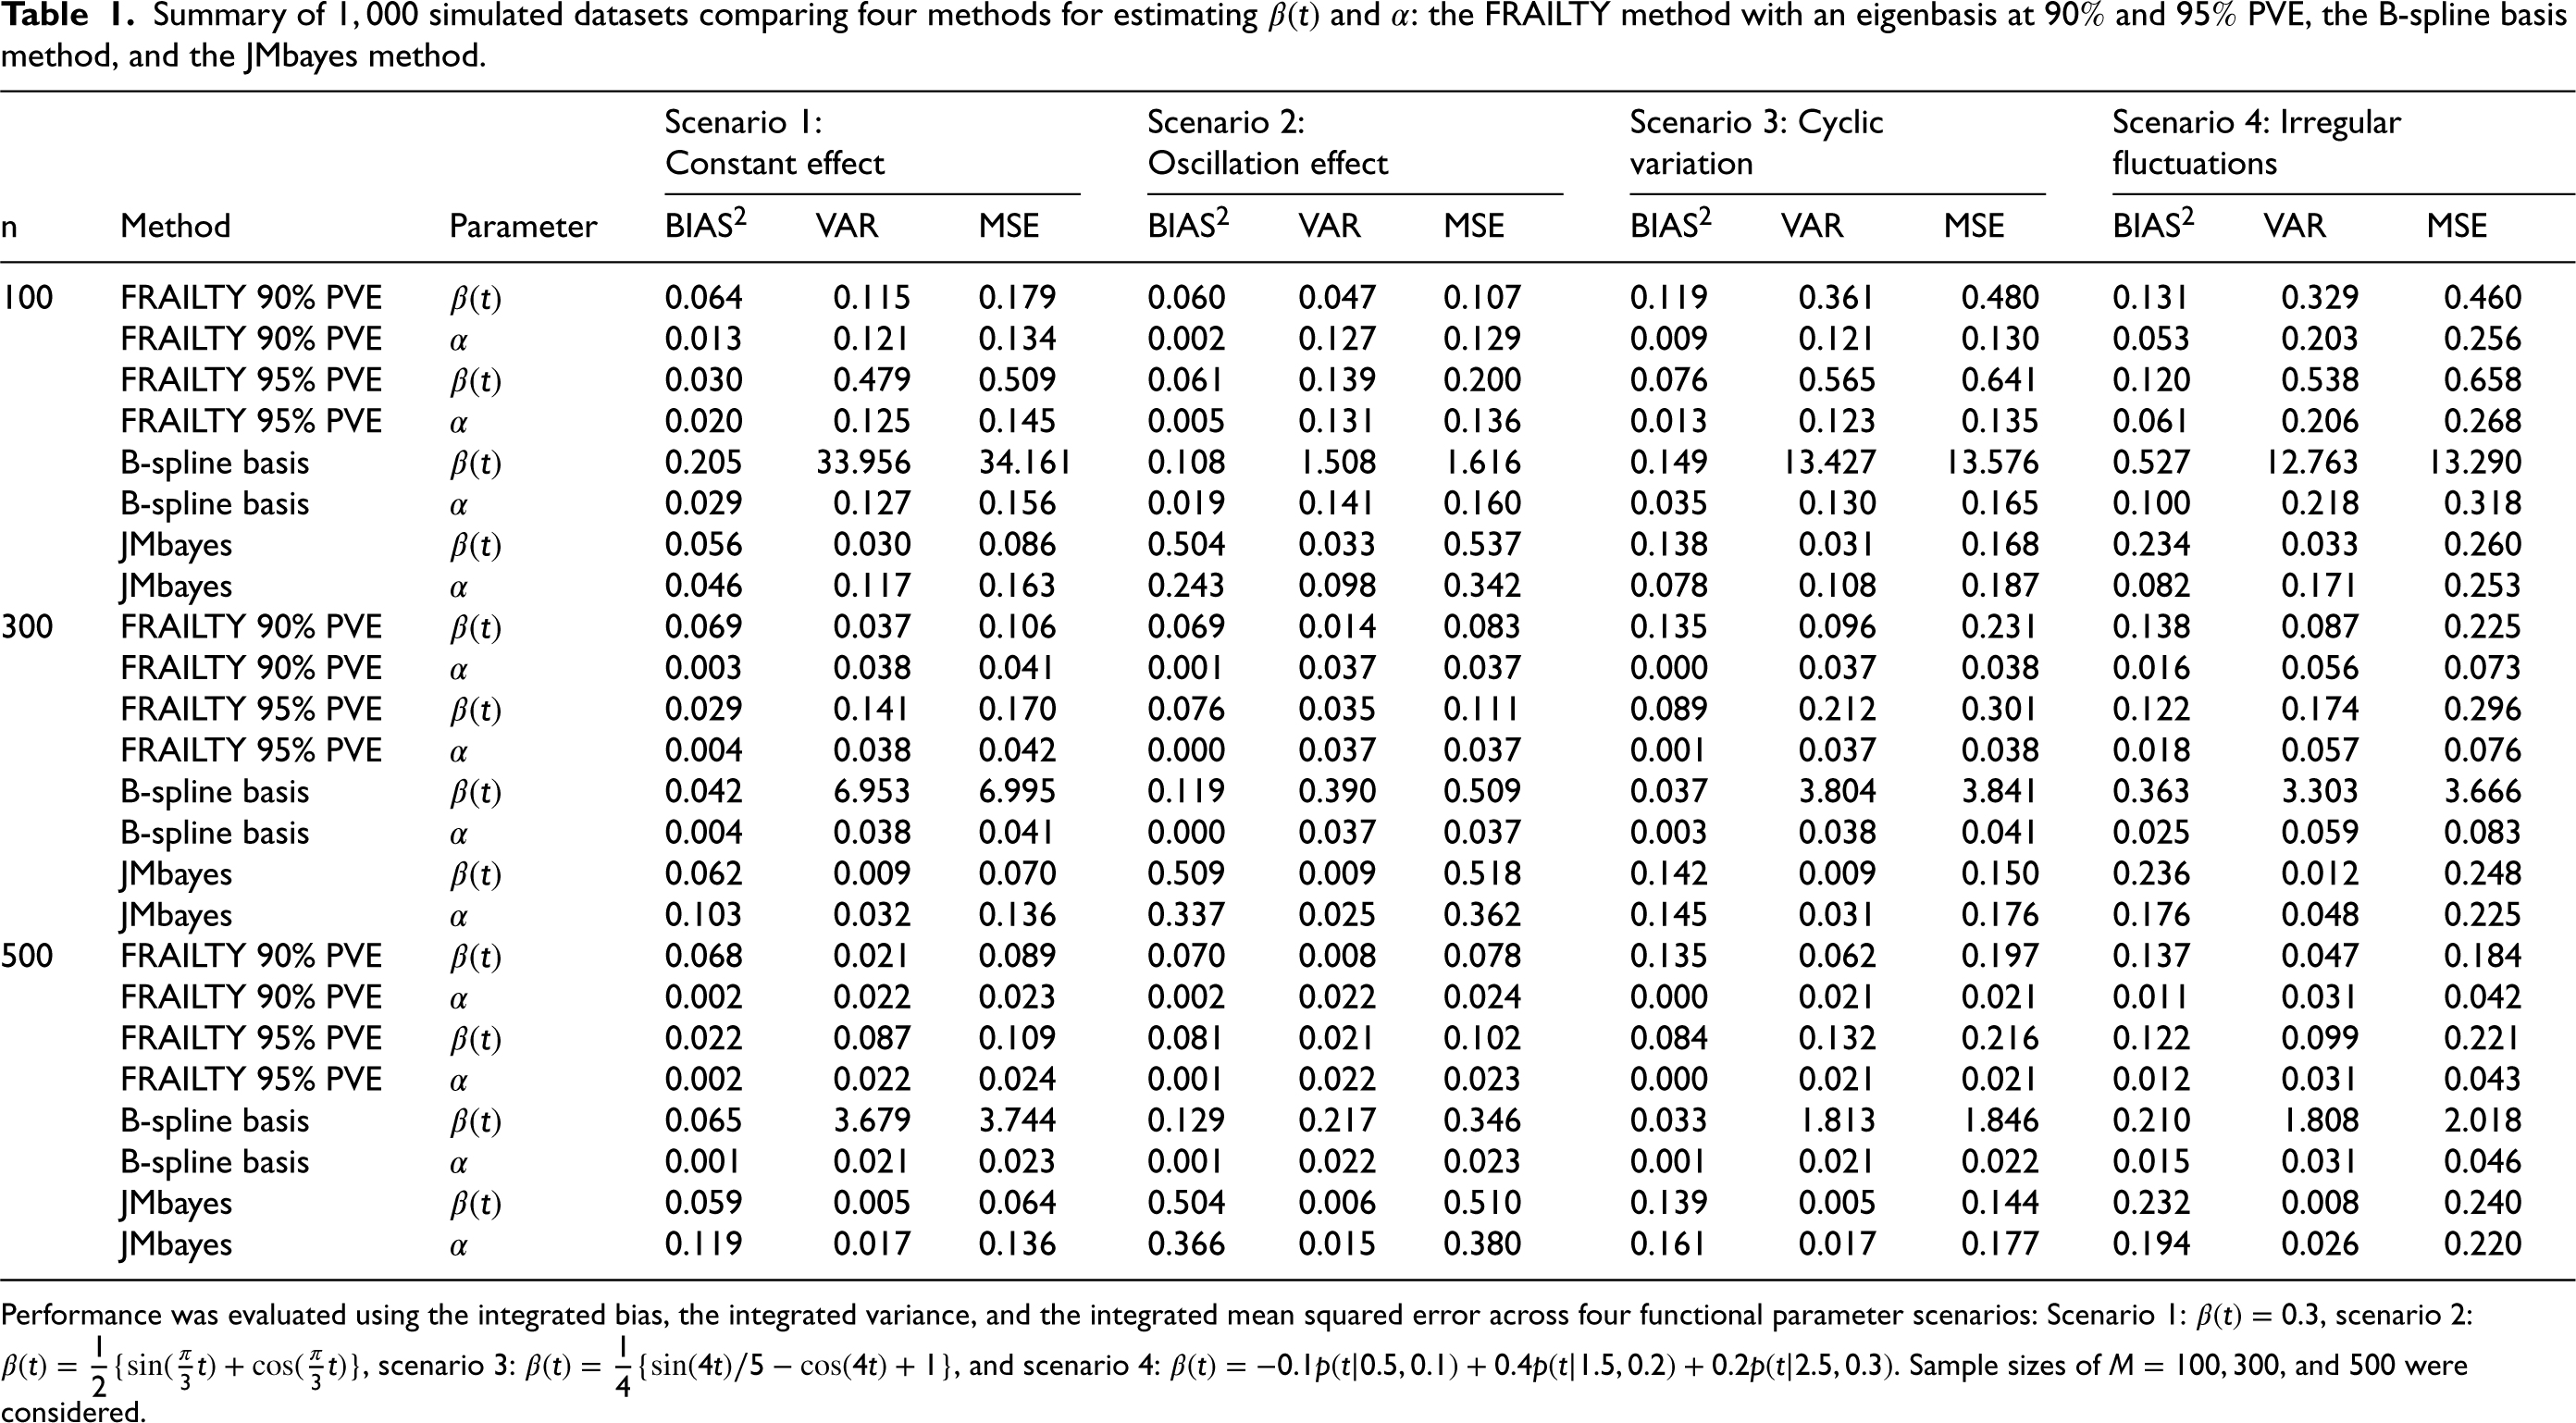
Table 1 presents the performance of the proposed FRAILTY method using an eigenbasis (with 90% and 95% PVE), the B-spline basis method, and the JMbayes method in estimating
Summary of
simulated datasets comparing four methods for estimating
and
: the FRAILTY method with an eigenbasis at
and
PVE, the B-spline basis method, and the JMbayes method.
Summary of
Performance was evaluated using the integrated bias, the integrated variance, and the integrated mean squared error across four functional parameter scenarios: Scenario 1:
In the third scenario, where
The FRAILTY method performs well across all scenarios but achieves relatively better performance in the second scenario. This can be attributed to the fact that the true
Table 1 also reports results for estimating the scalar parameter
In summary, the FRAILTY method, particularly when using
Figure 1 displays the C-index values, evaluated at a fixed time point
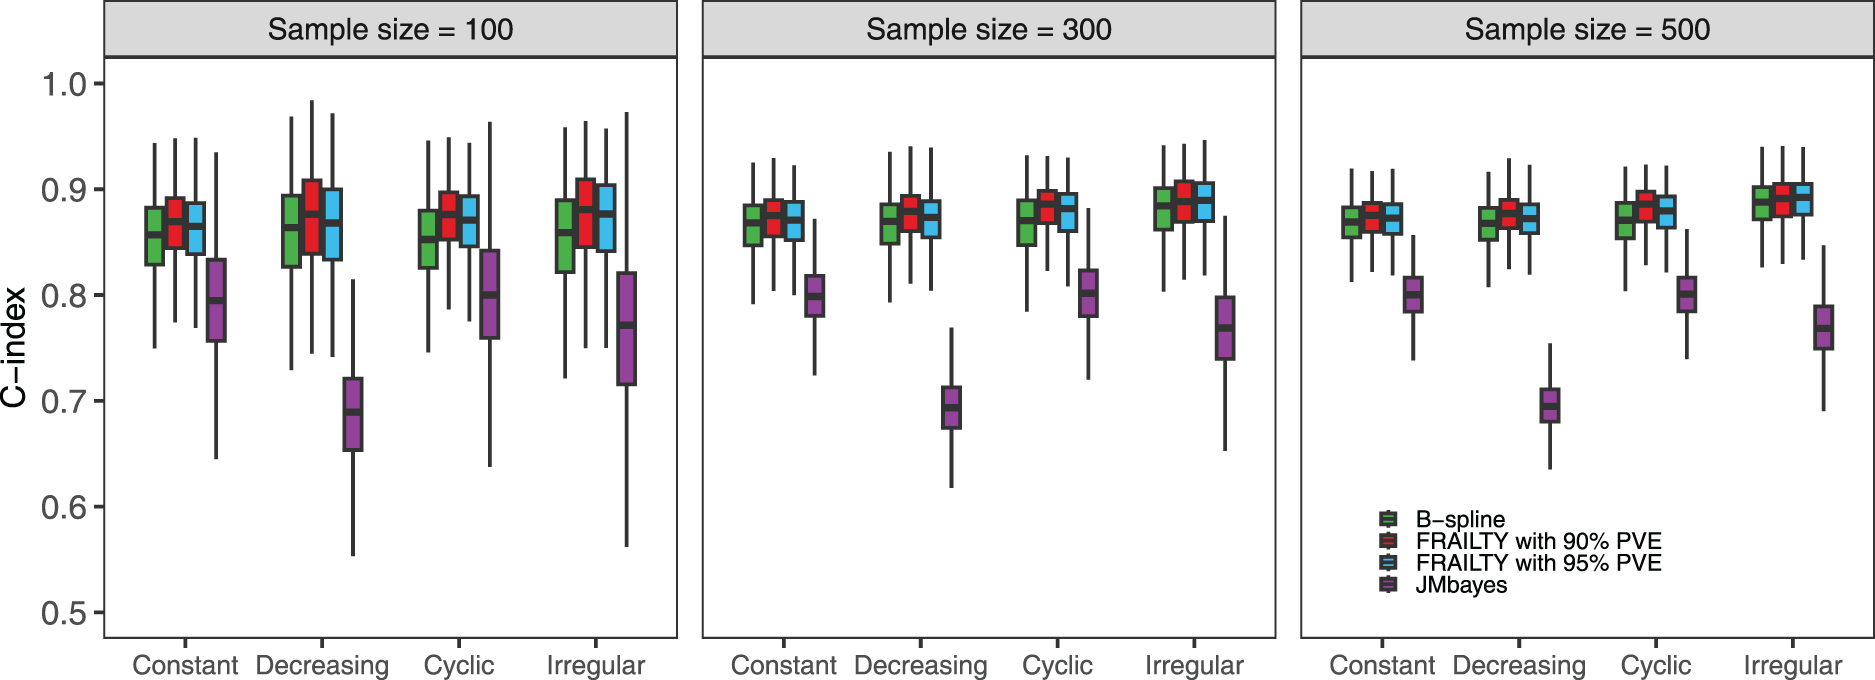
Simulation results comparing the C-index at time point
Figure 2 illustrates the results of the statistical power analysis for three methods: the FRAILTY method at
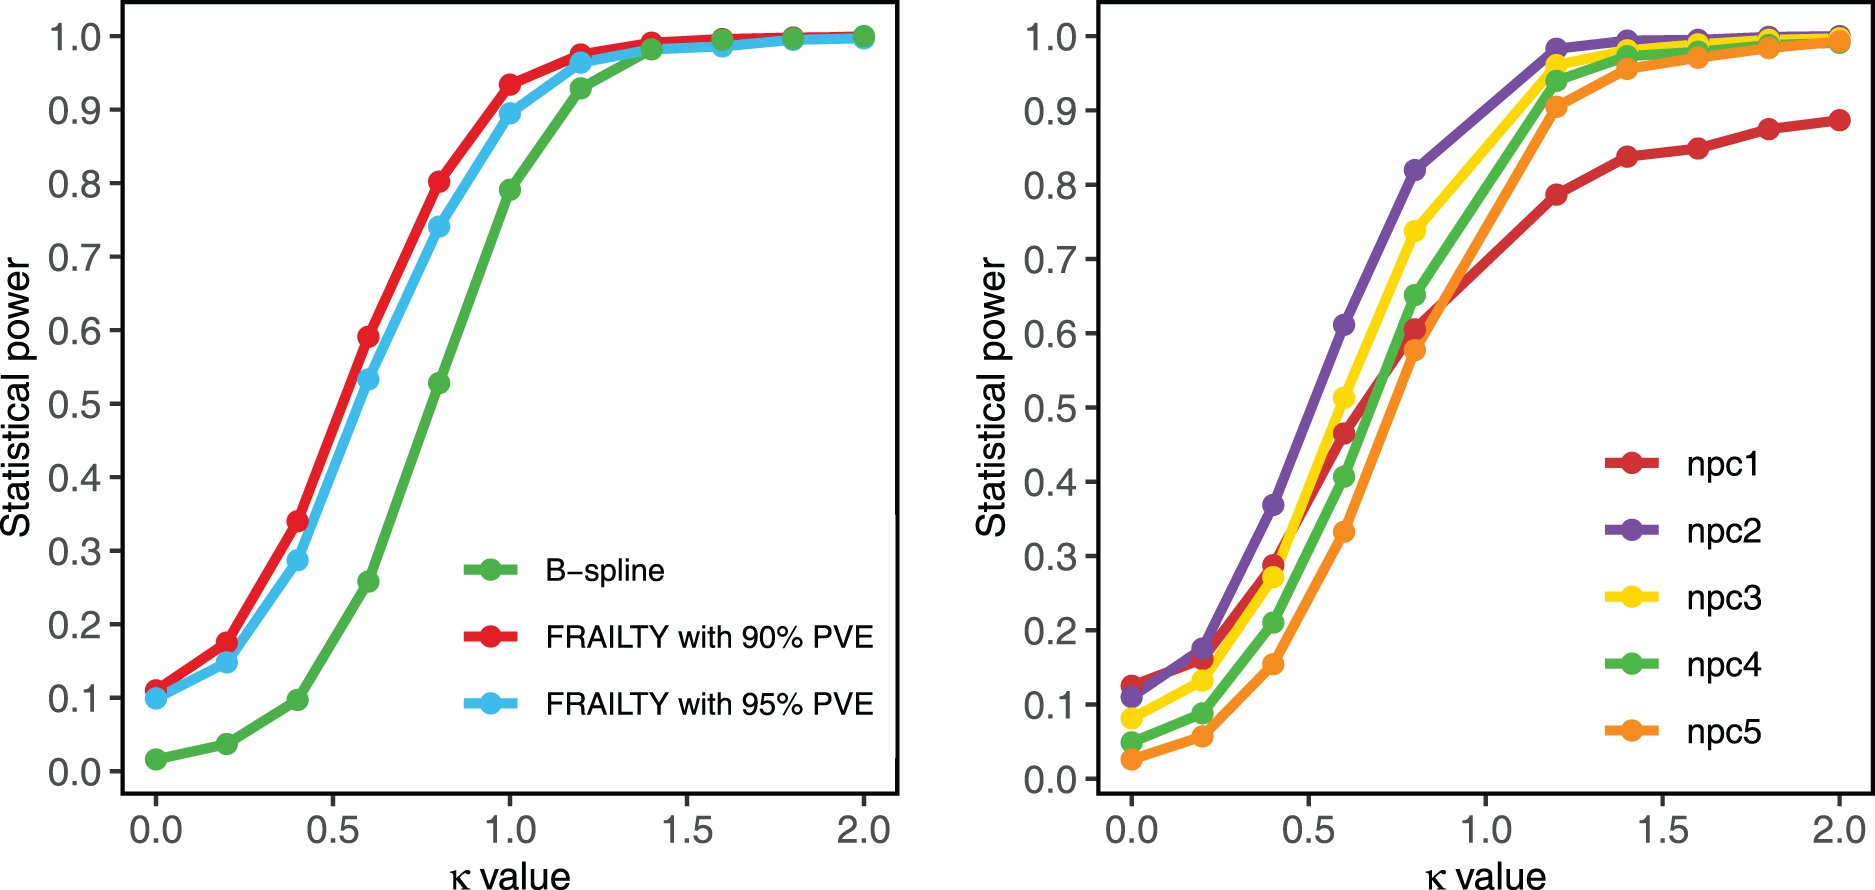
Simulation results for statistical power analysis with a sample size of
Application to the systolic blood pressure intervention trial (SPRINT) study
The SPRINT study is a multicenter randomized controlled trial designed to determine whether intensive systolic blood pressure (SBP) management reduces the risk of cardiovascular disease (CVD) more effectively than the standard treatment.
33
Specifically, the trial compared an intensive SBP target of
From the original cohort,
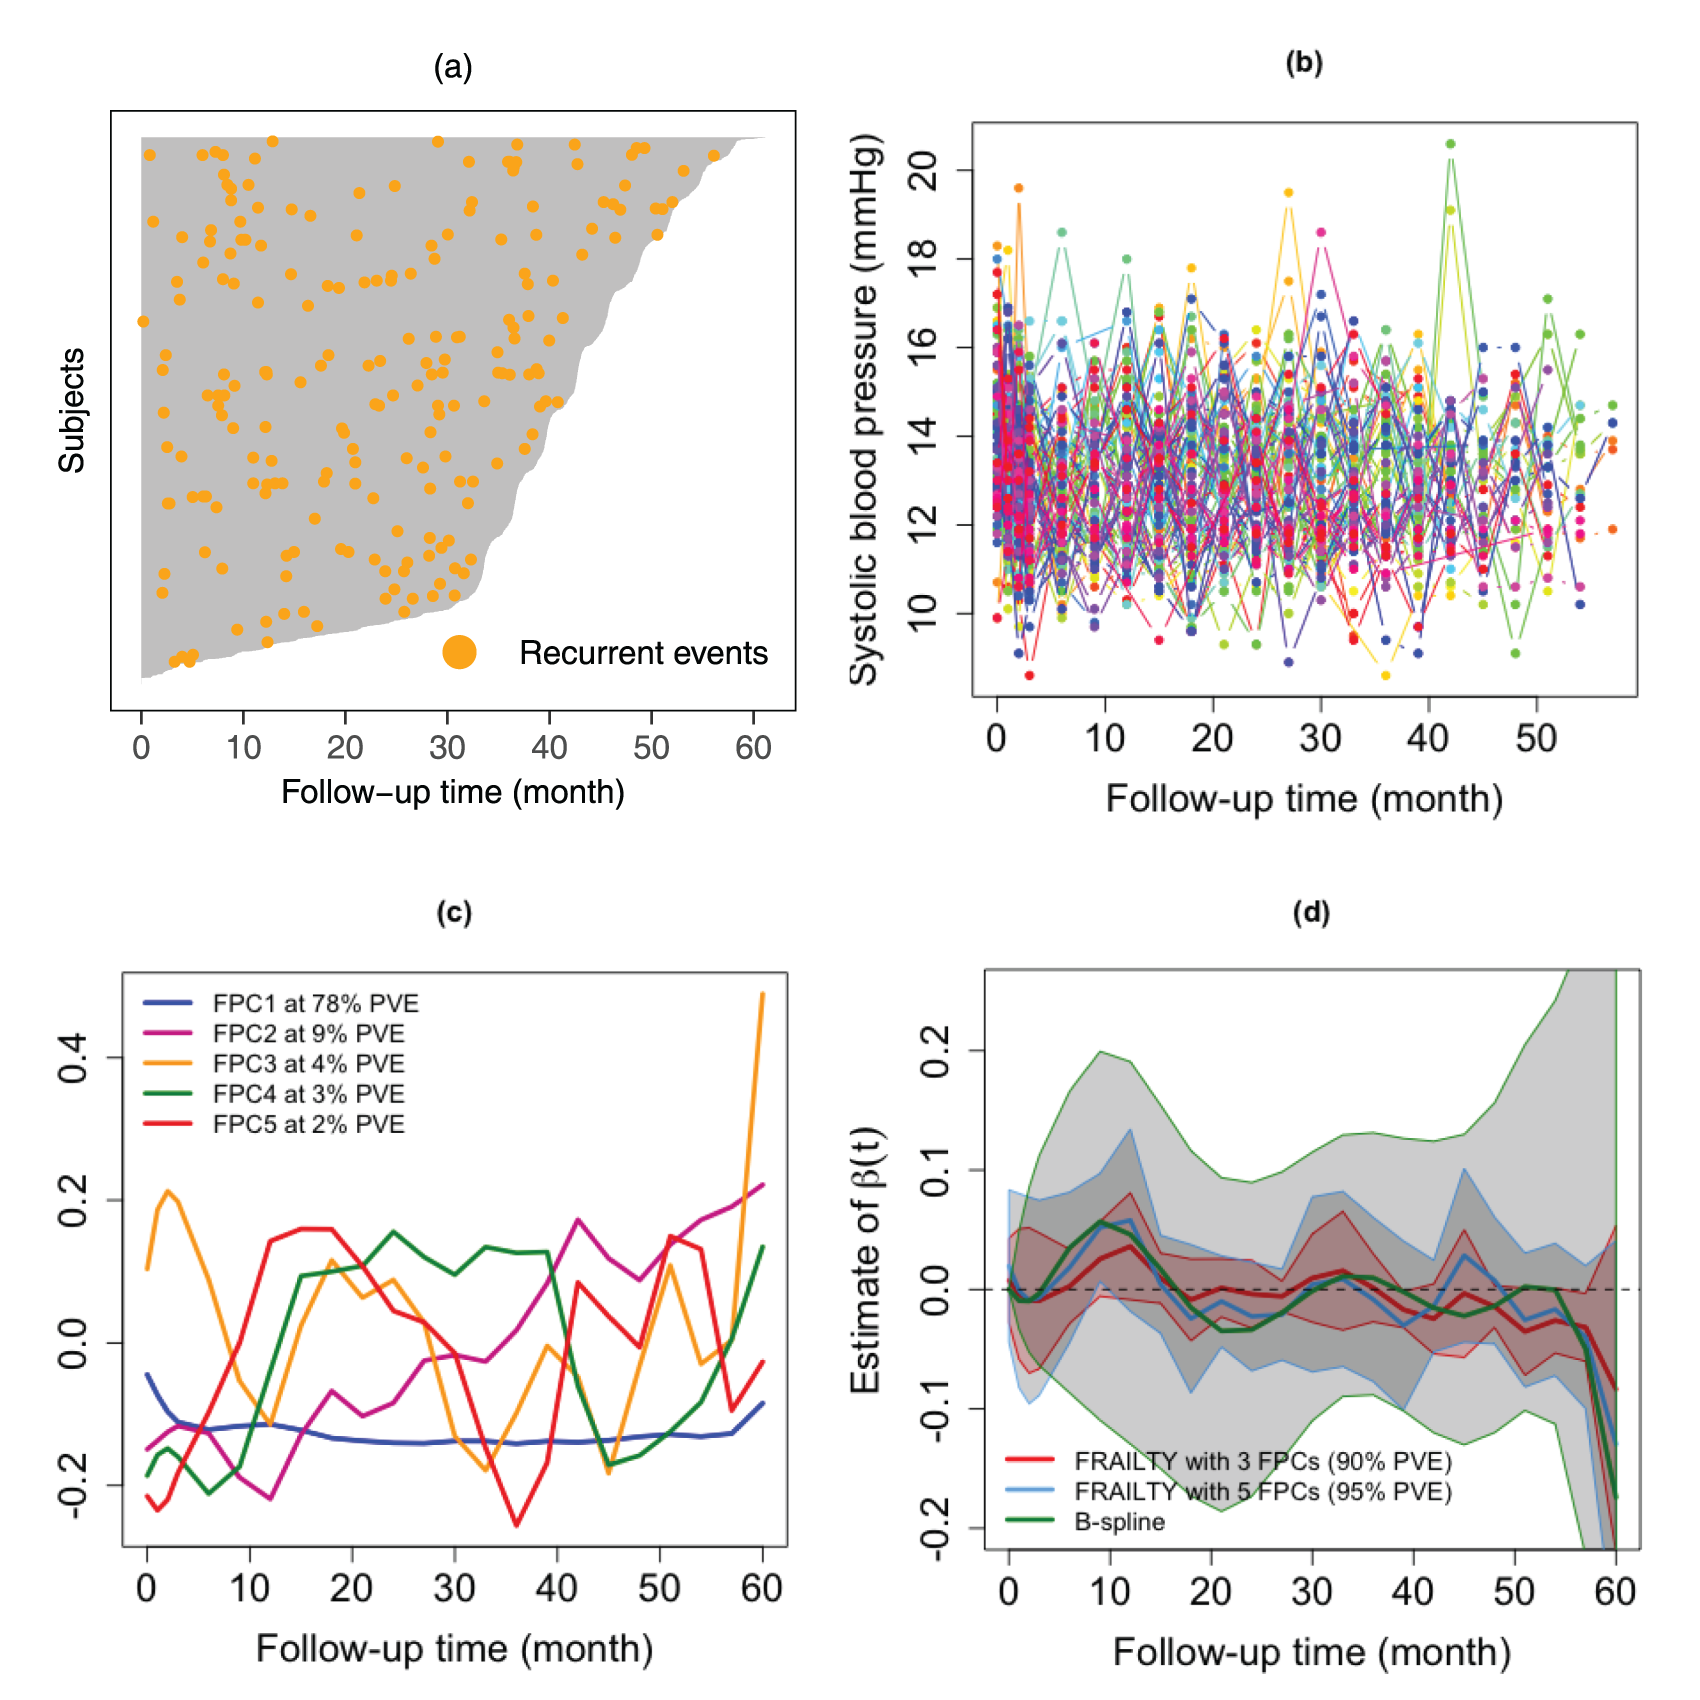
(a) Visualization of individual patient data, illustrating follow-up time and frequency of recurrent events throughout the SPRINT study. (b) Raw systolic blood pressure (mmHg) trajectories for
Figure 3(d) illustrates the estimated time-varying effect of SBP on CVD risk, adjusted for age and treatment assignment. The estimated
The MSTONE study is a retrospective cohort study that compiles data from four tertiary care stone centers in four cities of the United States (Dallas, TX; Madison, WI; Iowa City, IA; and Nashville, TN). A thorough chart review identified
The proposed FRAILTY method was applied to predict the risk of stone recurrence using irregular and sparse longitudinal urine pH data, and its results were compared to those obtained using the B-spline basis method. Figure 4(a) visualizes the distribution of recurrent kidney stone events among all subjects, while Figure 4(b) presents individual urine pH trajectories. Each line represents a patient’s urine pH measurements over time, revealing substantial heterogeneity. Some patients maintain relatively stable urine pH values, whereas others display pronounced fluctuations. The irregular spacing of points reflects the sporadic nature of data collection, often due to missed clinical visits. Figure 4(c) illustrates the first two FPCs derived from the urine pH data, which capture the dominant modes of variation in these trajectories. The first component explains
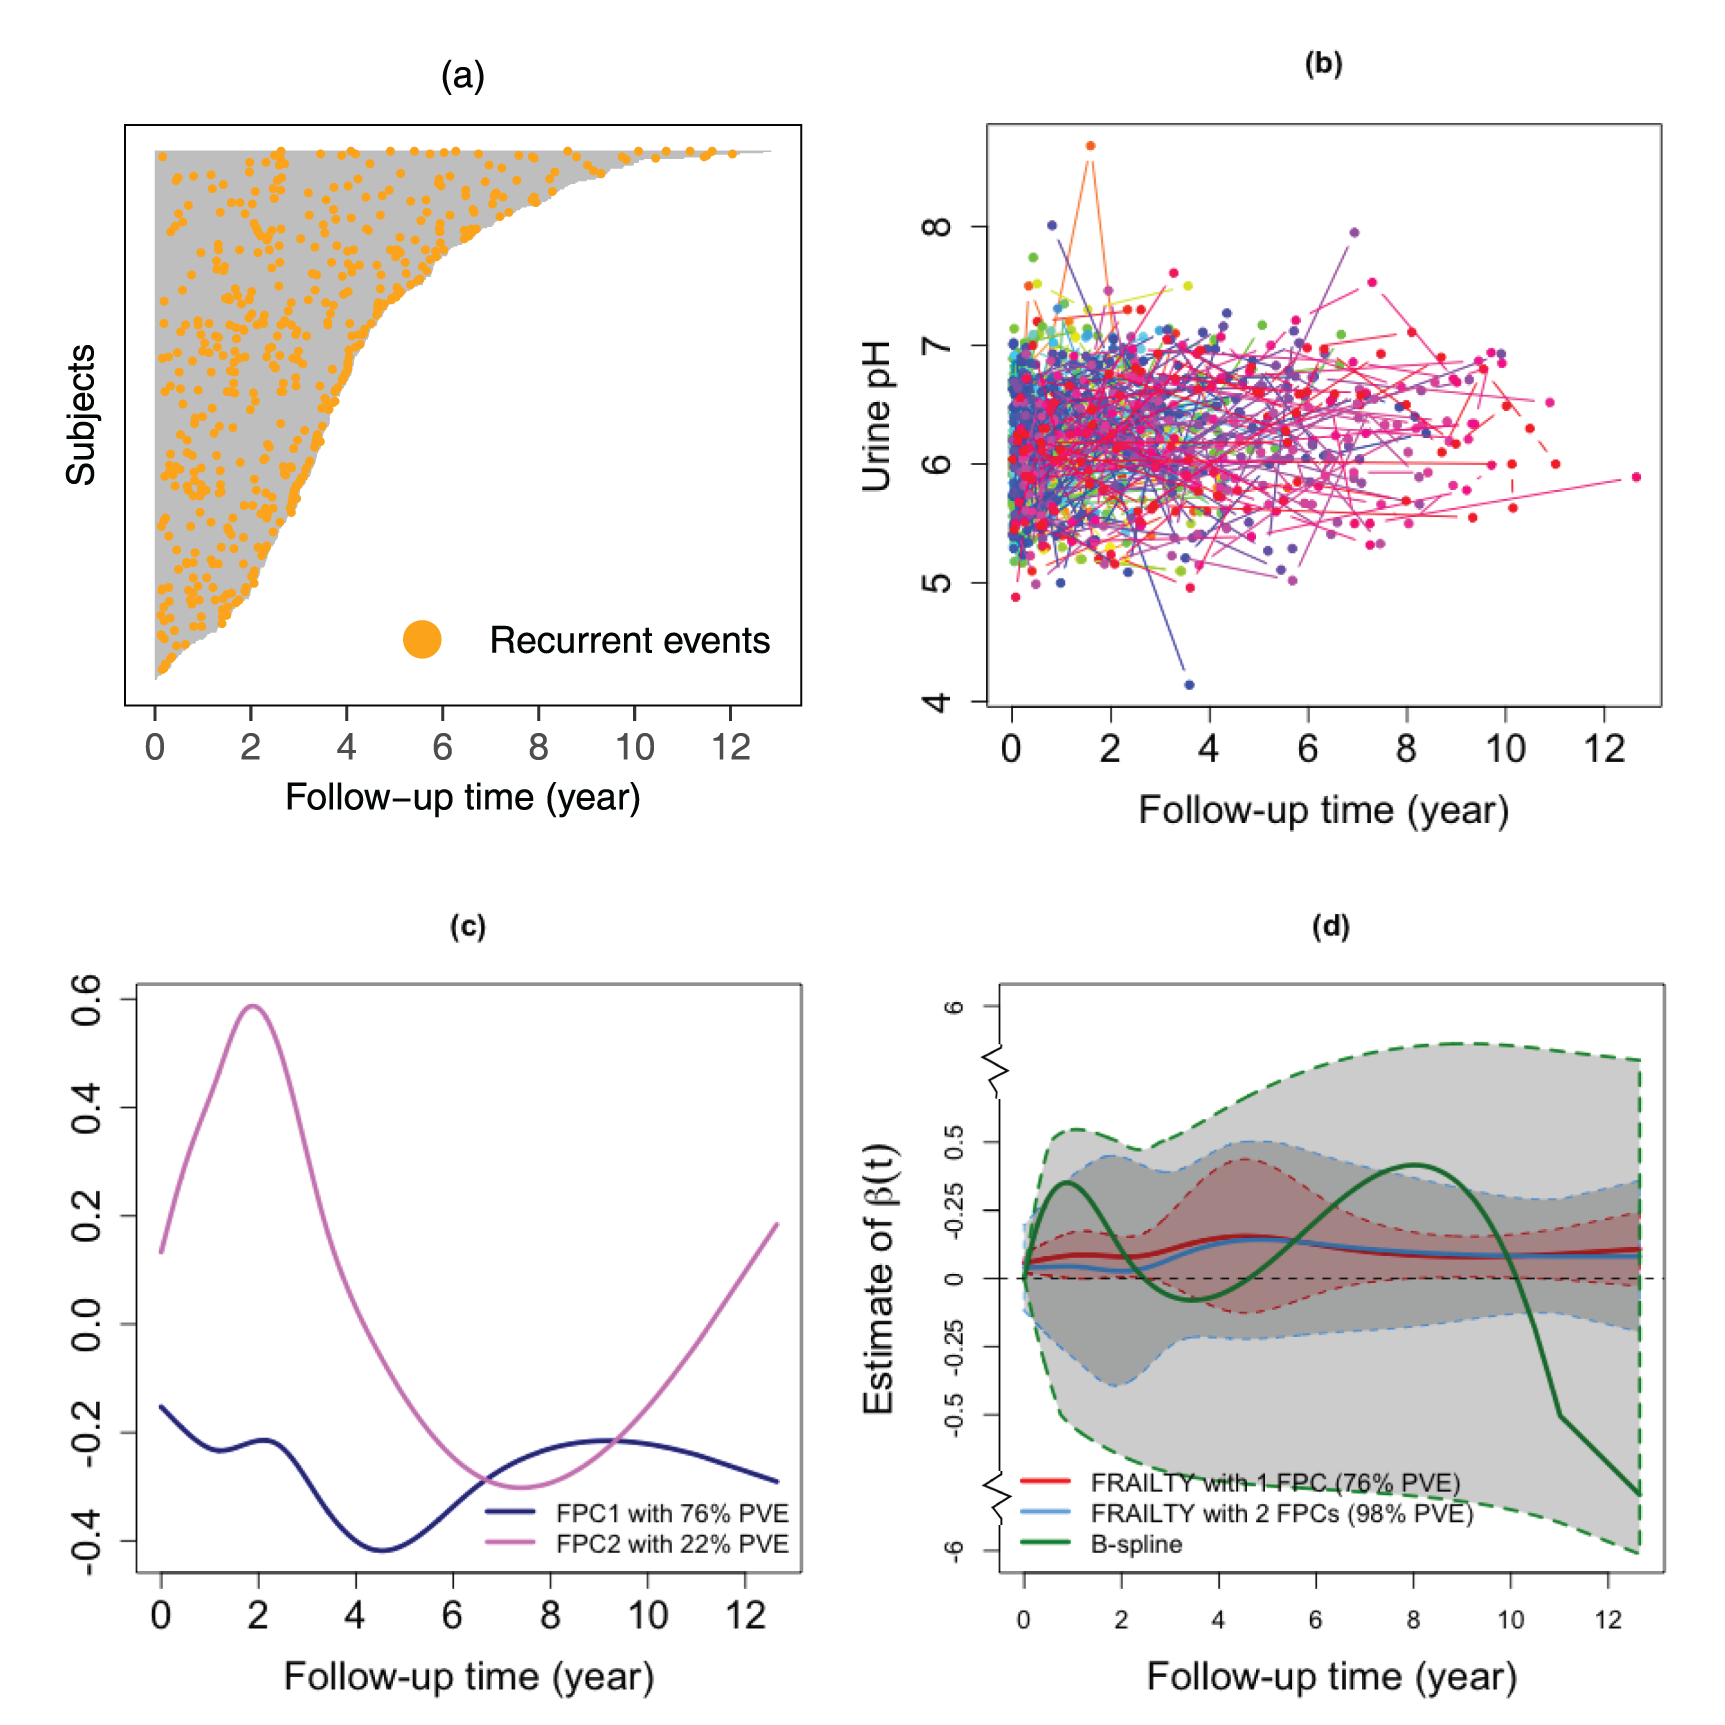
(a) Visualization of individual patient data, displaying follow-up time and the frequency of recurrent stone events throughout the MSTONE study. (b) Raw urine pH trajectories for
Figure 4(d) presents the estimated
This paper introduces the FRAILTY method, an approach designed to address the challenges of jointly analyzing longitudinal and recurrent event data. By leveraging FPCA and incorporating an AR(1) frailty term, the proposed FRAILTY method accommodates the complexities of time-varying effects, sparse and irregular measurements, and within-subject correlations across recurrent events. Its flexibility to integrate scalar and functional covariates, coupled with dynamic prediction capabilities, offers an alternative for analyzing recurrent event data. Across a wide range of simulation scenarios, the FRAILTY method consistently outperforms the B-spline basis method and the JMBayes method when
Applied to the SPRINT and MSTONE datasets, the FRAILTY model provided clinically relevant insights. In the SPRINT study, it revealed temporal changes in the effect of SBP on CVD risk, accounting for the cumulative influence of antihypertensive treatment – insights not available from traditional Cox regression. In the MSTONE cohort, the FRAILTY method captured the dynamic association between longitudinal urine pH and stone recurrence risk, generating smooth and interpretable hazard ratio estimates. The multivariate extension, mFRAILTY, which jointly incorporates urine citrate and uric acid, further demonstrated scalability and the ability to uncover nuanced predictor interactions.
Despite these strengths, the FRAILTY method has limitations that warrant further exploration. First, the current two-step estimation procedure, while computationally efficient, may introduce bias due to the separation of longitudinal and survival processes. Specifically, misspecification in the longitudinal model can propagate to the survival component, compromising association and prediction accuracy. Future work could explore fully integrated, one-step estimation approaches to mitigate this risk and improve parameter estimation.
Second, the assumption of an AR(1) frailty structure may not adequately represent more complex or nonlinear correlation structures among recurrent events. Higher-order autoregressive terms or time-varying frailty structures could better account for dependencies among recurrent events in scenarios with intricate temporal dynamics. Incorporating such extensions could significantly enhance the model’s flexibility and applicability across a broader range of real-world datasets.
Third, selecting the optimal number of FPCs remains a practical challenge. Although selecting components that explain the majority of the variance in
Additionally, both model formulation and statistical estimation require exact event times to be observed. However, in practical applications, event times may only be available within intervals between clinical visits, posing challenges related to interval censoring. Another concern is the treatment of study withdrawals as censoring. Dropout-related missingness is often non-ignorable, as it may depend on both covariates and outcomes, violating the assumption of independent censoring. A particularly important source of dropout is terminal events, such as death, which frequently occur in longitudinal studies and introduce additional complexity to recurrent event modeling. Incorporating terminal events into joint models with longitudinal functional data could improve time-to-event modeling, providing a more comprehensive understanding of how functional covariates relate to clinical outcomes.
In conclusion, the FRAILTY method’s integration of FPCA and dynamic frailty modeling provides a robust and versatile framework for analyzing longitudinal and recurrent event data. Its demonstrated effectiveness in both simulation and real-world applications underscores its promise as a valuable tool for advancing research and clinical practice in health-related fields.
Supplemental Material
sj-pdf-1-smm-10.1177_09622802261457281 - Supplemental material for Joint analysis of longitudinal and recurrent event data: A functional regression approach with autoregressive frailty
Supplemental material, sj-pdf-1-smm-10.1177_09622802261457281 for Joint analysis of longitudinal and recurrent event data: A functional regression approach with autoregressive frailty by Zifang Kong, Sy Han Chiou, Naim M Maalouf and Yu-Lun Liu in Statistical Methods in Medical Research
Footnotes
Acknowledgments
The authors sincerely thank the Editor and the anonymous reviewers for their thoughtful evaluation and constructive comments, which have helped improve the clarity of this work. They are also grateful to Dr. Daniel F. Heitjan and Dr. Chul Moon for their valuable insights and helpful feedback. In addition, they thank Dr. Brett Johnson for generously providing access to the MSTONE dataset. This manuscript was prepared using SPRINT Research Materials obtained from the NHLBI Biologic Specimen and Data Repository Information Coordinating Center (BioLINCC). The content of this publication does not necessarily reflect the opinions or views of the SPRINT Research Group or the NHLBI.
Author's Note
Zifang Kong is now affiliated with the Mathematics Department, Milwaukee School of Engineering, Milwaukee, WI, USA.
Funding
The authors disclosed receipt of the following financial support for the research, authorship, and/or publication of this article: This work was supported by the National Institutes of Health—NIDDK grant: R01DK128237 (ZK, NM, and YL).
Declaration of conflicting interests
The authors declared no potential conflicts of interest with respect to the research, authorship, and/or publication of this paper.
Supplemental material
Supplemental material for this article is available online.
References
Supplementary Material
Please find the following supplemental material available below.
For Open Access articles published under a Creative Commons License, all supplemental material carries the same license as the article it is associated with.
For non-Open Access articles published, all supplemental material carries a non-exclusive license, and permission requests for re-use of supplemental material or any part of supplemental material shall be sent directly to the copyright owner as specified in the copyright notice associated with the article.