
Abstract
In resource-limited or time-sensitive care settings, there is interest in assessing the impact of time to treatment (TTT) on mortality. Traditional Cox proportional hazards models, which specify the effect of TTT as an unrestricted term in the log hazard ratio, can produce counterintuitive results where the survival probability may not decrease monotonically with longer delays. Moreover, hazard ratios from such models quantify the effect of TTT conditional on surviving until treatment, rather than the effect of delayed treatment at baseline. We propose a class of bounded hazard ratio (BHR) Cox models that constrain the hazard ratio for TTT to attenuate towards the null with increasing treatment delay, such that hazard for death after treatment cannot exceed the hazard without treatment. Estimation can be performed using direct optimization of the partial log-likelihood or with an iterative linearized estimation procedure for large sample sizes. From BHR models, the estimated hazard ratio curve describes how treatment benefit diminishes with delay. Additionally, we propose a survival probability difference that provides an absolute measure for comparing survival under different treatment delays. We evaluate model performance in simulations and apply the method to examine treatment delays for colon cancer with data from the National Cancer Database.
Introduction
The effect of time to treatment (TTT) on subsequent survival outcomes has been examined in various clinical applications, such as cancer care,1,2 emergency medicine,3,4 and organ transplantation. 5 In resource-limited settings, such as during a pandemic or within a constrained healthcare system, a lack of understanding of how TTT affects mortality can lead to inefficient allocation of resources that results in adverse outcomes.6,7 Understanding and quantifying the effect of treatment delays on mortality can provide decision-makers with the necessary tools to make decisions about delaying and triaging care.
In this article, we are interested in assessing the effect of the timing of an intermediate event (e.g. treatment) on a subsequent terminal event (e.g. death) in the presence of censoring of both events. We focus on extrinsic intermediate events, such as treatment, whose timing is modifiable. 8 Our goal is to quantify the effect of TTT on survival from baseline, when a decision to delay treatment may be made. Common analytical approaches include Cox models with delayed entry or with a time-dependent treatment indicator, 9 sequential Cox models or landmarking,10,11 and multi-state models for the joint distribution of TTT and time to death.12,13 These and other methods have been compared in the literature.14–16
In many clinical contexts, it is biologically plausible that treatment is beneficial when delivered promptly, but that its benefit attenuates as delay increases. For example, in cancer care, tumor growth during the waiting period may allow disease progression or spread, reducing the effectiveness of subsequent treatment.17,18 Similarly, delays in acute or progressive conditions may lead to irreversible physiological deterioration prior to intervention.19,20 These considerations motivate modeling frameworks in which treatment benefit is greatest at baseline and decreases with increasing delay, while remaining no worse than no treatment over the follow-up period of interest. However, standard survival models do not enforce such behavior in the implied hazard functions.
Constrained estimation has been explored in survival analysis to reflect knowledge about hazard shapes or the direction of covariate effects. Shape restrictions have been imposed on baseline hazards, and order-restricted or monotone covariate effects have been developed within proportional hazards models.21–24 These approaches constrain regression coefficients or regression functions, thus restricting the ordering of hazard ratios across covariate levels. However, they do not guarantee that the implied hazard ratio satisfies properties such as boundedness relative to a reference hazard or convergence toward a specified limit as a covariate increases. In contrast, we consider a modeling structure that constrains the post-treatment hazard relative to the untreated hazard, ensuring that treatment benefit attenuates monotonically with delay and does not reverse direction. To our knowledge, such boundedness constraints on hazard ratios have not been previously formalized within Cox models.
Our contribution in this article is twofold. First, we show that a proportional hazards formulation that leaves the treatment-delay effect unconstrained can produce implausible behavior, including non-monotonic relationships between treatment delay and mortality risk. Consequently, we propose a class of bounded hazard ratio (BHR) Cox models that constrain the post-treatment hazard to remain below the untreated hazard while allowing treatment benefit to attenuate with increasing delay. Second, we demonstrate a measure that quantifies the impact of treatment delay on survival based on differences in marginal survival probabilities that account for the possibility of death prior to treatment. We demonstrate the application of the proposed class of models and quantification measures for describing the effect of TTT among colon cancer patients, a setting where traditional analytic approaches have produced conflicting results.
The remainder of the article is structured as follows. Section 2 describes the current methods using a proportional hazards effect for TTT and their theoretical limitations. In Section 3, we introduce the BHR Cox model, which imposes a plausible restriction on the behavior of the post-treatment hazard as TTT increases. Section 4 describes an alternative measure of the TTT effect to augment the interpretation of the hazard ratio from the BHR model. In Section 5, we conduct a simulation study to evaluate the behavior of the proposed models in settings of varying strength of TTT effect, sample sizes, and rates of competing risk cumulative incidence. In Section 6, we apply the proposed models to assess the effect of delaying treatment for colon cancer patients. We conclude with a discussion of the advantages, limitations, and possible extensions of the proposed approach in Section 7.
Proportional hazards effect of time to treatment
Let
Time-dependent Cox proportional hazards model
A common approach for modeling TTT effects is a Cox model with time-dependent covariates for the effects of treatment and time-to-treatment, given by


This formulation uses a time-dependent treatment indicator to preserve the appropriate risk-set structure, avoiding immortal time bias when estimating associations between treatment timing and mortality.
9
The specification in equation (1) represents the effect of TTT through a linear term in
When modeling the effect of TTT on mortality, it is often clinically plausible that treatment is beneficial when delivered promptly and that this benefit diminishes as treatment is delayed. Under such assumptions, the hazard of death after treatment should not exceed the hazard without treatment, and treatment benefit should attenuate monotonically as delay increases. These considerations motivate the following structural properties of the post-treatment hazard:
These properties reflect a structural assumption about the behavior of the treatment effect rather than a specific parametric form.
The Cox models presented in the previous section specify the total treatment effect on the log hazard of death as
In Figure 1, we demonstrate these behaviors in the setting of proportional hazards with no baseline covariates, and a protective treatment effect, that is,
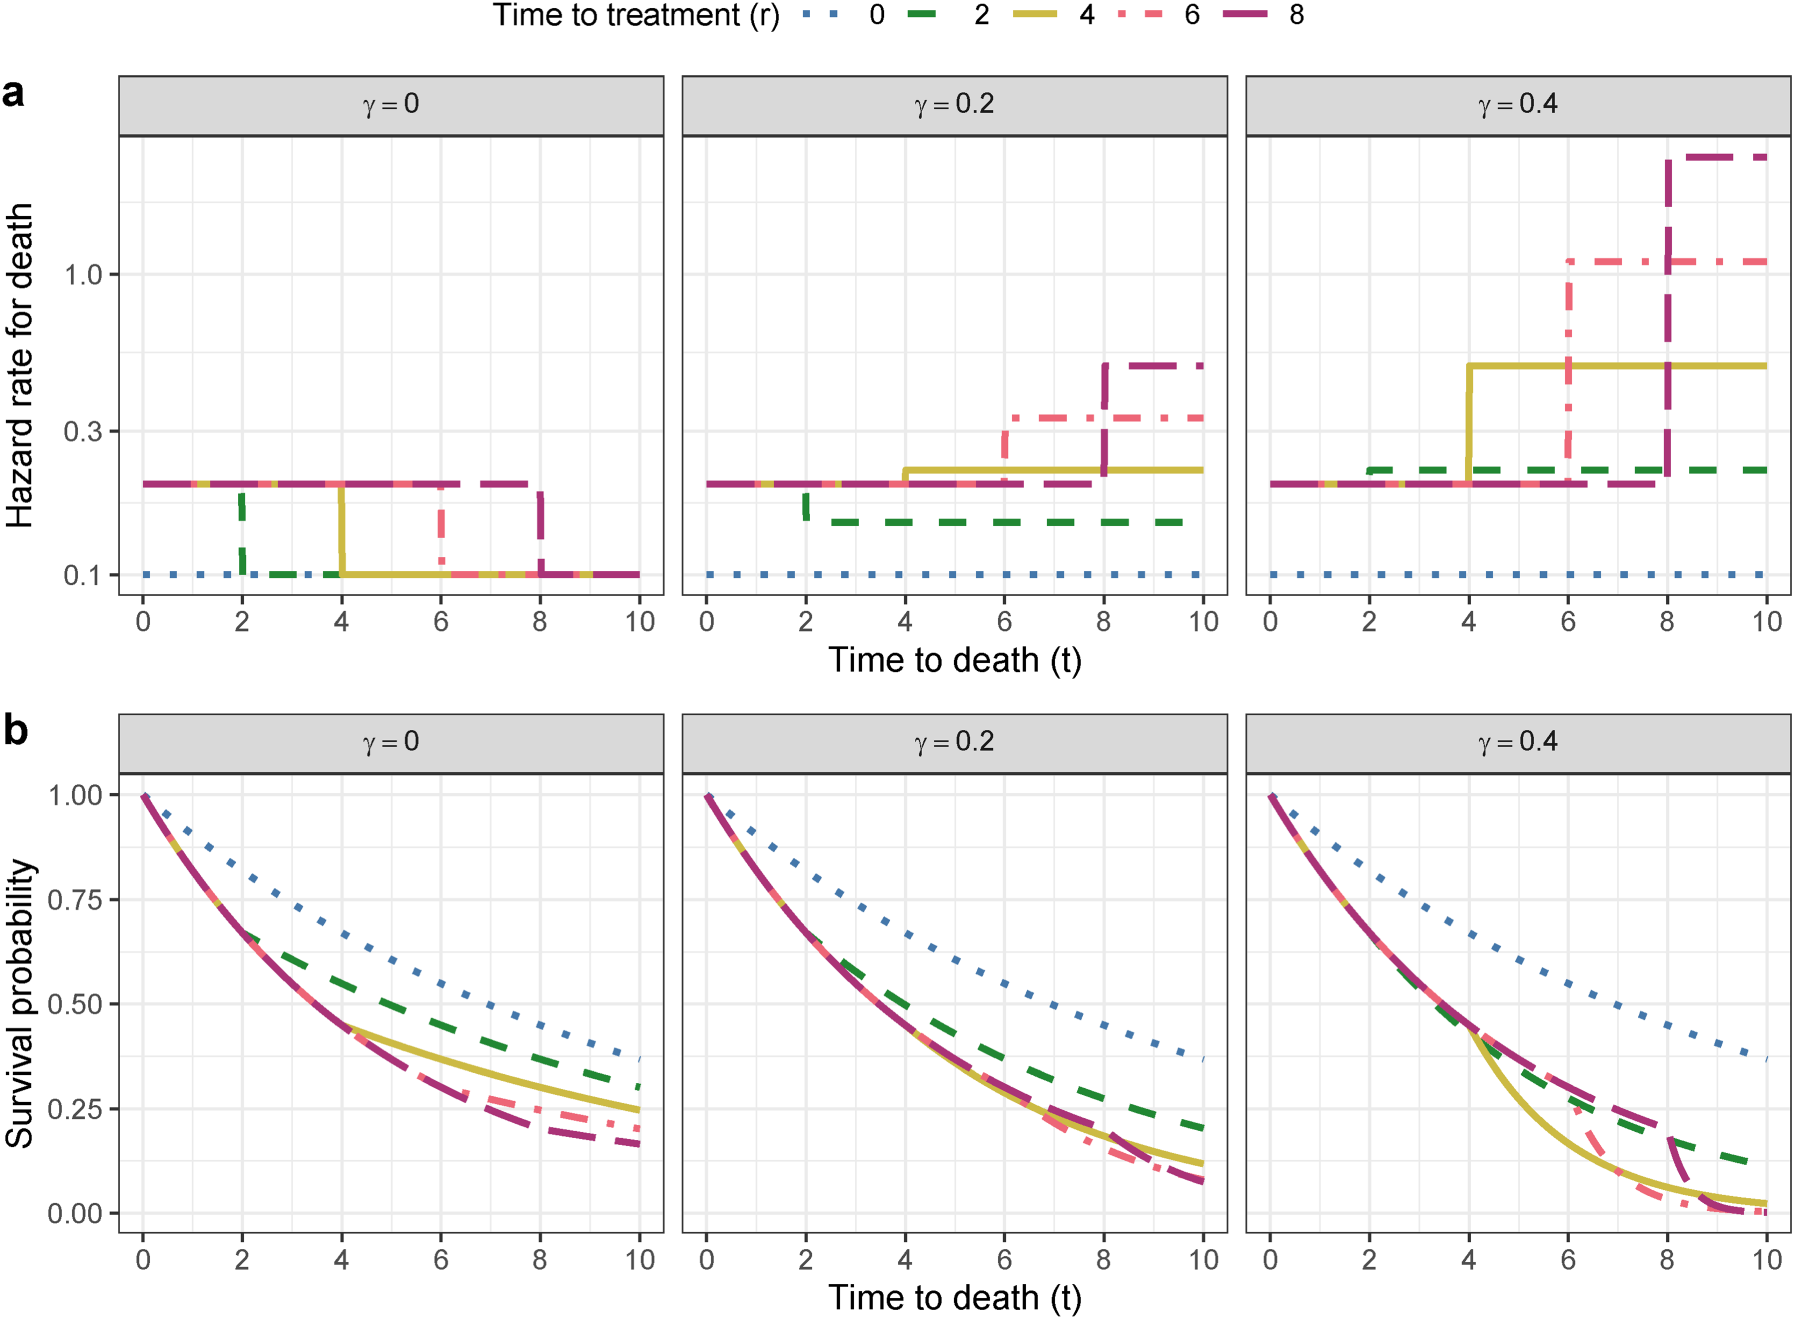
Effects of specifying the effect of time to treatment (TTT) as a linear term in a proportional hazards model on (a) hazard rates and (b) survival functions, illustrating how increases in the linear TTT effect parameter
To resolve these contradictions in modeling the effect of TTT on mortality risk, we seek an alternative class of models for the effect of TTT, such that conditions 1
Model specification
We propose a BHR Cox model, specified as:


Under this specification, the post-treatment hazard ratio relative to the pre-treatment hazard is
Figure 2 illustrates possible behaviors of the attenuating treatment effect with increasing treatment delays and the corresponding impact on survival probability. The plot of the hazard ratio demonstrates how the treatment effect diminishes as TTT increases for various choices of the weight function. Since the hazard ratio directly determines the relative hazard over time, these shapes translate into the corresponding survival curves that show a monotonic association between longer TTT and decreasing survival, reflecting the monotone attenuation imposed by the weight function. As TTT increases, the survival probability with treatment returns to that without treatment. Thus, unlike a linear effect of TTT on the log hazard ratio, the BHR model provides natural limits on the effect of treatment delays, preventing the implausible scenario in which delaying treatment would result in worse survival than not treating at all.
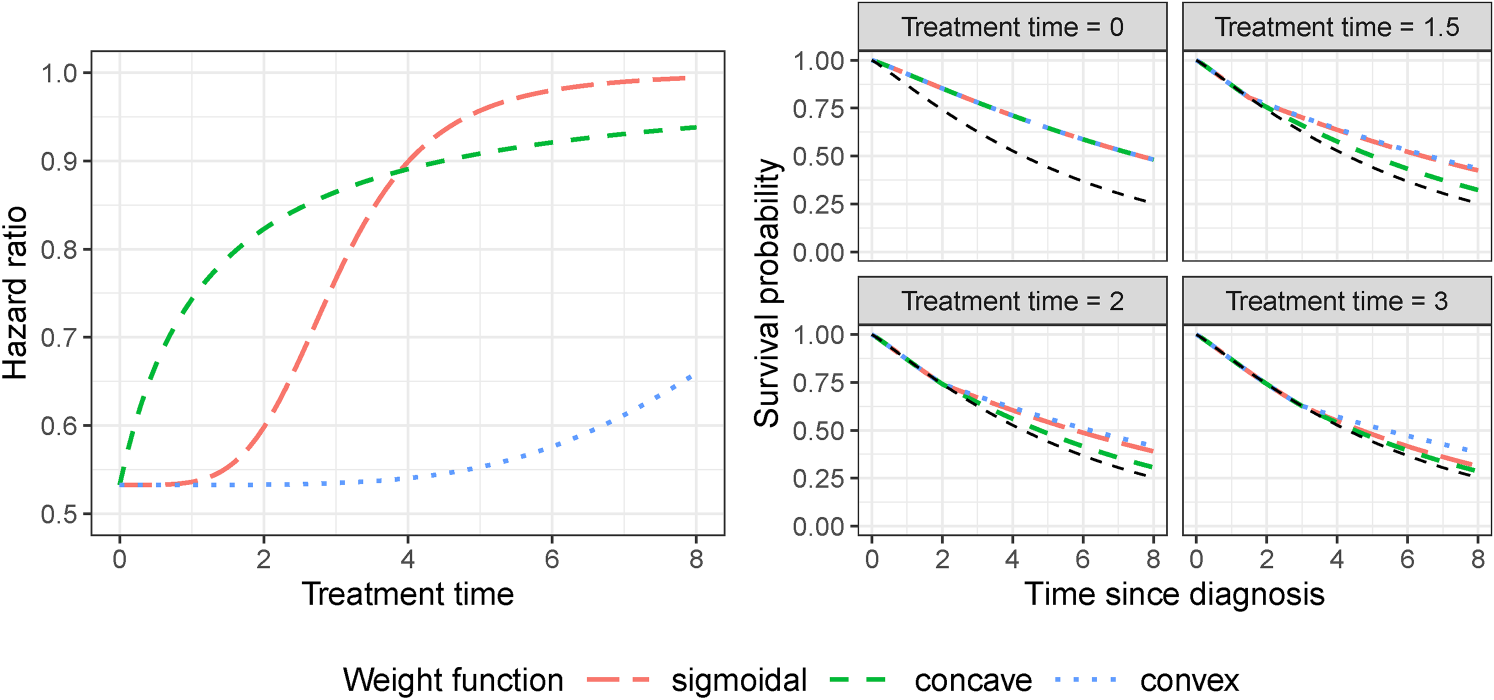
Different shapes of weight function and their corresponding hazard ratio (left) and survival (right) curves. The right panel shows the effect on survival of treatment administered at four possible times as modulated by the shape of the hazard ratio depicted in the left panel. The survival probability without treatment is shown in the right panels in black.
We desire to obtain estimates of
We adopt two approaches for estimation. First, we may directly optimize the partial likelihood function corresponding to this nonlinear-in-parameters hazard ratio using a general-purpose optimizer, such as Nelder–Mead. This approach is effective for moderate sample sizes, such as those considered in our simulation study (
As an alternative, we propose an iterative linearized estimation procedure based on linearizing the log hazard ratio and leveraging the efficient estimation available in
Let


To test for the presence of a TTT effect in the form of the proposed BHR weight functions, a likelihood ratio test (LRT) may be used. However, since under the null hypothesis of no TTT effect the parameters of the weight function are either on the boundary of the parameter space
27
or not identified, we recommend a simulation-based approach to obtain the distribution of the LRT statistic under the null.
28
Details for this procedure are given in Supplementary Material B.3. For each simulated dataset, both the null model and the alternative BHR model (with either Weibull or log-logistic weight functions) are fit using the same estimation procedure as in the main analysis. The likelihood ratio statistic is then computed as
A subset of the parameter space may produce nearly identical weight functions over the observed treatment time range, leading to weak identifiability of the individual parameters in
Assessing the time-to-treatment effect
The bounded hazard ratio curve
By maintaining the proportional hazards framework, the BHR Cox models provide estimates of a hazard ratio curve representing the instantaneous risk of death at any time
The hazard ratio curve allows one to identify periods where the treatment effect is constant or minimal and treatment delays do not affect risk (flat portions of the curve), periods where there is a significant increase in risk for even small treatment delays (steep increases in the curve), and the threshold time after which receiving treatment provides a similar benefit to not receiving treatment at all (point at which the difference between the curve and its asymptote at 1 becomes negligible). Thus, these hazard ratio curves provide insight into optimizing the timing of interventions.
Figure 2 gives examples of three possible hazard ratio curve shapes from the same log-logistic family of weight functions. A concave curve may represent an emergency medicine setting such as sepsis where early administration of antibiotics is critical and each hour of delay increases mortality risk significantly; however, later in the clinical course the intervention timing is less crucial since the outcome is already determined. A convex curve may represent chronic diseases, such as type 2 diabetes or cardiovascular disease, where the timing of lifestyle interventions may be more lenient closer to diagnosis but becomes more important later in life as more comorbidities accumulate. A sigmoidal curve is a possible representation of the effect of treatment delay in certain cancers, such as breast or colon, where following early detection there are periods of slow followed by rapid tumor growth and a leveling off when the cancer reaches an advanced stage after which initiating treatment does not improve survival.
The survival probability difference
While the hazard ratio curve characterizes the instantaneous effect of treatment delay on mortality, it is inherently conditional on surviving until treatment. In many clinical settings, however, decisions about treatment timing are made at baseline (e.g. diagnosis), and delaying treatment also carries the risk of death prior to treatment. Thus, it is useful to consider a survival metric that quantifies the absolute survival probability associated with delaying treatment from baseline. We therefore consider the marginal survival probability under treatment at time


Notice that even when there is no time-to-treatment effect (i.e.
We use this marginal survival probability to define a survival probability difference (SPD) comparing treatment at two times

The magnitude of the SPD depends on both the pre-treatment hazard and how treatment effectiveness changes with delay. In settings where mortality risk is concentrated early after diagnosis or injury, even small treatment delays may produce large SPD values because delaying treatment prolongs exposure to the high pre-treatment hazard. Conversely, when early mortality risk is low and treatment effectiveness decays slowly with delay, delaying treatment may have little impact on survival probabilities. Alternative cumulative measures based on the marginal survival distribution, such as restricted mean survival time (RMST) differences, could also be considered.
Simulation design
We conduct a simulation study to assess the behavior of the proposed BHR Cox model under three different types of hazard ratio curves (concave, convex, sigmoidal) and three mortality cumulative incidence scenarios (20%, 40%, 75% cumulative incidence of the competing risk of death).
Individual data is simulated from the BHR Cox model in equation (3) assuming a Weibull baseline hazard for TTT and time to death, and a log-logistic cdf weight function, given in equation (4). Further details of data generation are given in Supplementary Material A.1. The true parameter values are given in Supplementary Tables A1 and A2, and correspond to the hazard ratio curves shown in Figure 2. Censoring times are simulated from an exponential distribution with rate parameters chosen to achieve 20
Due to the applicability of this method in large observational data sets, we compare the performance of the methods in sample sizes of
The slow attenuation of the hazard ratio curve in the convex setting was chosen to assess the performance of the model in settings with a weak time-to-treatment effect. We additionally consider a convex curve setting with a stronger time-to-treatment effect and faster attenuation to the null during the follow-up period. To demonstrate model performance when adjusting for covariates, we also consider a scenario (40% cumulative incidence of death, sample size 5000) that incorporates one binary and one continuous covariate associated with the hazard of death. We also assess performance under misspecification by generating data using a piecewise hazard ratio curve with an initial flat segment followed by a linear increase that does not follow the parametric BHR weight functions.
The data-generating model, denoted “BHR (log-logistic)”, as well as a misspecified BHR Cox model with a Weibull cdf weight function, denoted “BHR (Weibull)”, are fit to each simulated data set, with parameters estimated by optimizing the log partial likelihood function. We also estimate these models using the iterative linearization approach, denoted “BHR* (log-logistic)” and “BHR* (Weibull).” Since we have argued in Section 2 that the Cox model with a linear TTT effect on the log hazard ratio is conceptually inappropriate in this setting, we do not use that model as a data-generating mechanism; however, we do fit it as a comparator in the simulation study, denoted “Cox (linear),” as well as a Cox model with only the treatment effect but not a time-to-treatment predictor, denoted “Cox (null).” We additionally fit a flexible Cox model allowing the treatment effect to vary over time by interacting treatment with a natural cubic spline function of time (df = 4), denoted “Cox (spline).”
We simulate 500 data sets and assess estimation performance for the immediate treatment effect
Results
Figure 3 shows estimated hazard ratio curves for the three hazard ratio curve shapes and varying sample sizes under the 40% mortality cumulative incidence scenario. Supplementary Figures A1–A3 display additional results for the 20%, 40%, and 75% scenarios, including interquartile ranges. Estimates for the immediate treatment effect and hazard ratio curves appear in Supplementary Tables A3–A5 and A6, respectively.
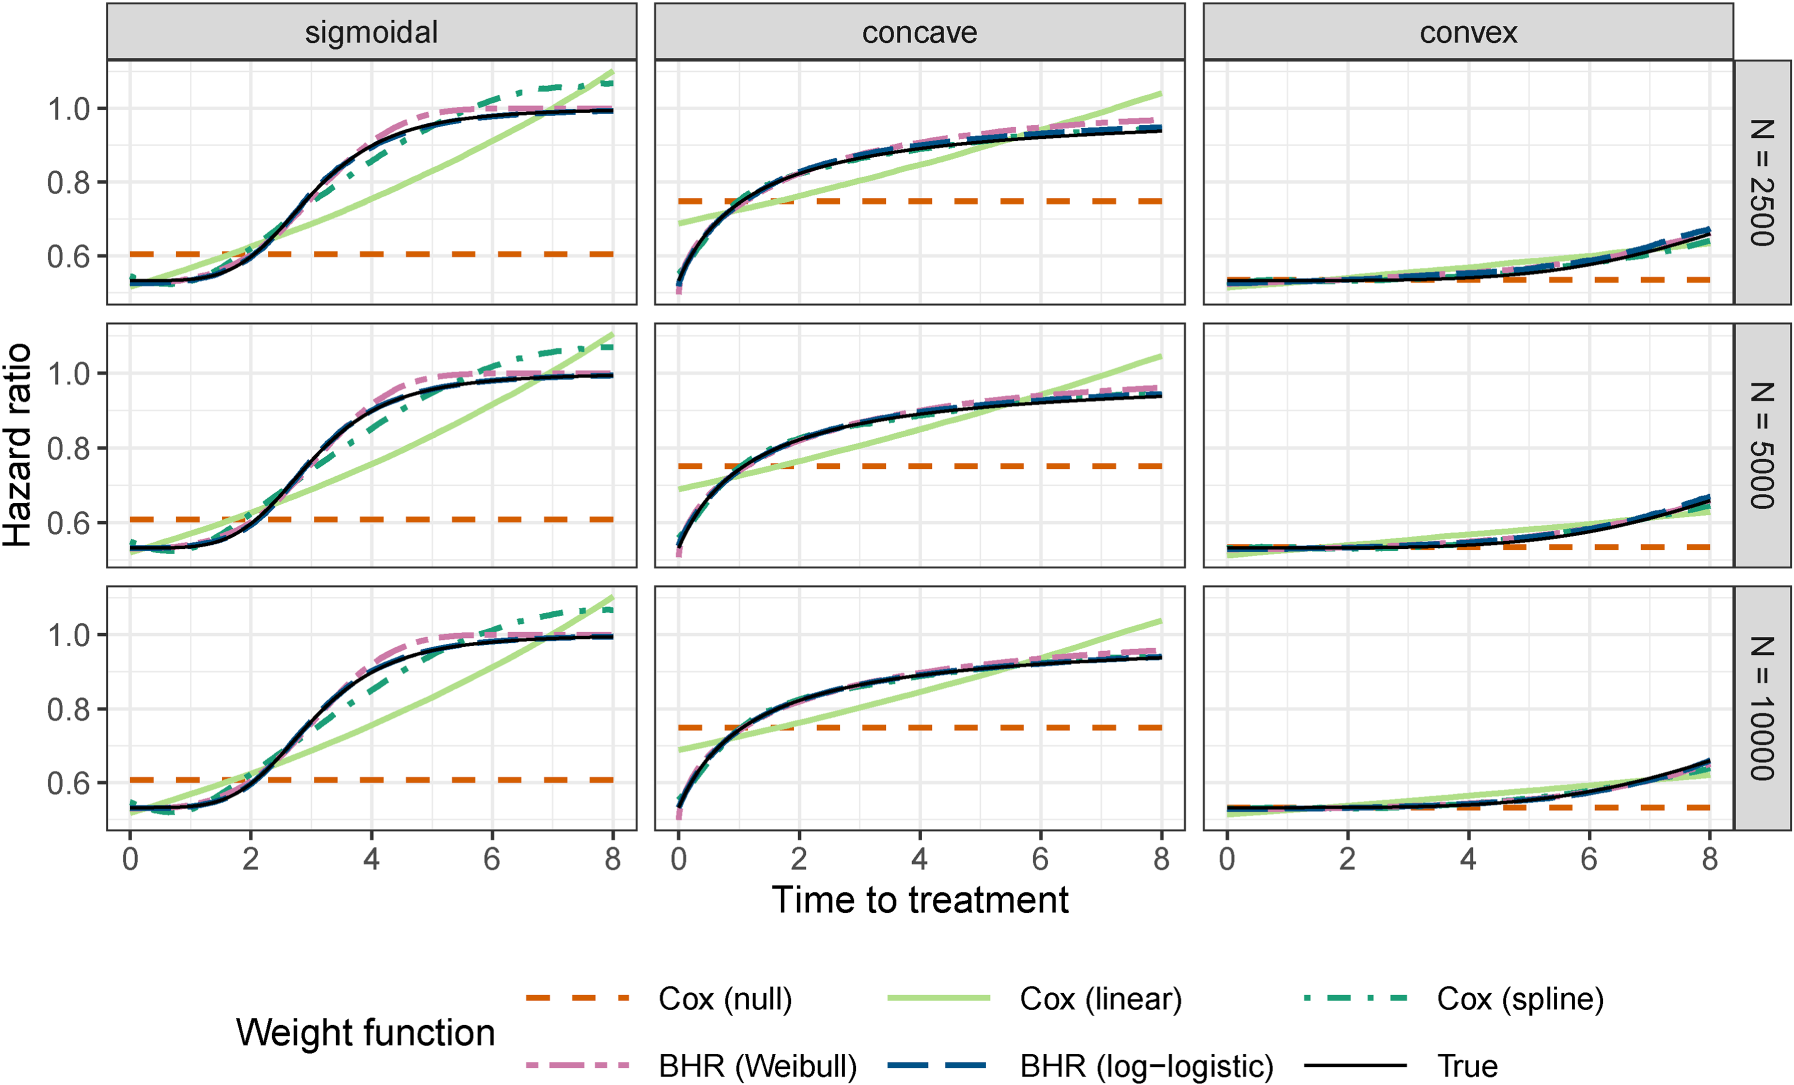
Median of estimated hazard ratio curves with 40% mortality cumulative incidence for varying curve shapes and sample size (N). Results are presented for the direct optimization bounded hazard ratio models (BHR) with log-logistic and Weibull weight functions, and Cox models with no (null) and linear time to treatment effect. The data-generating model uses the log-logistic weight function (black solid line).
Bias in the estimates of
Greater estimation error for the convex hazard ratio curve is likely due to its weak TTT effect, as the hazard ratio attenuates slowly to 1 in this setting (Figure 2). The misspecified Cox models also show low bias in
The BHR models estimated using the iterative linearized estimation procedure (BHR*) showed similar results for the bias of the estimated immediate treatment effect and hazard ratio curves as the models estimated with direct optimization (BHR) (Supplementary Tables A3–A5, A6). They did, however, suffer from some numerical issues for smaller sample sizes, especially in the setting of high mortality cumulative incidence. The median computation time for estimation of the BHR* models was lower than for BHR models across all hazard ratio curve shapes (
Figure 4 shows bias in estimated survival probability differences (SPD) across hazard ratio curve types and mortality settings, using a sample size of 10,000. Supplementary Figures A4–A6 display corresponding results for other sample sizes, including interquartile ranges. We evaluate the bias in predicted SPD values when comparing delayed versus immediate treatment at five specified time points. The bias is low for the BHR models even for the smaller sample sizes and greater mortality cumulative incidence. In the concave setting, the SPD is underestimated by the misspecified BHR model and both the correctly specified and misspecified weight functions have greater variability in their predictions. In the sigmoidal and concave settings with stronger TTT effects, the Cox models overestimated the SPD, with the largest bias observed for the Cox models with null and linear TTT effects and attenuated bias for the model with spline effects. Reflecting the weak TTT effect in the convex setting, the bias of SPD is low for the misspecified Cox models.
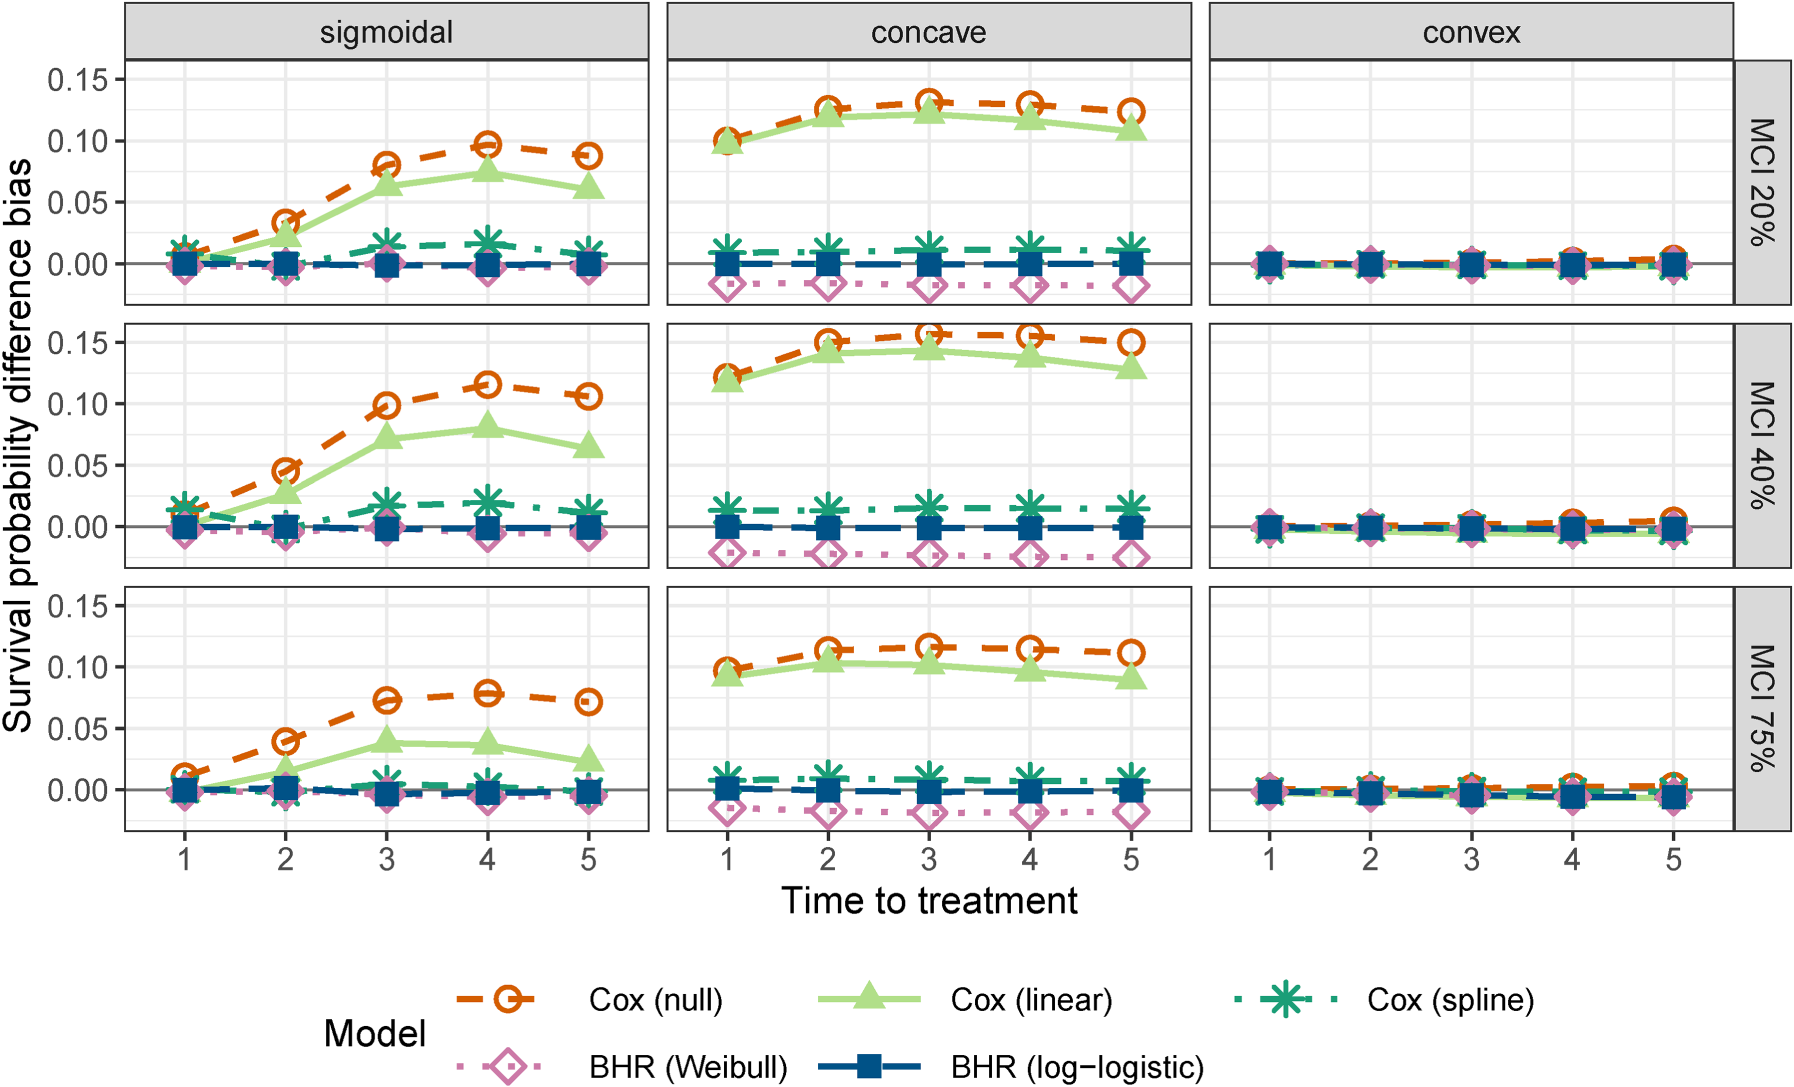
Median of the bias of the survival probability difference versus immediate treatment at survival time
In Supplementary Material A.7, we demonstrate that for smaller sample sizes between 500 and 2000, the bias of the immediate treatment effect increases, with reduced convergence rates observed in some settings, consistent with weaker identification at small sample sizes (Supplementary Table A11). Estimation of the hazard ratio curve shape remains reasonably accurate at smaller sample sizes, with root mean squared differences (RMSD) generally below 0.05 for
To assess robustness to model misspecification, we simulated data under a piecewise hazard ratio curve that does not follow the parametric weight function used in the BHR model (Supplementary Material A.8). In this setting, the BHR models continued to provide accurate estimates of the immediate treatment effect and were able to recover the hazard ratio and SPD curves well. The Cox models with null and linear TTT effects produced biased estimates of the immediate treatment effect, while the spline-based model violated the expected monotonicity of the hazard ratio, exhibiting non-monotonic behavior in regions where the true hazard ratio was constant.
Overall, the BHR models, whether estimated via direct or iterative methods, exhibit low bias for the hazard ratio curves and survival probability differences (SPD) across a range of hazard curve shapes and sample sizes.
To examine the performance of the proposed methods in practice, we applied them to colon cancer data from the National Cancer Database (NCDB). Exploring the effect of TTT in colon cancer is of particular importance since treatment delays often occur during critical periods of high tumor growth rates 1 and have been associated with increased risk of metastasis and limiting treatment options. 2 Conflicting results have been reported for the association between TTT and survival in colon cancer, with several studies reporting negative or U-shaped associations between TTT and mortality. 29 While some of these inconsistencies may be attributed to differences in study population or adjustment variables, previous results are also often based on analytic methods that do not appropriately account for delayed entry or use time-dependent Cox models with an unrestricted hazard ratio.6,18,30–33
We provide an analysis of this data that estimates the TTT effect within the proposed BHR framework. We compare the BHR model results with both a null model (no TTT effect) and a model with a linear TTT effect. Constraining the behavior of the hazard ratio to satisfy a conceptually sound model may result in more reasonable findings than the traditional Cox modeling approaches.
Data description and modeling approaches
The NCDB is a joint project of the Commission on Cancer of the American College of Surgeons and the American Cancer Society. We analyzed NCDB data on individuals diagnosed with colon cancer between 2010 and 2019, stratified by stage at diagnosis. Exclusion criteria and adjustment variables followed prior work 6 and are detailed in Supplementary Material B.
Two standard Cox models were fit, one with only treatment included, “Cox (null)” and one with treatment plus its interaction with TTT, “Cox (linear).” Two BHR Cox models were fit, one with a Weibull cdf weight function, “BHR (Weibull),” and one with a log-logistic cdf weight function, “BHR (log-logistic).” These models differ in the structural assumptions imposed on how treatment benefit evolves with delay. Because of these differences, likelihood-based comparisons are not the primary basis for interpretation. Instead, we focus on the resulting hazard ratio and survival probability patterns. Expanded likelihood-based comparisons are provided in the supplement. Models were adjusted for potential demographic and clinical confounders, described in Supplementary Material B.
Additionally, as a diagnostic measure to assess calibration of the estimated survival probability differences, we compared the fit of these models to a more flexible Cox model with time-dependent strata for treatment time. In this model, there is no explicit term for TTT; instead the model allows a different baseline hazard for mortality in each TTT stratum. The first stratum was defined to be pre-treatment; then, patients were assigned to one of 10 strata based on a grid with intervals spaced 0.05 years apart based on their observed treatment time.
Estimated treatment and TTT effects
After exclusions, data was available on approximately
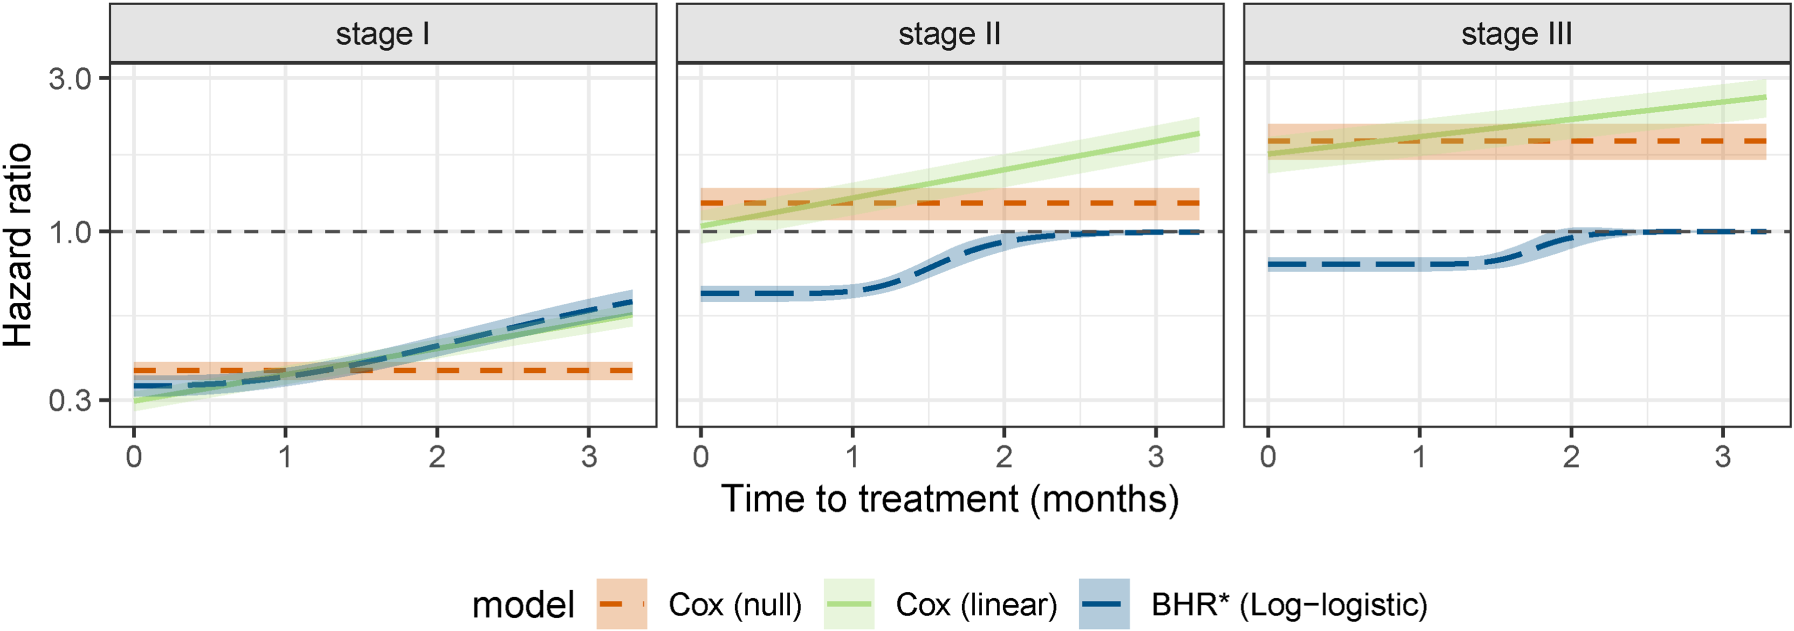
Hazard ratios for treatment as a function of time to treatment, as estimated from the colon cancer NCDB data. Shaded areas represent pointwise 95% confidence intervals for the hazard ratio. Note that the
Estimated hazard ratio curves from the four models for the effect of treatment on mortality are shown in Figure 5. These represent the ratio of the instantaneous risk of death for a patient treated at the time indicated on the
Likelihood ratio test results comparing proposed BHR fits with a null model, that is, no TTT effect.
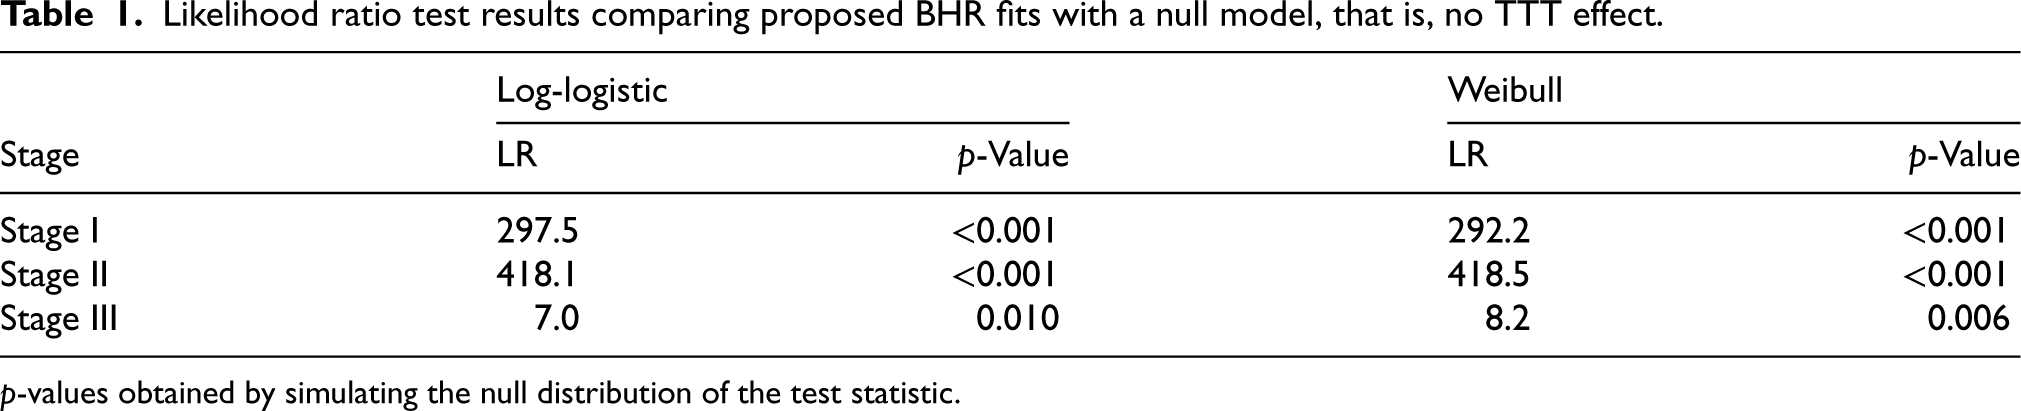
p-values obtained by simulating the null distribution of the test statistic.
There are notable differences in the estimated hazard ratio curves by stage at diagnosis. For stage I disease, the hazard ratio is less than 1 for all models and TTT
The BHR models suggest that the treatment effect then gradually returns to the null for treatment by 2–3 months post-diagnosis. Although these models produce different hazard ratio patterns, all are adjusted for the same covariates and remain subject to potential unobserved or time-varying confounding. Thus, the differences between models reflect the structural assumptions imposed on the treatment effect. The BHR model does not remove confounding bias, but instead estimates treatment effects under the assumption that treatment benefit attenuates smoothly toward the null as treatment delay increases.
Figure 6 shows the SPD distributions as median and upper and lower quartiles, at treatment times of 1, 2, 3, and 4 months. All SPD values were calculated with reference to immediate treatment, that is,
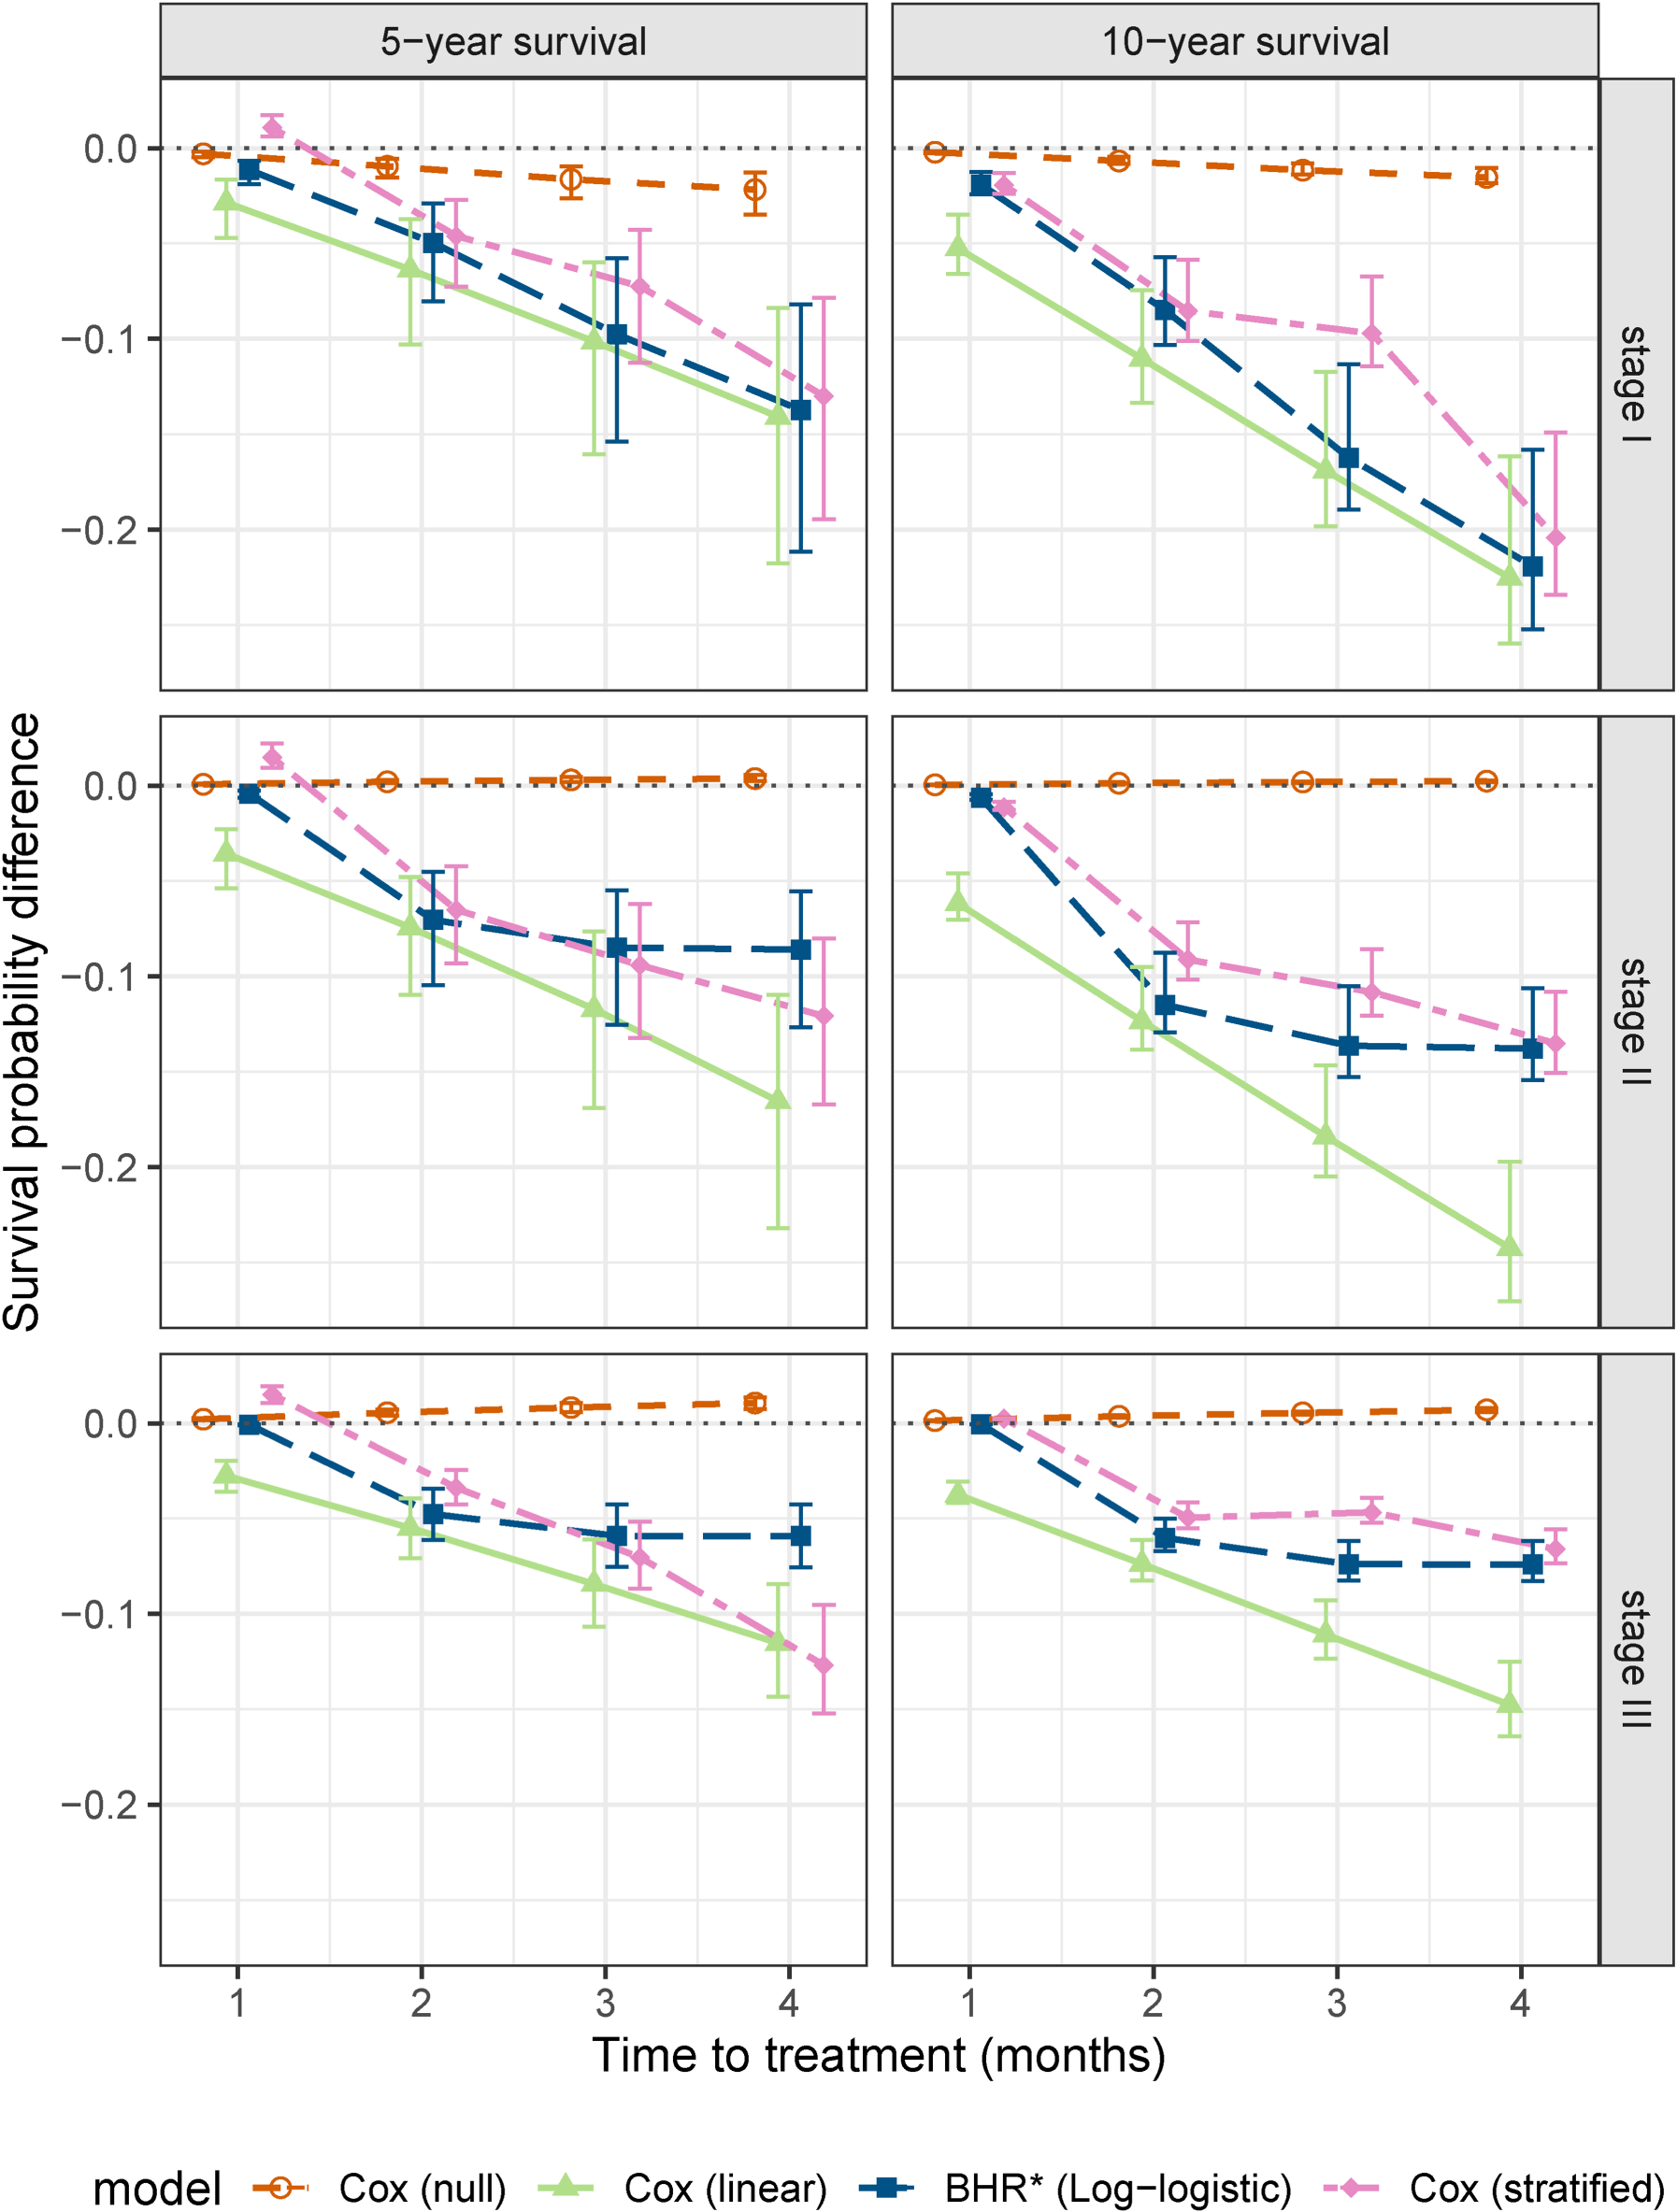
SPD functions as estimated from the colon cancer NCDB data. These represent the difference in survival probability between hypothetical patients treated at the time indicated by the
In resource-limited settings that require time-sensitive care, quantitative methods that characterize the effect of treatment delays are needed to guide prioritization and timing of care. In this article, we identify a mathematical inconsistency in modeling TTT as a predictor with an unconstrained effect on the hazard in a Cox model, which can imply that receiving treatment increases mortality risk. We introduce a BHR model that avoids this contradiction by incorporating the effect of immediate treatment and a parametric weight function that attenuates this effect with increasing delay.
Traditional Cox models that assume a log-linear treatment effect are not constrained to satisfy the structural assumptions considered here for the relationship between treatment delay and survival, as seen in our colon cancer application where they implied a harmful effect of immediate treatment. More flexible approaches, such as stratified or piecewise Cox models that estimate separate hazards across treatment-time categories, allow greater flexibility in the shape of the treatment-timing effect, but may produce non-monotonic patterns or be less stable in sparsely observed regions. The BHR model provides a compromise: it enforces smooth monotonic attenuation of treatment benefit while allowing the data to determine the rate of decay. This balance improves both stability and interpretability of the estimated hazard ratio curve across a range of admissible attenuation patterns, including near-linear, plateauing, and flat patterns.
The effect of treatment timing is often explored in large observational cohorts or registries with heterogeneous treatment timing, as in our colon cancer application. We propose an iterative linearized estimation procedure that leverages standard Cox model software for large samples where direct maximization of the partial likelihood is computationally prohibitive. The procedure builds on the gradient-based optimizer in
Simulation results showed that larger sample sizes are needed in settings with high rates of mortality cumulative incidence, an underlying concave hazard ratio curve, or modest TTT effects (i.e. slow attenuation of the hazard ratio curve to the null) where there is weaker identification of the weight function parameters from the data. In some settings, an approximately linear TTT effect from a traditional Cox model may be appropriate for the range of relevant treatment delay times; however, the BHR model remains preferable, as it can approximate linear effects while accommodating a broader range of plausible hazard ratio shapes.
Although our proposed BHR weight functions are chosen to represent realistic relationships between TTT and mortality risk, it is possible that they do not adequately capture the true shape of the TTT–mortality risk curve in some data sets. One can consider using more flexible weight functions, for example, the generalized or three-parameter gamma 34 cdf. These specifications, however, lack closed-form expressions for the derivatives of the weight function required by the proposed linearization estimation approach, and thus may have limited implementation in larger data sets.
Causal inference frameworks, such as marginal structural models and the clone-censor-weight approach, have been developed to estimate the effects of time-dependent treatments in the presence of time-dependent confounding.35,36 Our approach does not address causal identification, but instead proposes a modeling framework for representing how treatment benefit evolves with delay while ensuring clinically plausible hazard behavior. In principle, the BHR formulation could be incorporated within causal inference frameworks, where the causal method addresses confounding while the BHR structure models how treatment benefit evolves over time.
There are other settings where a BHR Cox model may be appropriate. For example, in examining the effect of treatment discontinuation, one could use the proposed weight function to balance between the hazard of death pre- and post-discontinuation with the condition that the hazard on treatment never exceeds the hazard post-discontinuation. This can be implemented within the proposed framework with some reparameterization to account for a decreasing rather than increasing weight function, and can take advantage of the model flexibility to threshold at a non-null value if indicated by the data.
The BHR Cox model was proposed within the proportional hazards framework. Alternative survival models, such as an additive hazard model or a multi-state model that assumes non-proportional hazards for the transitions to death pre- and post-treatment also require imposing constraints to ensure the monotonicity of mortality risk with increasing TTT. Without the application of the weight function to a proportionality constant, this is not a direct extension of the proposed approach. Future research will explore how similar restrictions might be applied to investigate a TTT effect using other survival models.
Supplemental Material
sj-pdf-1-smm-10.1177_09622802261458075 - Supplemental material for A bounded hazard ratio Cox model for the effect of time to treatment on mortality
Supplemental material, sj-pdf-1-smm-10.1177_09622802261458075 for A bounded hazard ratio Cox model for the effect of time to treatment on mortality by Krithika Suresh, Wenyu Zhang and John D Rice in Statistical Methods in Medical Research
Footnotes
Acknowledgments
The data used in the study are derived from a de-identified NCDB file. The American College of Surgeons and the Commission on Cancer have not verified and are not responsible for the analytic or statistical methodology employed, or the conclusions drawn from these data by the investigator.
Ethical approval and informed consent statements
There are no human participants in this article, and informed consent was not required.
Funding
The authors disclosed receipt of the following financial support for the research, authorship, and/or publication of this article: Research reported in this publication was supported by The Sunway Trust Scholarship and Internship funds and the National Cancer Institutes of Health under Award Number P30CA046592. The content is solely the responsibility of the authors and does not necessarily represent the official views of the National Institutes of Health.
Declaration of conflicting interest
The authors have no conflicting interests to declare with respect to the research, authorship, and/or publication of this article.
Data availability statement
The data used in this study are available from the National Cancer Data Base (NCDB). Access to this data requires approval and can be requested directly from the NCDB.
Supplemental material
Supplemental material for this article is available online.
References
Supplementary Material
Please find the following supplemental material available below.
For Open Access articles published under a Creative Commons License, all supplemental material carries the same license as the article it is associated with.
For non-Open Access articles published, all supplemental material carries a non-exclusive license, and permission requests for re-use of supplemental material or any part of supplemental material shall be sent directly to the copyright owner as specified in the copyright notice associated with the article.