
Abstract
We develop a robust bias-corrected method of inference about the ratio of age-standardized rates (RASR) for comparing the age-standardized rate (ASR) between a subpopulation and the whole population. Unlike previous methods, the proposed approach does not rely on the proportional age-distribution (PAD) assumption, which is often unrealistic in many situations. Like an existing approach, the method corrects for bias resulting from sampling errors when using sample-based population estimates, instead of census-based populations, as the denominators for estimating ASRs. This broadens the applicability of the proposed method in studying cancer risk factors beyond the basic demographic characteristics. The robust bias-corrected estimator of the RASR and the associated variance estimator and confidence intervals are derived. We show empirically that the proposed RASR estimator performs significantly better than the existing estimator, which relies on the PAD assumption, especially when the latter assumption fails. Specifically, the proposed RASR estimator significantly reduces the bias without increasing the variance. On the other hand, when the PAD assumption holds, our RASR estimator performs similarly to the existing estimator. The proposed method has also shown highly desirable performance when at-risk population estimates used for calculating ASRs are subject to sampling errors. We also show empirically that the proposed variance estimator performs satisfactorily. A real-data application is discussed.
Keywords
Introduction
Age-standardized rates (ASRs) of cancer incidence and mortality are essential metrics for monitoring the burden of cancer in a population, for example Sherman et al. 1 Cancer surveillance often involves comparisons of ASRs between a subgroup and its parent group to highlight specific groups with higher risks of cancer. This helps guide resource allocations to ensure prevention and treatment efforts are directed where they are most needed. For example, if a racial group shows an elevated incidence of a specific type of cancer compared to the overall population, public health campaigns can be tailored to raise awareness, improve screening rates, and promote preventive measures within that racial community. 2 If a specific region exhibits higher rates of lung cancer, this might prompt investigations into environmental factors such as air quality and smoking rates, leading to localized public health initiatives. 3
A standard approach of comparing ASRs assumes that the two populations under comparison are exclusive and independent. 4 This assumption simplifies the estimation process, however, may introduce bias when used to compare overlapping groups. Tiwari et al. 5 addressed this issue in the context of comparing a state with the U.S. While Tiwari’s method explicitly incorporated the correlation between the two groups, it simplified the estimation by assuming both populations have the same age distribution, that is, the proportional age-distribution (PAD) assumption. Age-standardization adjusts for differences in age structure, ensuring that observed differences in cancer rates are not simply due to variations in age distribution but reflect true differences in risk. However, this simplification not only nullifies the purpose of age-standardization but also overlooks important distinctions among populations. Because of this limitation, official cancer surveillance systems—such as the Surveillance, Epidemiology, and End Results (SEER) Program of the National Cancer Institute (NCI), have not yet incorporated Tiwari’s method for comparing ASRs between overlapping groups in their published rate ratio statistics. A recent study by Zhu et al. 6 was built upon Tiwari’s method by incorporating spatial autocorrelation when comparing geographic areas, yet it shares the same limitation. Additionally, because it relies on Bayesian calculations, it is not easily integrated into widely used cancer statistics softwares, such as SEER*Stat, which favors estimators available in closed-form expressions. 7
A further obstacle in accurately identifying elevated ASRs is the presence of sampling errors within the population denominators used for ASR estimation. This issue arises when populations of interest are not available from decennial censuses, necessitating the use of sample surveys to obtain population data with detailed characteristics, such as immigration status, for example, Jiang et al. 8 While sampling errors had been accounted for in the inference of ASRs and in the ratio of ASRs for non-overlapping populations,8–10 there remains an absence of methodologies for comparing ASRs between correlated populations. This shortcoming has limited the comprehensiveness of official cancer statistics released by federal agencies.
In this article, we develop a robust statistical approach to simultaneously solving both challenges, that is, (i) that the populations being compared are overlapping, and (ii) the presence of sampling errors in the ASRs. The rest of the article is organized as follows. Section 2 introduces notations and reviews the existing methods. In Section 3, we consider strategies of estimation without the PAD assumption. In particular, we propose a robust bias-corrected ratio estimator without making the PAD assumption. In Section 4, we carry out extensive simulation studies to evaluate the accuracy of the proposed ratio estimator by assessing the relative bias as well as coefficient of variation in comparison with two existing estimators and the three newly developed alternative estimators. We consider the case of no sampling error in the population data (i.e. Tiwari et al., 2010) and the case where the population data involve sampling errors. In both cases, we consider situations where the PAD assumption holds or does not hold. In Section 5, we derive a variance estimator for the proposed robust bias-corrected ratio estimator and evaluate its precision empirically. A real-life example is considered in Section 6. Discussion and concluding remarks are offered in Section 7. Technical details, as well as additional simulation results, are deferred to Supplementary Material.
Notations and existing methods
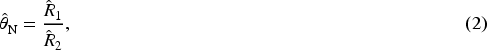
The ASR is defined as a weighted average of component rates of different age groups, that is,
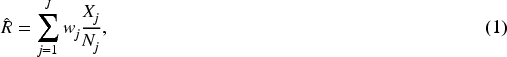
The naive ratio of ASRs (RASR) is defined as
An important common underlying assumption for the naive RASR, (2), as well as that of Jiang et al.
8
is that ASRs of two comparing populations,


Following Jiang et al.,
8
sec. 2.2, the basic distributional assumption on
Tiwari et al. (2010) considered point and interval estimation of

It should be noted that Tiwari et al. (2010) assumes there is no sampling error in the denominator of the ASR estimates, in which case one has
Recall that

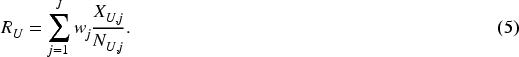
We shall explore two strategies of estimating
Independent random variables are, in general, easier to handle. Thus, a natural idea is to try to express the quantity of interest, which involves correlated ratios, as a function of independent random variables. Under the age-proportionate set-up,


Under the PAD assumption, we have

If

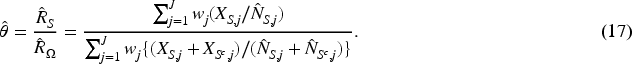
To extend the method without the PAD assumption, we continue with (9) but without further assuming (10). It is easy to show


An alternative substitution estimator can be obtained by replacing

From the development in Section 3.1, it is evident that the development and accuracy of the
Note that the naive RASR, (2), is an estimator of


To gain insight into the relative accuracy of various RASR estimators proposed, we carry out a series of simulation studies to compare the magnitudes of bias reduction across several estimators. These include the naive estimator,
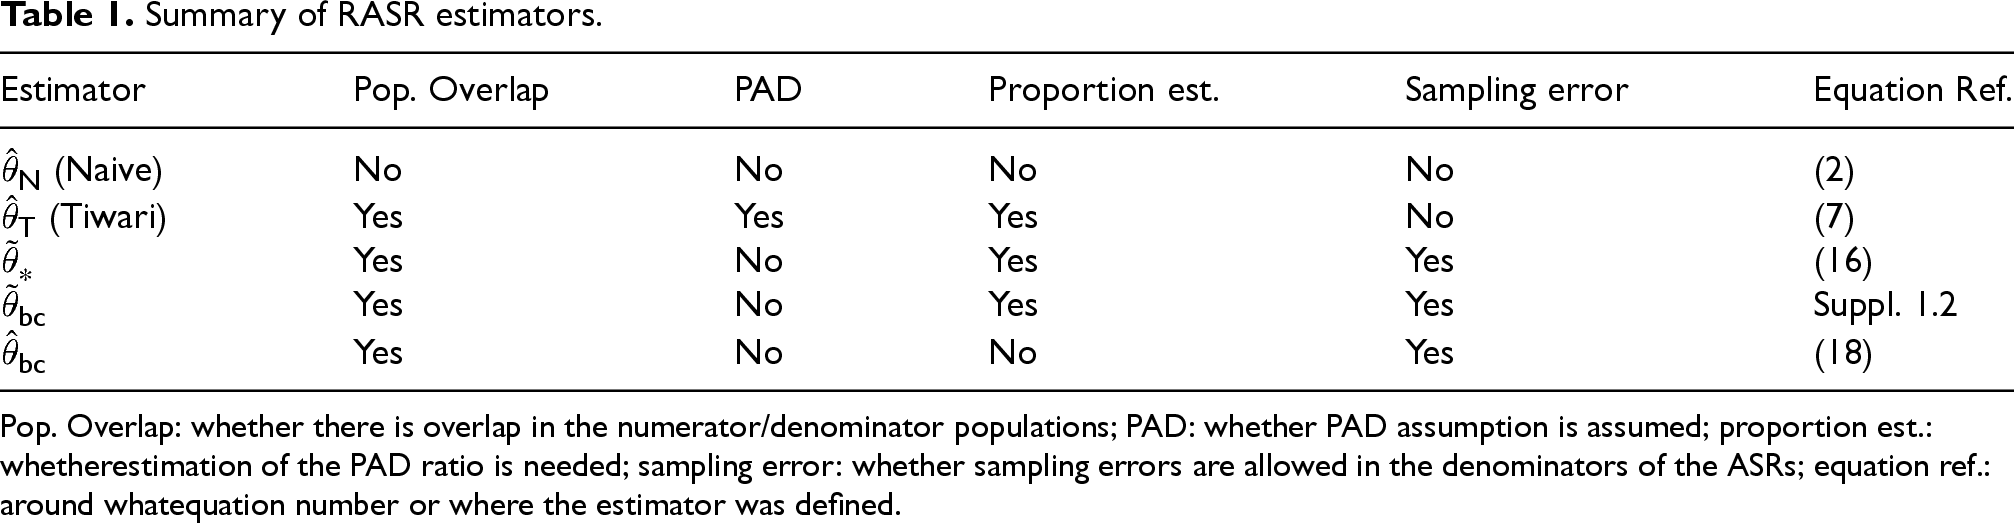
Summary of RASR estimators.
Summary of RASR estimators.
Pop. Overlap: whether there is overlap in the numerator/denominator populations; PAD: whether PAD assumption is assumed; proportion est.: whetherestimation of the PAD ratio is needed; sampling error: whether sampling errors are allowed in the denominators of the ASRs; equation ref.: around whatequation number or where the estimator was defined.
Three subsections of simulation studies are presented below. Sections 4.1 and 4.2 focus on the bias, or bias-correction, properties of different estimators. In particular, we show that the proposed bias-corrected estimator,
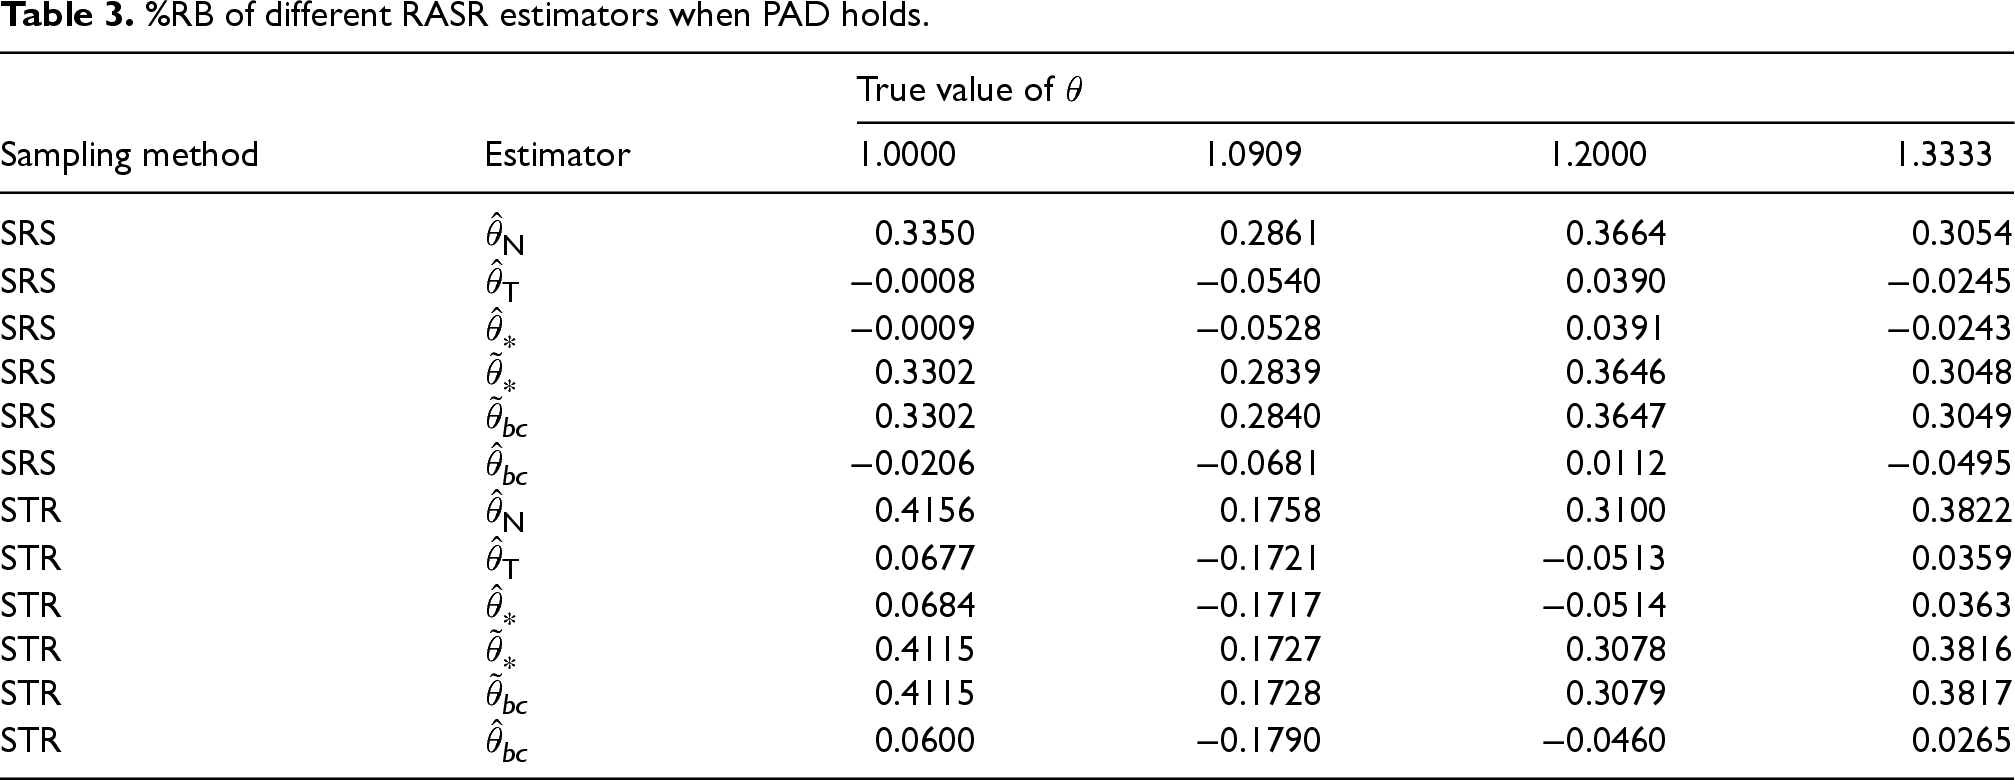
The first set of simulation studies evaluate the bias reduction when the population totals involve sampling errors. We consider a scenario where the PAD assumption holds and a scenario where it does not hold. Tables 2 and 3 report the percentage relative bias (%RB) based on 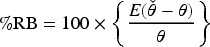
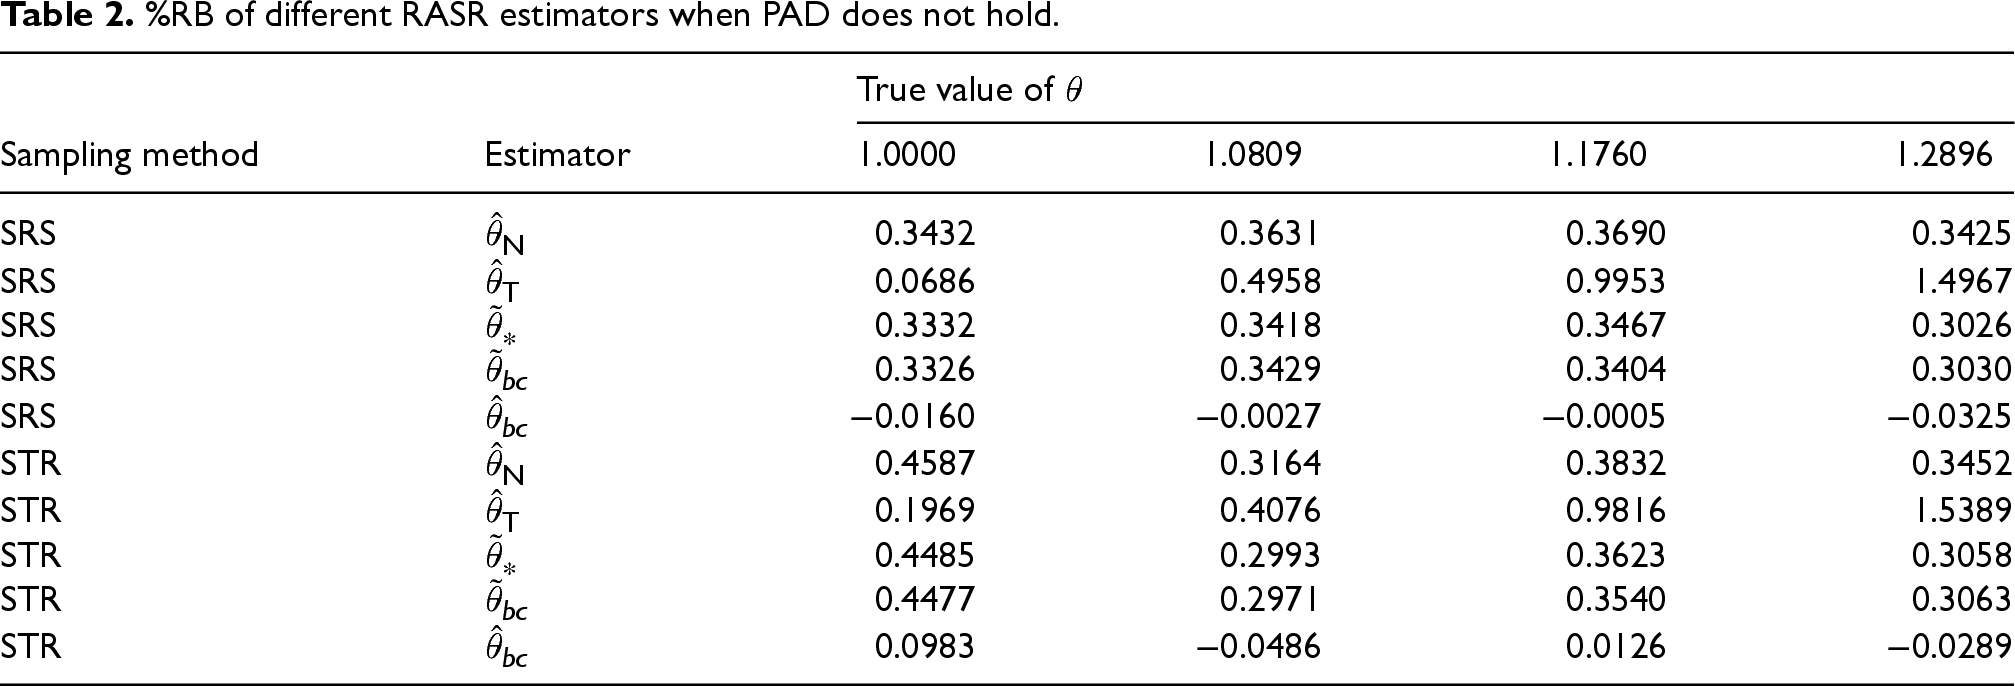
%RB of different RASR estimators when PAD does not hold.
%RB of different RASR estimators when PAD does not hold.
%RB of different RASR estimators when PAD holds.
The population data is simulated using either simple random sampling (SRS) or stratified random sampling (STR) as the sampling procedure, for example, Lohr.
13
For both subpopulation
As it is easier to control the true ratio
For each fixed 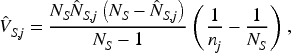
In the STR setting, the procedure is similar except that the population is first stratified into 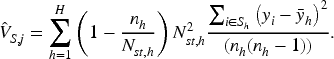
Based on the simulation results in Table 2, it is evident that when the PAD assumption does not hold and the true
From the simulation results in Table 3, where the PAD assumption holds and the true
Additional simulation studies are presented in the Section 4.3.
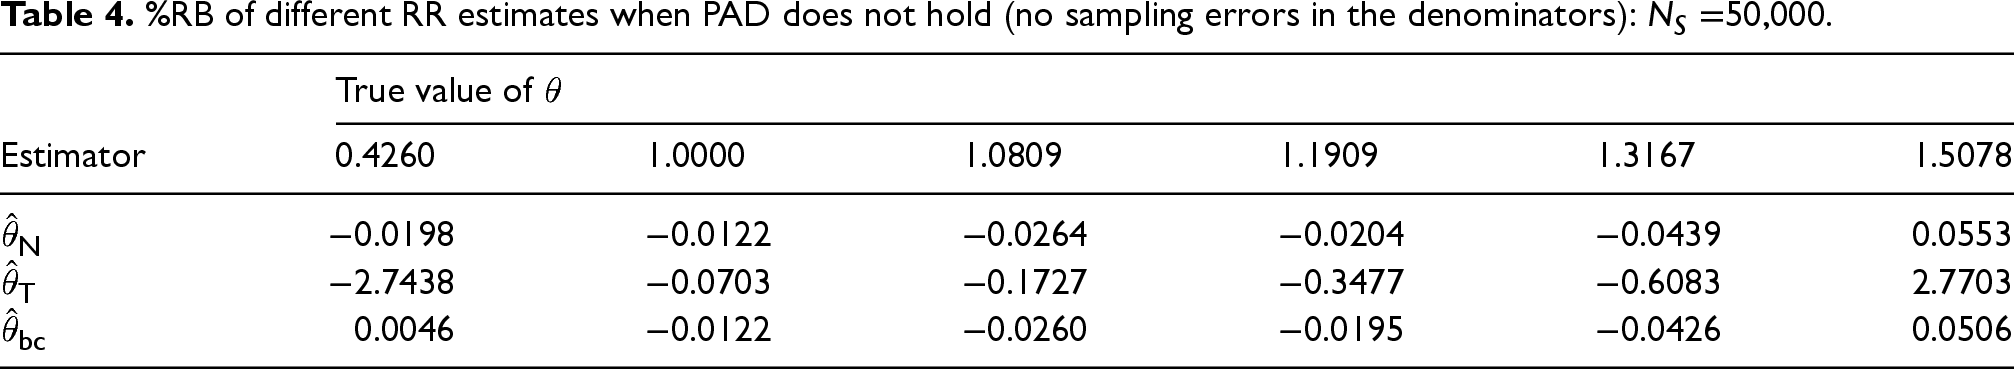
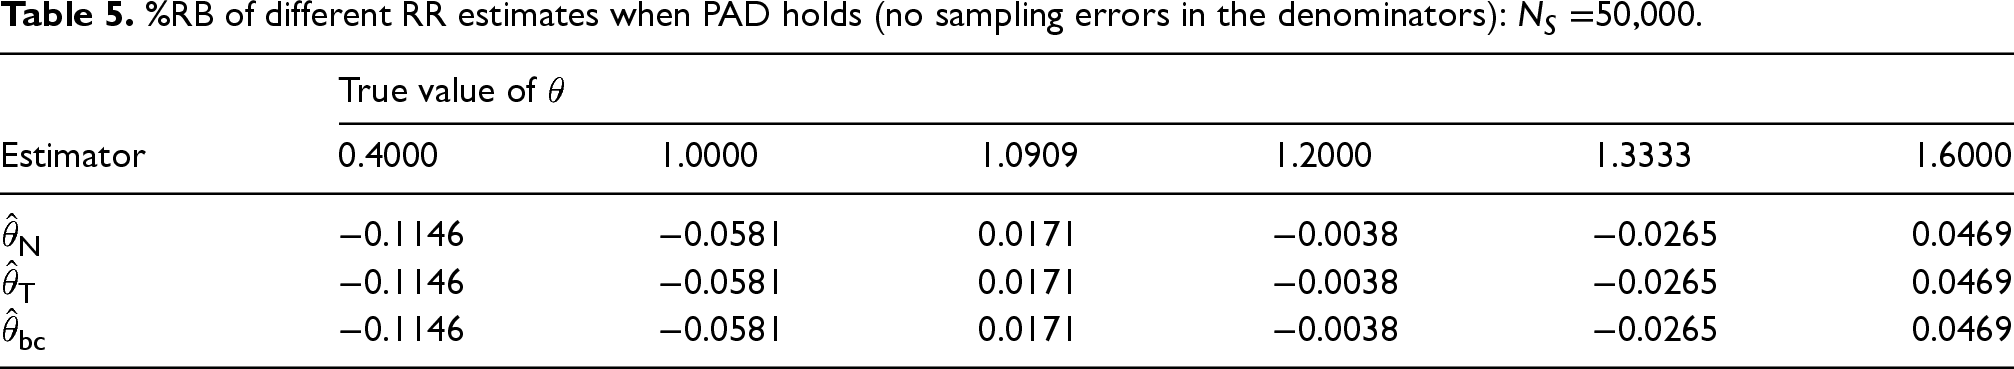
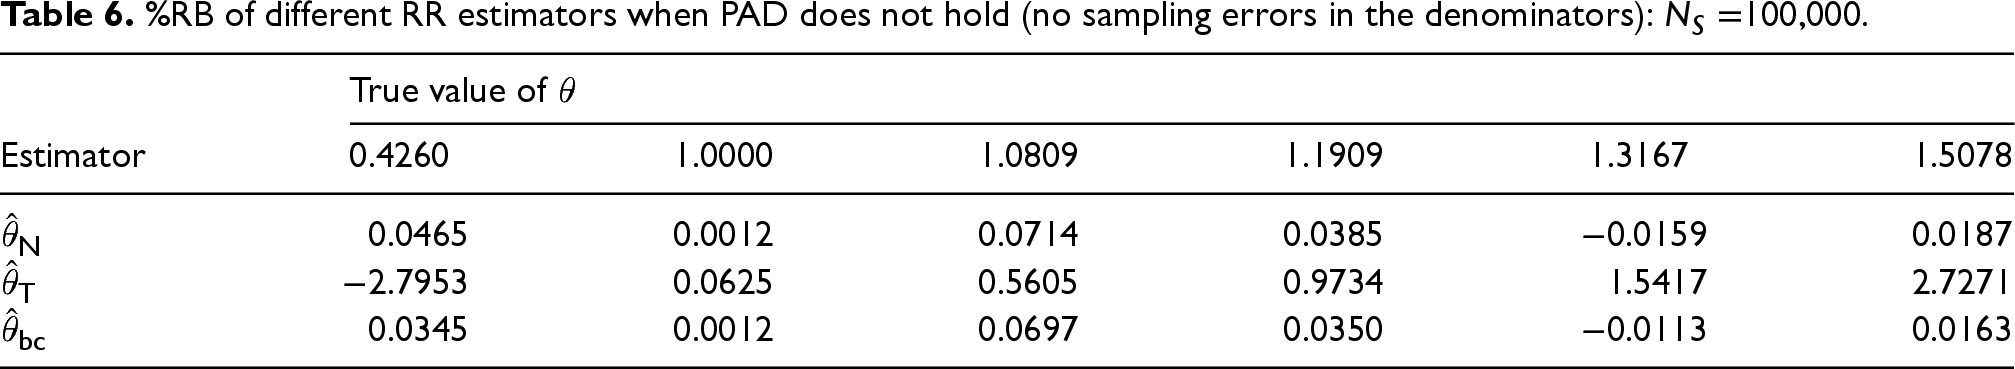
In this subsection, we consider an “ideal” situation where the population data of the ASRs do not involve sampling errors. This is the case considered by Tiwari et al. (2010). Similar to Tables 2 and 3, we present the corresponding results when the denominators of the ASRs do not involve sampling errors. In light of the superior performance observed for
%RB of different RR estimates when PAD does not hold (no sampling errors in the denominators):
50,000.
%RB of different RR estimates when PAD does not hold (no sampling errors in the denominators):
%RB of different RR estimates when PAD holds (no sampling errors in the denominators):
%RB of different RR estimators when PAD does not hold (no sampling errors in the denominators):
%RB of different estimators when PAD holds (no sampling errors in the denominators):
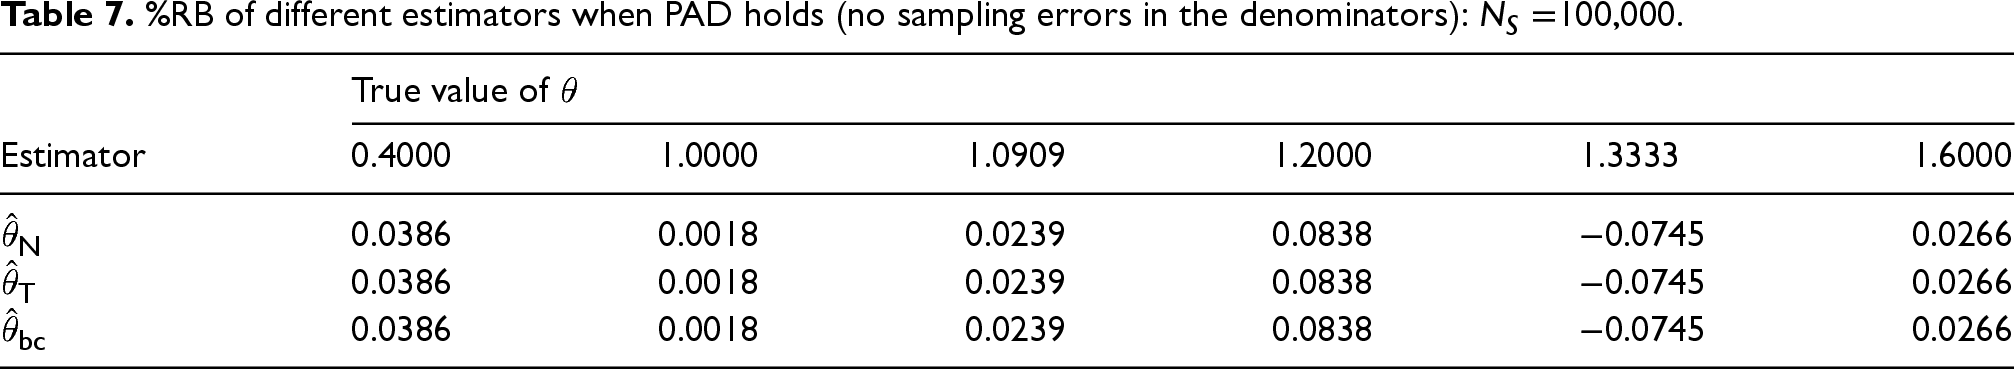
It is seen that there is no difference in the results, up to the 4th digit, among the three estimators when PAD holds. (It should be noted that there are differences beyond the 4th digit, so the results are not exactly the same.) This shows that, when there is no sampling error in the denominators and the PAD holds, the different estimation strategies, or bias correction, yield essentially no improvement, one over the other. On the other hand, when the PAD assumption does not hold, both
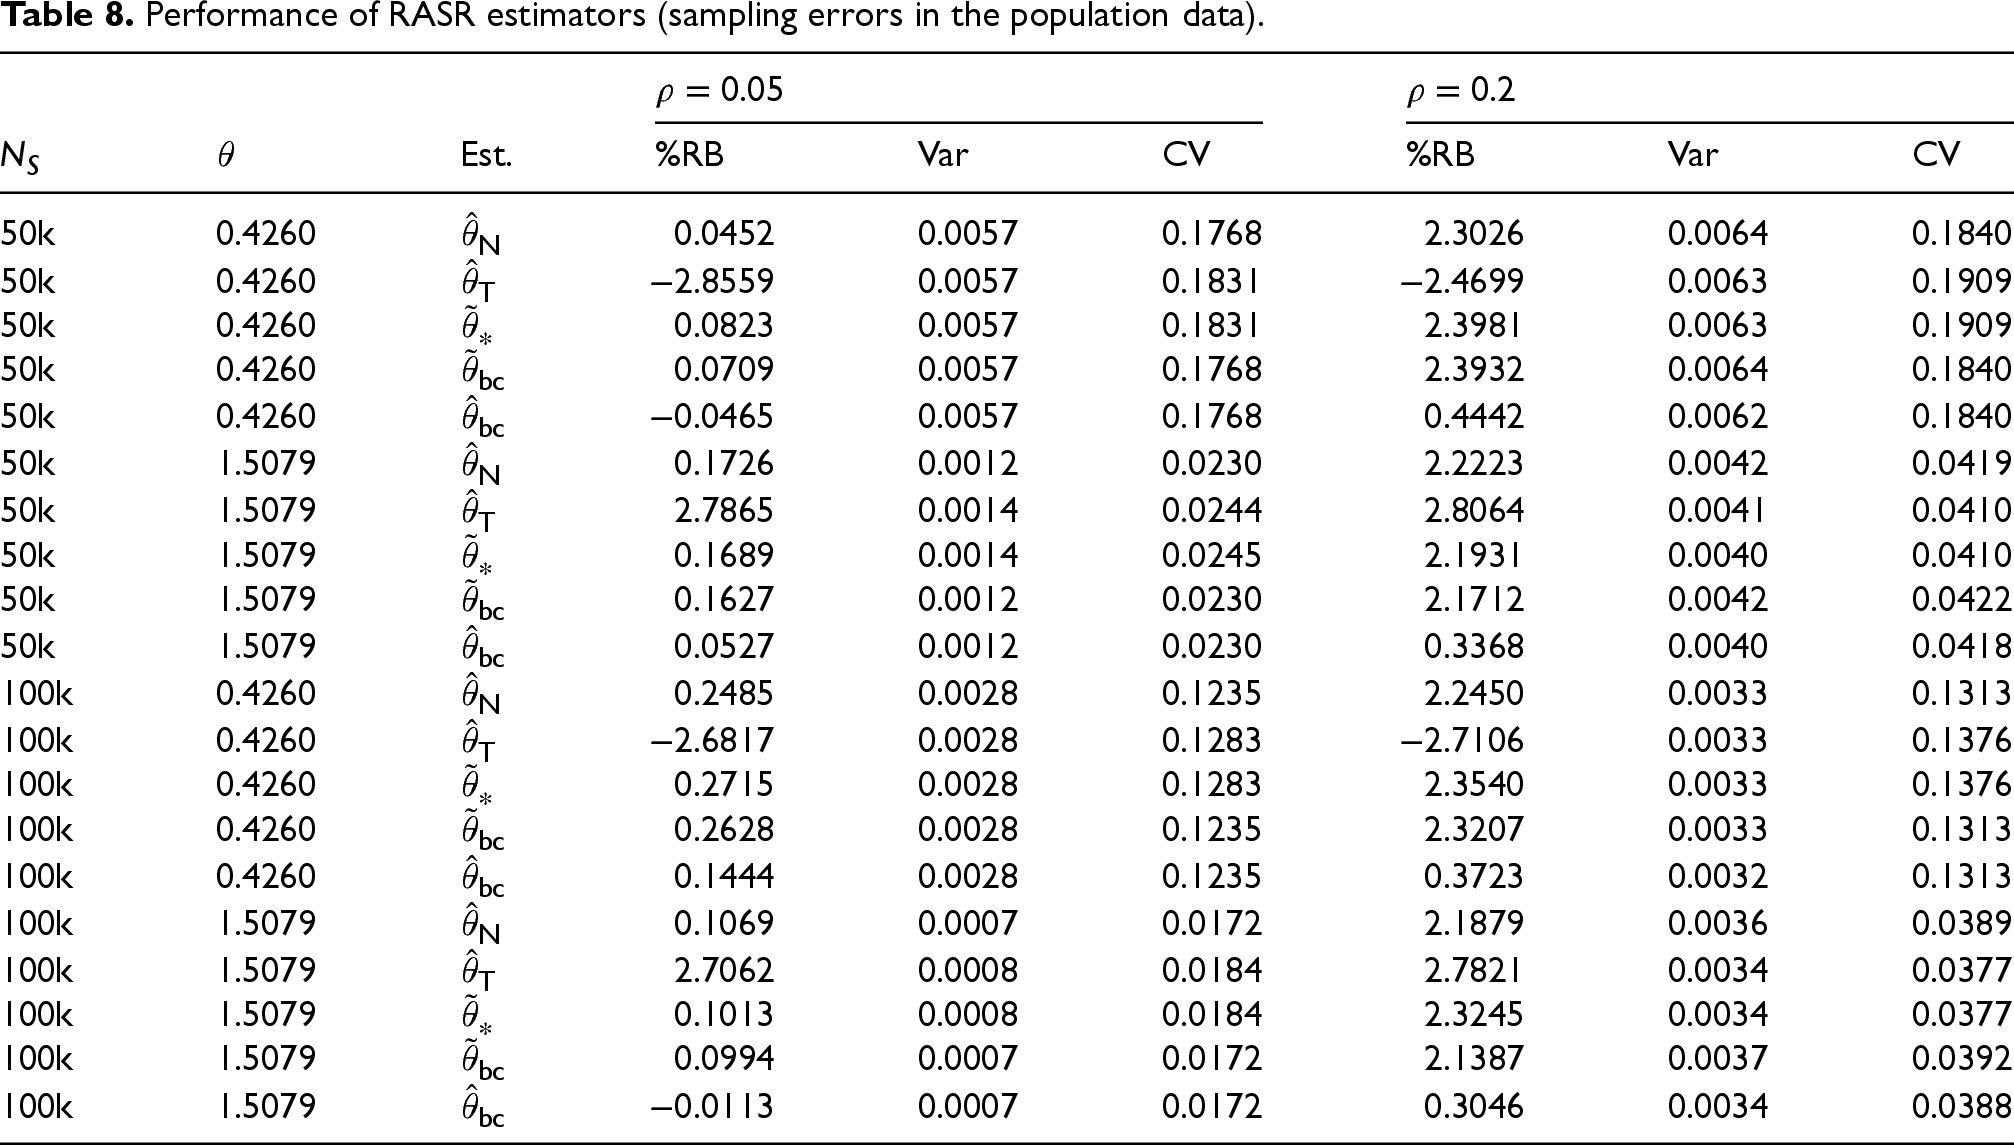
In this subsection, we expand the simulation study presented in Section 4.1 by exploring the scenario presented in Jiang et al.
9
In this scenario, the PAD assumption does not hold, and
Performance of RASR estimators (sampling errors in the population data).
Performance of RASR estimators (sampling errors in the population data).
Although our purpose is to develop bias-corrected estimators, we would like to make sure, ideally, that the bias-correction does not significantly increase the variance; otherwise, there may be a concern about “bias-variance trade-off”. The performance in terms of the bias correction is measured by the %RB. As for the performance in terms of the variance, note that the quantities we are dealing with are rates, which themselves may be small. Thus, to take this into consideration, the CV is considered, which corresponds to the relative standard deviation with respect to the mean. The CV of an estimator, 
Once more, it is evident that
Next, we consider a simulation setting similar to that reported in Table 2 but utilizing the same true
Performance of RASR estimators under SRS/STR setting (sampling errors in the population data).
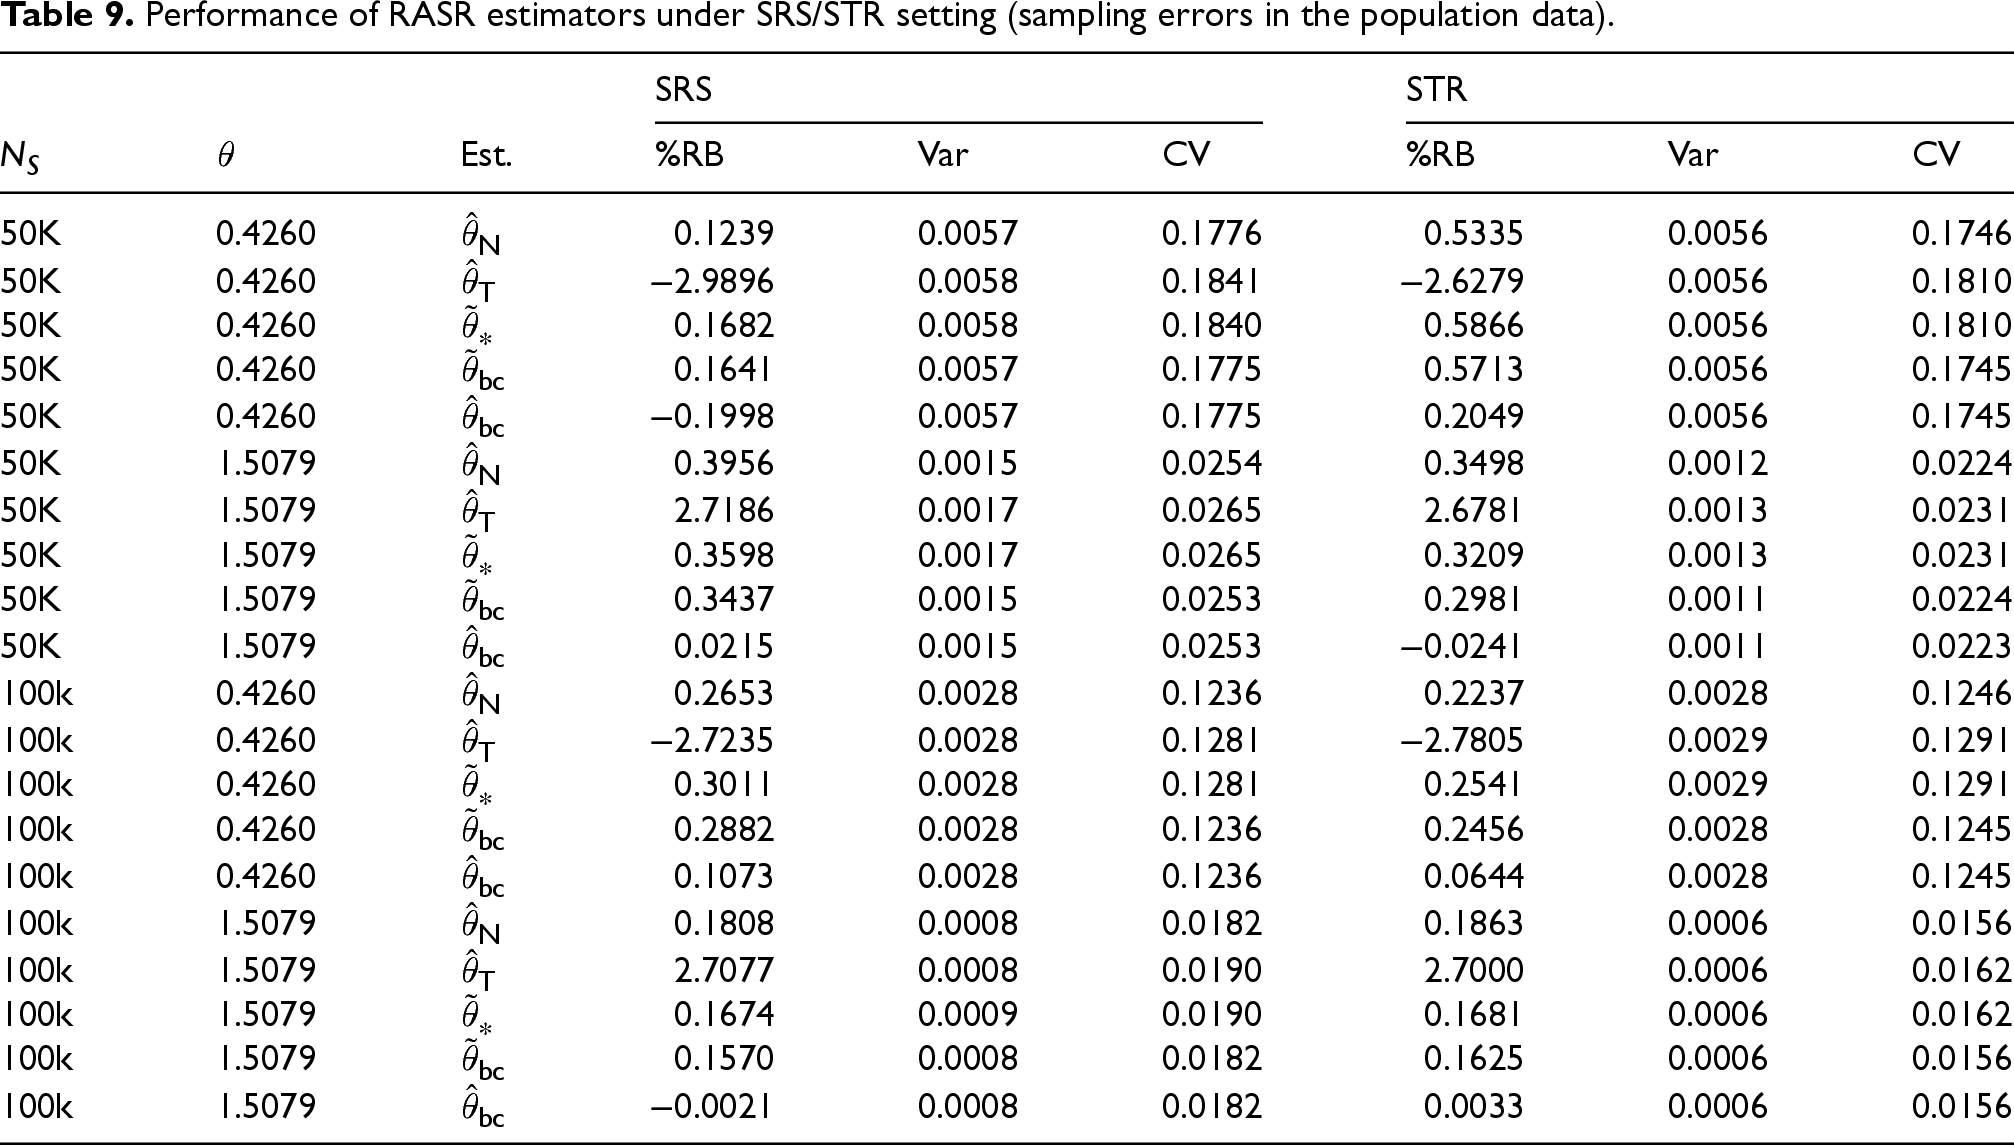
A similar pattern is observed, that is, in most cases,
The only exception, in which
See Section A.4 of the Supplementary Material for additional simulation results.
In view of the simulation results in the previous section, the preferred RASR estimator is 
We carry out another simulation study to investigate the performance of the proposed variance estimator, (21). Our focus remains on the scenarios where the denominators of the ASRs involve sampling errors. Table 10 reports the %RB and CV of the estimator under the simulation setting of Table 8 (and same number of simulation runs,
Performance of variance estimator (Table 8 setting).
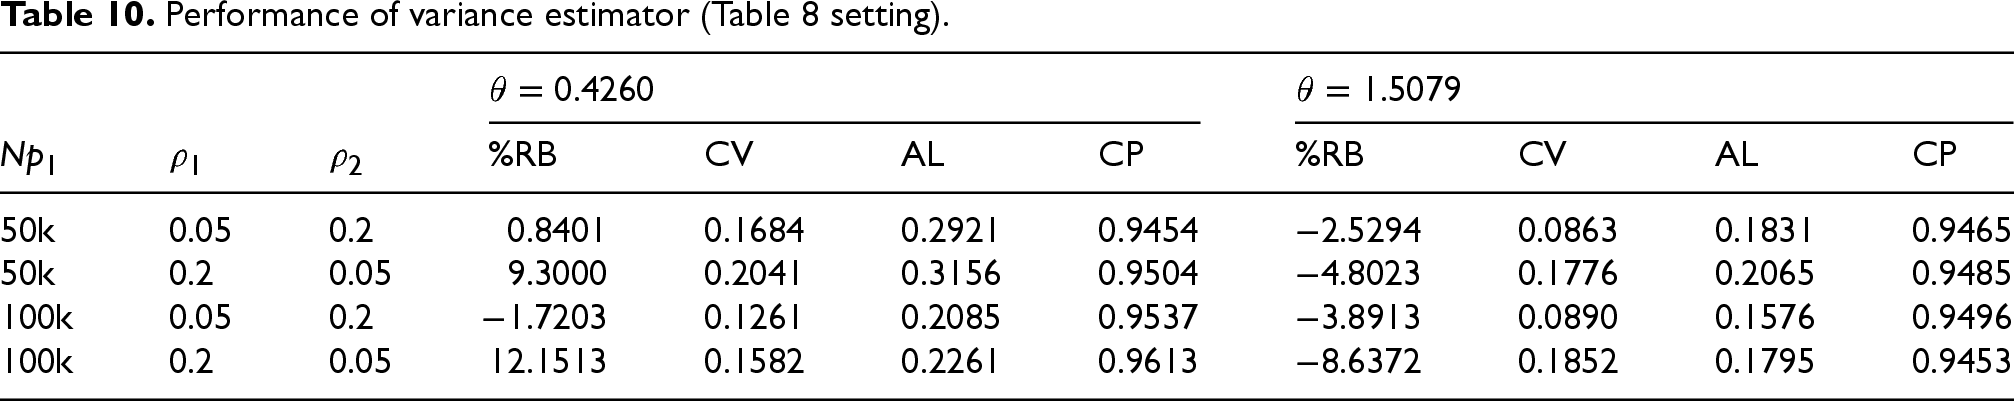
The results show that the %RB are generally in single-digit or low double-digit, which are considered satisfactory, for example, Jiang and Torabi. 14 The CV ranges from approximately 8.6% to 20.4%.
Table 11 reports the %RB and CV of the variance estimator under the simulation setting of Table 9 (and the same number of simulation runs,
Performance of variance estimator (Table 9 setting).
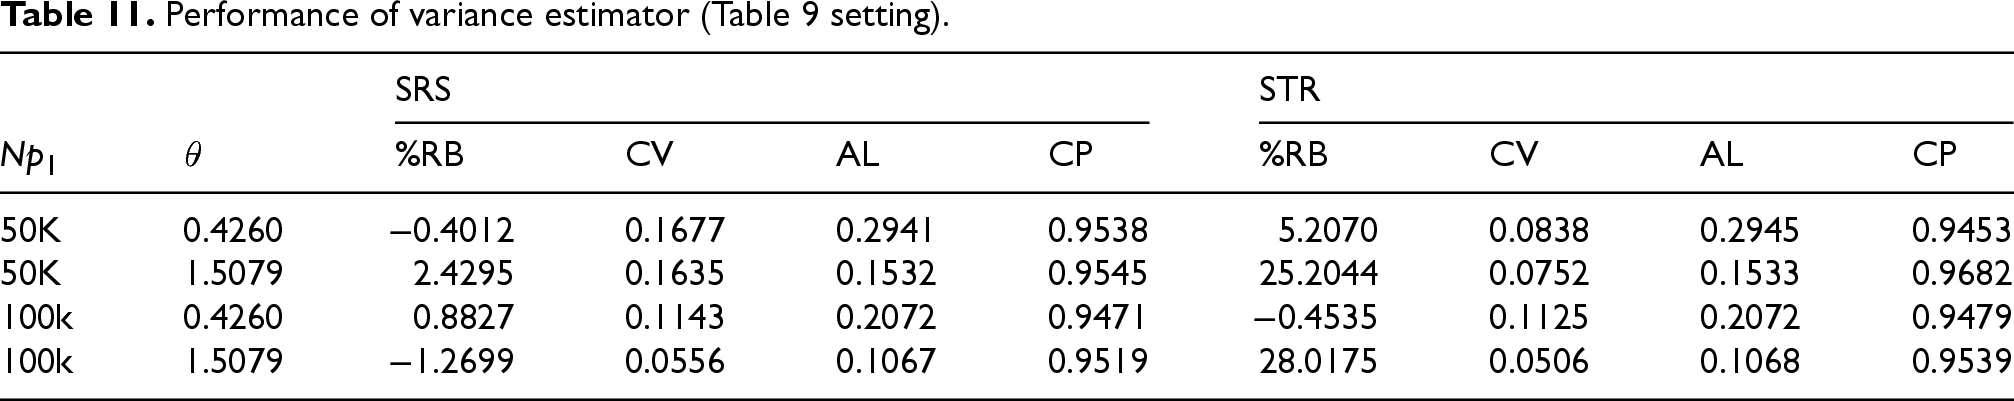
Based on the variance estimator, we construct large-sample confidence interval for the RASR,
The confidence interval simulation results suggest asymptotic normality of the proposed bias-corrected estimator,
To demonstrate the performance of various RASR estimators in practice, we analyze 2018 U.S. all cancer cause mortality data collected by the National Center for Health Statistics’ National Vital Statistics Systems and accessed through the National Cancer Institute (NCI)’s SEER Program. Specifically, we focus on four scenarios that were inspired by empirical studies.16–19 They were chosen to reflect different group size and within group age structures: (i) foreign-born Hispanic in California compared with New Mexico; (ii) foreign-born Hispanic in California and New Mexico compared with those in the entire U.S.; (iii) foreign-born non-Hispanic Asian and Pacific Islander (NHAPI) compared with all races in California and Hawaii; and (iv) US-born NHAPI in California and Hawaii compared with those in the entire U.S. NHAPI.
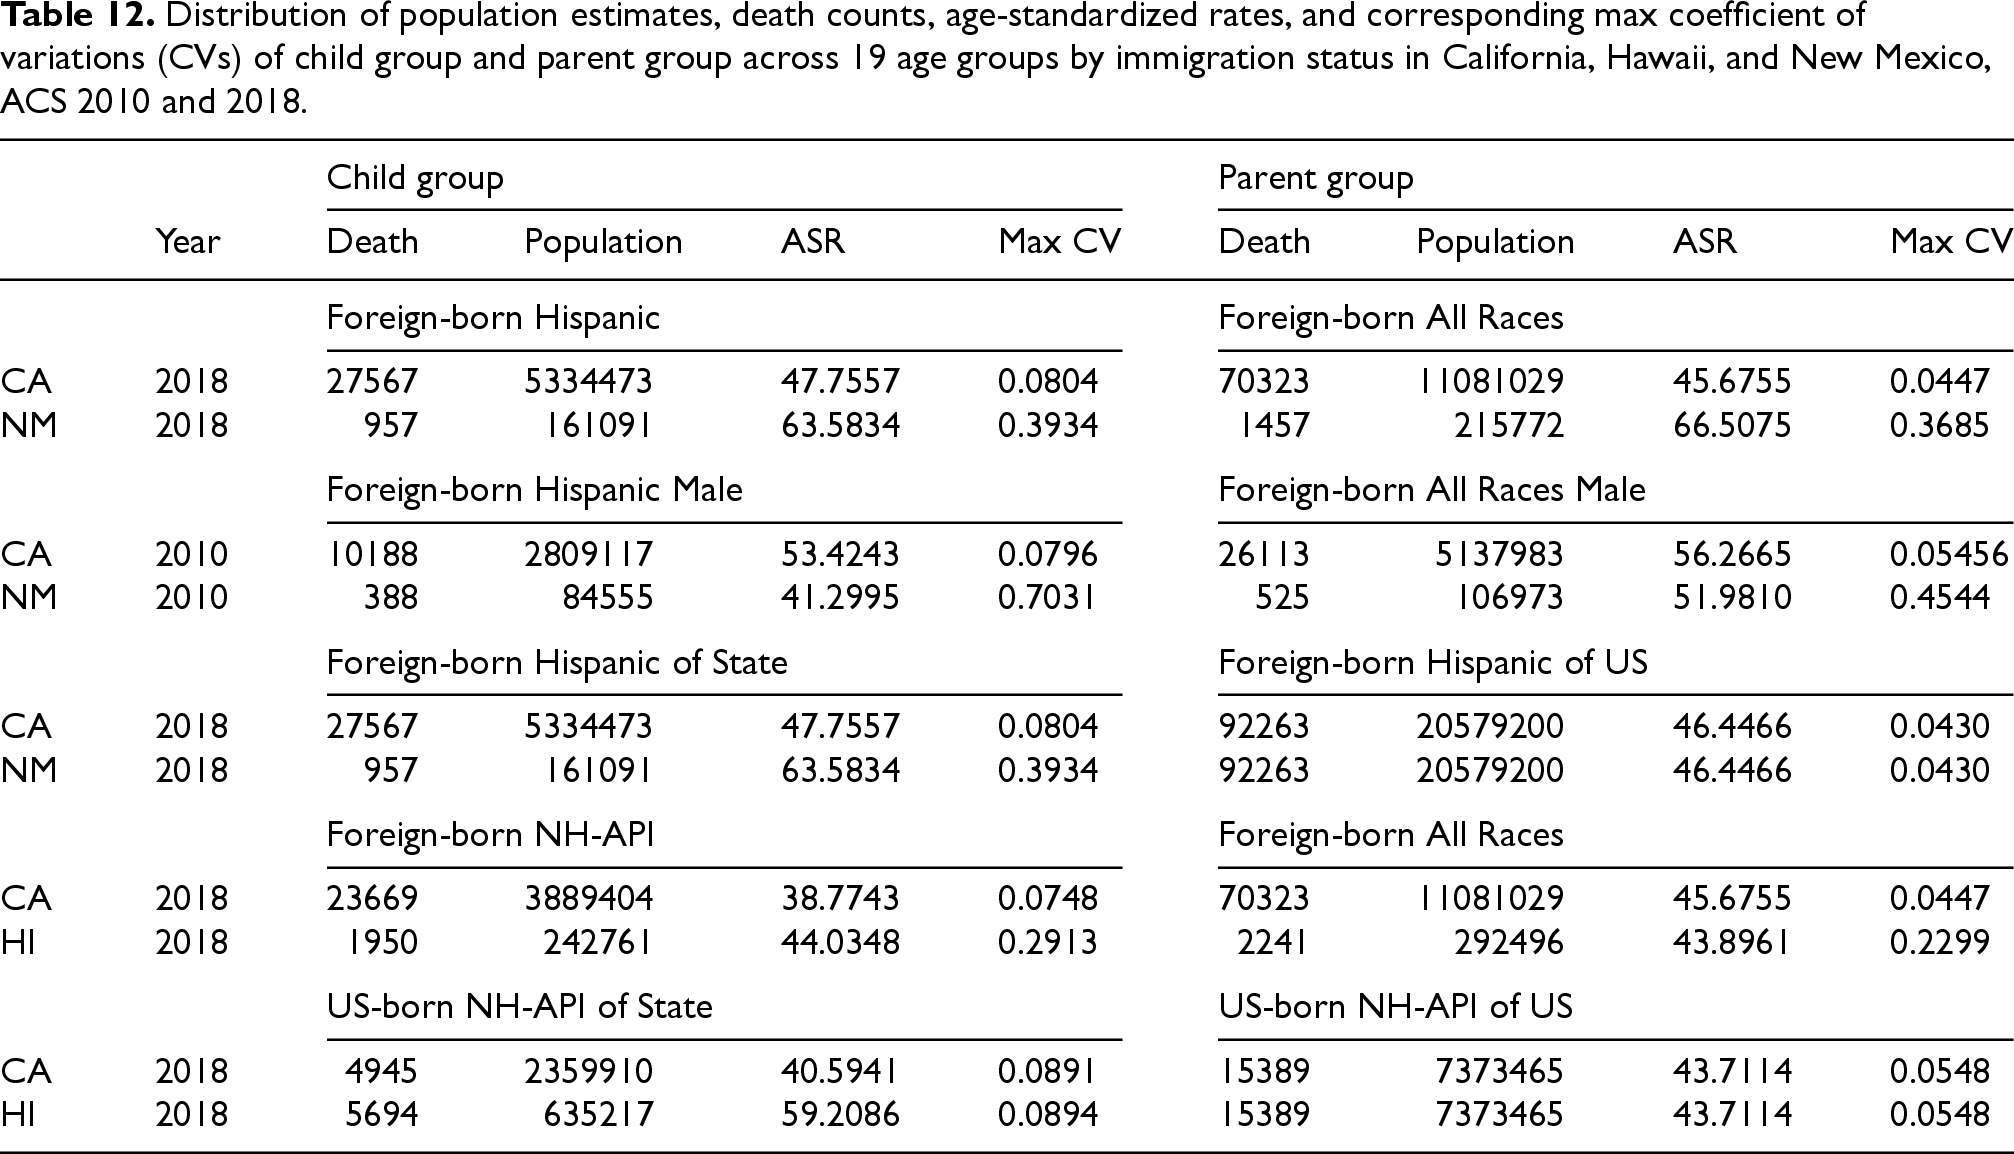
The naive ASR estimator simply calculates the ASRs, treating the populations as fixed quantities and error-free. The naive RASR estimator is computed as a comparison. Here, we adopt some terms from the practitioners, referring to the numerator population as the “child group” and the denominator population as the “parent group.” All ASRs are per 100,000 person-years and are standardized to the 2000 U.S. standard population by 5-year age group, with the oldest age group being 85 years and older combined. Cancer sites were coded according to the International Statistical Classification of Diseases (10th revision). Annual populations and sampling errors of Hispanics and NHAPI by age group, sex, and nativity for California, Hawaii, New Mexico, and the U.S. were obtained from the NCI’s SEER Program. 7 They were estimated using the 2018 1-year American Community Survey sample drawn from the University of Minnesota’s IPUMS-USA. 20 In addition to the 2018 data, we also examined the 2010 RASRs between Hispanic and all races among New Mexico foreign-born males to assess scenarios where population sampling errors are considerably larger.
As shown in Table 12, the annual population estimates based on the ACS for California and U.S. Hispanic and NHAPI populations are all highly precise across age groups, sex, and nativity. These estimates exhibit low CV, indicating small standard errors relative to the population totals across all age groups used for age standardization; the sampling errors appear to have limited impact on the estimation of ASRs. In comparison, Hawaii shows reduced precision in NHAPI population estimates, though the sampling error remains within a reasonable range. In contrast, the sampling errors for New Mexico are significantly higher among four scenarios, especially among the foreign-born Hispanic male population in 2010 (max C.V.=0.90).
Distribution of population estimates, death counts, age-standardized rates, and corresponding max coefficient of variations (CVs) of child group and parent group across 19 age groups by immigration status in California, Hawaii, and New Mexico, ACS 2010 and 2018.
Distribution of population estimates, death counts, age-standardized rates, and corresponding max coefficient of variations (CVs) of child group and parent group across 19 age groups by immigration status in California, Hawaii, and New Mexico, ACS 2010 and 2018.
Figures 1 and 2 show the population proportion across different age groups by state, gender, race, year, and nativity under different scenarios. It becomes evident that the age distribution of US- born NHAPI in Hawaii differs significantly from that of the U.S. as shown in (b) of Figure 1. This discrepancy indicates that the PAD assumption is void. There are several cases where the age distribution of child group is different from that of the parent group within some age groups, such as California and the U.S. in the 2018 foreign-born Hispanic (State/US) scenario. This means the PAD assumption may partially hold among certain age groups; still, it may not be reasonable to assume that the PAD assumption holds for all age groups. For the remaining cases, the trend of age distribution is similar between the parent group and the child group, such as New Mexico and the U.S. in the 2018 foreign-born Hispanic (State/US) scenario, in which case the PAD assumption may be valid.
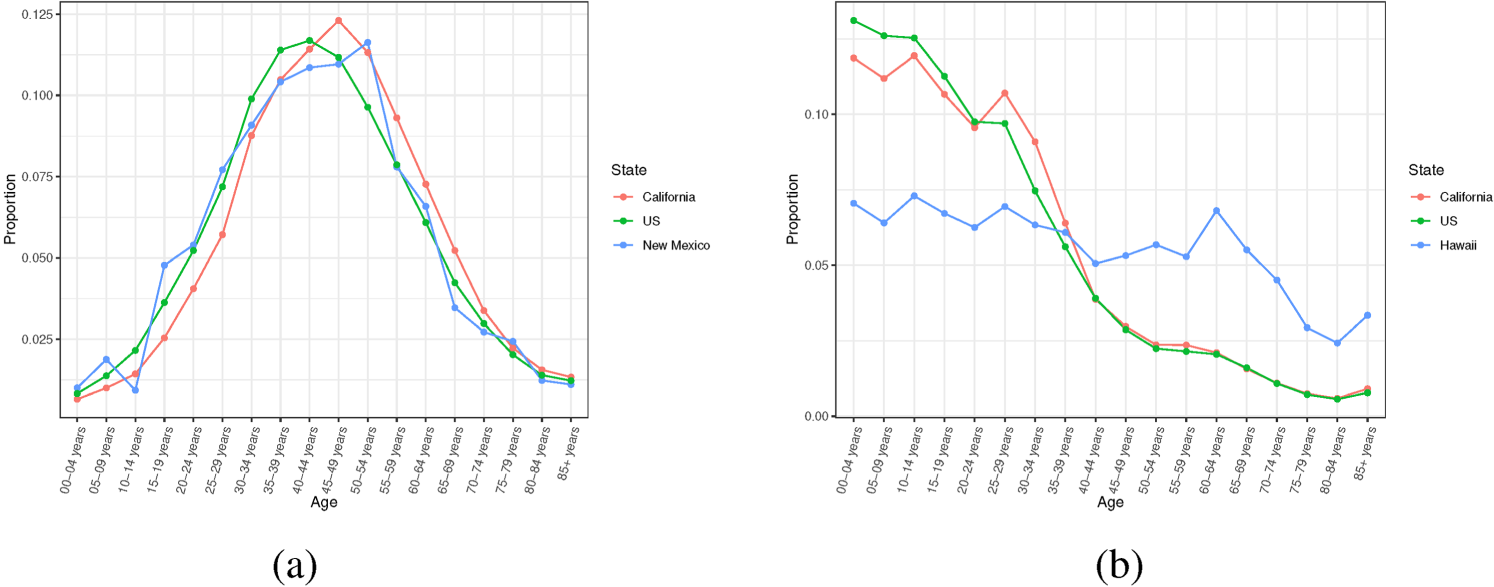
Population age distribution across 19 age groups under different scenarios. (a) 2018 Foreign-born Hispanic (State/US) and (b) 2018 US-born NH-API (State/US).
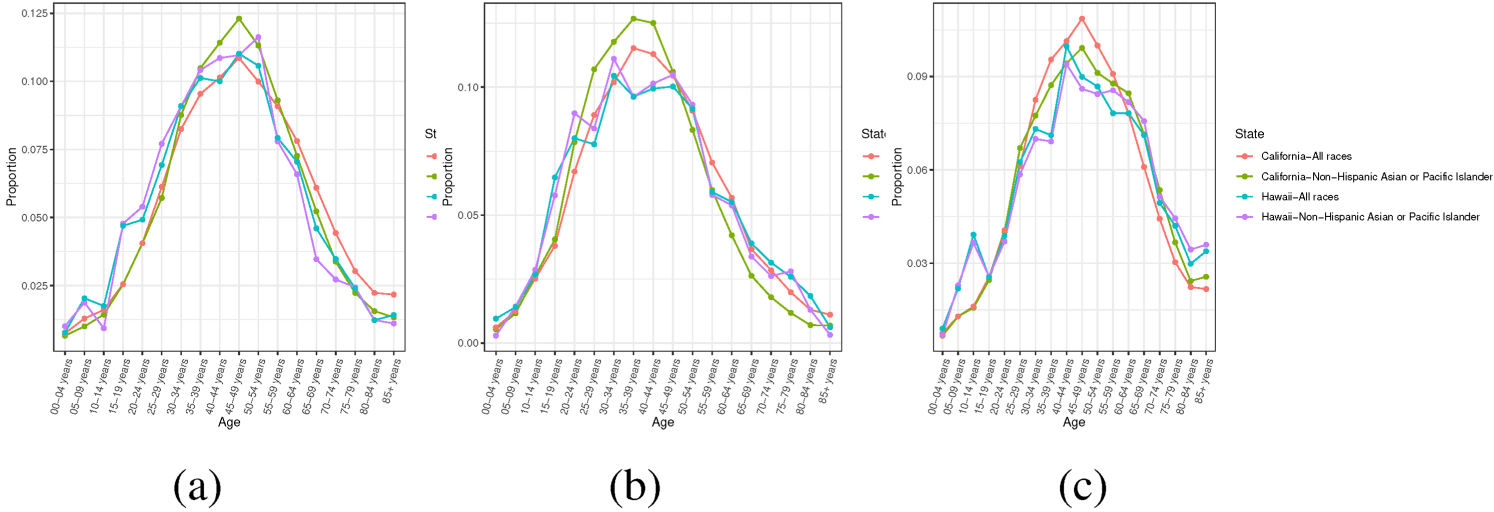
Population age distribution across 19 age groups under different scenarios. (a) 2018 Foreign-born in State (Hispanic/All), (b) 2010 Foreign-born Male in State (Hispanic/All) and (c) 2018 Foreign-born in State (NH-API/All).
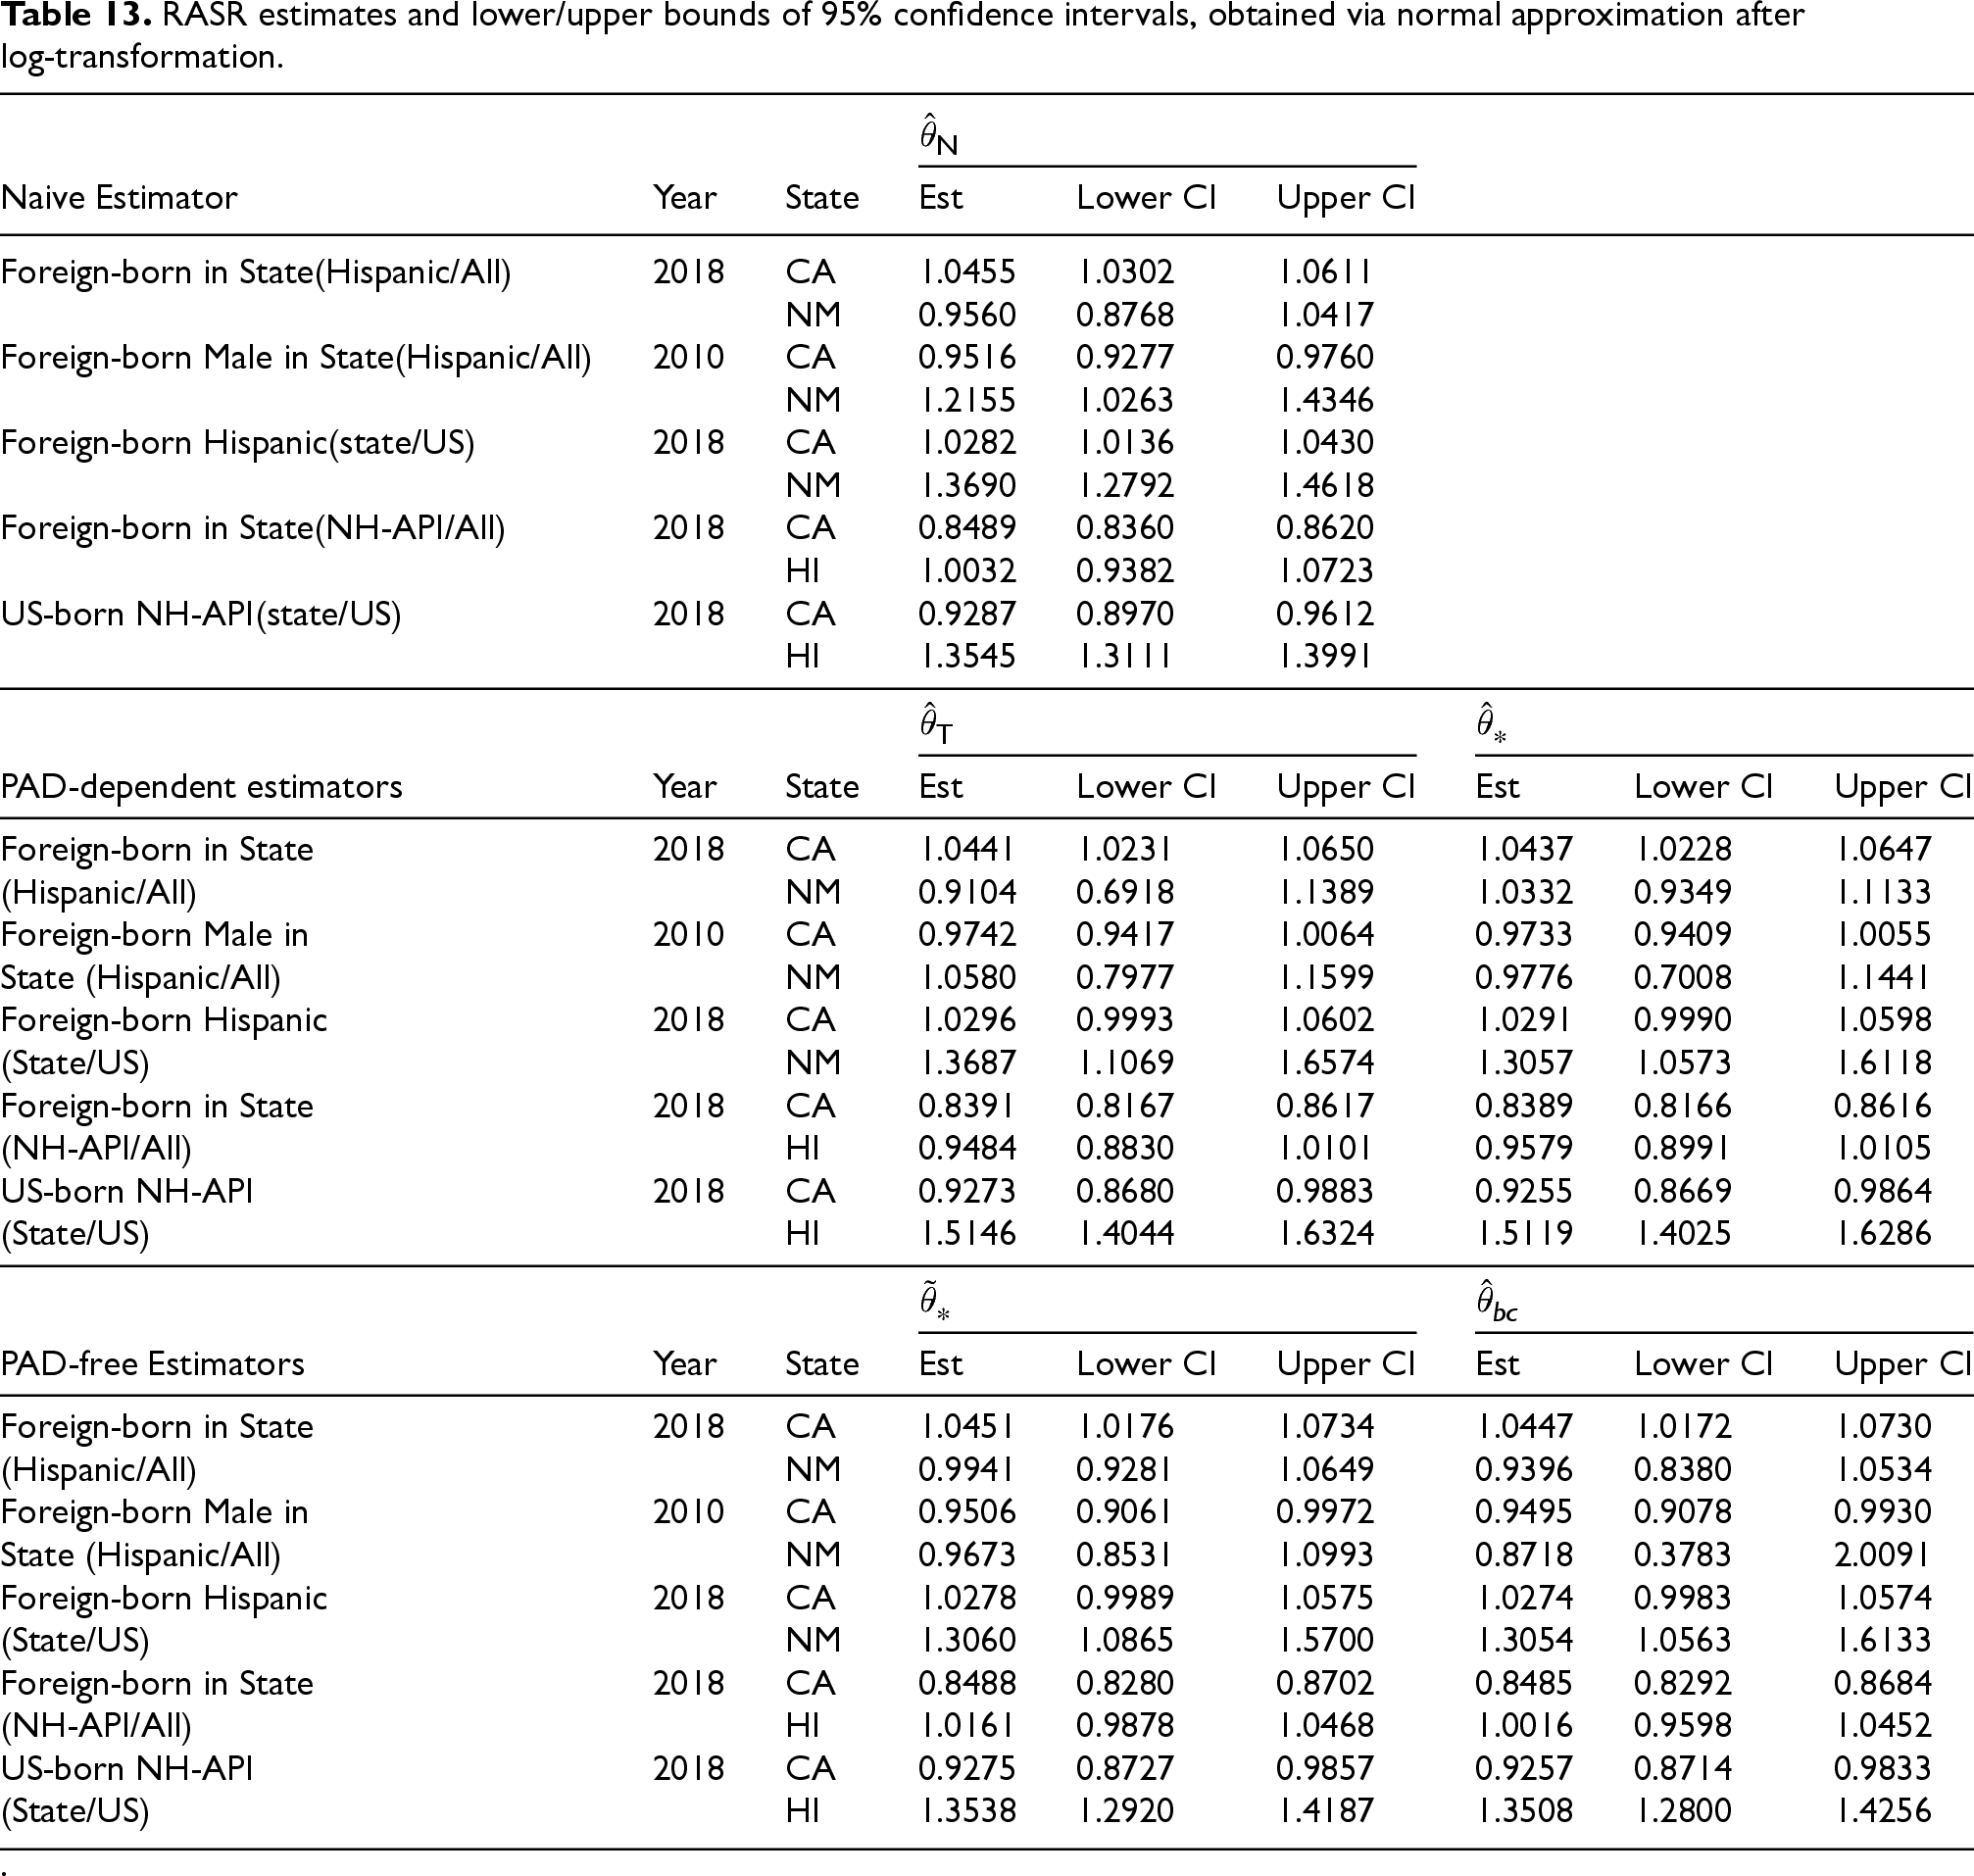
Table 13 compares RASR estimates of all cancer cause mortality under 5 scenarios using the naive (
RASR estimates and lower/upper bounds of 95% confidence intervals, obtained via normal approximation after log-transformation.
.
Conversely, the impact of sampling error coupled with the correlation between child and parent group is evident in New Mexico. The RASR estimator stands out due to substantial bias in the child groups but relatively minor bias in the parent groups. As a result, the bias-corrected RASR estimates, which do not depend on the PAD assumption, are much lower than the naive estimates. Note that, based on our earlier study, we expect the two PAD-free bias-corrected estimators,
It is also worth noting that the impact direction of the violation of the PAD assumption is unpredictable. For example, in the 2018 foreign-born NH-API/ALL scenario, the Tiwari estimator,
In this article, we develop and thoroughly evaluate a novel rate ratio (RR) estimator designed for situations where the comparison group is a subset of the reference group, and where population totals used to estimate ASRs in both groups are subjecting to sampling errors. This innovative estimator robustly identifies demographic groups or geographic regions with heightened cancer incidence or mortality risk. By utilizing the overall population as the reference group, it effectively overcomes the challenge of pinpointing a well-defined independent “unexposed” group to represent the expected risk level in cancer risk assessment.
Specifically, this advancement extends the recent development of a bias-corrected rate ratio estimator for comparing two independent groups when population data of both groups involve sampling errors. While it employs a similar two-stage framework to integrate sampling errors from the finite population theory and Poisson-distributed variability from the superpopulation theory, this new development also accounts for the correlation structure between the two comparing groups due to their nested nature, a crucial feature to ensure high precision in risk assessments.
Another significant innovation is that the proposed estimators do not impose the PAD assumption for the age distribution structure as seen in existing methods. The PAD assumption can often be restrictive and unrealistic, especially in diverse populations where age distribution may vary significantly. By eliminating the need for this assumption, our proposed RR estimator provides a more flexible and realistic approach to estimating cancer risk.
Furthermore, it removes the sole reliance on census-based populations data as the at-risk populations in estimating ASRs by allowing for the use of national survey-based population data, thus greatly broadening the scope of cancer risk assessment. This capability is particularly important in public health research where sample surveys are the sole data source for collecting detailed cancer risk drivers, such as immigration status, education status, cancer screening status, etc. Accurately identifying nuanced and granular heterogeneities in disease rates is crucial for identifying targeting public health interventions to achieve public health for all Americans, especially in resource-limited settings where efficient resource allocation is essential to maximize impact.
One limitation of this new RR estimator is that it is not suitable for comparing a specific age group with the entire population, as age has already been incorporated into the calculation of ASRs. For example, it cannot be used to evaluate the risk of early onset in cancers, meaning that comparing the ASR for individuals under 50 years old with that of the entire population is not permissible. However, users can still use existing estimators, which assume independence, to compare individuals under 50 years with those over 50 years; for instance, Jiang (2022)’s bias-corrected RR estimator and the naïve RR estimator,
Finally, this new estimator is being incorporated into NCI’s SPARC (https://surveillance.cancer.gov/sparc/), a web-based calculator for assessing disparities in cancer mortality rates using survey sample-based populations. This advancement in methods aims to more accurately pinpoint the areas for elevated cancer risks.
Supplemental Material
sj-pdf-1-smm-10.1177_09622802261459842 - Supplemental material for Inference about the ratio of age-standardized rates between two overlapping populations
Supplemental material, sj-pdf-1-smm-10.1177_09622802261459842 for Inference about the ratio of age-standardized rates between two overlapping populations by Jiangshan Zhang, Jiming Jiang and Mandi Yu in Statistical Methods in Medical Research
Footnotes
Funding
The authors received financial support for the research, authorship, and/or publication of this article: This work is partially supported by the National Cancer Institute.
Declaration of conflicting interests
The authors declared no potential conflicts of interest with respect to the research, authorship, and/or publication of this article.
Supplemental material
Supplemental material for this article is available online.
References
Supplementary Material
Please find the following supplemental material available below.
For Open Access articles published under a Creative Commons License, all supplemental material carries the same license as the article it is associated with.
For non-Open Access articles published, all supplemental material carries a non-exclusive license, and permission requests for re-use of supplemental material or any part of supplemental material shall be sent directly to the copyright owner as specified in the copyright notice associated with the article.