






Abstract
Count data are common in medical research. When these data have more zeros than expected by the most used count distributions, it is common to employ a zero-inflated regression model. However, the interpretability of these models is much lower than the most used count regression models. We present a more interpretable regression model that estimates the mean event rate and models covariate-dependent dispersion directly. Additionally, the dispersion parameter can be interpreted as an index of clumping, a control parameter for overdispersion. We discuss inferential and diagnostic tools and perform a Monte Carlo simulation study to evaluate the performance of the maximum likelihood estimator. Finally, the usefulness of the proposed regression model is illustrated through an application on antenatal care visits.
Introduction
Count data are common in several areas of medicine such as immunology, 1 cardiology, 2 urology, 3 pediatrics, 4 psychiatry 5 and neurology. 6 A possible way to study the relationship between these variables and a set of explanatory variables is assuming that the response has a certain count probability distribution such as Poisson, negative binomial, Poisson inverse Gaussian, among many others. However, it is not unusual that the response variable has more zeros than expected by the best known count distributions.
When there is an excess of zeros, the response variable is usually modeled using a zero-inflated regression model. These models assume that the response variable is a mixture of a degenerated distribution at zero and a known count probability distribution. Historically, several zero-inflated regression models were proposed. For example, the zero-inflated Poisson (ZIP) regression model was proposed by Lambert. 7 Subsequently, the zero-inflated negative binomial (ZINB) regression model was proposed by Ridout et al. 8 and the zero-inflated logarithmic (ZIL) regression model was introduced by Rigby, 9 among others.
In the zero-inflated regression models, there are two means related to the response variable. The first is the mean of the response variable. The other is the mean of the count probability distribution that composes the distribution of the response variable. We usually want to model the former mean as a function of covariates. However, in almost all of the zero-inflated regression models, the latter mean is modeled. The reason is that the vector of parameters of the distribution of the response variable in these models includes the mean of the count probability distribution and not the mean of the response variable.
To solve this issue, Long et al. 10 proposed a reparameterization of the ZIP distribution that they called marginalized ZIP (MZIP). In the MZIP parameterization, one of the parameters is the mean of response variable (marginalized mean) and so it is more convenient to use in a regression model that they introduced in the same work. After this work, marginalized zero-inflated models based on negative binomial distribution (MZINB) 11 and generalized Poisson distribution (MZIGP) 12 were proposed. Todem et al. 13 and Martin and Hall 14 introduced more general marginalized forms of models for zero-inflated count data. Extensions of MZIP and MZINB to models with random effects were proposed by Long et al. 15 and Burgette et al., 16 respectively, while an extension to MZINB to spatial data was proposed by Mutiso et al. 17 From a software standpoint, 18 present new commands in Stata for modeling count data using marginalized Zero-inflated distributions. As an applied illustration, 19 investigate the association between sugar sweetened beverage intake and dental caries among underserved Black adolescents utilizing a marginalized ZIP (MZIP) regression analysis. Finally, in Mun et al. 20 the MZIP and MZINB models are used in a two-step individual participant data (IPD) meta-analysis.
To the best of our knowledge, there is only one zero-inflated regression model based on the Poisson distribution in which the mean of the response variable is directly modeled. As mentioned before, this model was proposed by Long et al. 10 It can be fitted in the gamlss 21 and in the mcount package 22 of the software R and was considered, for example, by Seidel et al., 23 Laurence et al., 19 Mun et al., 20 and Sims et al., 24 However, this parameterization does not change the other parameters of the distribution. As a result, it is not parameterized in terms of a readily interpretable dispersion parameter. The same issue is observed in the other marginalized zero-inflated regression models.
This work proposes a zero-inflated regression model based on a novel reparameterization of the zero-inflated Poisson distribution. This parameterization is more useful than the existing ones because one of the parameters of the distribution is the mean, and the other is a dispersion parameter. As a result, the proposed model is more interpretable than other zero-inflated regression models. We assume that both parameters of the distribution of the response are functions of covariates, and so the proposed model has a structure similar to a double generalized linear model. 25 As we assume that the mean and a dispersion parameter of the response are functions of covariates, our model can also be seen as a link between marginalized models and dispersion models. 26 Some contributions to dispersion models on count data include Bonat et al. 27 and Bar-Lev and Ridder. 28
In the same way as Long et al., 10 our model formulation offers meaningful statements about an exposure effect on an entire population in contrast to the traditional ZIP model whose regression parameters have interpretations for unobservable latent classes. 10 However, our model not only estimates the mean intensity of events (as in the traditional Poisson regression) but also captures how the variability around this mean depends on observable factors.
The remainder of this paper is organized as follows. Section 2 proposes a reparameterization of the zero-inflated Poisson distribution. Section 3 introduces the regression model associated with this novel reparameterization. Diagnostic tools for this regression model are discussed in Section 4. In Section 5, Monte Carlo simulation studies are performed to evaluate the performance of the maximum likelihood estimators of the parameters of the proposed regression model. The usefulness of our model is illustrated through an application on antenatal care visits presented in Section 6. Concluding remarks are provided in Section 7.
Parameterizations of the ZIP
The first version of the ZIP distribution was introduced by Lambert.
7
In this setup, the probability mass function is given by:

A regression model is more easily interpretable when one of the parameters of the distribution of the response variable is the mean or the median. Long et al.
10
proposed a new parameterization of the ZIP distribution, in which one of the parameters is the mean. From the ZIP parameterization, they considered that

Here we propose a novel parameterization of the ZIP distribution, in which both parameters are of direct interest. Moreover, in this parameterization, the variance of the ZIP distribution is a simple function of the parameters. The ZIP distribution in our proposed parameterization is indexed by the mean and a dispersion parameter. From the ZIP parameterization, we consider that

Note that in the ZIP3 parameterization,
Note that ZIP, ZIP2 and ZIP3 are different parameterizations of the same probability distribution (zero-inflated Poisson distribution). As a result, any parameter of the three parameterizations can be linked with simple formula to the parameters of the other two. While the fits of the regression models based on these three parameterizations are often numerically similar in practice, the models (and their fits) are distinct except in special cases, that is, intercept only models and saturated models based solely on categorical explanatory variables. The primary appeal of the ZIP3 parameterization is in the interpretation of the regression parameters.
Considering the interpretability advantages of ZIP3 parameterization, it is very convenient to use when the response variable has a high proportion of zeros. We define in this section a regression model based on the ZIP3 parameterization and use it to fit real data in Section 6. However, before introducing our regression model, we obtain some results that enable us to use the model in an useful computational framework.
The expression (2) can be rewritten as follows:


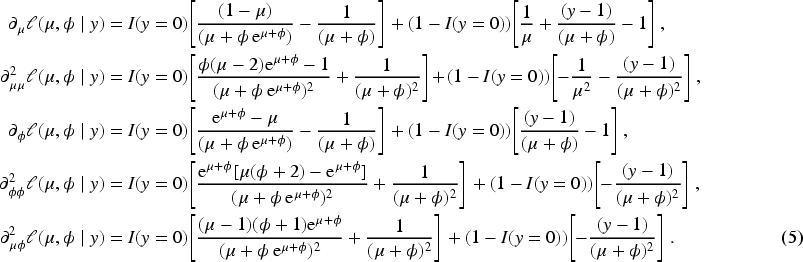
Additionally, the partial derivatives of first and second order of Equation (4) with respect to the parameters indexing the ZIP3 distribution are given by:
In ZIP3 regression, the response variables


Let



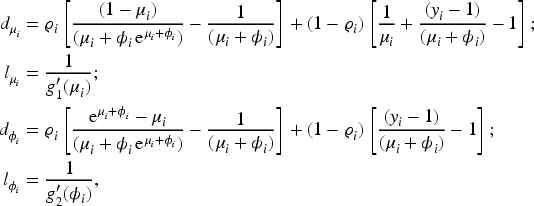

With the results presented in Equation (5), we can readily integrate the ZIP3 distribution into the distribution family framework of the
We propose using a residual and a global influence measure for model diagnostics for ZIP3 regression model.
Residual analysis
When the response of a regression model is discrete, Pearson and deviance residuals are also discrete. As a result, these residuals have a considerable probability of not detecting lack of fit.
36
For this reason, when the response is discrete, it is better to use the randomized quantile residual
37
to evaluate the goodness of fit of the regression model. For the ZIP3 regression model, the randomized quantile residual is given by

According to Cook et al.,
38
the likelihood displacement39, p. 182 is the most useful measure for identifying influential observations. It has a similar expression for all parametric regression models and has been widely used in recent works.40–42 For the ZIP3 regression model, the likelihood displacement is given by

We conducted Monte Carlo (MC) simulation studies to evaluate the performance of the ML estimators of the parameters of the ZIP3 regression model using small and moderate sample sizes. The scenario under analysis considers the following: sample sizes

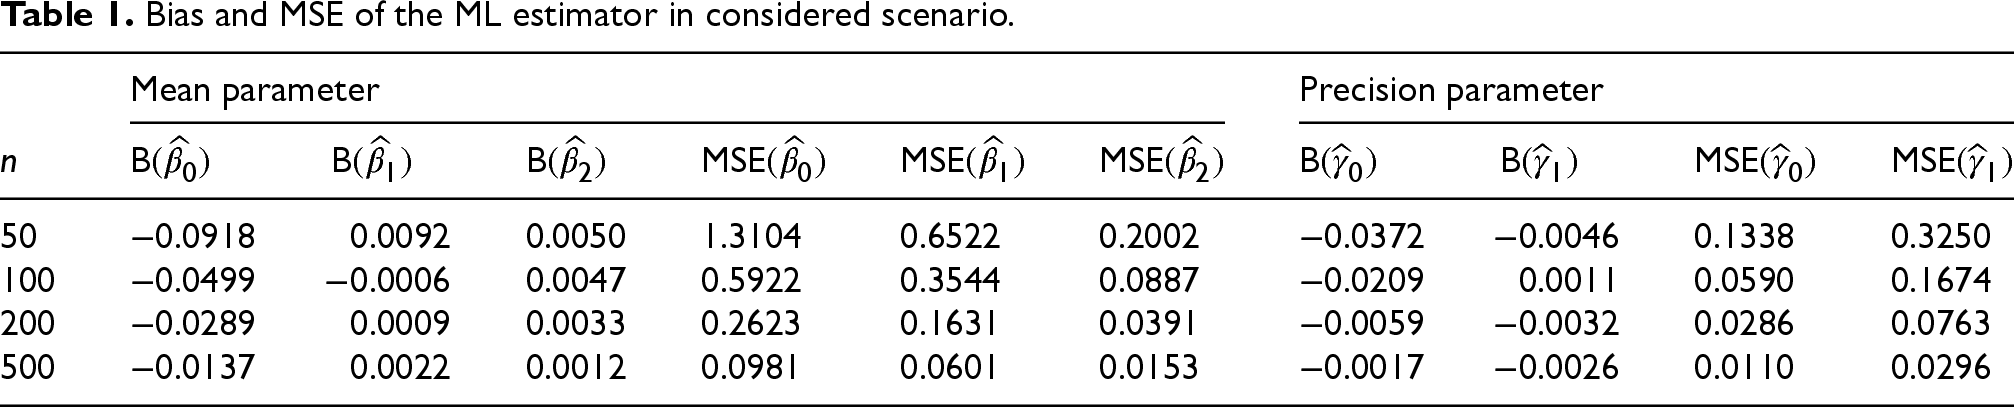
For each value of the parameter and sample size, we report the bias (B) and mean squared error (MSE) of the ML estimators in Table 1. Note that, as the sample size increases, the bias and mean squared error of the ML estimators decrease, as expected. The biases are small, except for
Bias and MSE of the ML estimator in considered scenario.
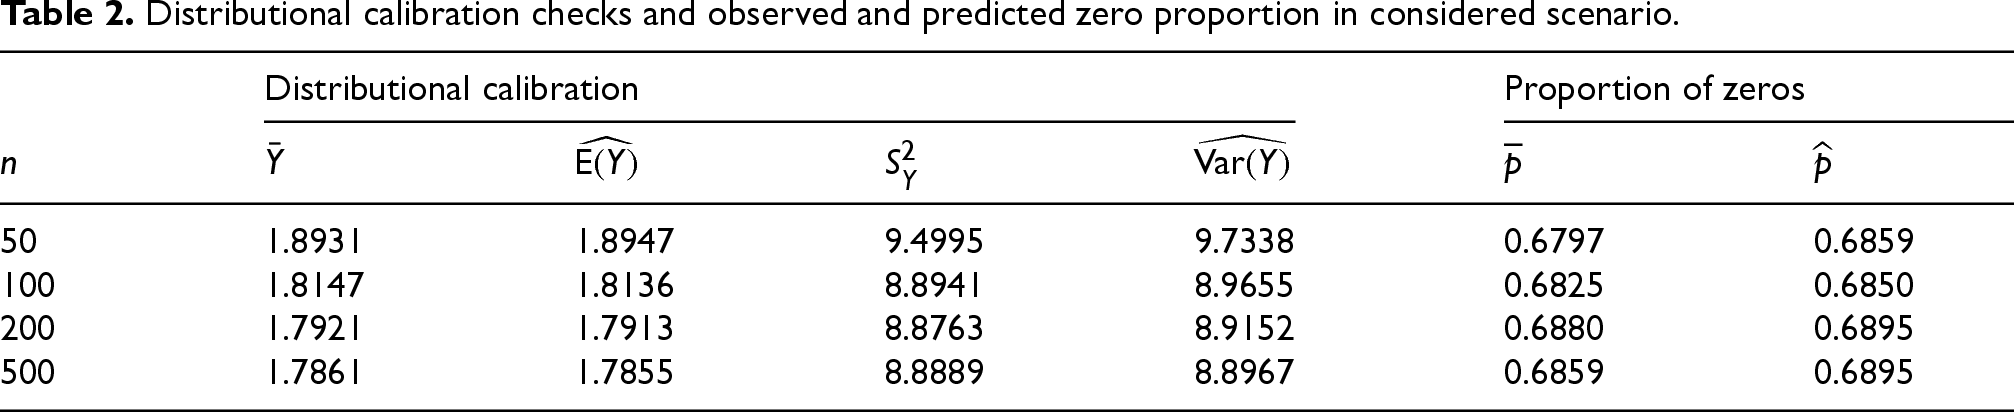
To assess the calibration of the empirical distribution of the fitted model, we compare the overall observed mean with the predicted mean for the location component, and verify that the empirical variances align with the model-implied variances for the dispersion component. In addition, we evaluated the average proportion of zeros in the generated sample and compared it with the average proportion of zeros obtained from the fitted model, where we can observe that the values are very close. These results are presented in Table 2, where we can observe that the fitted model is well calibrated.
Distributional calibration checks and observed and predicted zero proportion in considered scenario.
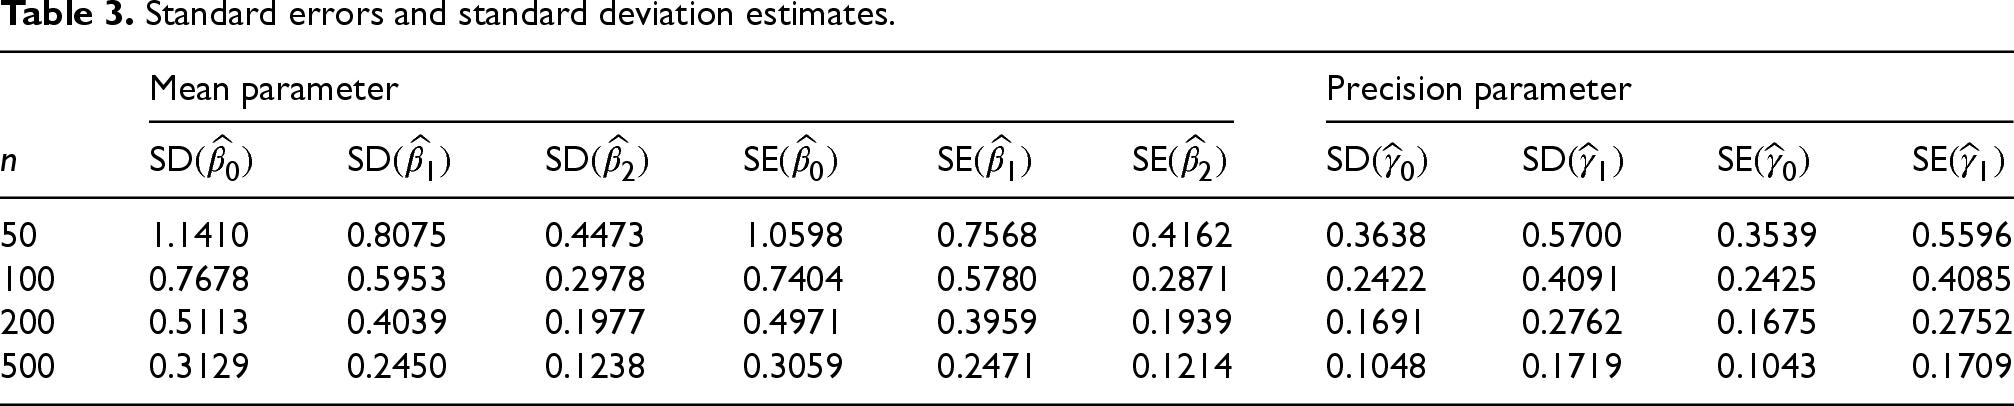
In Table 3 we observe that the sample standard deviations (SD) of the estimates are close to the estimated asymptotic standard errors (SE) and they are closer as
Standard errors and standard deviation estimates.
To estimate the parameters by maximum likelihood, we used the RS algorithm. 35 Table 4 shows that the RS algorithm exhibits highly stable performance, requiring around 3.6 to 3.8 iterations across all sample sizes. Besides that, according to the results presented in Table 4, it can be observed that, among the 5000 Monte Carlo replications, non-convergence occurred in only two cases when the sample size is equal to 50.
Iterations and non-convergences.

Finally, for
Table 5 presents the empirical coverage probabilities of the asymptotic confidence intervals of level
Coverage probabilities of asymptotic confidence intervals.

We also considered two other scenarios, considering the following vectors for
Antenatal care (ANC) is the service delivered by skilled healthcare providers to pregnant women and adolescent girls to ensure the best health conditions for both mother and baby during pregnancy. 43 ANC reduces maternal and newborn mortalities and makes it easier to detect infections early and prevent them from progressing. 44 The World Health Organization (WHO) has recommended eight ANC visits during the course of pregnancy since 2016. 45
Women in sub-Saharan Africa have a significantly higher risk of dying from causes related to pregnancy and childbirth than in any other region, representing for 70% of all maternal deaths in 2020 globally. 46 To increase the ANC visits and to reduce this mortality, it is valuable to identify covariates that are related to the number of ANC visits. Here, we consider data on the number of antenatal care visits in the region of Oromia, Ethiopia. Data refers to the year of 2019 and was obtained from the Demographic and Health Surveys (DHS) Program. 47 Data have information on 491 mothers who had a baby in the previous 5 years and the response variable is the number of antenatal care visits in the last pregnancy of the women. Note that, for this response variable, it is desirable that the mean of the response is high (8 or even greater). However, dispersion is also important. Dispersion should be low to ensure that few mothers have low ANC visits when the mean is high. The following covariates are available: age, type of residence, education level, birth order number, wealth index and number of household members,
Figure 1 presents a bar plot of the response variable. The number of antenatal care visits by mother in Oromia has an asymmetric distribution and the sample has many zeros (29.5%). Unfortunately, few mothers in the sample had the recommended 8 ANC visits. The high proportion of zeros, coupled with the fact that the number of mothers who had 3 or 4 ANC visits is greater than the number who had 1 or 2 ANC visits, suggests that a zero-inflated regression model may be needed to adequately fit the response variable. In addition, the ZIP3 regression model may be a good choice to model the ANC visits in Oromia, since dispersion is important for this study.
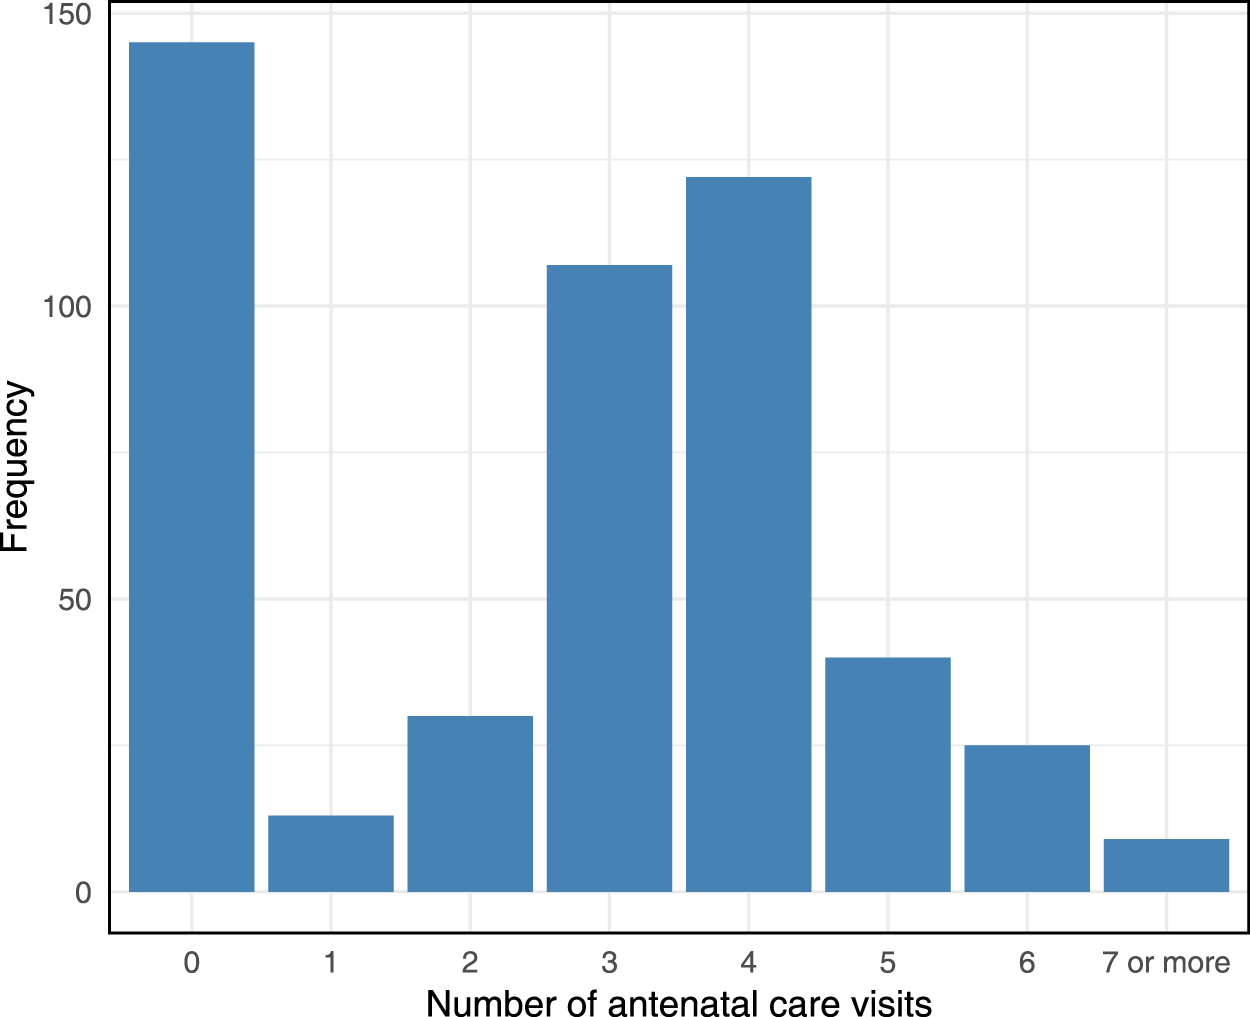
Bar plot for the number of antenatal care visits in Oromia.
The ZIP3 regression model was fitted considering a logarithmic link function for
The final ZIP3 model for the antenatal care visits in Oromia—Ethiopia.
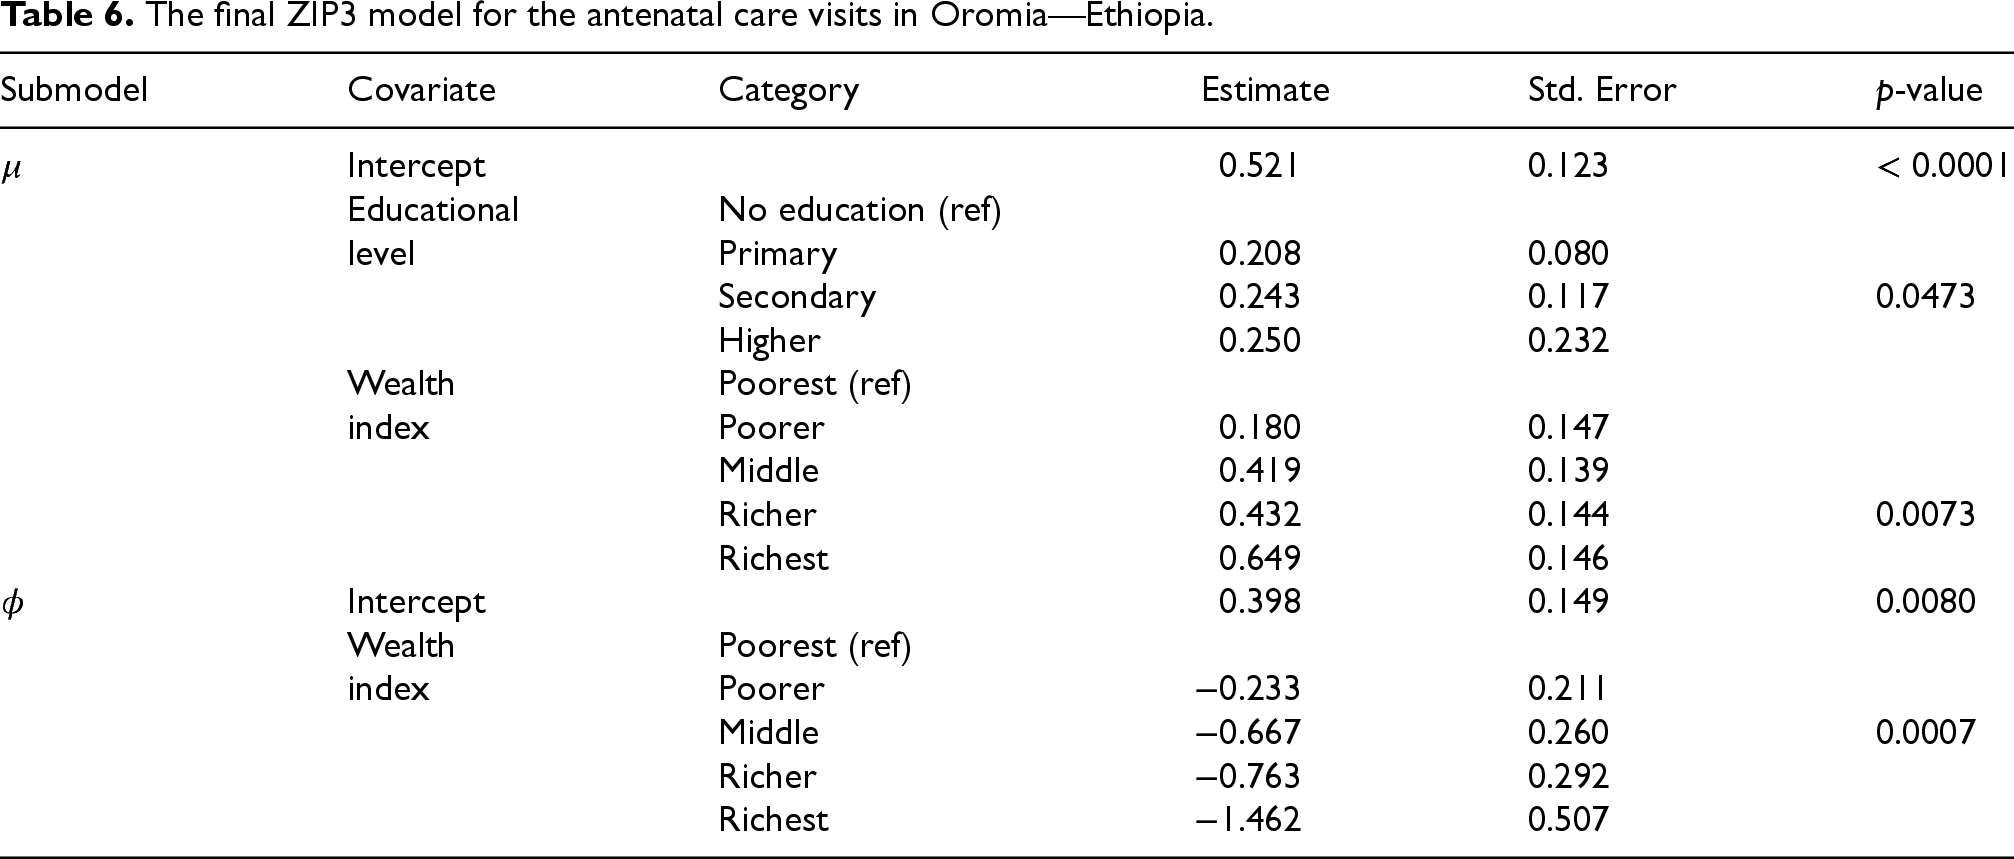
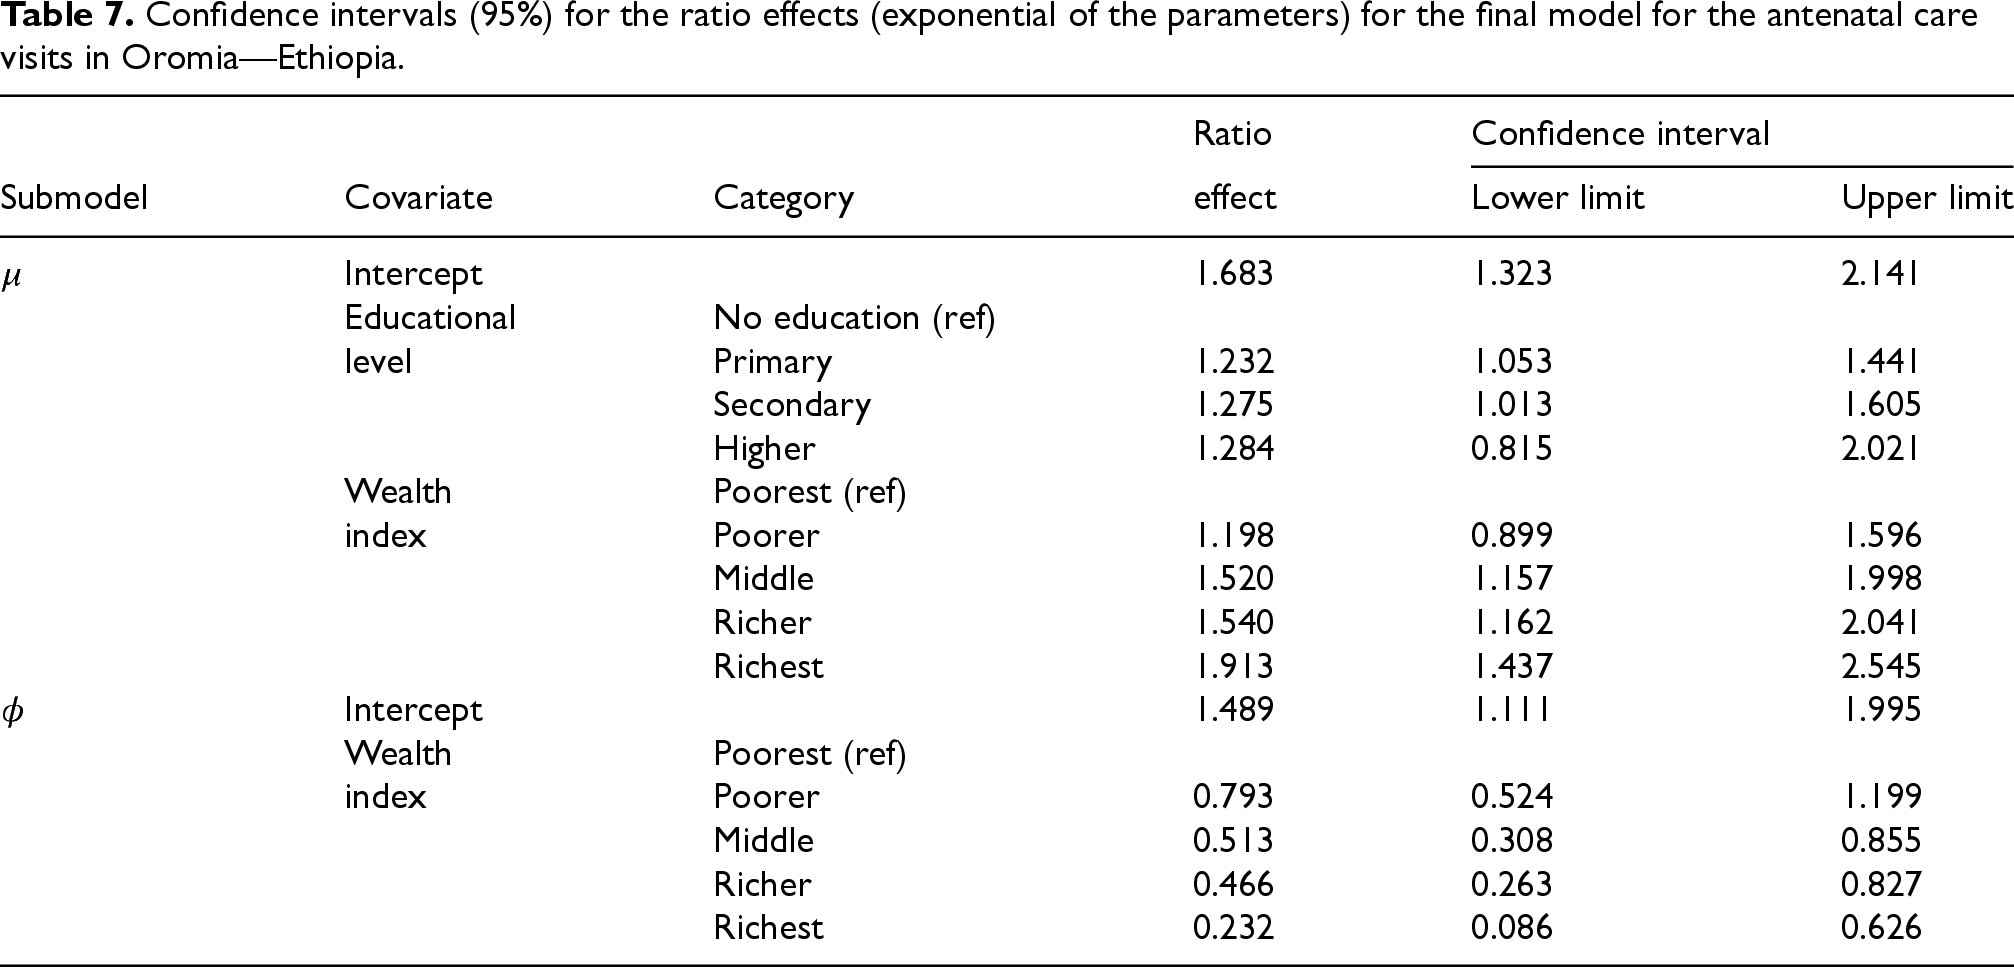
For a better interpretation of the results of the final ZIP3 regression model, the exponential of the parameter estimates were calculated (ratio effects). We also calculated the
Confidence intervals (95%) for the ratio effects (exponential of the parameters) for the final model for the antenatal care visits in Oromia—Ethiopia.
We used the tools discussed in Section 4 to conduct the diagnostic analysis in the final ZIP3 regression model. The left plot of Figure 2 presents a normal probability plot with a simulated envelope 48 using the randomized quantile residual. The plot does not suggest model misspecification. We also obtained the likelihood displacement for the 491 observations (right plot of Figure 2). Observation {94} has considerably higher value of the likelihood displacement. This woman was in the higher educational level and had 6 antenatal care visits that is more than expected, considering that she was not in the richest families. To study the impact on model inference after removing this case identified as potentially influential, we fitted the model without this observation.
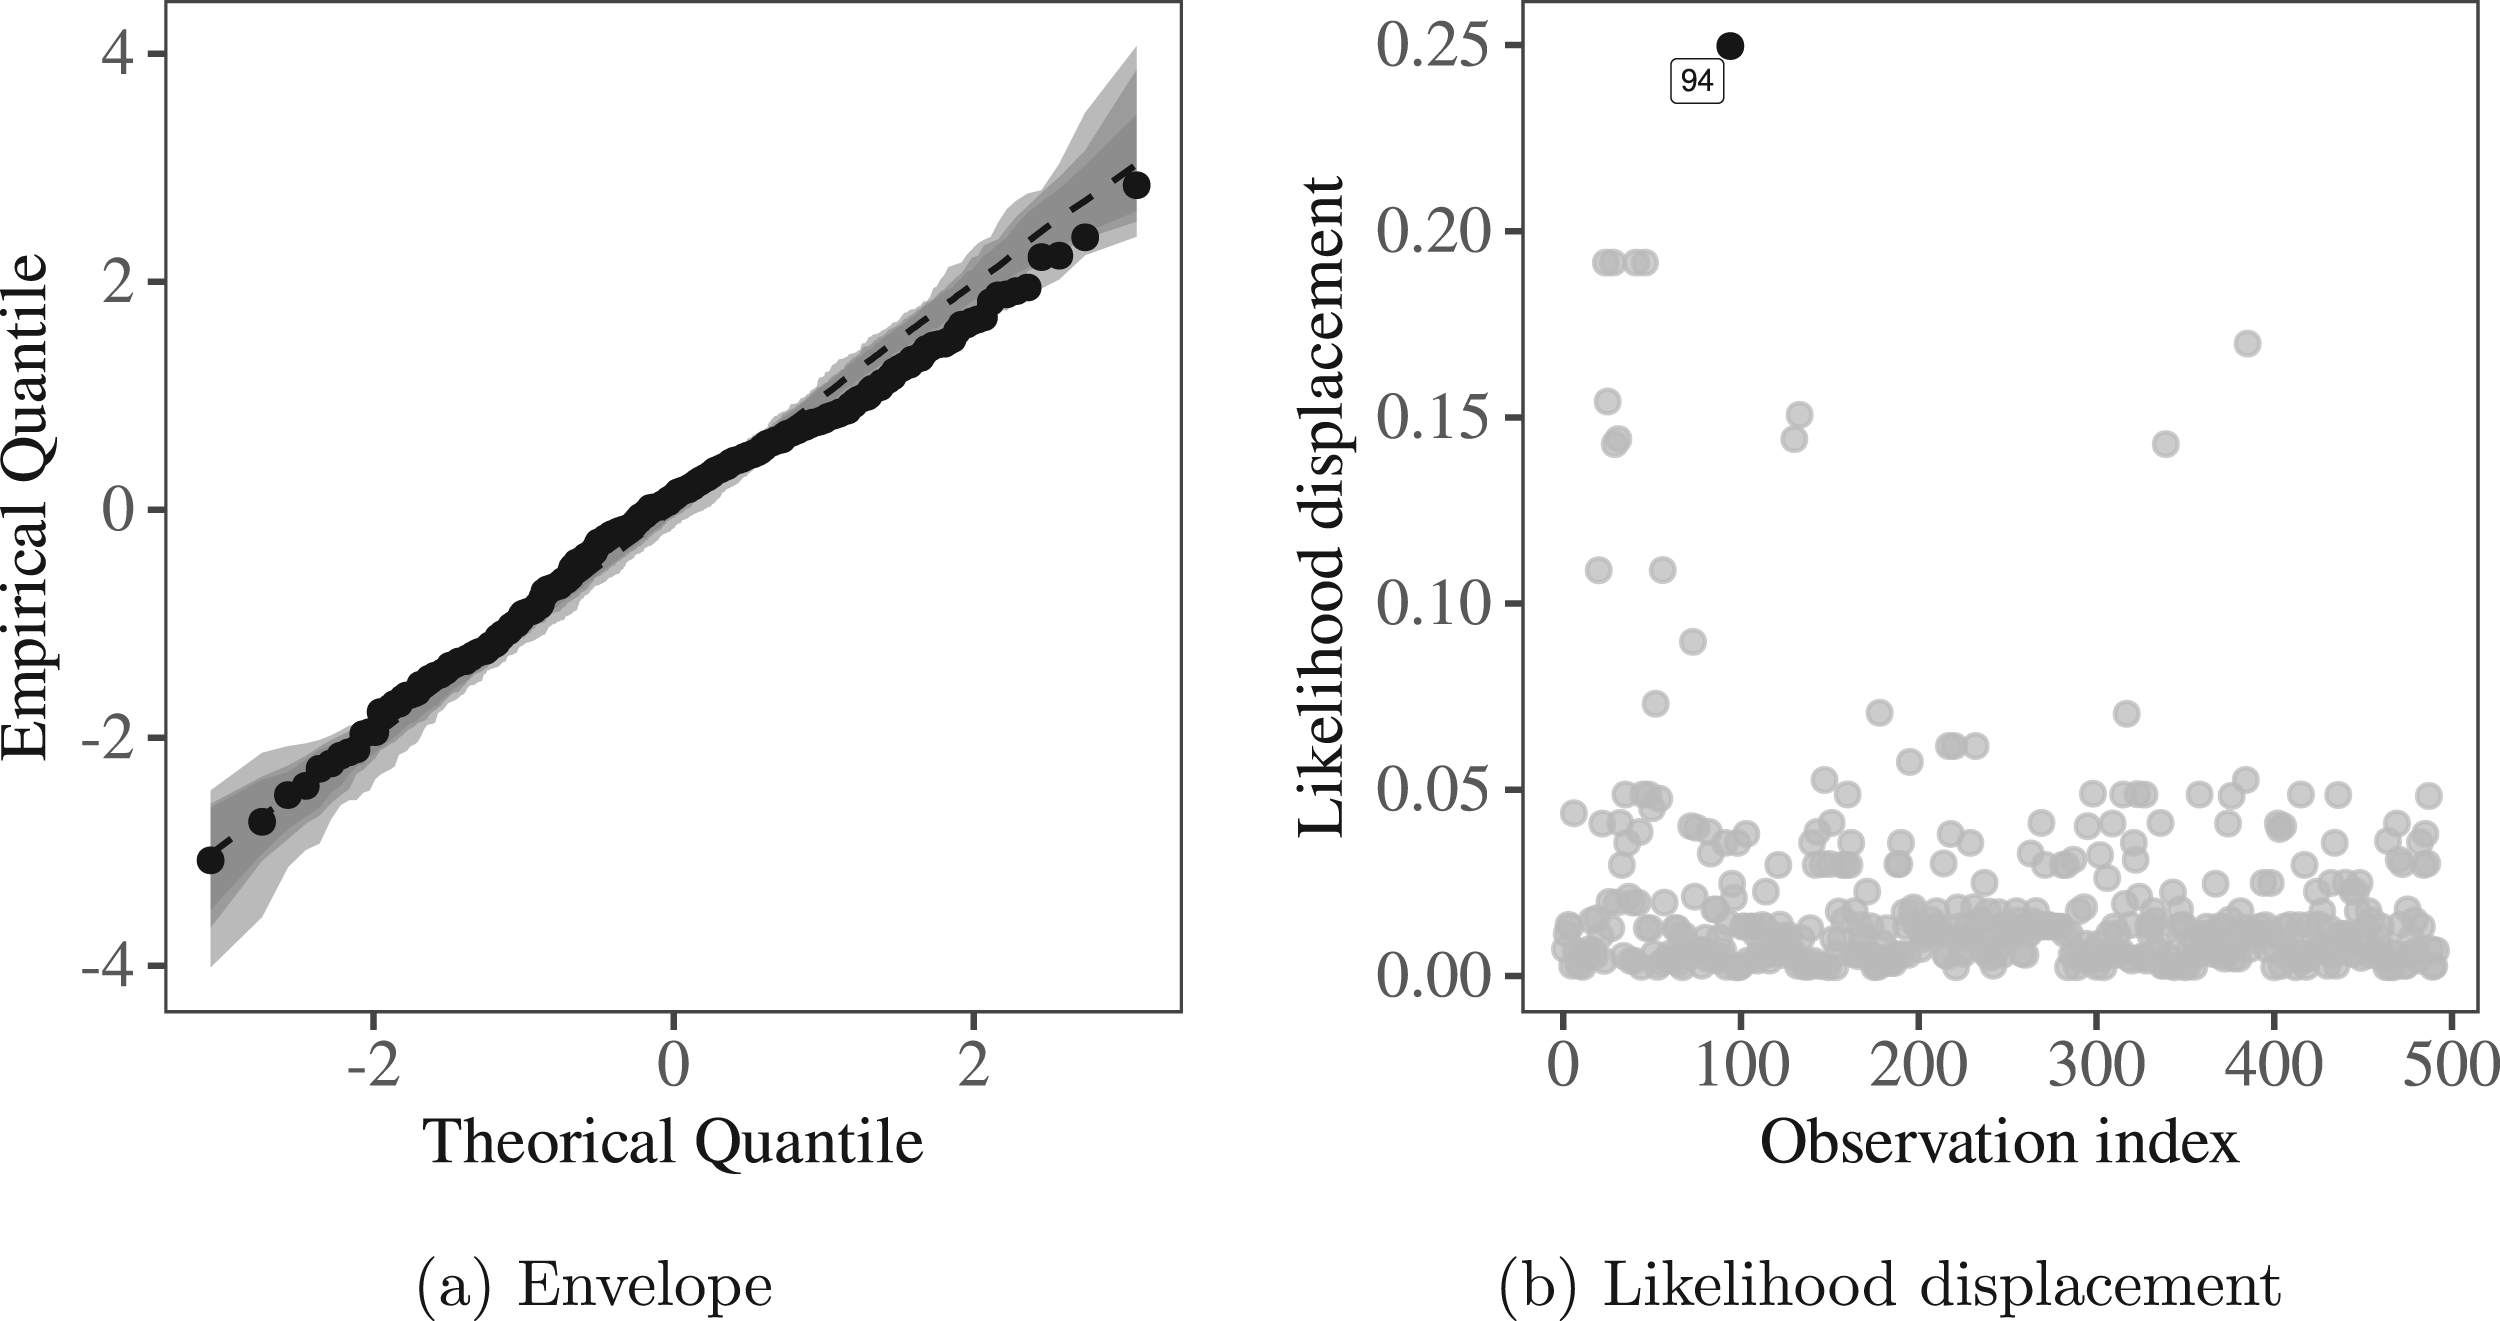
Normal probability plot with simulated envelope and index plot of the likelihood displacement for the Oromia—Ethiopia data. (a) Envelope and (b) Likelihood displacement
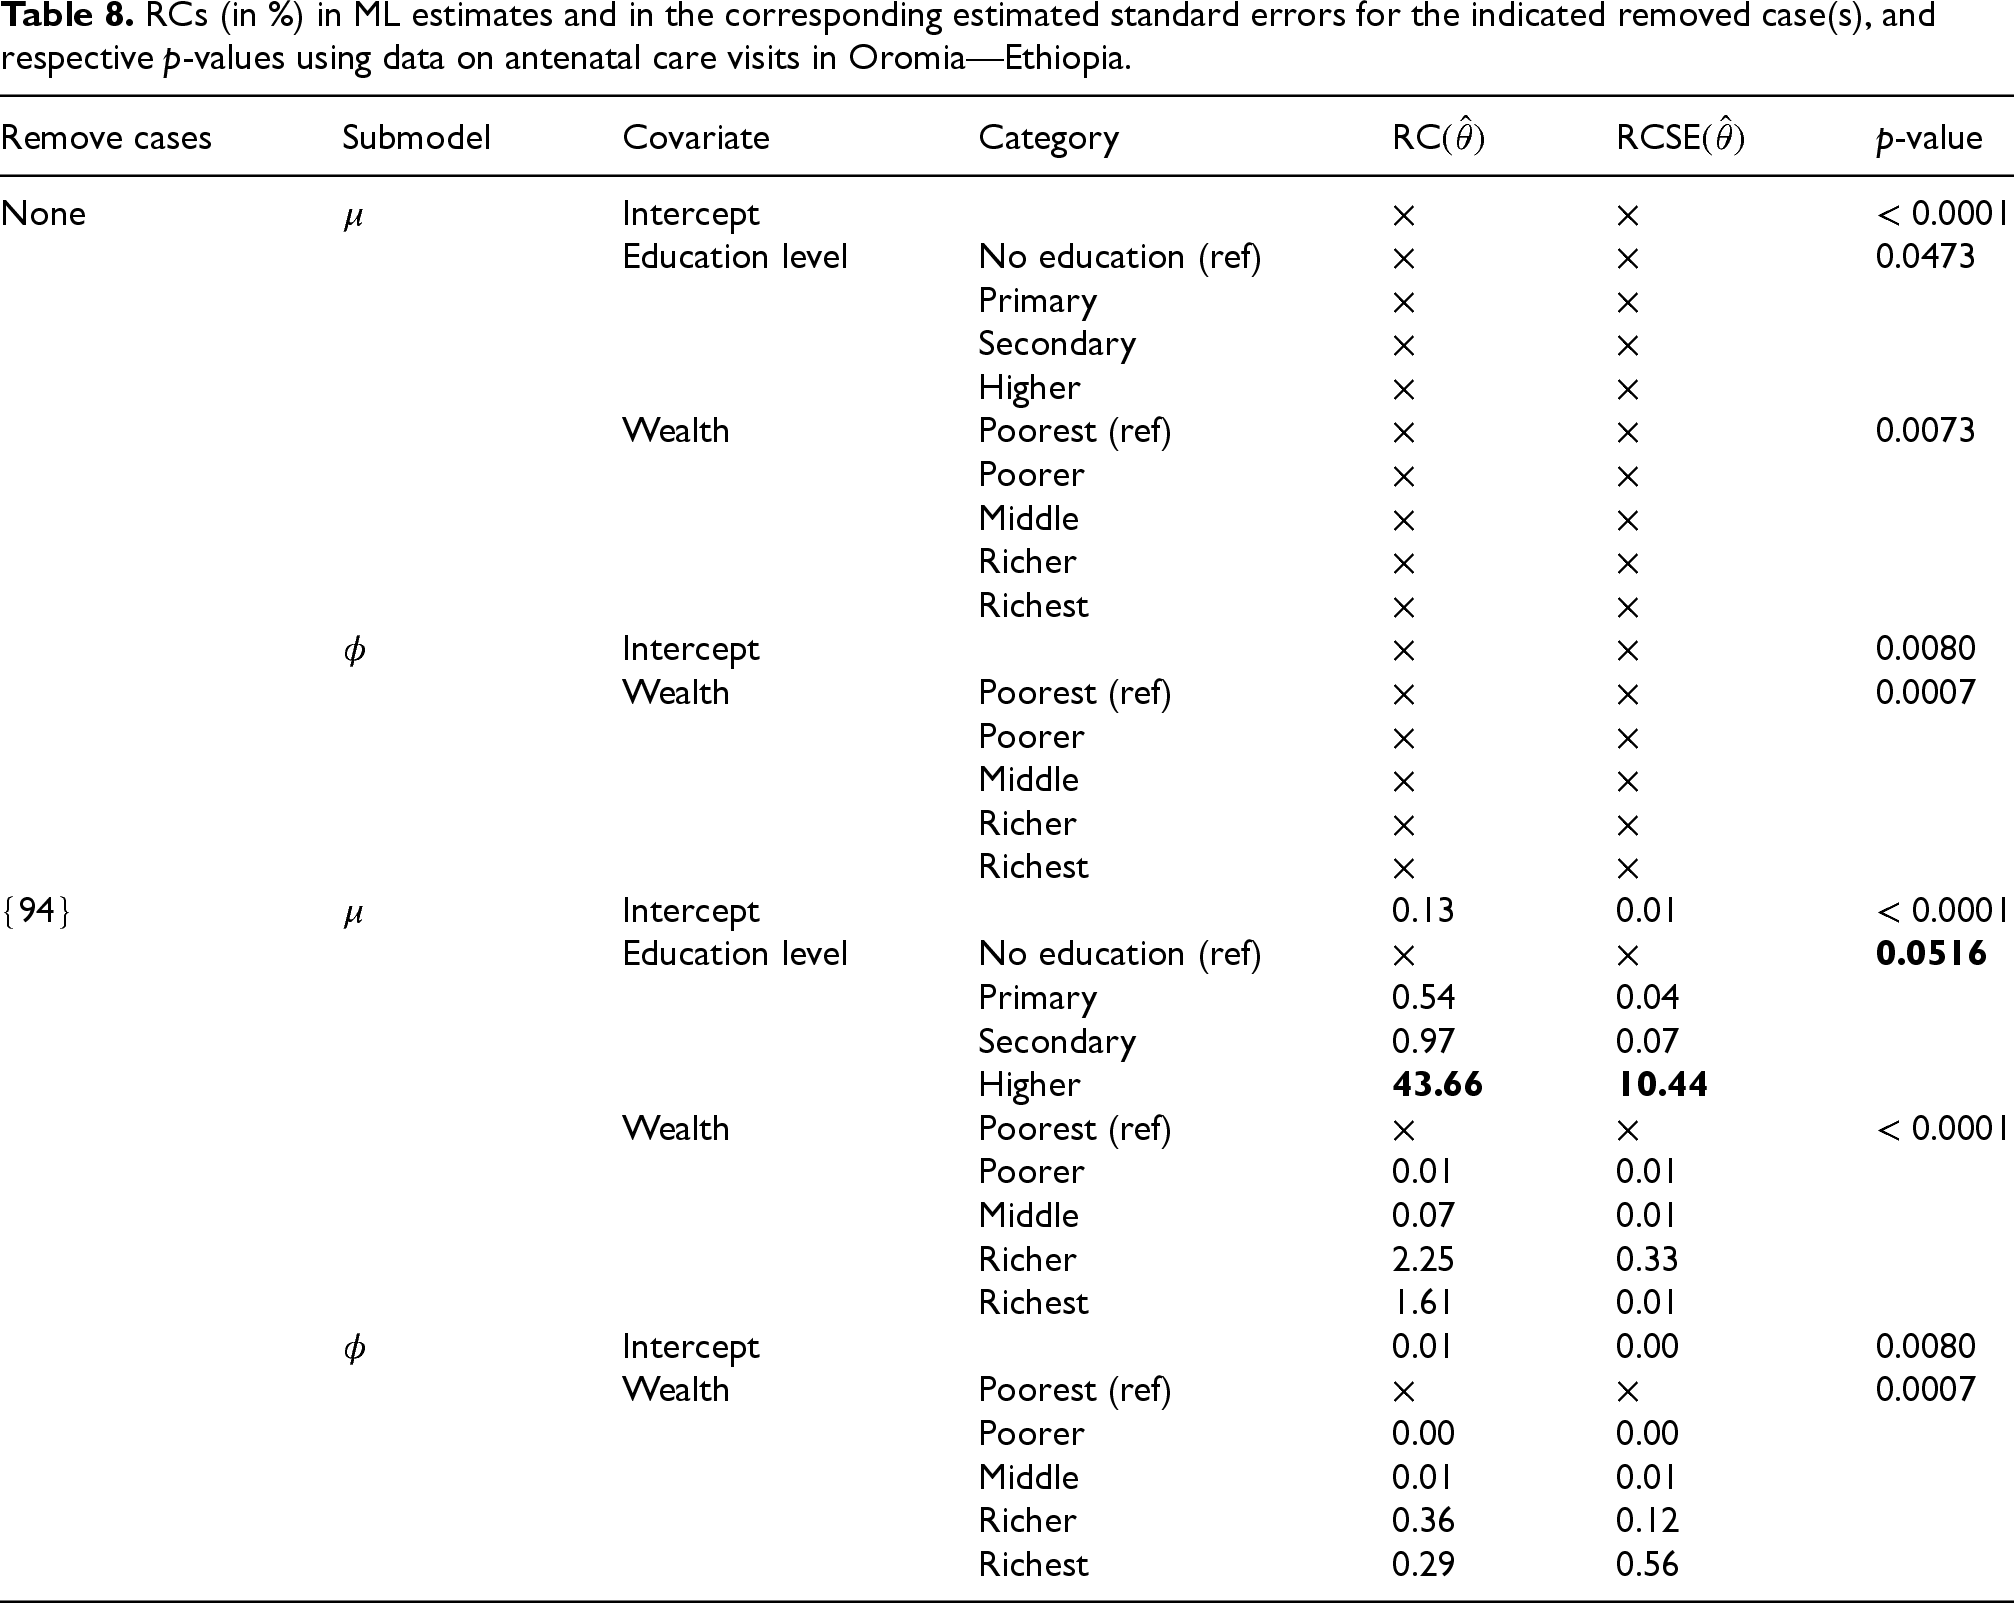
Table 8 presents the relative changes (RC) in the parameter estimates and their corresponding changes in the estimated standard errors (RCSE), based on antenatal care visit data. These changes are calculated from

RCs (in %) in ML estimates and in the corresponding estimated standard errors for the indicated removed case(s), and respective
AIC and BIC for the final model for the antenatal care visits in Oromia—Ethiopia.

In this work, we introduced a more interpretable regression model for count data with excess of zeros based on a reparameterization of the zero-inflated Poisson distribution. Inferential and diagnostic tools for this novel model were discussed. An application on number of antenatal care visits in Oromia, Ethiopia illustrated the usefulness of the proposed regression model.
The existing zero-inflated regression models are less interpretable than the other common models for count data. The parameters of our regression model are easily interpreted, especially when using the logarithmic link function as it was done in Section 6. Therefore, the proposed ZIP3 regression model will be very useful in medical research and also in other areas, when the response is a count variable with a high proportion of zeros.
When the response variable has more zeros than expected by the best known count distributions and a zero-inflated Poisson regression model is under consideration, it is of interest to know when to use which of the possible models. The ZIP regression model is the most suitable when the excess of zeros results from the existence of two subpopulations and the main interest is to study the mean response of the subpopulation that can assume values greater than zero. When there are two subpopulations, but the interest is the mean of the response variable instead of the mean of the response in one of the subpopulations, the ZIP2 regression model is more suitable. However, in practice, the excess of zeros is not usually the result of the existence of two subpopulations. When there is a single population, the ZIP3 regression model is the most appropriate when not only the mean but also the dispersion of the response variable is important. The application presented in Section 6 exemplifies a situation where the mean and dispersion of the response variable are important. Finally, when there is a single population and we are interested only in the mean of the response, then both ZIP3 and ZIP2 regression models can be used.
Apart from the ZIP regression model, there are several other regression models for count data with excess of zeros, such as the ZINB regression model, the ZIGP regression model, 49 the ZICMP regression model, 50 the ZIDP regression model, 51 and the ZIBELL regression model. 52 These models may outperform the ZIP3 regression model in some applications. Therefore, future research can propose reparameterizations for the distribution of the response variable of these models in order to make all parameters of the distribution of response variable interpretable.
We also acknowledge an anonymous reviewer for suggesting a shared-parameter 53 extension of the ZIP3 model, in which the linear predictor of the marginal mean is incorporated as the sole covariate in the dispersion component. Such a formulation offers several appealing features, including a reduction in the number of parameters, improved numerical stability in maximum likelihood estimation, and closer alignment with modeling strategies that avoid extensive model selection procedures. Moreover, under a log-link specification for the dispersion component, this approach may recover the NBII variance structure as a special case, providing a convenient framework for testing nested models. Taken together, these aspects suggest that a shared-parameter ZIP3 formulation may represent a parsimonious and competitive alternative to existing models such as ZINB2, constituting a promising avenue for future research, particularly in applications where interpretability, parameter parsimony, and model stability are of primary concern.
Footnotes
Acknowledgments
The authors thank the editors and reviewers for their constructive comments on an earlier version of this manuscript that resulted in significant improvement of the paper.

Funding
The authors disclosed receipt of the following financial support for the research, authorship, and/or publication of this article: This work was partially supported by São Paulo Research Foundation (FAPESP), grant number 2020/16334-9. The research was also partially supported by CNPq and CAPES grants from the Brazilian federal government, by FAPEAM grants from the government of the State of Amazonas. In addition, Jeremias Le\∼ao is supported by the Brazilian agencies CNPq (grant number 300393/2025-3).
Declaration of conflicting interest
The authors have no conflicting interests to declare with respect to the research, authorship, and/or publication of this article.