






Abstract
The localization receiver operating characteristic (LROC) and the free-response receiver operating characteristic (FROC) curves are popular methods for evaluating the performance of diagnostic tests concerning detecting and locating lesions. However, the existing LROC and FROC curves have some limitations in their definition and estimation methods. In this article, we extend the LROC curve to the free-response tasks where each case can be marked with multiple suspicious locations and propose a nonparametric estimation of the LROC curve to compensate for the limitations of existing LROC and FROC curves. We derive the asymptotic properties for our estimators and propose a bootstrap method for constructing confidence bands for the proposed LROC curve. Simulations are conducted to compare the proposed LROC curve with the existing AFROC curve and to examine the theoretical results. Finally, we apply our method to evaluate the performance of a diagnostic test investigating AI-assisted pulmonary nodule diagnosis.
Introduction
For AI or human readers that both detect and localize abnormalities—such as pulmonary nodule detection software 1 and colon polyp computer-aided detection tools 2 —the receiver operating characteristic (ROC) curve may overestimate performance, as it fails to penalize mislocalization errors that undermine clinical utility. To address this limitation, two extended ROC frameworks have been developed for detection and localization tasks, the localization ROC (LROC) curve 3 and the free-response ROC/alternative free-response ROC (FROC/AFROC) curve. 4 These two curves exhibit distinct application scenarios: in imaging studies where observers (or AI tools) are restricted to marking and scoring only a single suspicious location per image, the LROC curve proves optimal; if annotating all suspicious locations with confidence scores is allowed (e.g. multi-lesion detection), the FROC/AFROC curves become the appropriate framework. Liu et al. 1 collectively refers to these two types of curves as “location-specific ROC curves.” Unlike the conventional ROC curve, which only distinguishes between diseased and normal cases, location-specific ROC curves integrate spatial localization accuracy into the performance metric, providing a more comprehensive and clinically relevant evaluation. 5
The LROC curve has been widely used in radiology studies.6–9 Compared to the ROC curve, the LROC curve adds the true localization of diseased cases into the gold standard, giving a more appropriate definition of true positive in diagnostic cases where localization matters. Swensson 10 introduced a binormal parametric model to estimate the LROC curve using the maximum likelihood method, and Popescu 11 proposed a nonparametric model using kernel density estimation for LROC analysis. Wilcoxon statistic was later used to estimate the area under the curve (AUC) of the LROC curve by Tang and Balakrishnan. 12 However, the parametric model assumes the normal distribution of the test results, which may not be satisfied in practice Bandos et al. 13 The nonparametric model needs fewer assumptions, but the existing research lacks proof of the consistency and asymptotic properties.
The FROC curve was first proposed by Bunch et al.
4
and developed by Chakraborty.
14
In an FROC study, readers are allowed to mark any number of suspicious lesions for each image and then assign confidence scores to them, respectively. Each marked location can be classified as either a true positive (TP) or false positive (FP) finding based on the presence or absence of an actual abnormal lesion. The data is summarized in an FROC plot, where the
Our motivation comes from a diagnostic test where researchers aim to investigate the accuracy of an AI software in diagnosing lung nodules on CT scans. For each scan, the software marks all suspicious locations that might be lung nodules and assigns confidence scores to them, where a higher score indicates a greater probability that the marked location is a pulmonary nodule. The gold standard is given by a group of experts. The data consists of two parts: the confidence scores and the localization information. Since some scans have more than one marked location, the existing LROC curve is not suitable. The AFROC curve can be applied, but existing methods mainly focus on its AUC, while other indices that are also important, such as the true positive rate (TPR) at a fixed false positive rate (FPR) and within a range of FPRs, 5 are neglected. Another limitation of the AFROC curve is that it doesn’t consider the confidence scores of the diseased cases with wrong localization. This implies that the use of AFROC curves fails to reflect the software’s capability of avoiding incorrect markings during lung CT scans of cancer patients, which is crucial as it prevents misjudgment in patient treatment. In conclusion, although there exist location-specific ROC curves that can be applied to our dataset, they fail to comprehensively measure the diagnostic and localization accuracy of the software. Therefore, we extend the LROC curve to the case where there can be any marked locations in each case and propose nonparametric inferences for it to achieve the goal of the diagnostic test.
Our article has three main contributions. First, we propose the empirical LROC curve and prove its asymptotic properties on the process level. Our method needs no extra assumptions on the distributions of test results, has a convergence rate of
The rest of the paper is organized as follows. In Section 2, we propose the empirical estimation of the LROC curve and its extension to free-response tasks. In Section 3, we propose asymptotic properties of the proposed LROC curve and make inferences using our theoretical results. In Section 4 we illustrate our method through simulations. In Section 5 we apply our method to a real dataset from a clinical trial of a Software as a Medical Device (SaMD) by InferRead CT Lung, Infervision, Beijing, China. Section 6 is a discussion. Technical details are postponed to the supporting material.
Model
Definition of the LROC curve
In an LROC study (e.g. a radiology imaging test), for each case, the reader is asked to mark one suspected lesion and assign a confidence score to it. 5 The gold standard, usually determined by a separate group of expert radiologists, consists of two parts, namely the disease status of all subjects and the location of the lesion in diseased subjects.
For diseased cases, let


The LROC curve is defined as a plot of the TPR on the vertical axis versus the FPR on the horizontal axis as the


Suppose we have
The empirical estimates of


The extension to the free-response tasks
Before extending the LROC curve, we discuss the limitations of the existing LROC and AFROC curves and how the extended LROC curve can solve these limitations from the types of potential errors in free-response tasks. There are three kinds of mistakes in free-response tasks: (i) failure to mark locations on diseased cases where there is a lesion; (ii) incorrect marking of locations on diseased cases where there are no lesions; (iii) incorrect marking of locations on normal cases. The existing LROC curve neglects the third kind of mistakes since it assumes all cases, including normal cases, have one marked location. 10 The AFROC curve treats the first kind of mistakes as false negatives and the third kind of mistakes as false positives, 22 but neglects the second kind of mistakes.
Swensson 10 proposed the first-choice hypothesis: for a given case, the reader first determines whether the case is diseased, and then marks all possible locations. The determination of disease status depends on whether the maximum score assigned by the reader exceeds a threshold. Thus, in free-response tasks, the maximum score among the marked locations for each case represents the reader’s report for that case. We further extend this by using the score and localization information of the marked location with the highest score in each case as the case-level judgment, and use it to define the TPR and the FPR. Unlike the AFROC curve, which overlooks erroneous localizations in diseased individuals, our method treats a diseased case as having a localization error if an incorrect localization’s score exceeds that of all correct localizations. Our approach captures three types of errors in free-response tasks and demonstrates greater sensitivity than the AFROC curve in detecting localization errors in diseased cases. We will illustrate this in the following estimation and in simulations.
Suppose we have
Then we can define the case-level rate as follows:
In normal cases,


In diseased cases,


Let
The case-level data can then be presented as follows:

For the diseased case, let
We then define the case-level TPR and the FPR in free-response tasks when the threshold is set as


We get the empirical estimation of


Similar to the ROC curve, the proposed LROC curve has the property of invariance to monotone transformations of the confidence scores. Specifically, let


Assumptions and statistical properties
In a FROC study, a common assumption is that the test results from different cases are independent. However, assuming that the test results from a single case are independent may be too strong in some situations and difficult to justify.
13
Luckily, after transforming the data we only need to assume the independence of the test results from different cases. In detail, the following assumptions are needed to obtain the asymptotic properties:
Confidence scores from different cases, i.e. The sample sizes m and n are such that The distribution function
Under the assumptions (1), (2), and (3), we have the following theorems:
We derive the uniform consistency of the empirical LROC curve:

We obtain the convergence of the empirical LROC curve on the process level. In detail, We can define two Brownian bridges

With Theorem 2, we obtain the asymptotic normality of the empirical AUC:


Proofs for Theorems 1 and 2 are provided in Appendix A. When
We first focus on the TPR at a given FPR, i.e.

Also, using Corollary 1, the confidence interval for the AUC of level

Specifically, suppose we aim to estimate the variance Based on original data compute empirical estimation Generate a bootstrap sample of For normal cases, draw a sample For diseased cases, draw a sample Based on the bootstrap sample, compute empirical estimates Repeat (2) and (3) for
Confidence bands for the LROC curve
We have already gained the confidence interval of
In ROC analysis, Macskassy et al.
24
first applied the bootstrap approach to build a confidence band for ROC. Hall et al.
25
and Ghosal and Gu
26
discussed the statistical properties of the nonparametric confidence band for ROC. The inspiration for our method comes from Bertail et al.,
21
Who proposed a bootstrap method for constructing confidence bands for the ROC curve. According to Bertail et al.,
21
naive bootstrap (i.e. resampling from the raw empirical distribution) provides an unsatisfactory approximation as the convergence rate of a given quantile is Based on original data compute empirical estimation Generate a bootstrap sample of For normal cases, draw a sample For diseased cases, draw a sample Based on the bootstrap sample, compute Get the bootstrap confidence bands at level


For the smoothed bootstrap method, we have the following theorem whose proof is provided in Appendix A of the Supplemental Material.
If both

If we choose
In this section, we conduct three simulations. The first is to assess the bias of the empirical LROC curve in finite samples. The second is to assess the coverage rate (CR) and average width (AW) of the confidence band for the LROC curve and the confidence interval for the AUC. Here, the coverage rate is the proportion of simulation runs where the true LROC curve lies entirely within the confidence band or where the true AUC lies within the confidence interval, and the average width refers to the mean of width of the confidence interval for AUC or the confidence band for the LROC curve across all simulation runs. The third is to show that the LROC curve can detect the reader’s mislocation mistakes in diseased cases, which the AFROC curve ignores.
Simulation for the bias of the empirical LROC curve in finite sample
From the mathematical definition, The Integrate Bias, which is The Integrate MSE, which is
Let

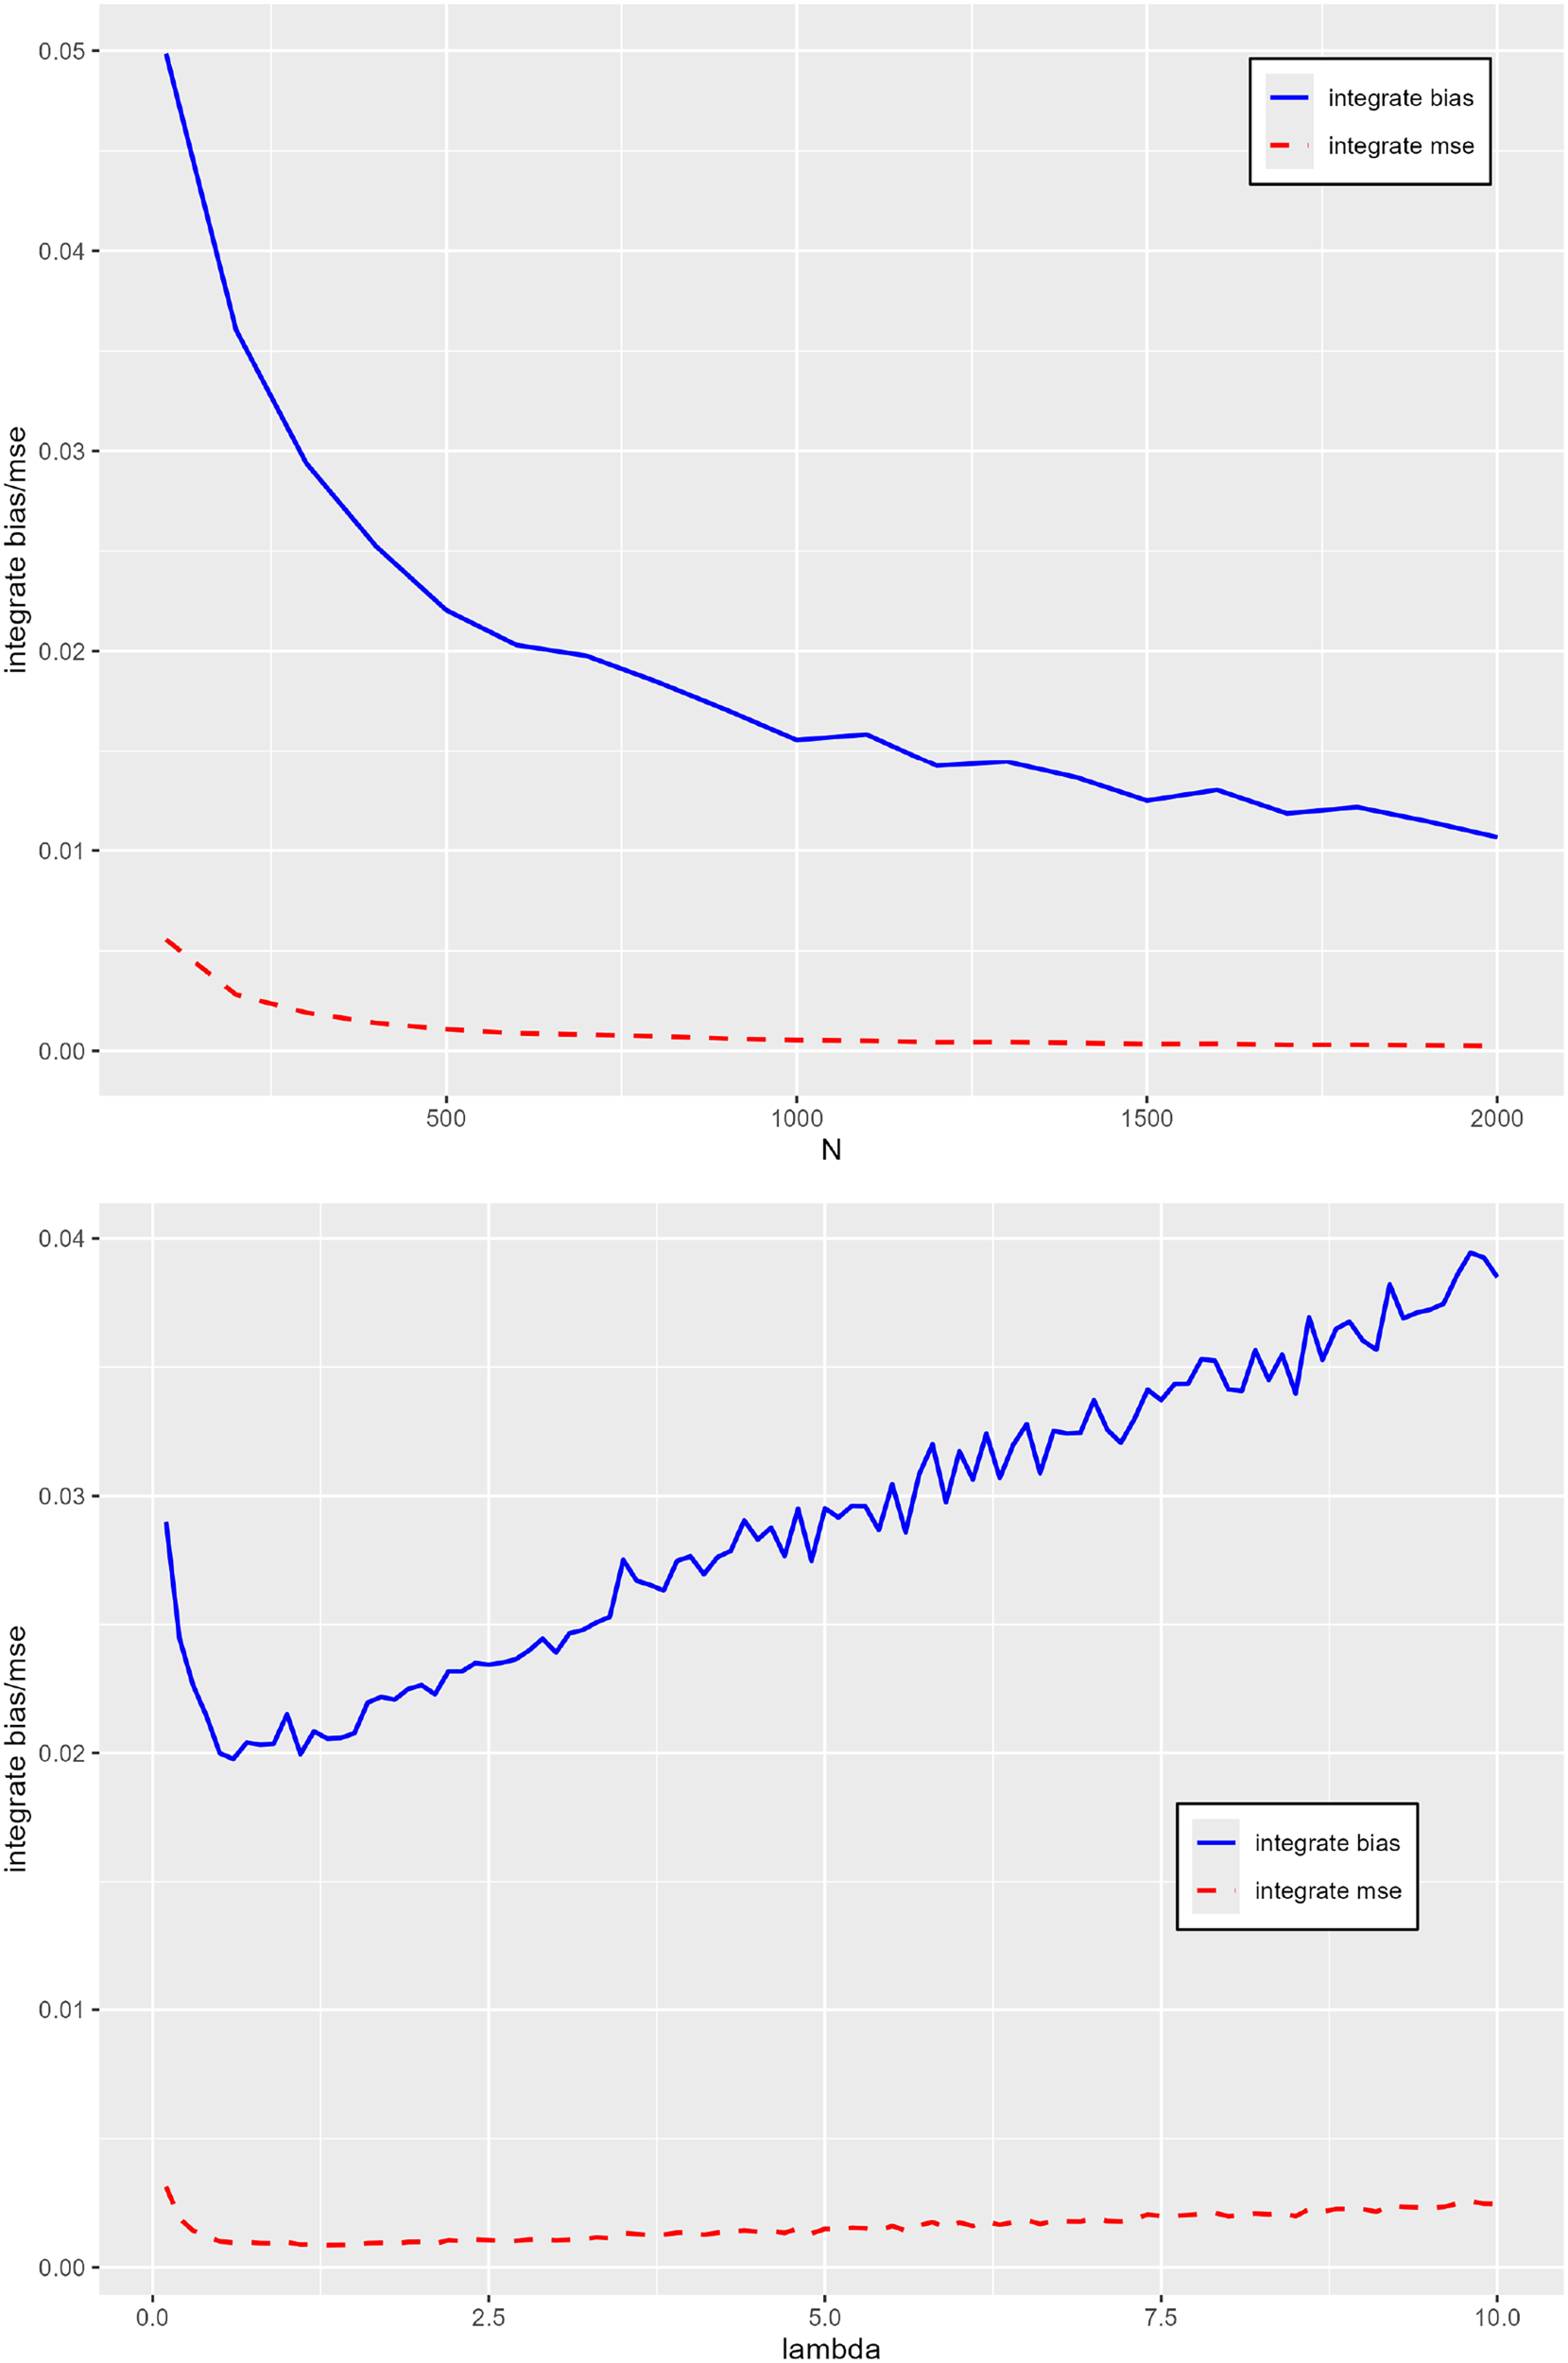
Here we show the simulation result for the normal distribution in Figure 1 and leave other results in Appendix B. Simulation results of Integrated Bias and Integrated MSE for these three distributions of
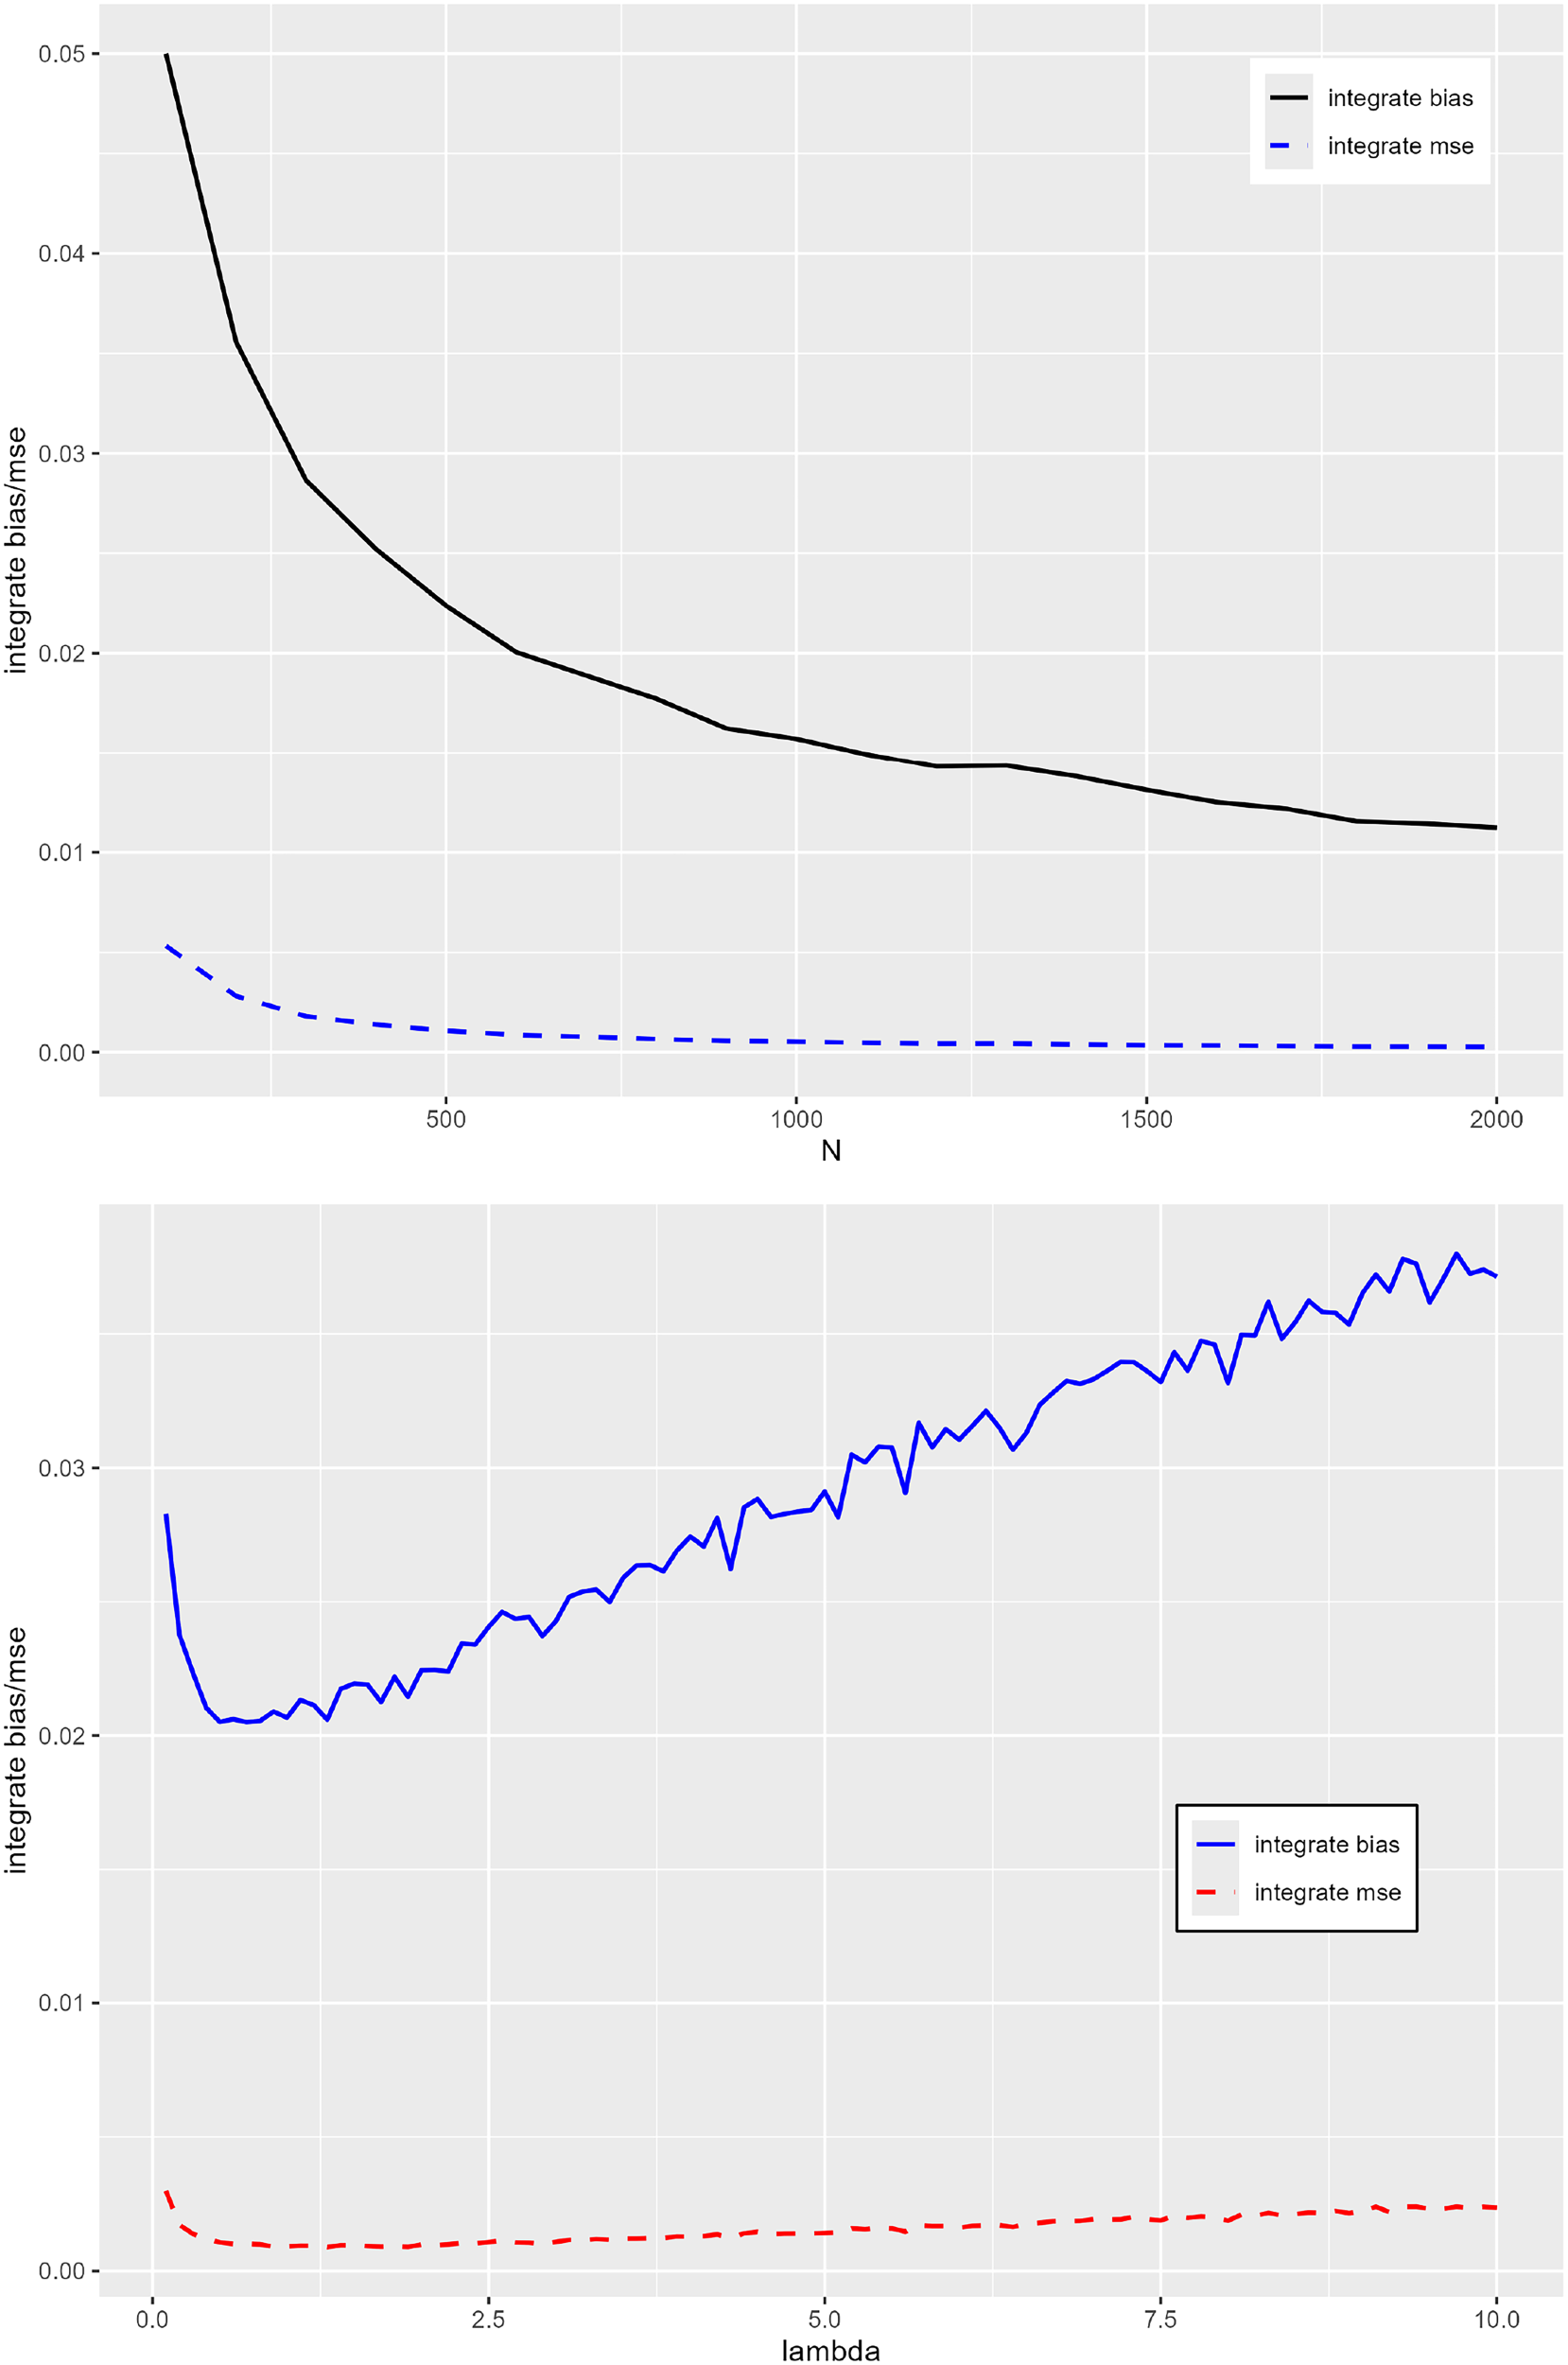
Integrate bias and MSE for normal distribution as
In the second simulation, we illustrate our bootstrap methods. First, we compute the coverage rate and the average width of the AUC confidence interval and the LROC confidence band. We choose confidence level Normal distribution: Lognormal distribution: Beta distribution:
We choose
Table 1 shows the simulation result for the AUC confidence interval. The coverage rates are close to 0.95 in all cases. Even with a small value of N, the coverage rate can be consistently maintained within the range of 0.94 to 0.96. This result indicates that our proposed approach remains valid and practicable in settings with limited sample sizes. We also notice that the average width is influenced by
Table 2 shows the simulation result for the LROC confidence band. The average width of the confidence bands consistently decreases as the total sample size increases, which aligns with the expected behavior of a consistent inference procedure. For the coverage rate (CR), the results are overall close to the nominal
Simulation for AUC confidence interval.

Simulation for AUC confidence interval.
Simulation for the LROC confidence band.

In the third simulation, the LROC and AFROC curves are used to analyze the free-response tasks data to show that the LROC curve is superior to the AFROC curve in detecting mislocation mistakes in diseased cases. We set For For
Since the LROC curve and the AFROC curve have the same FPR, we focus on parameters related to diseased cases and fix other parameters. In detail, we fix
Figure 2 shows the results of the two curves at different

The empirical LROC (top) and AFROC (bottom) curve for different

The empirical LROC (top) and AFROC (bottom) curve for different

The empirical LROC (top) and AFROC (bottom) curve for different
We illustrate the LROC method using the data from a clinical trial of a SaMD by InferRead CT Lung, Infervision, Beijing, China, coming from Liu et al. 1 The SaMD, which aims to help readers find pulmonary lesions, can mark all suspicious lesions in an image and assign confidence scores to them.
This study tries to demonstrate superiority in the performance of a radiologist aided by the software, as well as in the performance of this software when it works alone. 1 Therefore, the study consists of a multi-reader, multi-case reader study and a SaMD working alone study. We focus on the SaMD working alone study and want to prove its effectiveness. The data, consisting of 161 normal and 183 diseased cases, is continuous. The gold standard is set by three experienced experts. The first and second experts independently read the image and recorded the locations, sizes, and categories of the lesions. The last expert acts as an arbitrator. If the first two experts have different opinions, the last expert makes the final decision. The software then analyzes all subjects, distinguishes diseased and normal subjects, and indicates suspicious lesions in those diseased subjects.
The study is a free-response task since from the design researchers didn’t order the software not to mark more than one lesion for each image. In the original study, researchers considered three indices: LDR NSMR and cAFAUC. These indices are tightly associated with the AFROC curve and have clear clinical interpretations. (For more details we refer to Liu et al. 1 ) However, these indices do not consider the reader’s mislocation mistakes in diseased cases. Although the SaMD performed well in these indices, the ability of the SaMD to avoid marking normal locations in diseased cases remains unknown. For an extreme example, consider another reader (denoted as A) performing the same in normal cases and those marked lesions as the SaMD. However, the confidence scores assigned by A to those mislocated locations and the marked lesions are from the same distribution, i.e. A can hardly distinguish between lesions and normal locations in diseased cases. A is worse than the SaMD, but their empirical AFROC curves and the three indices above are the same, which means the original study can’t distinguish A and the SaMD. The LROC curve can then be used to complement the SaMD’s research.
We use the method proposed in Section 2 to deal with the data. Our results are shown in Figure 5, which shows the pointwise confidence interval and the confidence bands for the LROC curve. Since our dataset is small, the bootstrap confidence band over the interval

Pointwise confidence intervals (top) and confidence band (bottom).
In addition, we compute that the AUC of the empirical LROC curve is
Compared to the methods used in Liu et al., 1 the LROC curve is a more comprehensive method that simultaneously reflects the SaMD’s three abilities: (1) to correctly locate lesions in the diseased cases; (2) to give higher confidence scores to lesions than those marked locations in normal cases; (3) to give higher confidence scores to lesions than to those wrongly marked locations in diseased cases. What’s more, we give the uniform band and pointwise intervals of the LROC curve so researchers can evaluate the ability of the SaMD both uniformly and at a fixed FPR.
Free-response observer performance assessment plays an important role in diagnostic radiology, 19 but the studies of its theory, i.e. the location-specific ROC curves and their estimators’ statistical properties, are scarce in comparison to its wide range of applications. In this paper, we propose an empirical estimation for the LROC curve to solve the problem of existing estimation methods for the LROC curve. Our method does not need extra assumptions on the specific distribution of the confidence scores to maintain its statistical properties, so it is theoretically reliable for continuous test results. We further extend the LROC curve to deal with the free-response tasks. The proposed LROC curve considers the confidence scores of those wrongly located regions in diseased cases, which are ignored by the AFROC curve. In practice, it punishes those who blindly give high scores to suspicious regions with wrong localization and prevents them from obtaining undue compliments, which may happen if the AFROC curve is used alone. Moreover, the AUC of the LROC curve has a specific probability meaning, which can serve as a proper summary of the reader’s ability and be used to compare different readers.
The limitation of our method is that we need to drop out some test results, which also happens in the AFROC and inferred ROC studies. Also, our method can only deal with continuous data. For future work, we want to extend our method to the case of ordinal data and binary data.
Supplemental Material
sj-zip-1-smm-10.1177_09622802261468028 - Supplemental material for Nonparametric inference for the localization receiver operating characteristic curve and its extension to free-response image localization tasks
Supplemental material, sj-zip-1-smm-10.1177_09622802261468028 for Nonparametric inference for the localization receiver operating characteristic curve and its extension to free-response image localization tasks by Kaiyuan Liu and Xiao-Hua Zhou in Statistical Methods in Medical Research
Footnotes
Acknowledgments
The authors thank the anonymous reviewers for their valuable suggestions. The authors thank the Beijing Infervision Technology Co. Ltd. for providing the dataset of the SaMD example.

Ethical approval and informed consent statements
Not applicable.
Consent to participate
Not applicable.
Consent for publication
Not applicable.
Funding
The authors disclosed receipt of the following financial support for the research, authorship, and/or publication of this article: the National Natural Science Foundation of China (Grant number 82173623).
Declaration of conflicting interests
The authors declared no potential conflicts of interest with respect to the research, authorship, and/or publication of this article.
Data availability statement
The data that supports the findings of this study are available from the Beijing Infervision Technology Co. Ltd. Restrictions apply to the availability of these data, which were used under license for this study. Data are available from the corresponding author with the permission of the Beijing Infervision Technology Co. Ltd.
Supplemental material
Supplemental material for this article is available online.
We begin our proof by referring to two results proposed by Hsieh and Turnbull. 20
Suppose
Since The empirical LROC curve is consistent when We can define two Brownian bridges
We treat these three parts respectively. Using the central limit theorem, Equation (16) and Slutsky’s theorem we have:
Since we have assumed that
Now we begin to prove the theorems in the article.
By proving Lemma 1 and Lemma 2, we have obtained the properties of Note that For any (1)For We then let Similar to the proof of Theorem 1, we first deal with for for We first rewrite We have already derived the asymptotic process of From Chapter 2 of Nonparametric Functional Estimation,
27
under the condition Using a similar approach, we can deal with other terms; here, we directly give the convergence rates of them:
In conclusion, we have


References
Supplementary Material
Please find the following supplemental material available below.
For Open Access articles published under a Creative Commons License, all supplemental material carries the same license as the article it is associated with.
For non-Open Access articles published, all supplemental material carries a non-exclusive license, and permission requests for re-use of supplemental material or any part of supplemental material shall be sent directly to the copyright owner as specified in the copyright notice associated with the article.
