






Abstract
Several studies provide evidence of the role of written communication in influencing public perception towards genetically modified organisms, whereas visual communication has been sparsely investigated. This article aims to evaluate the exposure of the Italian population to scary genetically modified organism–related images. A set of 517 images collected through Google are classified considering fearful attributes, and an index that accounts for the scary impact of these images is built. Then, through an ordinary least-squares regression, we estimate the relationship between the Scary Impact Index and a set of variables that describes the context in which the images appear. The results reveal that the first (and most viewed) Google result images contain the most frightful contents. In addition, the agri-food sector in Italy is strongly oriented towards offering a negative representation of genetically modified organisms. Exposure to scary images could be a factor that affects the negative perception of genetically modified organisms in Italy.
Keywords
1. Introduction
Despite the introduction of the first commercial genetically modified (GM) variety, a tobacco for industrial use, in the European Union (EU) in 1994, GM plants still represent one of the most controversial ‘science and society’ issues, and the debate on their safety divides the scientific community and public opinion. On different occasions, European citizens have expressed an obvious negative attitude towards GM food and crops. For instance, the 2010 Eurobarometer survey on Life Science and Biotechnology (Special EB 341, European Commission, 2010) revealed that there is an overall suspicion regarding GM foods among the EU public. Most Europeans (61%) agreed that GM food makes them feel uneasy, and a higher proportion (70%) thought that GM food is fundamentally unnatural. Low public acceptance is a strong barrier to the diffusion of this technology for the food sector, and many scientists attribute the cause of this scepticism to a negative social framing of genetically modified organisms (GMOs), mostly supported by the mainstream media (Flipse and Osseweijer, 2013; Herring, 2008; Marks et al., 2007; Terpstra et al., 2014). Nevertheless, in recent years, the rapid expansion of Web 2.0 offers a new media environment for science communication, characterised by hypertextuality, interactivity and multimediality (Brossard, 2013).
The fact that GMOs are often associated with a sense of fear is documented in the literature. Comparing different food types (organic, regular, functional and GM food), Laros and Steenkamp (2004) found that GMOs evoked significantly more fear than any other food type and that the fear of GM food is cross-cutting and common to all socioeconomic layers of society. Moreover, Blancke et al. (2015), using a cognitive approach, indicated that GMO opposition is a fatal attraction for the human mind, which is particularly vulnerable representations of GMOs as dangerous and immoral. Lewison (2007), evaluating the tone of newspaper articles on GMOs in six countries, found UK news media to be more ‘scary’ than others.
Castro and Gomes (2005) defined the press debate on GMOs as a ‘battle of words’. In this context, Italy is a particularly relevant case due to the peculiarity of its agri-food sector, especially with regard to the applications of GM technology. Italy is the European Member State with the highest number of products protected by denominations of origin (PDOs) and products protected by geographical indications (PGIs), with a total of 269 agricultural products and foodstuffs in 2015, followed by France (219) and Spain (178) (DOOR database, European Commission, 2015). The traditional/local food sector is complemented by the organic food sector, in which Italy demonstrates the largest number of holdings in Europe (European Commission, 2013). In contrast, Italy does not commercially cultivate any GM crops (James, 2014).
The 2014 Global Agriculture Information Network (GAIN) report on agricultural biotechnology provided by the Foreign Agricultural Service (FAS) of the US Department of Agriculture (Bettini, 2015) reported that the general attitude towards GM crops in Italy remains hostile. The report adds that Italy’s ‘Made in Italy’ campaign and its role as a leading organic crop producer have prevented it from taking advantage of GM technology, also suggesting that the national media debate on GM crops and plant experimentation could have affected the political environment against support for GM research and cultivation.
In terms of public acceptance, Saba and Vassallo (2002), evaluating the attitude towards eating tomatoes produced with gene technology, found that most of the subjects of an Italian sample tended to hold negative attitudes. Harrison et al. (2004) stated that Italians were more sensitive to the health and environmental safety issues of GM foods than US consumers and Italian consumers were less likely to purchase GM foods. The authors explained these different consumer attitudes as a consequence of the differential exposure to the potential long-term and unforeseen risks of GM foods covered by the media. Additionally, the Special Eurobarometer 2014 (Special EB 419, European Commission, 2014) on Public Perception of Science, Research and Innovation stated that Italy has the lowest proportion of respondents who think that both science and technological innovation will have a positive impact on the availability and quality of food in the next 15 years. This result confirms that the negative orientation towards GM technology in Italy is embedded in more general domains, such as attitude towards technology, as demonstrated by Bredahl (2001).
Despite the abovementioned Italian scenario highlighting a conflicting relationship between tradition and technology in food, many traditional products rely on GM technology: even the iconic Italian PDO products (i.e. Parmigiano Reggiano, Prosciutto di Parma) are obtained from animals fed with GM soybeans, for which Italy is a net importer (Bettini, 2015). Commission Regulation (EC) No.1829/2003 on GM Food and Feed establishes that products obtained from animals fed with GM feed are subject to neither authorisation nor labelling requirements. A Greenpeace campaign to ban the use of GM feed for the production of Parmigiano Reggiano cheese started in 2007. To date, however, the feed market in Italy is estimated to be 87% GM, 12.5% conventional and 0.5% organic (Assalzoo, 2015).
Building on the above-described Italian scenario, this article aims to gain insights into the perception of GMO risks from visual communication to which the Italian population is normally exposed through the web. More specifically, we investigate the fear appeal of GMO-related images and assess the possible contribution of these visual contents to the shaping of a negative public perception. An analysis has been carried out on a sample of 517 images collected through the Google search engine in Italy. Our results confirm the media bias in GMO information and suggest that a ‘battle of images’ can contribute to the negative attitude towards GMOs.
2. Literature review
GMO and public acceptance
A recent meta-analysis of 70 studies (Frewer et al., 2013) confirmed that Europeans have more negative perceptions, attitudes and intentions towards purchasing GM food compared to North Americans. On the contrary, a large part of the EU scientific community appears to support GM technology: recently, more than 20 of Europe’s most prominent plant scientists signed a joint letter warning that Europe may lose its research leadership if plant science is not adequately funded, the cultivation of GM crop varieties is not validated as safe and GM plant field trials are not protected from vandalism. 1 In addition, most scientific studies provide robust evidence of the benefits of GM crops for farmers in both developed and developing countries (Klümper and Qaim, 2014) with no environmental (Dale et al., 2002) or health risks for feed use (Snell et al., 2012; Van Eenennaam and Young, 2014). Nicolia et al. (2013) concluded that scientific research so far has not detected any significant hazards directly connected with the use of GM crops.
At the European level, Savadori et al. (2004) assessed the perception of the risk of biotechnology applications in public (non-expert) and expert audiences and observed that the former perceived biotechnology applications as riskier than the latter. This disagreement is confirmed at a more global level: a 2014 report by the Pew Research Center about the public’s and scientists’ views on a range of science and technology topics in the United States highlighted that the largest opinion difference pertained to the safety of eating GM food (Funk and Raine, 2015).
In this context, the identification of the factors driving the public acceptance of GM technology is of great interest in the scientific literature. Costa-Font et al. (2008) modelled consumers’ acceptance of GMOs as a complex decision-making process that includes individual attitudes, knowledge of the product and process and perceptions of the risks/benefits associated with GM food.
Individual attitudes include socio-demographic and cultural factors: many studies suggest that cultural differences are one of the main reasons for different levels of acceptance of biotechnology among individuals (Gaskell et al., 1999; Han and Harrison, 2007; Heiman et al., 2000; Moon and Balasubramanian, 2004).
Another aspect that influences the acceptance of GMOs is the perception of risks, mainly related to health and environmental concerns. Frewer et al. (1998) suggested that individual behaviours are driven by perceptions or beliefs about risks, rather than the technical risks estimated by scientific experts. According to Gaskell et al. (2004), the sceptical position of consumers derives from the absence of perceived benefits, which acts as a predominant attribute, whereas risks appear to be less relevant. It follows that GM food fails to meet the key criterion of innovation: improvement of the status quo. Nevertheless, Costa-Font and Mossialos (2007) proposed the existence of simultaneity and endogeneity regarding risk and benefit perception: those individuals who are likely to identify high risks with regard to GM food might be the same as those who identify lower benefits.
The role of the media
A large body of research investigating information asymmetries found a direct association between knowledge of GM technology and support for GM foods (Costa-Font et al., 2008; Koivisto-Hursti and Magnusson, 2003; Małyska et al., 2014). Several authors called for an increase in public information to ‘fill the gap’, supporting the so-called knowledge deficit model. Nevertheless, there is also a wide body of literature that showed that the provision of more information on GMOs does not always lead to improved public knowledge and acceptance, thereby declaring the failure of this theoretical approach, which may even become counter-productive (Hansen et al., 2003; Verbeke, 2005), mainly due to the presence of a media bias in risk amplification (Frewer et al., 2002; Scholderer and Frewer, 2003; Vilella-Vila and Costa-Font, 2008).
Bucchi and Neresini (2002), in their survey on Italian citizens, concluded that ‘biotech remains unloved by the more informed’. They confirmed that exposure to information does not always lead to greater trust in biotechnology, mainly in its agri-food application, with the level of education being a more important factor.
Furthermore, McCluskey and Swinnen (2004) suggested a ‘Bad News Hypothesis’ to explain how the supply of bad news over good news is mainly driven by consumers’ demand rather than by inherent preferences of the media itself because the consumer tends to prefer more bad news stories than good news ones. In agreement with this hypothesis, Curtis et al. (2008) proved that reduced exposure towards biotechnology information from the media, as is the case in lesser developed countries (LDCs), contributed to a lower perception of risk among the consumers, whereas Vigani and Olper (2013, 2014) empirically confirmed this theory by stating that the media structure influences the level of restrictiveness of GMO regulations and also private GMO-free standards at the food retailer level.
The role of information provision is also influenced by the type of source, which translates into the question, ‘Who would you trust most?’ (Frewer et al., 1999; Lang and Hallman, 2005; Marques et al., 2014). Huffman et al. (2004) stated that for GMO information, third parties, including university and scientists/researchers, are the most trusted sources, followed by the government. A study by Lewison (2007) revealed that the level of scariness of newspaper articles also depends on the type of person or organisation targeted. Hence, the investigation of the patterns of communication proposed by different web sources could provide useful insights in relation to their level of public trust.
Visual communication
Although the influence of modern mass media on the social acceptance of new technologies has been extensively investigated (Bauer, 2005; Bonfadelli, 2005; Cacciatore et al., 2014; Schäfer, 2011), the vast majority of the studies that assess the role of information in GMO-related issues is focused on the analysis of written communication. These studies analyse, for instance, the trend of newspaper coverage in terms of number of articles, as in Kalaitzandonakes et al. (2004), Marks et al. (2007), Lewison (2007) and Vilella-Vila and Costa-Font (2008). They also include a content analysis based on keywords (Cook et al., 2006; Crawley, 2007; Marks et al., 2003), rather than a comparison between scientific literature and popular magazine contents (Mcinerney et al., 2004). In contrast, visual communication regarding GMOs has been investigated to a lesser extent: Frewer et al. (2015) indicated a knowledge lacuna on this topic and called for more research using non-verbal (graphical, pictorial) methods for communicating risk/benefit concepts.
The use of images as a communication tool is supported for many reasons, starting with the ‘picture superiority effect’ theory that was initially proposed by Paivio and Csapo (1973) and Nelson et al. (1976). Leaving aside the complex explanation of the cognitive processes that form the fundamentals of this theory, its main idea rests on the empirical finding that pictures are better remembered than words.
Second, images are able to raise emotions (Iyer et al., 2014; Iyer and Oldmeadow, 2006; Joffe, 2008; Smith and Joffe, 2009). Dobos et al. (2014) analysed whether and how pictures can effectively communicate information about Alzheimer’s disease, finding that, in the case of a specific communicative intention, they are generally not effective without explanatory text because pictures are endowed with ambiguity and rely more on the emotional sphere.
This iconic role of visual representation has been extensively explored for the issue of climate change: Höijer (2010), starting from social representation theory, analysed the mechanisms of emotional anchoring and objectification of verbal and visual representations of climate change in the Swedish media and found that fear, together with hope, guilt, compassion and nostalgia, is an emotion attached to visual representation.
Finally, the role of visual content is to solidify risks. Through frightening images, climate change is turned into something physical and concrete (Höijer, 2010; Smith and Joffe, 2009). O’Neill et al. (2013) showed through a direct survey that imagery promoted salience and, in some cases, the efficacy of communication about climate change, whereas a fear-inducing representation of climatic disaster seems to be ineffective, enhancing the feelings that climate change is a distant issue in both time and space (O’Neill and Nicholson-Cole, 2009). Nonetheless, the communication of risks concerning climate change and GMOs differs considerably, particularly in one aspect: the widespread public engagement needed for climate change, for example, promoting the adoption of emission-reducing practices, is not required in the case of GMOs.
Web information
The web media was selected following Schäfer (2012) who explained that the literature on the media coverage of science is biased towards print media, and analysis of science presentations on the Internet is still under-represented. Information-seeking behaviour is strictly related to personal risk perception, information needs and current knowledge variables (Huurne and Gutteling, 2008). Because online environments provide audiences with the opportunity to actively seek information about a specific risk, web searches have recently become one of the main accessed tools for seeking information (Tian and Robinson, 2008).
In a recent survey (FullPlan, 2013), it was reported that 68% of Italians use a web search engine at least once per day. One of the main reasons is to increase knowledge about something that was seen/read/heard through other communication media (i.e. TV, radio and social networks). Moreover, the same report also revealed that more than half of the Italian users (56%) tend to use the searching options for images that are made available together with other services (e.g. maps, news and shopping ads) by the search engines within the searched result pages. These data suggest that web images are frequently used as ancillary tools to enhance comprehension of a particular topic. Additionally, recent theories suggest the emergence of the so-called ‘Google effect’ on memory: when people are provided with new information, they are more inclined to devote memory capacity to location rather than content, as the web search engines become a personal memory bank (Sparrow et al., 2011). Furthermore, a study by Pan et al. (2007) demonstrated a substantial trust in Google’s ability to rank results in order of relevance, revealing the potential influence of search engines on culture and society.
In summary, the main purpose of this study is to investigate the use of images for the communication of GMO-related content on the Italian web. More specifically, this work addresses the analysis of the scariness of visual communication about GMOs, as expressed by the following research questions:
How are GMOs depicted on the Italian web? More specifically, are GMO-related images endowed with elements of fear that could contribute to shaping a negative public perception?
Who are the actors involved in visual GMO communication? Or, is the communication of GM technology dependent on the type of information source in the web?
What is the exposure of the Italian public to scary GMO images, and, more generally, what are the factors that influence the degree of scariness of images? The reason underlying the last question relates to the identification of the dynamics that govern the intention to use fear-inducing pictures in GMO web communication.
3. Data and empirical strategy
To answer the abovementioned research questions, the study has been structured into different phases: data collection and construction of the Scary Impact (SI) Index, source analysis and finally identification of the factors affecting the scariness of images.
The Google advanced search service was used to filter images for the country of origin (Italy). The search was performed anonymously to simulate the web experience of an average Italian citizen, using the Italian acronym for GMOs as the keyword. A total of 517 images were collected together with the URL link of the website in which they appeared.
The SI index
Visual communication (e.g. media images) cannot be analysed in the same way as written communication, for example, through the textual analysis of newspapers articles. Therefore, we developed an original categorisation of images, codifying all the potential elements that could convey a negative message about GMOs. The purpose is to simulate the experience of a lay person who seeks information on GMOs through a Google search: what does he or she find? Trying to interpret the concept of ‘unnatural’ to which Eurobarometer referred, our methodology aims at measuring the level of negativity of images associated with GMOs.
We identified the single elements composing the images collected through Google search, codifying the attributes that can provoke a sense of fear or more generally that can contribute to describing GMOs as unnatural:
Imaginary vegetable: a vegetable that does not exist in nature;
Imaginary animal: an animal that does not exist in nature;
Modification of size: the presence of a larger/disproportional vegetable or animal;
Modification of colour: that is, blue oranges;
Modification of shape: that is, square cherry;
Syringe: the presence of a syringe, frequently filled with coloured liquids;
War: any reference to war, that is, weapons;
Hazard/Death: any reference to a hazard (warning signs, skulls);
DNA: the presence of a DNA double helix;
Drug: medicines, pills;
Activism: images of activists, demonstrations;
Monster: a monstrous creature (Frankenstein food).
The presence of each attribute is marked as 1, but the same image could be characterised by more than one attribute: the SI Index is then calculated as the sum of the scores for each attribute, assuming that the more negative attributes that are displayed, the more the image is ‘scary’. Figure 1 shows some examples of the SI Index construction. 2 Image categorisation has been independently performed by two trained coders. Intercoder reliability was computed using Cohen’s Kappa (.816), and all disagreements were resolved through discussions between the two coders. The SI Index was then normalised to vary between 0 and 1 for analytical purposes. 3
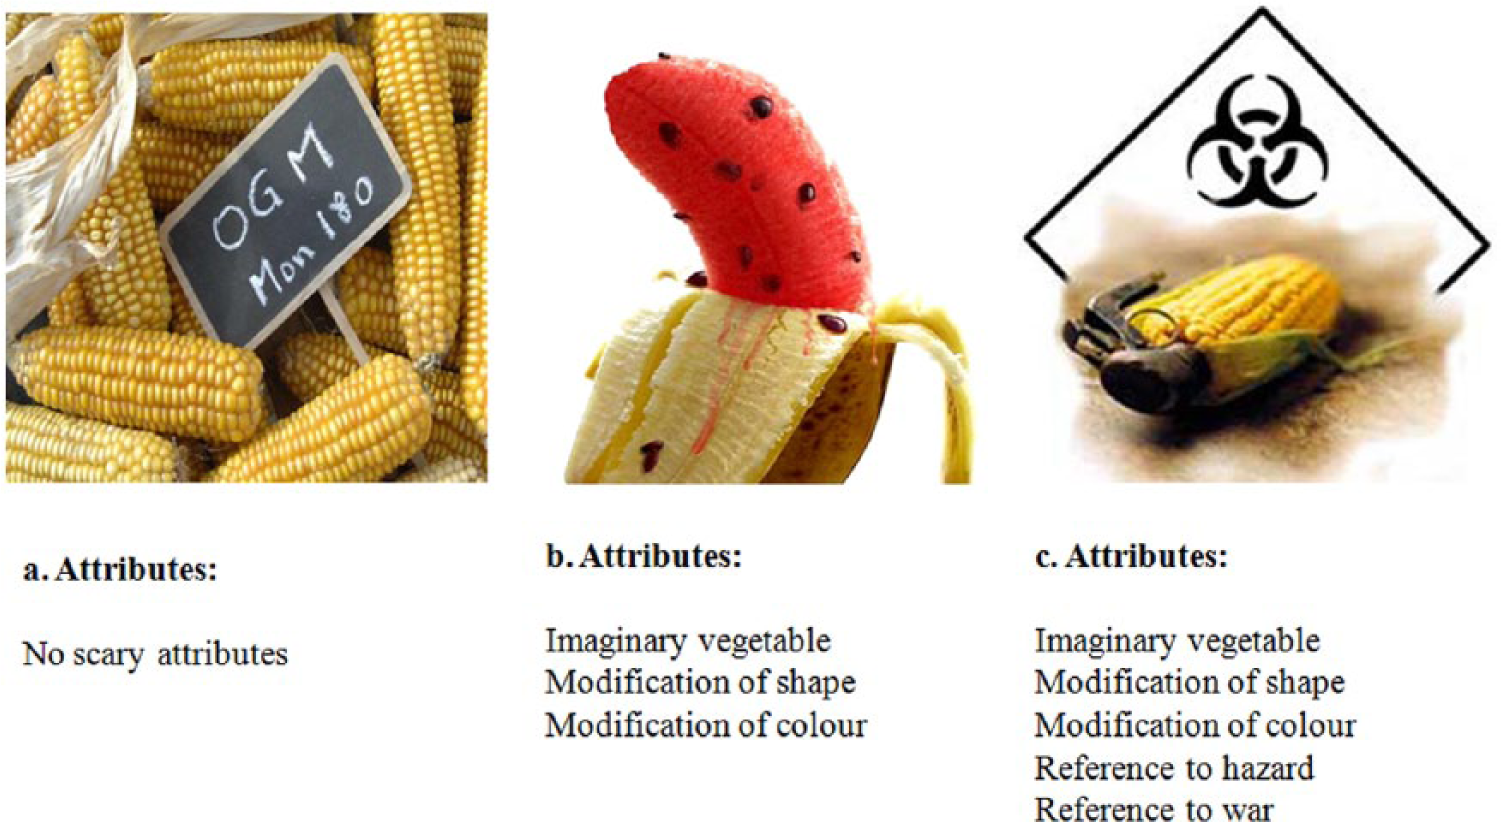
Examples of image categorisation.
Source analysis
For the ‘Source analysis’ section, dummy variables that classify the websites in which images appeared were created to discover the main players involved in producing information about GMOs. Variables included Newspapers; Blogs; Political, Institutional or Scientific websites; and Educational websites. A further variable called Conspiracy was also added because during the classification process, numerous websites dealing with this type of scenario were frequently accessed (i.e. power of multinationals, secrets, unidentified flying objects, chemtrails). Furthermore, additional dummy variables that identified websites focusing on the Agri-food sector or the Environmental/organic sphere were also created. Each web page can be classified into more than one category, to take account of the whole range of sources (i.e. scientific blog, agri-food newspaper). Statistical elaboration is based on the analysis of association among variables. As a measure of the strength of association, or dependency, between the types of sources and global viewpoint of the text (pro-GM, Neutral, No-GM), we adopted a traditional and widely used descriptive index: Cramer’s V, ranging from 0 (no dependence) to 1 (perfect dependence). Intermediate results make it possible to interpret the association in percentage terms.
Regression analysis
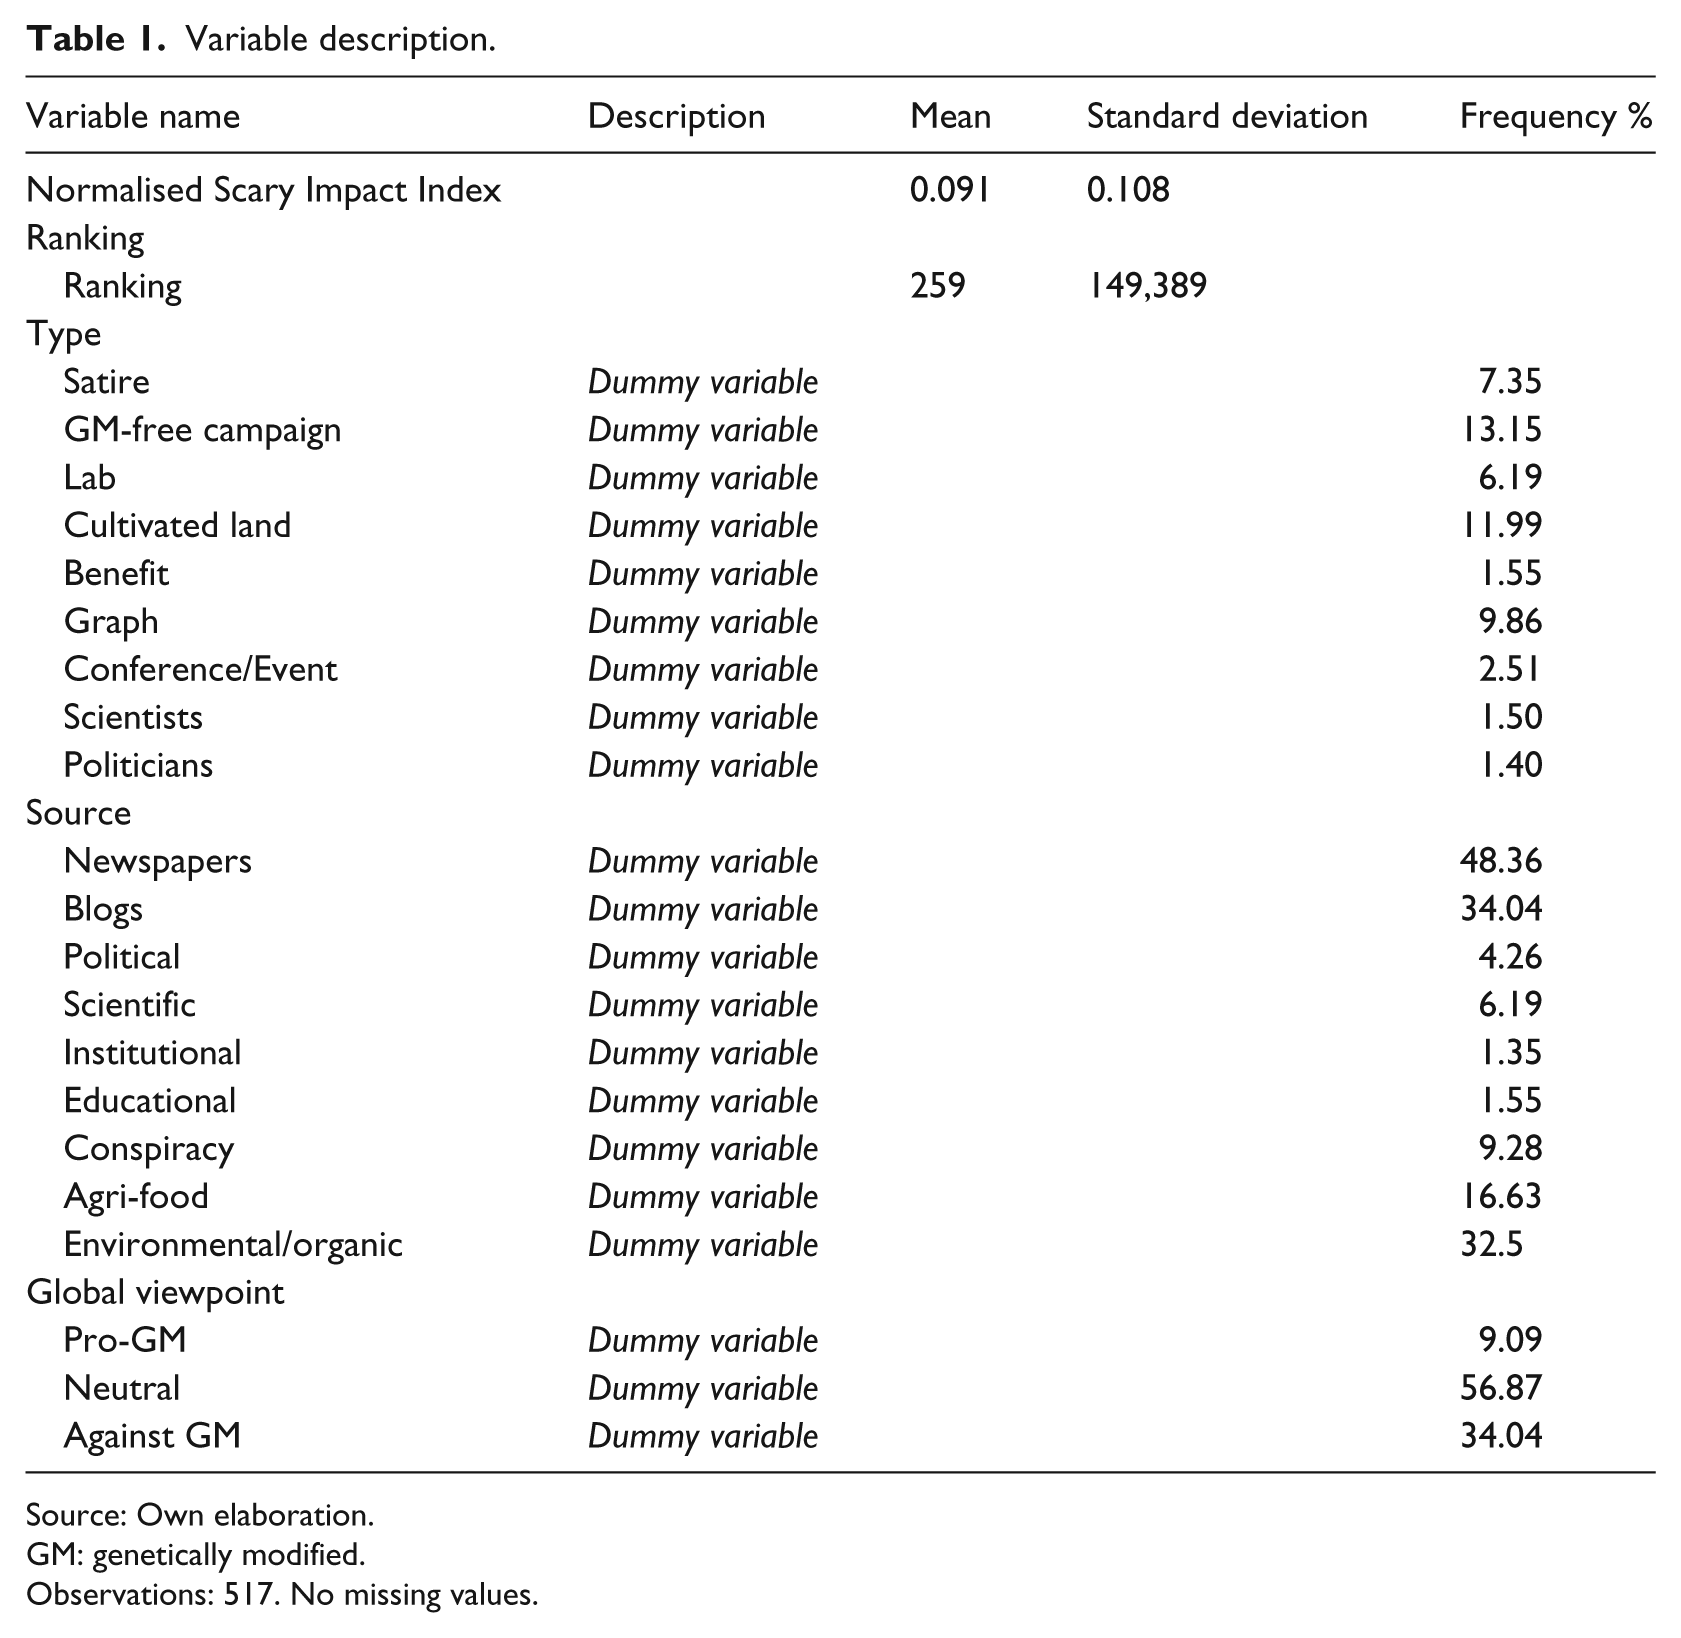
The final phase of the present work is identifying the possible factors that could affect the degree of scariness of GMO-related images (SI Index). Identification of variables (Table 1) was performed with the purpose of defining the main features of images in terms of the following.
Variable description.
Source: Own elaboration.
GM: genetically modified.
Observations: 517. No missing values.
Ranking
Each image was classified through a serial rank number according to its position in the Google result pages and then aggregated into groups of 50 units for analytical purpose. The variable Ranking is important to determine whether the level of scariness of the images follows a consistent pattern of distribution throughout the dataset, bearing in mind that the first results are generally the most viewed by the Google users. The reasons why an image occupies the first positions of the ranking are beyond the scope of this article; nevertheless, the variable Ranking gives some information about the level of public exposure to scary images referring to GMOs.
Type of image
A set of dummy variables that further describe the images was used: Satire is used for an image that is a satirical cartoon, GM-free campaign is used if a logo that promotes the ban of GMOs is present, Cultivated land is used for images that represent agricultural landscapes, Lab is used for representations of a laboratory, Benefit is used for images that show any positive effect of GM plants (i.e. Papaya damaged by Ringspot virus vs virus-resistant Papaya) and Scientist and Politicians are used to account for the presence of pictures of people who belong to the scientific and political spheres, respectively. Finally, two dummy variables are identified: Graphs (i.e. tables on the diffusion of GM crops) and Conference/Event flyers.
Global viewpoint
Three dummy variables that describe the overall orientation of the text (verbal communication) that appears in combination with each image were included – pro-GM, neutral or against GM text – with the aim of verifying the accordance/discrepancy between written and visual communication within the same web page: online images concerning GMOs are often presented in a web page that also includes a written text that is supposed to be consistent with the image itself: the more favourable the text, the less scary the image.
All the variables referring to Ranking, Type of images, Global viewpoint and Sources represent the independent variables of a multivariate ordinary least-squares (OLS) regression with the normalised SI index as the dependent variable. The analysis was performed through the Stata® software package.
4. Results and discussion
How are GMOs depicted in the Italian web? Descriptive analysis of the SI Index
As outlined in Table 2, the 517 images collected from Google had a level of scariness that ranged from 0 (no scary attributes) to a maximum degree of 0.42 (5 = scary attributes). Notably, 43.7% of the resulting images had SI Index 0, that is, they did not convey any negative attributes towards GMO. These images are often neutral pictures that could be classified as having a didactic or descriptive function as they could complete the written text, in many cases suggesting which content the web page itself is dealing with, for example, agricultural.
Distribution of the SI Index.

Nevertheless, more than half of the GMO images (56.3%) were described by an index > 0, which suggests that there is a tendency of negative attributes to slightly outmatch positive or more neutral information. However, the frequency of the images with a higher index value is lower than those with a lower index value; the ratio of the most frightful images (SI Index = 0.42) to those with a score equal to 0.08 is 7.75%.
The attribute that appeared with the highest frequency is ‘Imaginary Vegetable’ (113 images), mainly associated with ‘Modification of Shape’ (110 images): GMOs are depicted as something unreal (a square cherry) or unnatural, like the combination of two different fruits (orange outside, kiwi inside). This aspect could partially explain the results of the 2010 Eurobarometer on biotechnology: the perception of GMOs as unnatural is predominant among Europeans. In addition, GMOs are endowed with elements of fear; ‘Hazard/Death’ is the third attribute in terms of frequency (79 images). In contrast, the variable Benefit revealed that just 8 of 517 images showed the potential benefits of GM plant varieties.
Who are the actors involved in visual GMOs communication? Source analysis
Table 3 shows that the major sources of images related to GMOs are newspapers. Almost half of the results were retrieved from traditional journalistic channels, mostly newspapers that also offered an online version of their printed contents.
Descriptive analysis of sources.

Source: Own calculation on Google’s data.
GM: genetically modified.
The second most common type of source for GMO information was blogs (176 results). This channel includes a type of ‘tailor-made’ information that is mainly managed by a single person or small groups of people, in the absence of a structured editorial staff. The attitude towards GMOs depicted in these two principal sources of images – newspapers and blogs – presented some remarkable differences. Despite the fact that a clear ‘No-GM’ position is normally presented in the newspapers against poor ‘Pro-GM’ arguments, 45.2% of the articles still convey neutral information, with particular regard to news reporting about the European Commission activity on GM foods. On the contrary, the information retrieved from blogs presented an evident orientation towards opposition to GMOs (75%), following a pattern that is very similar to the ‘political’ category.
As expected, websites that provide scientific information (43.8%) have the most favourable position, whereas the most negative images were found in the web pages of conspiracy theorists. More generally, the total distribution of the GMO viewpoints showed a slight prevalence of ‘No-GM’ web pages (57%), in line with the results shown in Table 1.
What are the factors that influence the degree of scariness of images? Regression output
The whole set of variables that refer to Ranking, Type of images, Global viewpoint and Sources have been used as explanatory variables to explain higher levels of the Normalised SI Index using multivariate OLS regression, with the exclusion of Benefit, Scientist and Politician, due to their low frequency (⩽1.5%).
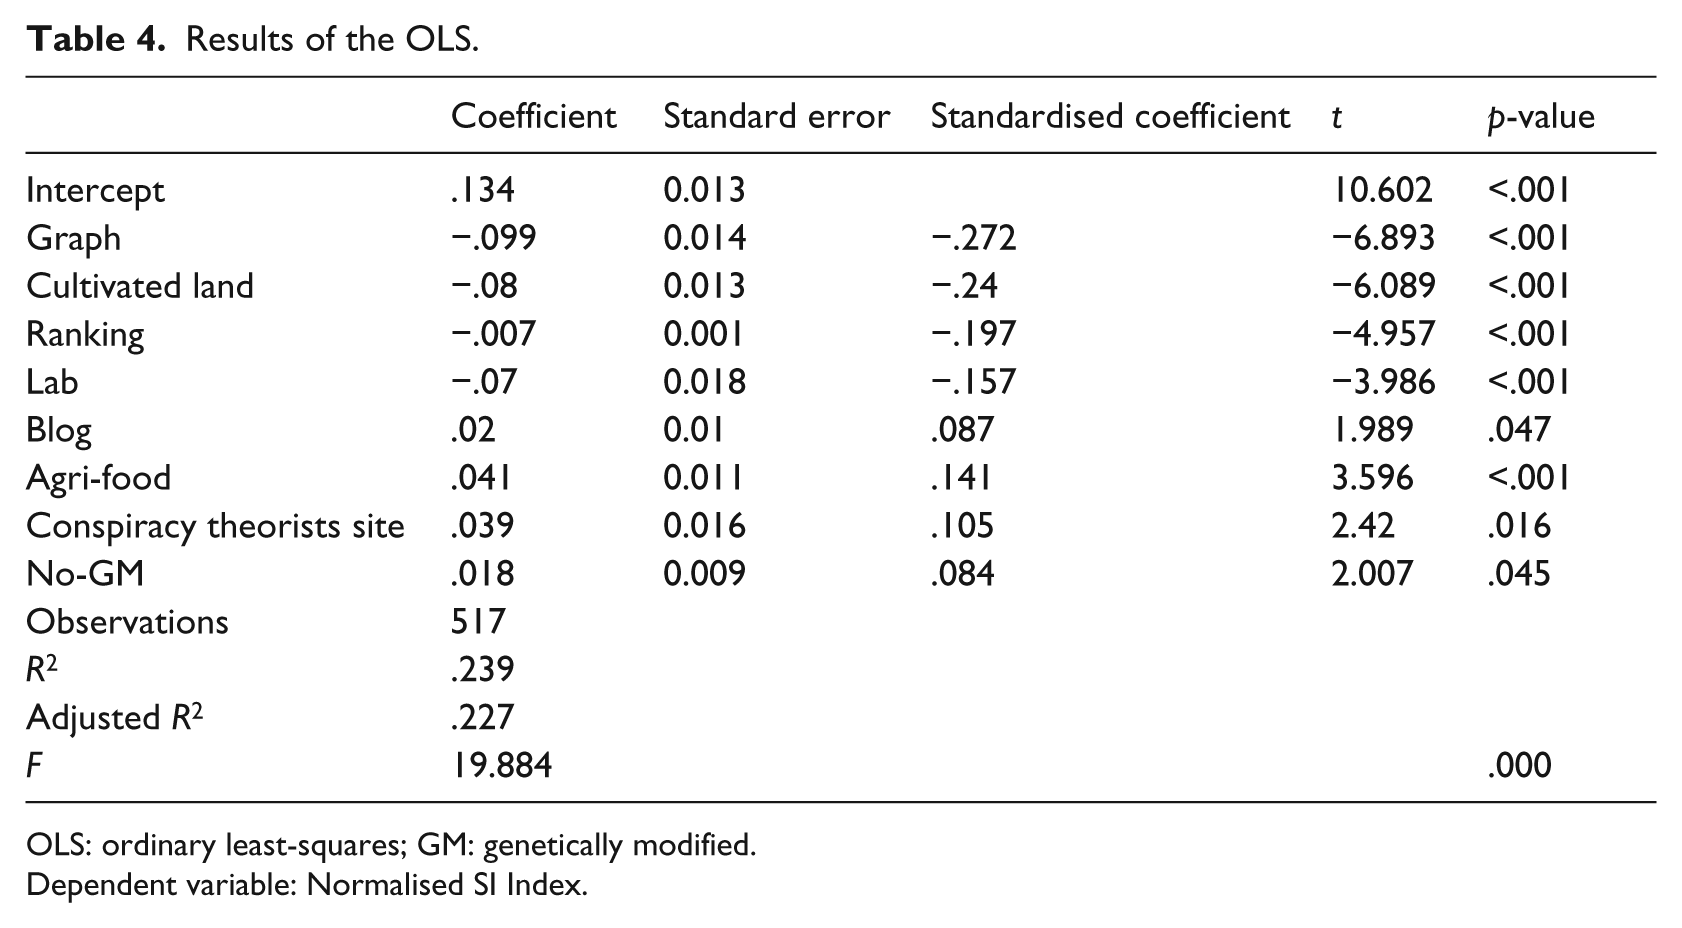
The regression output highlighted no significant results for these variables: Satire (p = .088), GM-free Campaign (p = .951), Conference/Event (p = .097), Newspapers (p = .774), Political site (p = .795), Scientific site (p = .455), Institutional site (p = .384), Educational site (p = .606), Environmental/organic (p = .319) and Pro-GM (p = .525). This means that these variables do not have a significant relationship with the dependent variable or with the Normalised SI Index. A further multiple regression with ‘forward’ selection was performed with the remaining variables, and the final model, which consists only of significant relationships, is presented in Table 4.
Results of the OLS.
OLS: ordinary least-squares; GM: genetically modified.
Dependent variable: Normalised SI Index.
The R2 and test F values confirmed the global goodness of fit of the model, which explains 24% of the variability of the dependent variable. The analysis of the standardised coefficients revealed that the variables Graph, Cultivated Land, Ranking and Lab had a decreasing negative impact on the SI Index, whereas the variables Agri-food, Conspiracy theorist, Blogs and No-GM presented a decreasing positive effect. We stress that a standardised coefficient is a measure of how strongly each predictor variable influences the dependent variable, and it is measured in units of standard deviation. For example, a value of 0.084 for No-GM indicates that a change of 1 standard deviation in this predictor variable will result in a change of 0.084 standard deviations in the Scary Index. Thus, the higher the standardised coefficient, the greater the impact of the predictor variable on the dependent variable.
We can formalise the model with the following equation
where Y represents the Normalised SI Index, X1 is Lab, X2 is Conspiracy, X3 is Graph, X4 is Cultivated Land, X5 is Agri-food, X6 is Blogs, X7 is No-GM and X8 is Ranking. We remember that every coefficient measures the effect of the corresponding independent variable on Y controlling for all of the other independent variables. For example, −0.07 is the effect of the variable Lab on the Normalised SI Index, when Graph, Cultivated Land, Ranking, Agri-food, Conspiracy theorist site and Blogs are all equal to 0.
Among these relationships, it is interesting to note that the ranking significantly affects the SI Index (Table 4); the sign of the relationship suggests that as Ranking grows, the SI Index tends to decrease. In other words, the images ranked on the top of the Google search results also contain the scariest attributes. Although explanation of the algorithms that define the order of appearance of the results in the web search engine is beyond the scope of the present work, it is possible to explain the relationship Ranking/SI Index in terms of exposure of the audience to GMO-related scary images. During a web consultation, the highest visibility is reserved for the first pages of results, which means that the bottom results are often not or only marginally accessed. It follows that the majority of web users have access to a set of images that preferably convey negative messages concerning GMOs over positive or neutral information. Therefore, it could also be suggested that the exposure of Italian web users to images with more negative attributes could be a contributing factor in shaping the negative perception of GMOs in the country.
Considering the variables that describe the types of images, it was also evident that the contribution of GM-free campaign is not significant. The three variables referring to Cultivated Land, Laboratory and Graph negatively affected the SI Index because they convey almost neutral information about GMOs. Among them, the variable that showed the strongest negative relationship with the Index is Graph, thereby confirming the prominent role of this communication tool in reducing negative messages about GMOs.
With regard to the image sources, the main highlight is that none of the variables Newspapers, Political, Scientific, Institution and Educational site had a significant relationship with the SI Index. Whereas this result could be explained in relation to the great heterogeneity of the involved players for the category Newspapers, the absence of significance for institutional and scientific sources suggests a lack of ability in presenting positive or at least objective visual content to the public. In contrast, the only source showing a significant relationship with the SI Index is Blog (0.02), but the most surprising result concerns the variables Agri-food and Conspiracy theorists, which paradoxically present very similar behaviour. Their relationship with the SI Index was significant and positive (0.041 and 0.039 for Agri-Food and Conspiracy Theorists, respectively). Thus, both of these source categories tend to enhance the SI of the presented images. The fact that agri-food specialised websites seem to use a kind of communication similar to conspiracy theorists raises serious concerns about the ability and competence of the Italian agri-food sector to manage GM technology.
Finally, the regression output illustrated that the influence of the variables concerning global viewpoint was not uniform. The overall attitude of the web page in which the image was sourced positively affected the SI Index only in the case of the No-GM global viewpoint (0.018), showing agreement between image and text. Online articles that propose a negative opinion about GMOs are often associated with a scary image.
5. Concluding remarks
This work offers an investigation of web communication in terms of the use of images related to GM technology in Italy and their potential role in influencing public opinion about GMOs.
The majority (58%) of the collected images contained at least one element of fear and were included in web pages that mostly conveyed a negative message towards GMOs (57% of cases). The negative information about GMOs is only marginally balanced with information promoting this technology: just a tiny fraction of images showed the potential benefits of GM plant varieties, supporting Gaskell et al. (2004): the sceptical position of consumers could derive from the absence of perceived benefits. In line with the results of the 2010 Eurobarometer on biotechnology, unnaturalness is a key theme that emerged from the picture analysis. This aspect is exacerbated by the fact that the majority of images look like pictures: a GM square cherry does not exist, but through photographic software it becomes real.
In summary, this work empirically confirms the media bias in GMO information in Italy: GMO-related images are endowed with elements of fear that could contribute to shaping a negative public perception.
With regard to sources, the role of environmental activists appeared weakest in comparison with studies about climate change images, as the presence of the No-GM logo is not significantly associated with the level of scariness of the images. Similarly, this analysis does not indicate a politicisation of the GMO communication, with pictures of politicians representing just a small fraction of the dataset. In contrast to climate change, GMO opposition in Italy is far more widespread and involves multiple players.
Public exposure to GMO-related scary images is confirmed by the results of the regression analysis, in accordance with Lewison (2007) who revealed a tendency for more scary articles to be on the front page for newspapers (print media). The reason why a given image occupies the first ranking positions, a question that mostly relates to Google’s algorithms, goes beyond the purpose of this work. The main objective was to explore ‘what’ a web user can find when seeking information about ‘GMO’ on Google: if the first position is occupied by the scariest images, as the results outline, we can guess that this level of exposure can be a contributing factor in shaping the negative Italian attitude towards GMOs.
Moreover, the communication of GM technology is dependent on the type of information source on the web: the Italian agri-food sector appeared strongly oriented towards a negative representation of GMOs. We can suppose that this could be partially due to interest in protecting the market of traditional/typical/local food products in Italy. Nevertheless, in line with McCluskey and Swinnen (2004), we suggest that the ‘Bad News Hypothesis’ could also be applied to agri-food stakeholders who tend to support consumers’ fears concerning GMOs, driven by the need for profits.
The last point of interest is visual/verbal congruency in GMO online communication: only the No-GM global viewpoint of the text showed a positive relationship with the SI index, indicating the expected accordance between visual and verbal communication. This aspect potentially highlights an underestimation of the power of images as a communication tool: online articles that aim to convey neutral/positive messages about GMOs are often combined with a visual communication endowed with attributes of fear, showing some discrepancy between text and images.
Thus, the major recommendation that arises from the analysis is the need for a more conscious selection of images by those sources that want to provide balanced, risk/benefit-based information about GMOs.
In general, the use of a coding scheme able to classify the impact of images has been shown to be effective and, as a future prospect, capable of implementation in different fields of research where real or perceived risks are involved. For food-related issues, examples could include raising concerns about the use of palm oil or the debate on the Transatlantic Trade and Investment Partnership (TTIP) and its potential consequences on the European market.
Footnotes
Acknowledgements
Draft versions of the paper have been presented at the 9th International European Forum on System Dynamics and Innovation in Food Networks, Innsbruck-Igls (Austria), 9–13 February 2015, and at the International Conference of Agricultural Economists (ICAE), Milan (Italy), 9–14 August 2015. The authors thank the anonymous reviewers for their comments.
Declaration of Conflicting Interests
The author(s) declared no potential conflicts of interest with respect to the research, authorship, and/or publication of this article.
Funding
The author(s) received no financial support for the research, authorship and/or publication of this article.